Article

The Use of Machine Learning to Assess the Impact of the Ozonation Process on Selected Mechanical Properties of Japanese Quince Fruits

by
Józef Gorzelany
1,
Piotr Kuźniar
1,
Miłosz Zardzewiały
1,
Katarzyna Pentoś
2,*,
Tadeusz Murawski
3,
Wiesław Wojciechowski
4 and
Jarosław Kurek
5
1
Department of Food and Agriculture Production Engineering, University of Rzeszow, 4 Zelwerowicza Street, 35-601 Rzeszów, Poland
2
Institute of Agricultural Engineering, Wroclaw University of Environmental and Life Sciences, 37b Chelmonskiego Street, 51-630 Wroclaw, Poland
3
Monika Murawska Farm, Nowa Prawda 10, 21-450 Stoczek Łukowski, Poland
4
Institute of Agroecology and Plant Production, Wroclaw University of Environmental and Life Sciences, Grunwaldzki Sq. 24A, 50-363 Wroclaw, Poland
5
Department of Artificial Intelligence, Institute of Information Technology, Warsaw University of Life Sciences, 02-776 Warsaw, Poland
*
Author to whom correspondence should be addressed.
Agriculture 2024, 14(11), 1995; https://doi.org/10.3390/agriculture14111995
Submission received: 11 October 2024 / Revised: 2 November 2024 / Accepted: 5 November 2024 / Published: 6 November 2024
(This article belongs to the Section Agricultural Product Quality and Safety)

Abstract

:
In this study, selected mechanical properties of fruits of six varieties of Japanese quince (Chaenomeles japonica) were investigated. The influence of their storage time and the applied ozone at a concentration of 10 ppm for 15 and 30 min on water content, skin and flesh puncture force, deformation to puncture and puncture energy was determined. After 60 days of storage, the fruits of the tested varieties showed a decrease in the average water content from 97.94% to 94.39%. No influence of the ozonation process on the change in water content in the fruits was noted. The tests showed a significant influence of ozonation and storage time on the increase in the punch puncture force of the skin and flesh, deformation and puncture energy of the fruits. In order to establish the relationship between storage conditions for various varieties and selected mechanical parameters, a novel machine learning method was employed. The best model accuracy was achieved for energy, with a MAPE of 10% and a coefficient of correlation (R) of 0.92 for the test data set. The best metamodels for force and deformation produced slightly higher MAPE (12% and 17%, respectively) and R of 0.72 and 0.88.

1. Introduction

Japanese quince (Chaenorneles japonica) is a spreading, thorny shrub from the rose family (Roseacae) and the apple subfamily (Pornoideae) [1,2,3]. It appeared in Europe in the mid-18th century, initially as an ornamental plant with culinary properties [4]. Quince is often cultivated on organic farms due to its low cultivation requirements and high resistance to diseases and pests [5]. The fruits of the Japanese quince are characterized by high nutritional value due to the content of chemical compounds with nutritional and bioactive properties, including ascorbic acid, pectins, triterpenes and epicatechin. In addition, the fruits of the Japanese quince are characterized by low acidity acceptable to consumers and a high content of polyphenolic compounds, and the seeds obtained from them are a source of unsaturated fatty acids and sterols [6,7,8].
Knowledge of the physical, physiological and mechanical properties of fruits is important for later handling during harvesting. Mechanical damage such as bruising, crushing or abrasion often occurs during harvesting, fruit processing or transport. This can lead to the elimination of a batch of raw material from the market [9]. The mechanical strength of fruits is the result of a combination of factors related to their structure, morphological composition, stage of maturity and varietal differences. Mechanical strength is not constant over time, because it depends primarily on the speed of metabolic processes occurring in the fruits. A characteristic feature of fresh fruits is that after harvesting, ripening processes continue to occur in them [10].
Mechanical harvesting of fruit significantly facilitates the work of orchardists. It reduces the costs of their work, increases the speed of combine harvesting, but at the same time causes damage that deepens during transport and processing [11]. The process of preparing fruit for processing, such as cleaning or rinsing, also adversely affects the quality of the raw material, including an increased decrease in water content, changes in the texture and firmness of the fruit [12]. Long-term storage of fruit in cold stores also negatively affects their quality [13,14]. In order to reduce losses during harvesting, transport and storage of horticultural raw materials, many authors carry out research on their mechanical properties, among others: highbush blueberries, red currants and tomatoes, onions, Brussels sprouts [15,16], cranberry [17] as well as quince fruits [18].
Abiotic and biotic factors, such as lighting, temperature distribution, cultivation site and soil salinity, influence the final chemical composition of the fruit [19]. Ozone and ozonation of fruit is a modern method of fruit preservation that affects the content of compounds in the raw material subjected to ozonation, including the ability to oxidize enzymes, proteins and nucleic acids [20,21,22]. The action of ozone extends the storage life of fresh celery, improving its sensory quality compared to the control sample [23], as well as many fruits and vegetables, including rhubarb [24], kiwi [20], mushrooms [25], fennel [26] and herbs [27], and also has a disinfecting effect by reducing the number of yeasts and molds, the number of mesophilic aerobic bacteria and the number of mesophilic lactic acid bacteria in the ozonated product [25,28,29]. The results of the mechanical properties of raw materials have important applications in the development of computer simulation models for studying the rheological properties of fruits and for designing packaging and transportation systems to minimize their losses [30].
Machine learning (ML) is a powerful tool for deriving new knowledge from data. Consequently, it has been increasingly employed in food processing in recent years. ML methods facilitate the generation of accurate predictive and classification models, which are useful in the food industry. In recent years, there has been a growing number of applications of ML in studies related to the mechanical properties of food, including fruit and vegetables. The simple artificial neural network (ANN) was designed by Pan et al. [31] for the purpose of predicting apple hardness based on the results of a mechanical properties index test, with the resulting relative error below 1%. The same technique was employed by Saeidirad et al. to model the relationship between relaxation time and stress relaxation of pomegranate fruit [32]. The support vector machine (SVM) has been identified as a valuable tool for the precise estimation of the mechanical characteristics of apples following impact damage, based on hyperspectral data [33]. The SVM algorithm has been shown to generate an accurate model for the prediction of kiwifruit firmness in diverse storage conditions [34]. Furthermore, the mechanical attributes can be predicted based on image information [35].
The aim of this study was to determine the effect of gaseous ozone on the water content and mechanical properties of six Japanese quince varieties during their refrigerated storage and to indicate the optimal machine learning method for modeling the relationship between the ozonation process parameters and mechanical characteristics.

2. Materials and Methods

2.1. Plant Materials

Fresh fruits of Japanese quince (Chaenomeles japonica) of six varieties, ‘Darius’, ‘Gold Calif’, ‘Maksym’, ‘North Lemon’, ‘Rasa’ and ‘Tamara’, were collected by hand in the first decade of September 2023 on the farm of Mrs. Monika Murawska located in Stoczek Łukowski (51°57′48″ N 21°58′06″ E, Lublin Voivodeship, Poland). Non-ozonated and ozonated Japanese quince fruits were used for storage tests (water content and mechanical properties) and stored under refrigerated conditions (temperature 4 °C) for 60 days.

2.2. Ozonation Process

Japanese quince fruits were randomly divided into three batches of 2000 g each. The first batch was left without ozonation (control sample). The remaining two batches were subjected to ozonation with gaseous ozone in a plastic container with dimensions L × W × H—0.6 × 0.4 × 0.4 m for 15 min (flow rate 4 m3·h−1, temperature 20 °C) and for 30 min (flow rate 4 m3·h−1, temperature 20 °C). The ozone concentration was 10 ppm. The A40 standard ozone generator (Korona Scientific and Implementation Laboratory, Piotrków Trybunalski, Poland) was used to generate ozone. The ozone concentration was monitored with a gas detector WASP-XM-E-O3 (Omega Measuring Instrument CO., LTD., Nonthaburi, Thailand). The process was conducted in triplicate. Each time, ozonation was performed 24 h prior to the collection of fruit samples for analysis.
Prior to the commencement of the research project, an experimental determination of the fruit tolerance threshold for ozonation was conducted. This involved the exposure of fruits of the same varieties from other batches to ozone at concentrations of 1, 5, 10, 20 and 40 ppm for periods of 5, 10, 15, 20, 30 and 50 min, respectively. Based on the findings of preliminary tests, the ozone doses used in the experiment were selected.

2.3. Determination of Water Content

Water content in Japanese quince fruits after harvest (1 day of storage) and after 30 and 60 days of cold storage (randomly selected samples for testing) was determined by the drying method (105 °C) in accordance with PN-90/A-75101-03:1990 [36] by placing the fruits in a laboratory dryer (SLW 115 SMART, POL-EKO® A.Polok-Kowalska sp.k., Wodzisław Śląski, Poland) immediately after the measurements of mechanical properties. Measurement results are given in percentages (%). Each series of measurements was performed in triplicate.

2.4. Determination of Mechanical Properties of Japanese Quince Fruits

Japanese quince fruits were subjected to a strength test for puncture resistance with a φ = 4 mm diameter punch using a Zwick/Roell Z010 texturometer (Zwick Roell AG, Ulm, Germany). Measurements were performed on fresh raw material and raw material ozonated with selected doses on the 1st, 30th and 60th day of storage. Measurements of puncture resistance of the skin and flesh of whole fruits were performed in two places in the central part of the fruit (thickness and width) in 30 repetitions for each measurement series. Measurements of skin and flesh resistance to puncture resistance were performed with the following operating parameters: Fv = 0.1 N (preliminary power); V1 = 0.5 mm·s−1 (speed of traverse of the beam load cell during measurement). The value of the maximum puncture force of the skin and flesh F (N), the deformation to the moment of puncture λ (mm) and the puncture energy W (mJ) were recorded after each series of measurements.

2.5. Statistical Analysis

Statistica 13.3. (TIBCO Software Inc., Tulsa, OK, USA) was used to perform statistical analysis of the obtained results, including analysis of variance (ANOVA) and NIR significance test at the significance level of α = 0.05.

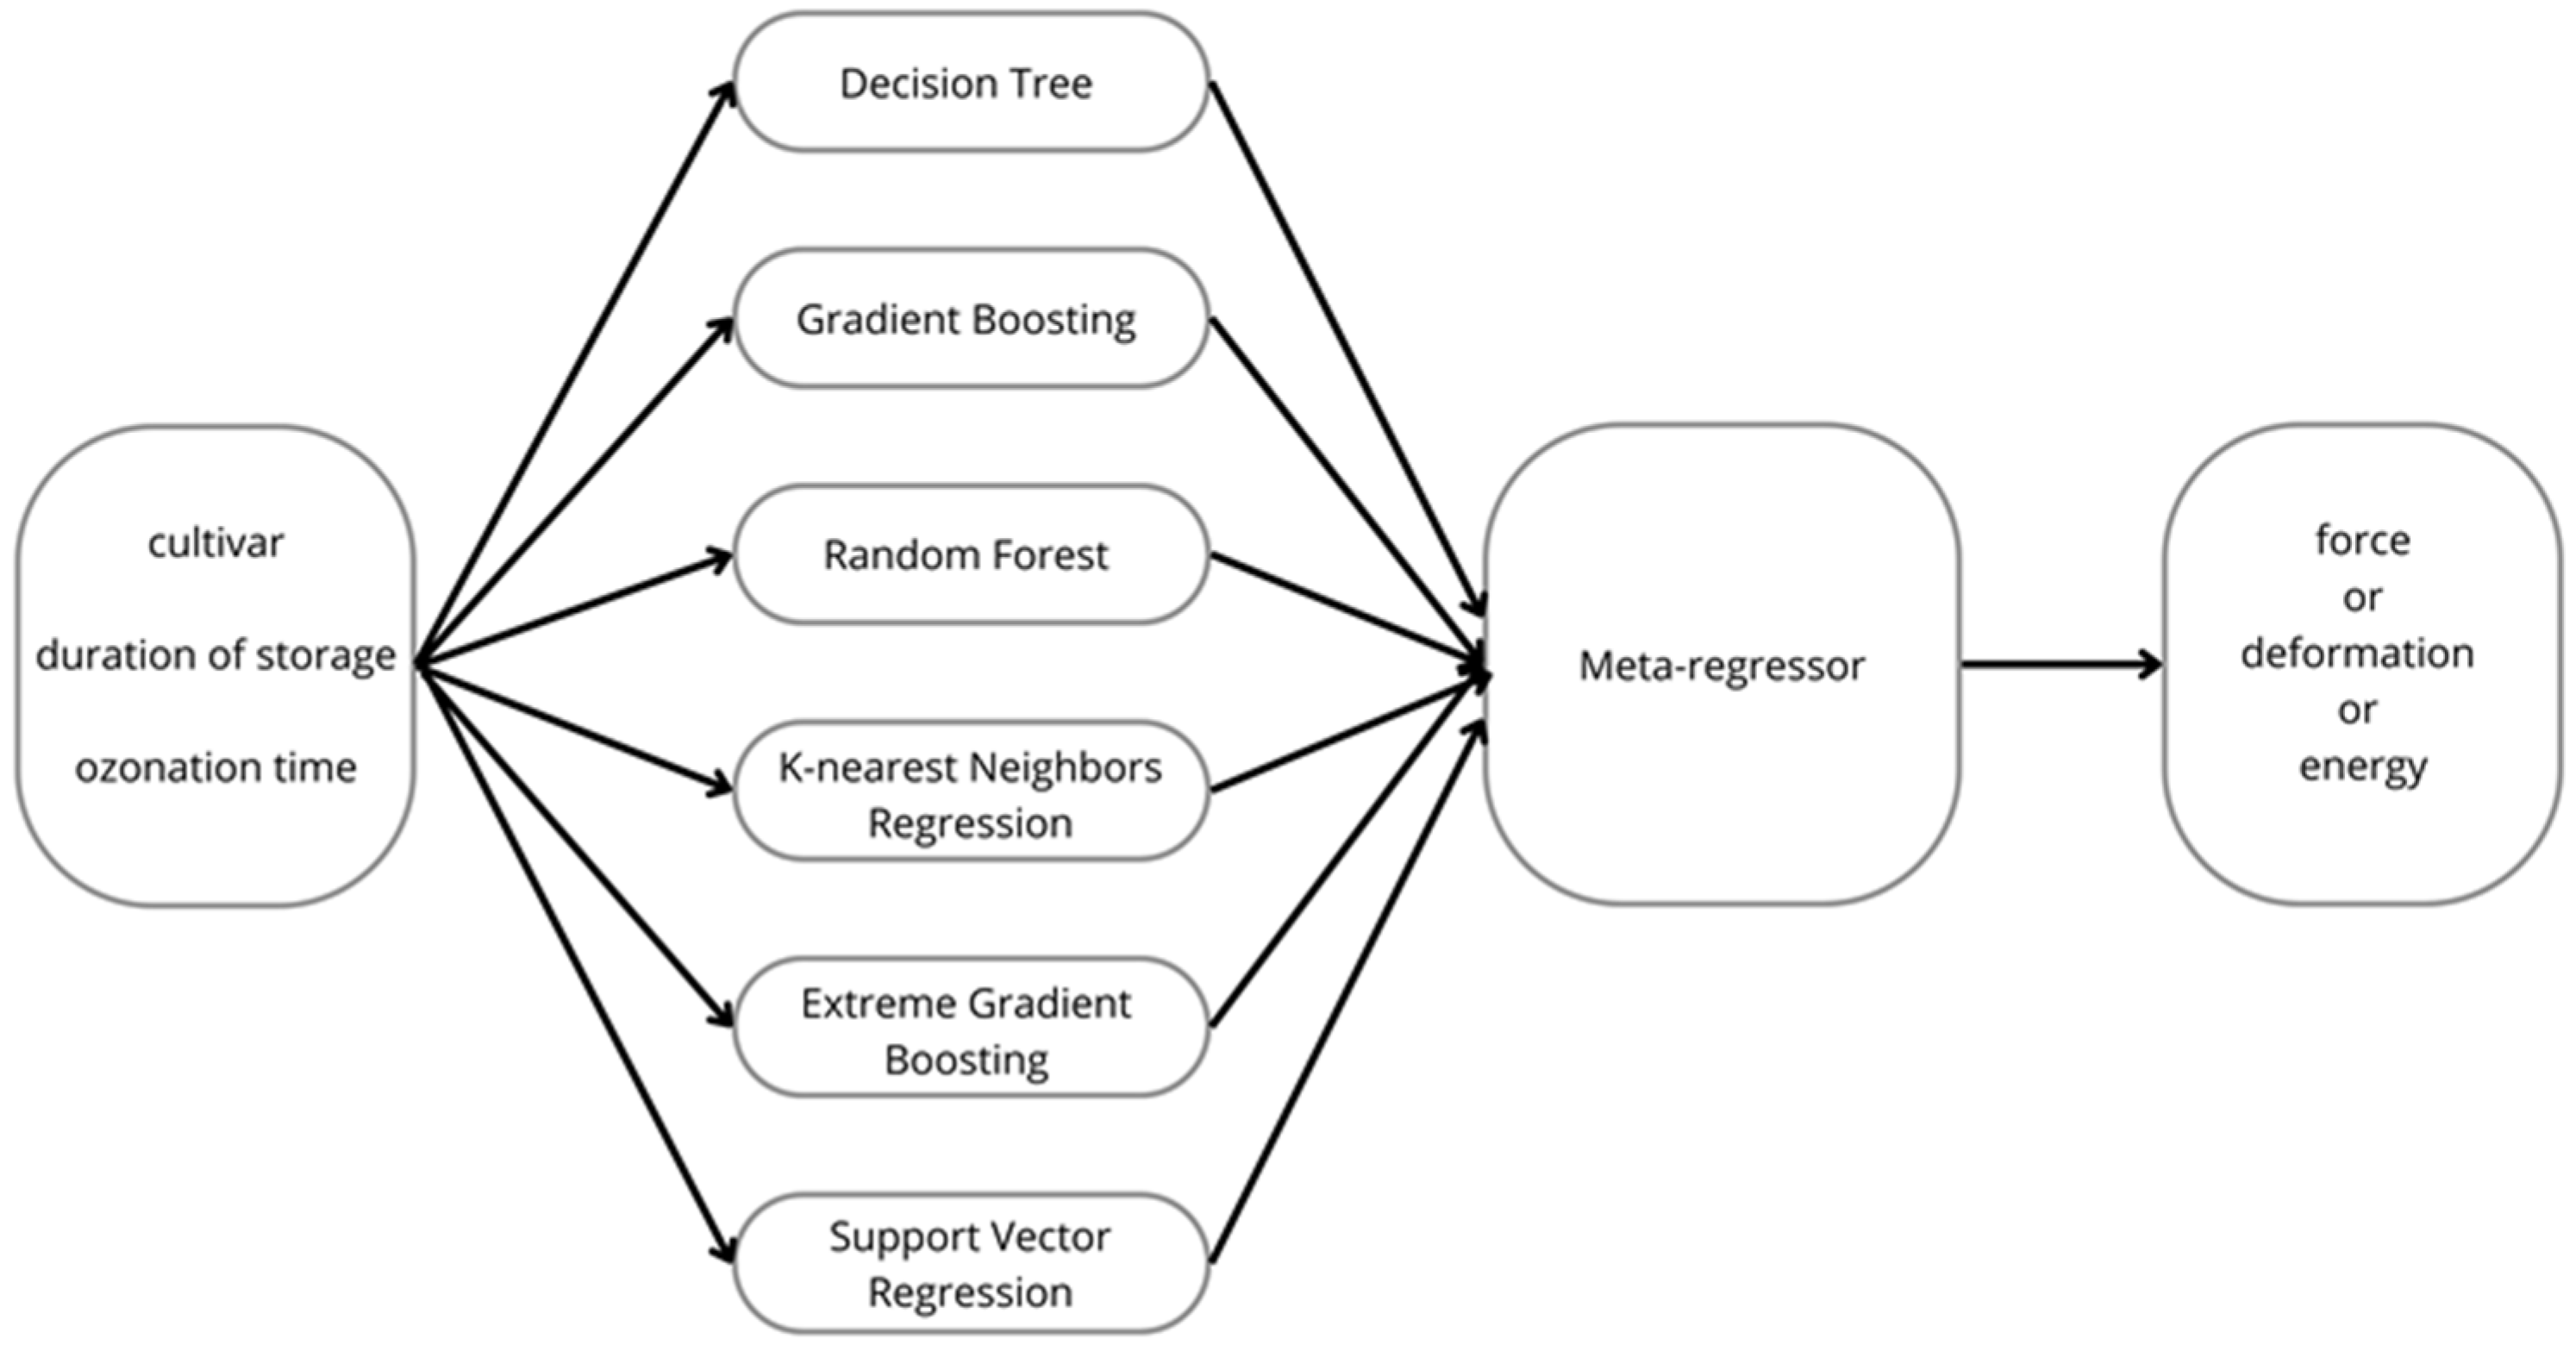
2.6. Machine Learning Models

A methodology based on machine learning was employed to develop predictive models for the three mechanical parameters of Japanese quince fruit. The concept of the metamodel is illustrated in Figure 1.
The metamodel is constructed in two phases. In the initial phase, predictive models are constructed to establish a relationship between the input parameters (variety, duration of storage and ozonation time) and the mechanical parameter (force, deformation or energy). In the second stage, a meta-regressor is trained that makes a prediction of the mechanical parameter based on the predictions of the models from the preceding stage. Six ML algorithms were employed in this study: decision tree (DT), gradient boosting (GM), random forest (RF), k nearest neighbors regression (KNNR), extreme gradient boosting (XGB), and support vector regression (SVR).
DT is a method in which the solution is represented by a tree structure. This structure begins with the root and is subsequently constructed from branches and nodes. At the root and at the nodes, attribute values are tested, and the branches represent the outcomes of these tests. DT is a supervised ML algorithm, and the tree structure is generated recursively based on sum of squares and regression analysis. RF is an ensemble model that combines several models, namely, decision trees. Trees are built by taking different subsets of the data. By averaging the data, the overall accuracy of the model is increased, and the model is less prone to overfitting. In the GB method, the ensemble model is built sequentially. Each new model minimizes the loss function of the previous model using a gradient descent algorithm. The loss function can be mean squared error or cross-entropy. The XGB method incorporates regularization elements into the GB algorithm’s objective function, which improves the generalizability of the generated models and prevents over-fitting. KNNR is a non-parametric supervised learning method. It makes predictions based on a similarity measure. The most popular distance functions are Euclidean, Manhattan and Minkowski distance. The k parameter is the number of neighbors (the nearest points to a query point). The output value of the KNNR model is calculated based on the average value of the k nearest neighbors. SVR is a type of support vector machine (SVM) algorithm. The goal of an SVM is to find the optimal hyperplane that best separates the two classes in the input data by maximizing the support vectors (distance between the hyperplane and the closest points belonging to each class). This concept is used in SVR, but the hyperplane is created to best fit the data that fall within the tube defined by the support vectors.
The training process was conducted within the Python 3.10 environment, utilizing the scikit-learn library. The experimental data set, comprising 406 vectors, was subjected to standardization and partitioning into a training and test set in a ratio of 80:20. The hyperparameters of each model were optimized using the grid search method.
The accuracy of models was evaluated based on the metrics described below.
The correlation coefficient (R) between the target and predicted values:
R = ( Y t Y ¯ t ) ( Y p Y ¯ p ) ( Y t Y ¯ t ) 2 Y p Y ¯ p 2
The root-mean-square error (RMSE):
R M S E = 1 n i = 1 n ( Y p Y t ) 2
The mean absolute percentage error (MAPE):
M A P E = 1 n i = 1 n Y t Y p Y t
The Nash–Sutcliffe coefficient (NSC):
N S C = 1 i = 1 n ( Y t Y p ) 2 i = 1 n ( Y t Y ¯ t ) 2
where Yt is the absolute target value, Y ¯ t   is the mean target value, Yp is the absolute predicted value, Y ¯ p   is the mean predicted value and n is the number of cases in a data set.

3. Results and Discussion

3.1. Water Content and Mechanical Properties of Japanese Quince Fruits

Cold storage of fruits intended for various branches of the food industry involves many undesirable effects, including weakening of their turgor due to water loss, and thus mechanical changes that have a negative impact on the technology of processing stored fruits. The fruits of the analyzed Japanese quince varieties differed in water content and mechanical properties and were modified by variety, storage time and ozonation time (Table 1 and Table 2). Table 2 presents the mean values for the individual parameters for each of the varieties under investigation. The row entitled ‘Time gaseous ozonation’ refers to the mean results for the control variants of all varieties and the mean results of variants ozonated with a dose of 10 ppm for 15 and 30 min. The row entitled ‘Duration of storage’ refers to the mean results for all variants (control and ozonated) at 1, 30 and 60 days of storage.
The water content in the analyzed Japanese quince fruits did not show significant differences depending on the variety and averaged 96.38%. Also, the extended exposure of the fruits to gaseous ozone did not significantly affect the moisture content of the raw material. However, the differentiating factor was the storage time; both after 30 and 60 days of storage, a significant decrease in water content was observed in the analyzed Japanese quince fruits compared to the control (Table 1 and Table 2).
The value of the force required to puncture Japanese quince fruits varied significantly depending on the variety, ozonation time and cold storage. The lowest puncture force value was recorded for the ‘Rasa’ variety, 9.38 N, while the highest was for the ‘Gold Calif’ variety, 14.09 N, which indicates that this variety had the highest resistance to mechanical damage. The action of gaseous ozone for both 15 and 30 min significantly increased the puncture force required for the analyzed Japanese quince fruits. After 30 days of cold storage of the analyzed fruits, it was shown that the puncture force was at the same level, while a significantly higher value was obtained after 60 days of cold storage and was higher by 13.02% compared to 1 day of storage and by 9.88% compared to 30 days of cold storage (Table 1 and Table 2).
The value of deformation during puncture of the skin and flesh of the analyzed common quince fruits varied for the variety, time of exposure to ozone and storage time. Japanese quince varieties ‘Tamara’, ‘Gold Calif’ and ‘Maksym’ were characterized by the lowest deformation value, while the ‘Rasa’ variety showed significantly the highest fruit resistance to deformation. The ozonation process, regardless of its duration, contributed to an increase in the resistance of the analyzed Japanese quince varieties to deformation. Also, the extension of cold storage time significantly increased fruit resistance to deformation by an average of 56.41% for 30 days and by 63.96% for 60 days compared to the control (Table 1 and Table 2).
The energy required to pierce the skin and flesh of Japanese quince fruit with a punch varied significantly depending on the varieties analyzed. The lowest energy value required for piercing was recorded for the ‘Rasa’ variety (15.07 mJ), while the significantly highest piercing energy value was found for the ‘North Lemon’ and ‘Gold Calif’ varieties, which indicates that these varieties had the highest resistance to mechanical damage. Conducting the ozonation process for 15 min significantly increased the energy required to pierce the skin and flesh of the fruit by an average of 6.41% compared to the control, while extending the exposure time to 30 min had no significant effect on the parameter discussed. Refrigerated storage of Japanese quince fruit for both 30 and 60 days resulted in a significant increase in the energy required to pierce the fruit of the analyzed varieties compared to the control (Table 1 and Table 2).
In the study of sea buckthorn fruit by Zapałowska et al. [37], it was shown that with the passage of storage time, the value of the destructive force and energy of these fruits decreases regardless of the time of exposure to ozone, but at the same time, the ozonation process applied at a dose of 10 ppm for 15 and 30 min increased the resistance of these fruits to mechanical damage compared to non-ozonated fruits. Ozonation had a positive effect on the mechanical properties of apple tissues [38] and red currant fruit [29], especially during their refrigerated storage. Moreover, in the case of ozonation of cranberry fruit, an increase in the resistance of the tested fruits to mechanical damage was observed; however, these results were not statistically significant [39]. In turn, ozonation of tomato fruits with a dose of 2 ppm for 3 min significantly increased their resistance to mechanical damage [40].

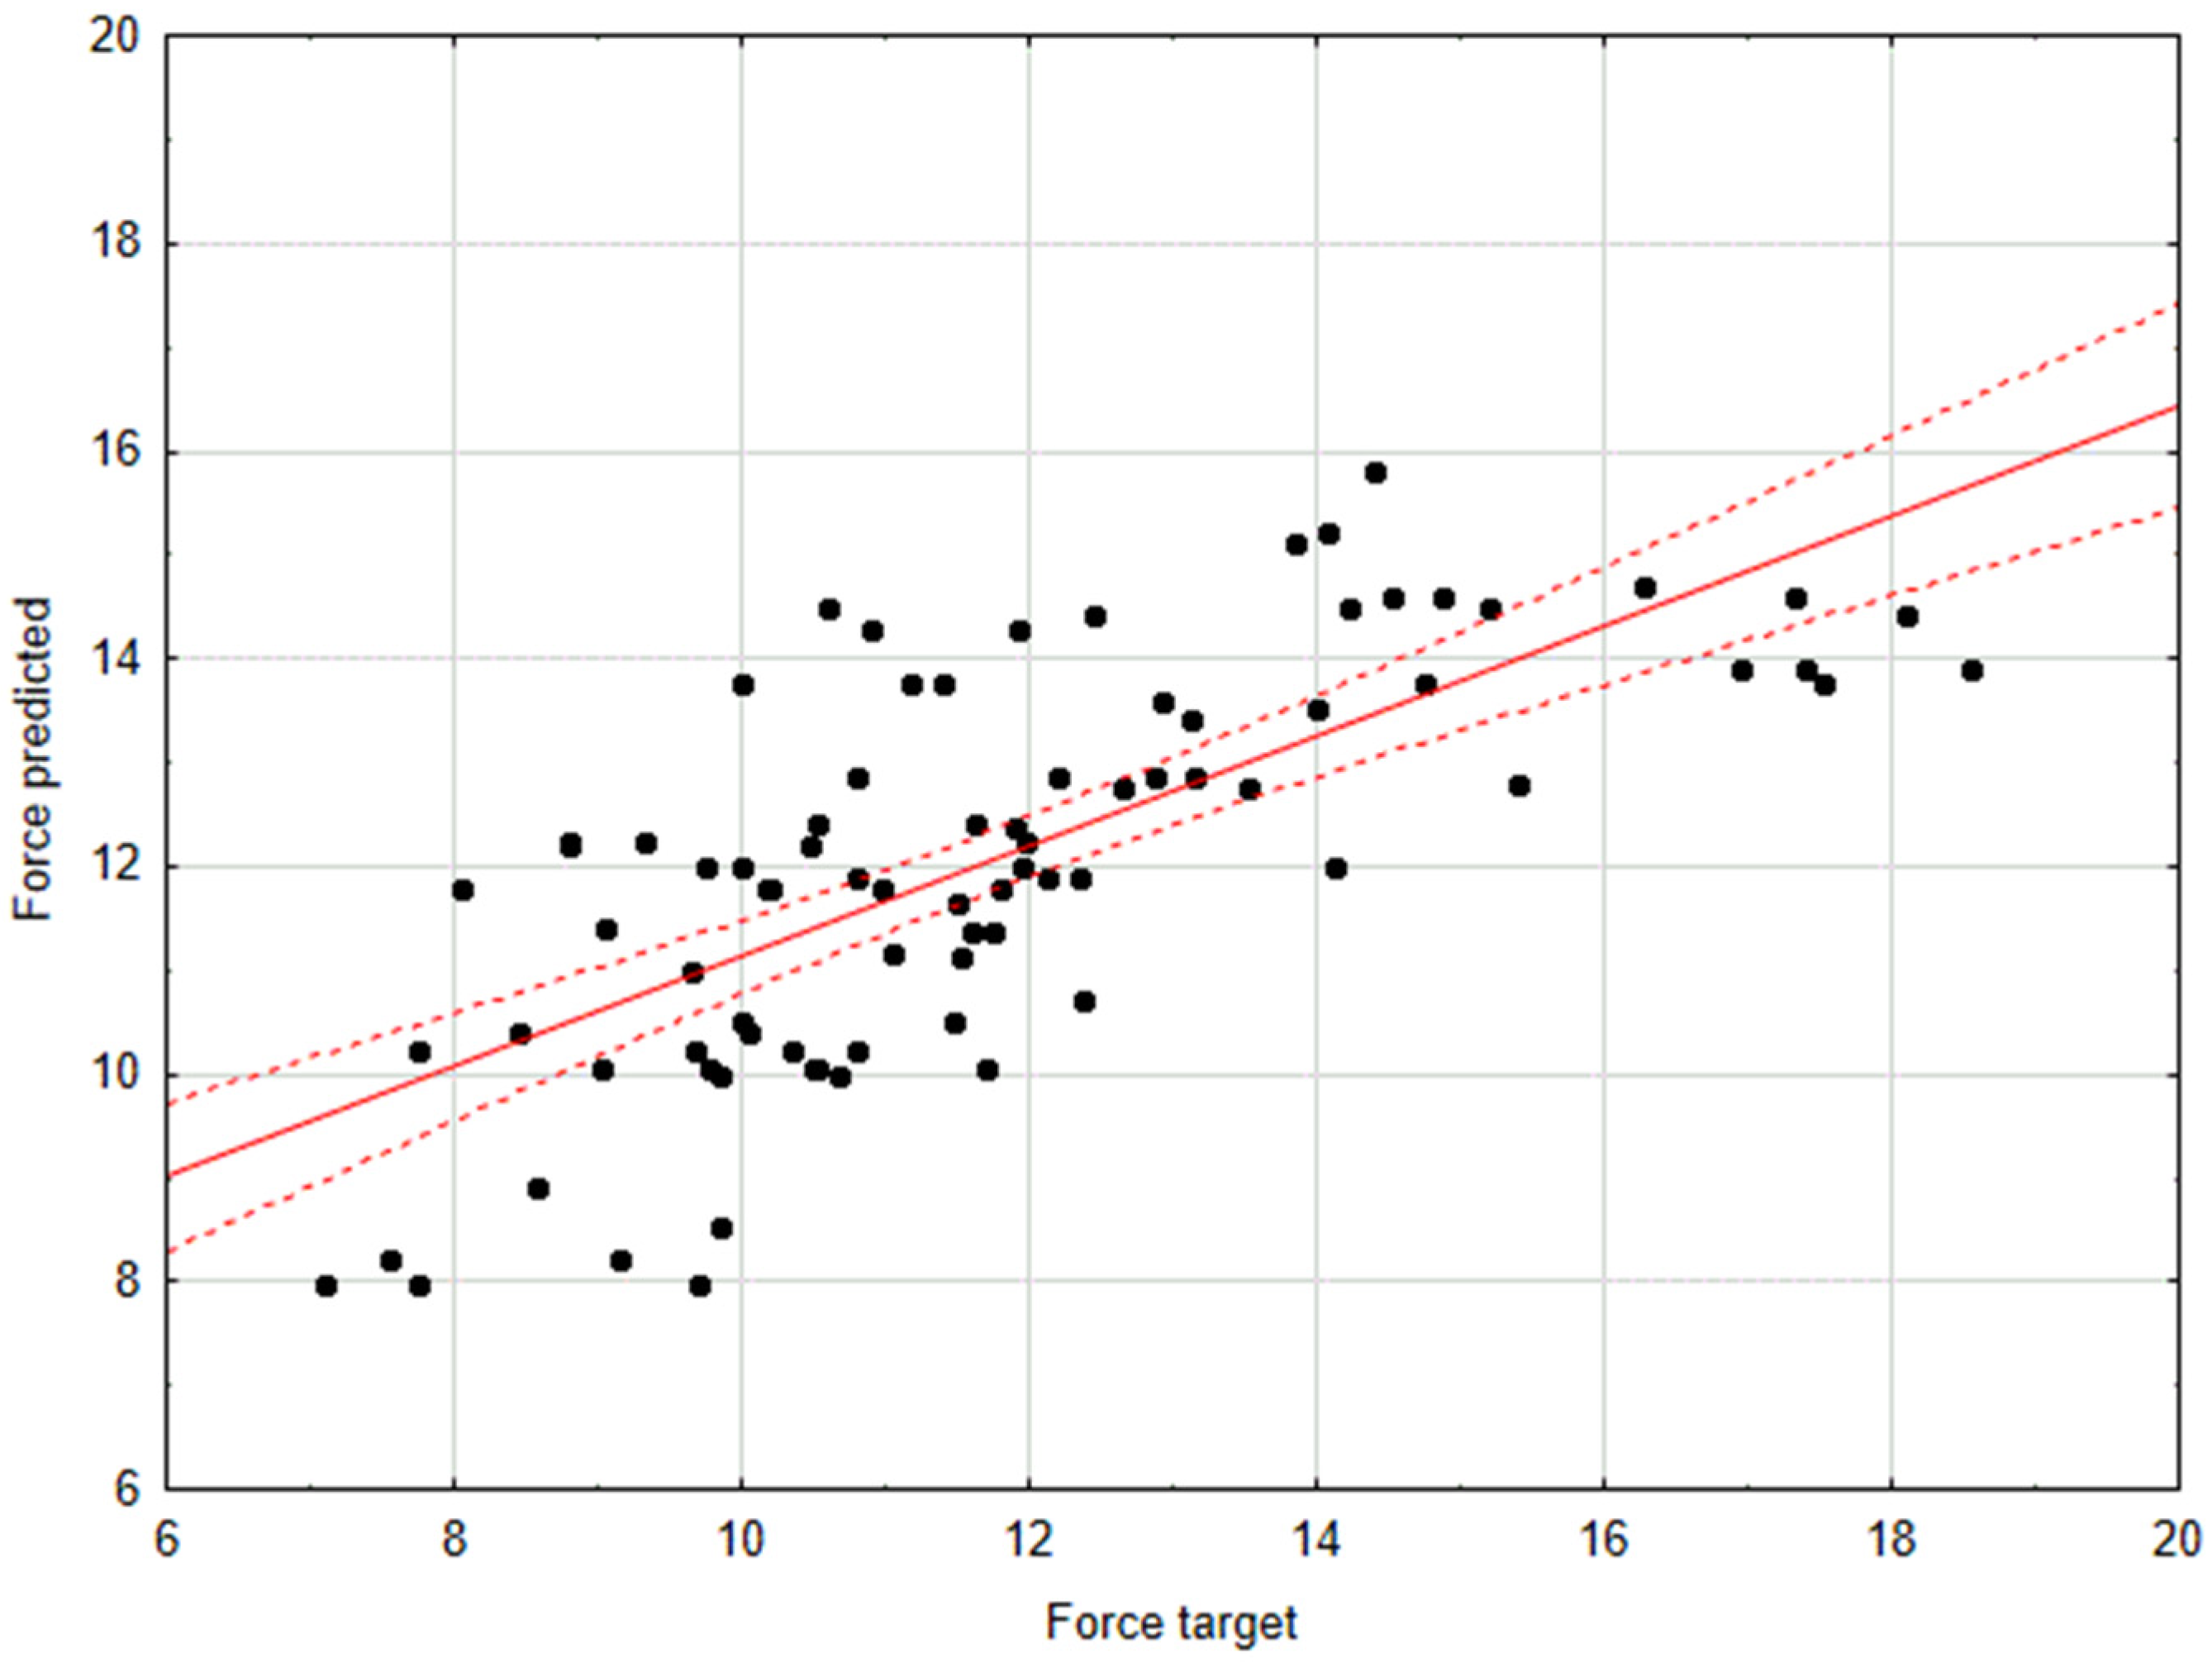
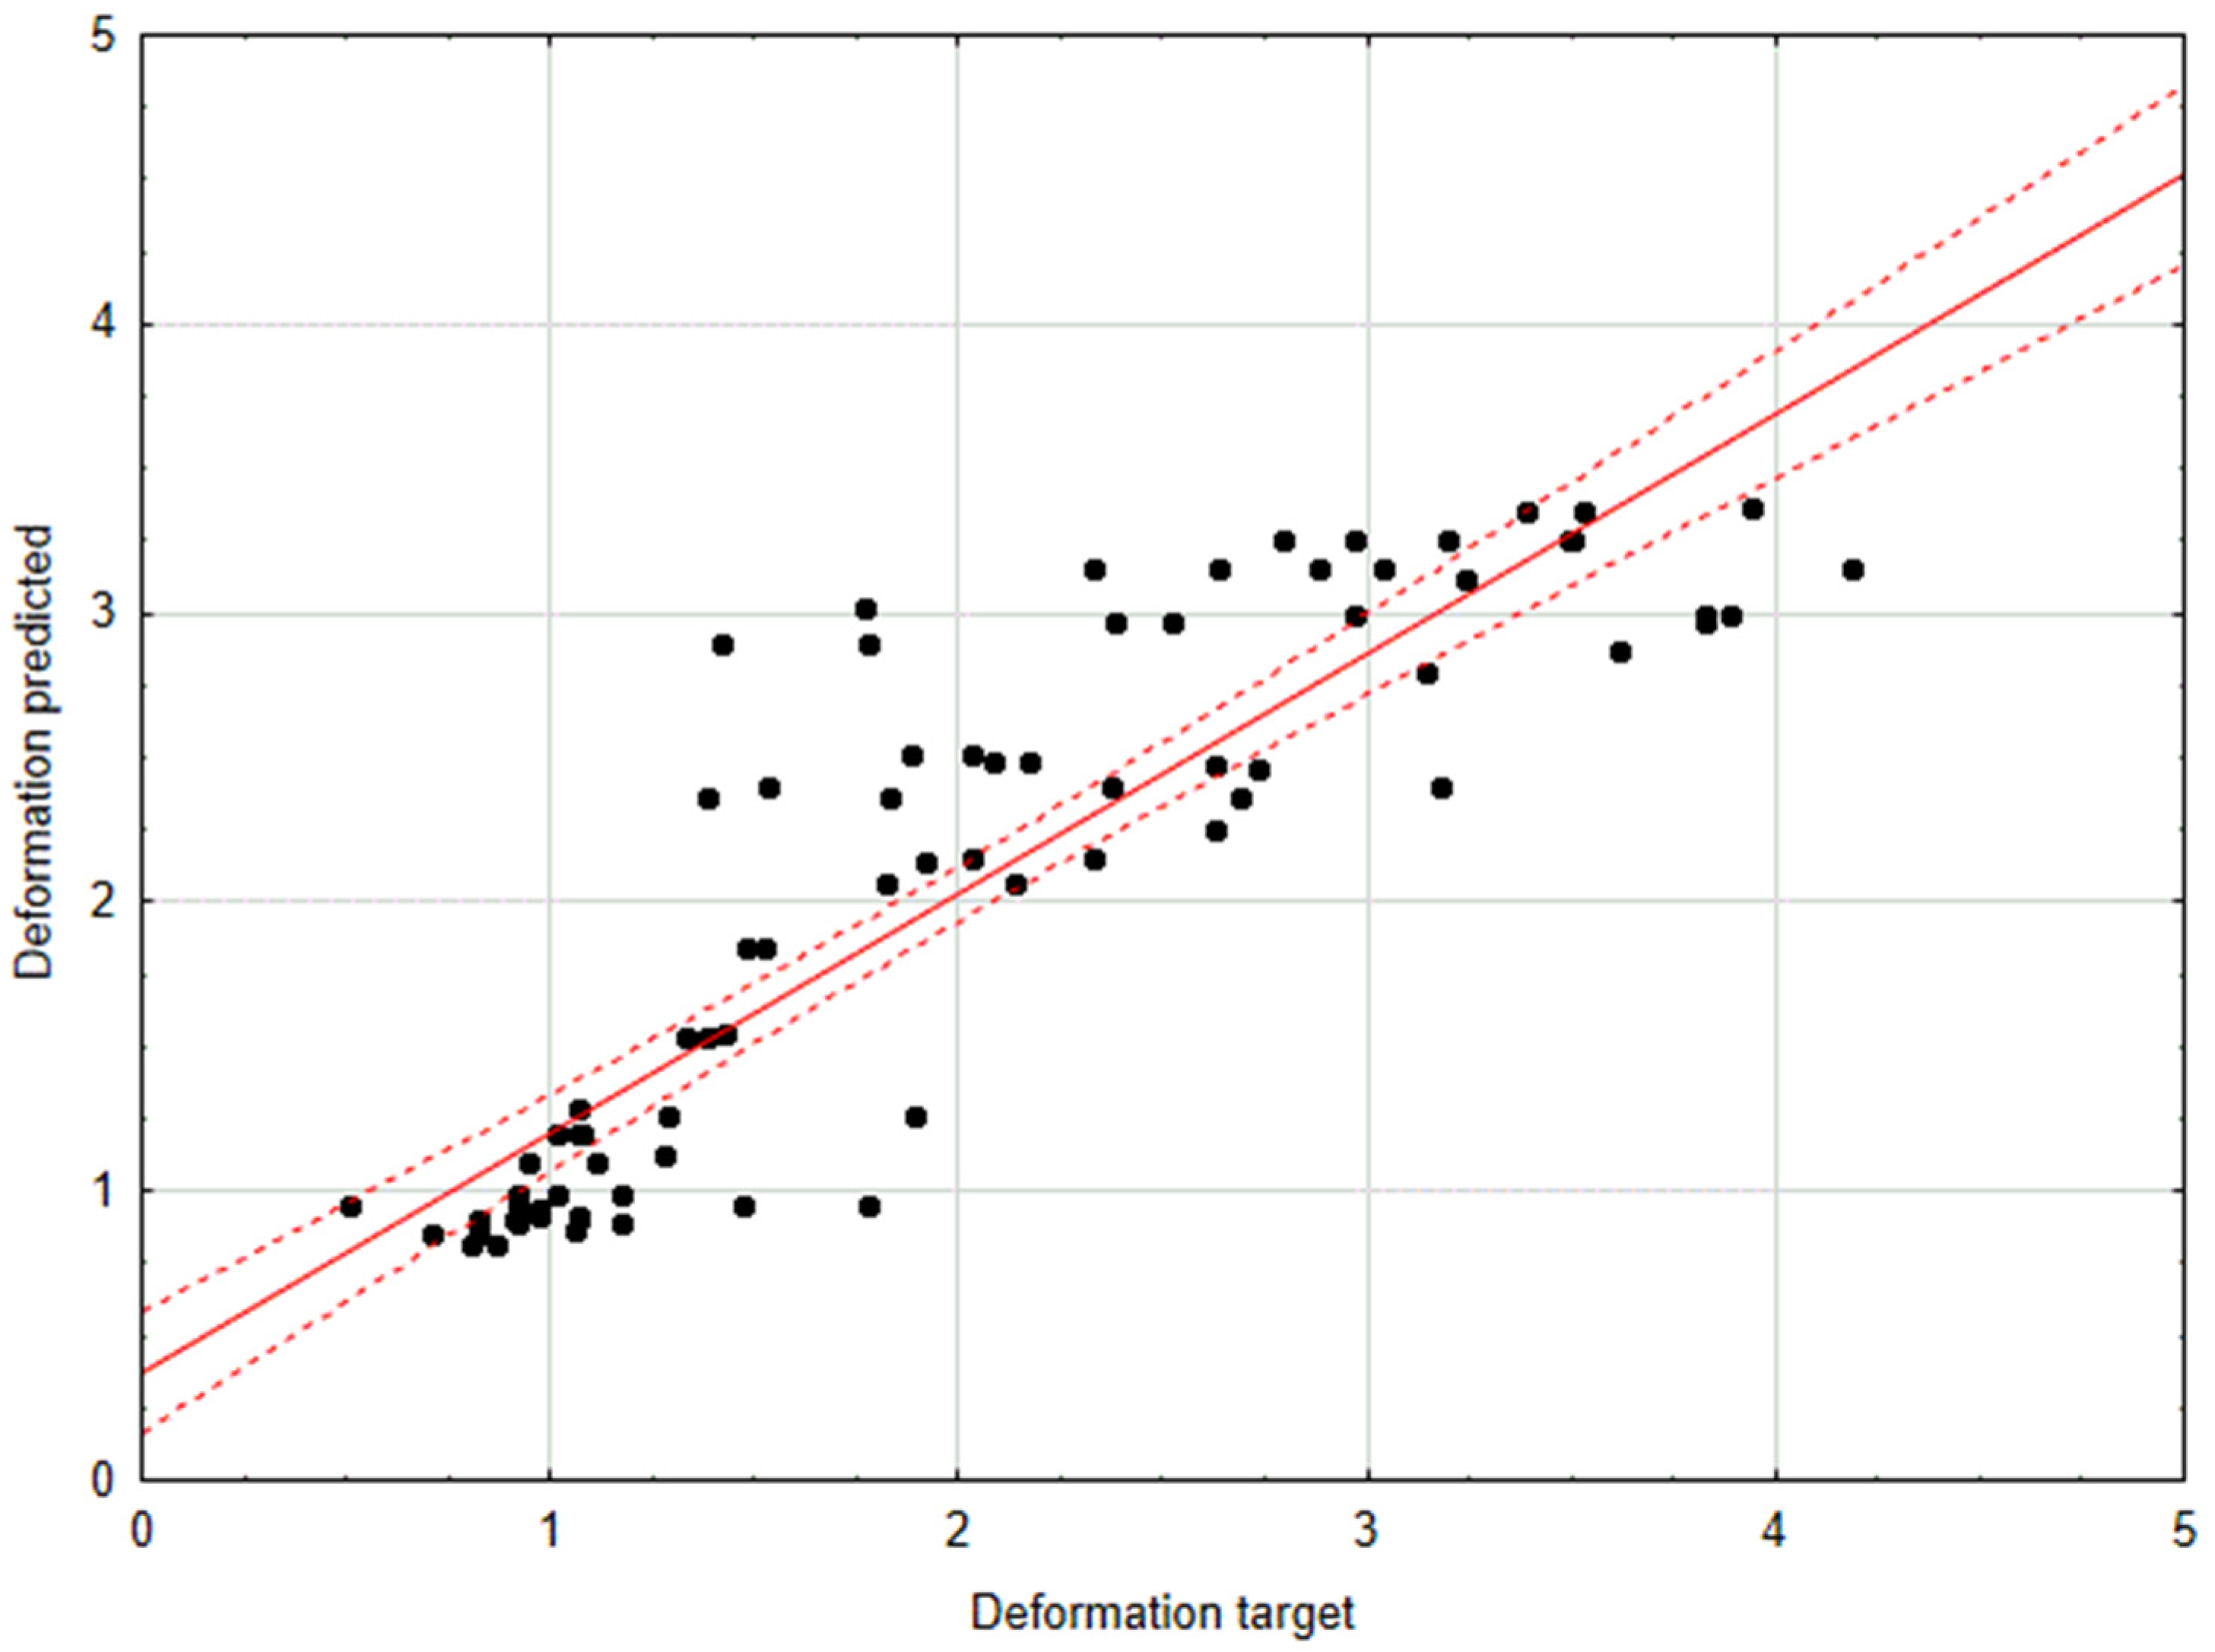
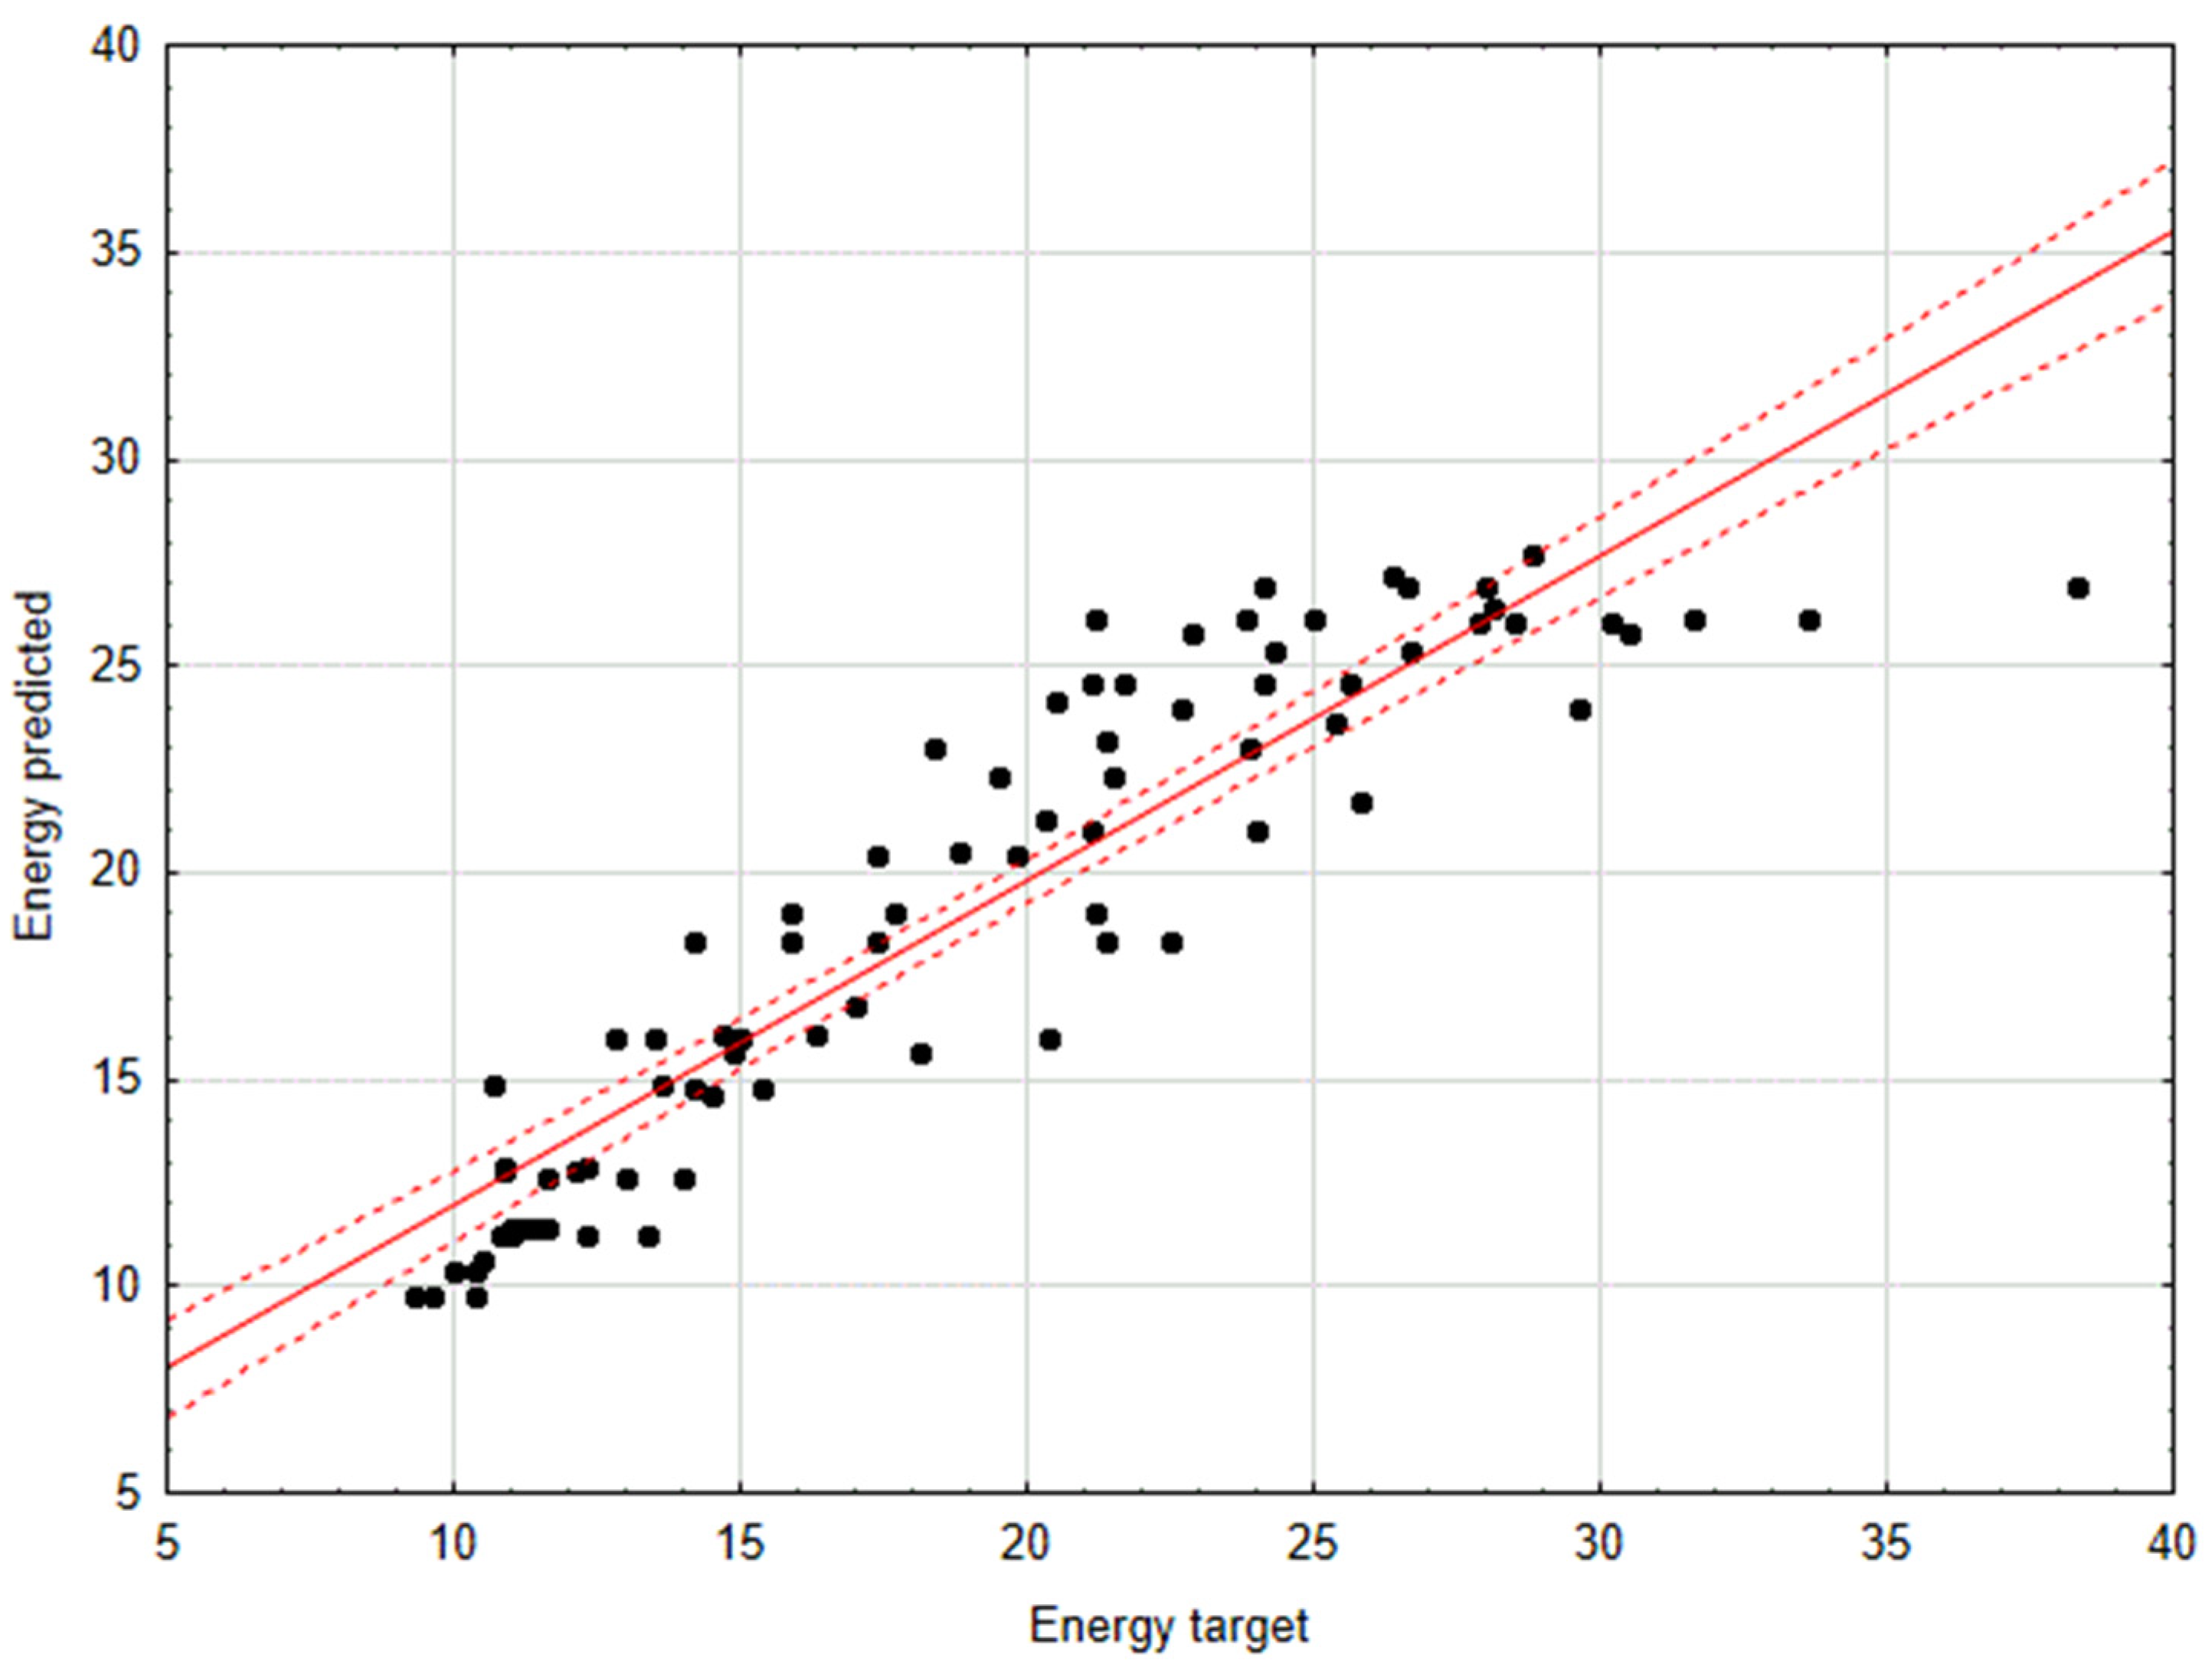
3.2. Machine Learning Models

In order to avoid the potential issue of redundancy in input parameters, which could compromise the accuracy of the predictive models, the correlations between the explanatory variables were subjected to examination. The findings are presented in Table 3.
The correlation coefficients between the input parameters of the predictive models are minimal, and the relationship between the variables is not statistically significant. Consequently, all three explanatory variables can be employed in machine learning models.
In this study, a novel machine learning (ML) method, namely, metamodeling, was employed to enhance prediction quality. An independent metamodel was generated for each of the three mechanical parameters of the fruit. The predictions from six ML models were utilized as input parameters in the second modelling step (see Figure 1). With regard to the force parameter, the models generated in the initial stage exhibited a MAPE for the test set in the range of 12% to 13%, accompanied by a correlation coefficient (R) of 0.65 to 0.71. With regard to the deformation parameter, models exhibiting a MAPE of 17% to 20% and a correlation coefficient R ranging from 0.84 to 0.88 were generated. In the case of the energy parameter, the models generated in the initial stage exhibited a MAPE of 10–11% and a correlation coefficient R of 0.90 to 0.92. Based on the predictions derived from these models, the six metamodels were generated for each output parameter (force, deformation and energy) utilizing the identical machine learning techniques employed in stage one (DT, GM, RF, KNNR, XGB and SVR) as meta-regressor. The error metrics of the metamodels are presented in Table 4.
The most accurate predictive model was obtained with energy as the output parameter. The mean absolute percentage error (MAPE) was 10–11%, and the correlation coefficient between the target and predicted values for the test set exceeded 0.9. The NSC index exhibited values approaching 1. The most accurate model for this parameter was obtained using the XGB method as meta-regressor (MAPE = 10%, R = 0.92). The accuracy of the force prediction was slightly lower. The MAPE for the test set ranged from 12% to 13% depending on the ML method used, while the correlation coefficient and the NSC index varied between 0.66 and 0.72 and 0.41 and 0.50, respectively. In this instance, the most accurate model was also generated using the XGB meta-regressor (MAPE = 12%, R = 0.50). The models developed for the prediction of deformation exhibited the lowest accuracy, with a MAPE for the test set of 17–19% and a correlation coefficient of 0.84–0.88. The highest prediction accuracy for this parameter was obtained using the SVR algorithm as meta-regressor in the second modelling step. A comparison of the of the prediction accuracy using the metamodels with that of the traditional one-step ML modelling revealed that no improvement in the quality of the models was obtained for energy and deformation. However, for force, the MAPE was not reduced, but a slight improvement in correlation coefficient was observed (Table 4).
In Figure 2, Figure 3 and Figure 4, the performance of the best metamodels of force, deformation and energy for the test data set is depicted.
A significant trend in the fields of agroengineering and food processing is the pursuit of alternative methodologies for the assessment of various parameters associated with bio-based materials. These methodologies are anticipated to supplant the conventional, costly, and time-consuming laboratory procedures. One potential avenue is the utilization of machine learning for the prediction of specific food parameters, including mechanical features. Yu et al. [41] employed a partial least squares regression, a least-squares support vector machine and a fully connected neural network (FNN) to predict the firmness of postharvest Korla fragrant pears based on hyperspectral reflectance imaging. The most accurate model was generated by the FNN technique, achieving R = 0.94 for the test data set. The combination of a support vector machine with hyperspectral imaging resulted in the creation of an accurate prediction model for the mechanical parameters of apple fruit following impact damage [33]. The models were constructed using full-band wavelengths and characteristic wavelengths extracted by principal component analysis (PCA) and a successive projection algorithm (SPA). The optimal models were generated using full-band wavelengths, achieving R = 0.94 for absorbed energy, R = 0.92 for contact load, and R = 0.93 for damaged area. The force and energy required for the fracturing of cumin seeds were predicted using artificial neural networks (ANNs) by Saiedirad and Mirsalehi [42]. The authors employed moisture content, seed size, speed and direction of loading as independent variables in the models. Based on root mean square errors (4.6% for the force and 7.7% for the energy), the models developed can be deemed useful for real-world applications. The same ML technique was used by Cevher and Yildirim [43] to develop a predictive model of the rupture energy of Deveci and Abate Fetel pear fruit. The models were based on different combinations of length, thickness, width, mass, water-soluble dry matter and Magness–Taylor force as inputs. The best model was created using an ANN with one hidden layer (five neurons) trained with the scaled conjugate gradient method and employing mass, water-soluble dry matter and Magness–Taylor force as independent variables. The high quality of the model was demonstrated by R = 0.97. Vasighi-Shojae et al. [44] developed highly accurate models (R > 0.99) for the firmness, elastic modulus and stiffness of Golden Delicious apples. They employed an ANN trained with the backpropagation algorithm. The diameters were combined with ultrasound velocity and attenuation as input variables. The metamodel method proposed in our work has yet to gain widespread acceptance. A comparable technique was employed by Qureshi et al. [45] in wind power forecasting. In their DNN-MRT (deep neural network-based meta regression and transfer learning) approach, the deep belief network was used as a meta-regressor. The approach was tested on five wind farms, and the results demonstrated the high generalization ability of DNN-MRT models.

4. Conclusions

Mechanical parameters of plant materials are crucial for determining how storage conditions affect their quality. As part of this work, mechanical parameters of fruits were examined in relation to storage conditions and mathematical models of the studied relationships were developed. The results of these studies showed that the water content in fresh quince fruits ranged from 93.68 to 98.47%. It was found that ozonation, regardless of the dose, did not significantly affect the water content in the tested fruits. Moreover, during the analyzed storage time, i.e., 60 days, the water content significantly decreased in the analyzed fruits, regardless of the variety. The mechanical parameters examined during 60 days of storage were significantly modified by the applied doses of gaseous ozone. Irrespective of the duration of the ozonation process, an increase in resistance was observed in the Japanese quince cultivars analyzed with regard to skin and flesh puncture, puncture energy and deformation. The ‘Rasa’ variety exhibited the lowest resistance to mechanical damage, while the ‘North Lemon’ and ‘Gold Calif’ varieties demonstrated the highest resistance. The ozonation process, when conducted for 15 min, resulted in a significant increase in the energy required to puncture the skin and flesh of the fruit, by an average of 6.41% compared to the control group. However, extending the exposure time to 30 min did not yield a notable change in this parameter.
The relationships studied were modelled using a metamodel-based machine learning method. The results obtained indicate that the method used produced models of acceptable accuracy. The mean absolute percentage error (MAPE) ranged from 10% for the energy model to 17% for the deformation model. The models obtained may have practical application in storage process design for Japanese quince fruit.

Author Contributions

Conceptualization, J.G. and K.P.; methodology, J.G., K.P. and P.K.; software, J.K.; validation, J.K. and W.W.; formal analysis, W.W. and M.Z.; resources, T.M.; data curation, P.K. and T.M.; writing—original draft preparation, J.G., K.P. and M.Z.; writing—review and editing, J.K., W.W. and M.Z.; visualization, K.P. and P.K.; supervision, J.G.; funding acquisition, K.P. and J.G. All authors have read and agreed to the published version of the manuscript.

Funding

The APC was co-financed by Wrocław University of Environmental and Life Sciences and University of Rzeszow.

Institutional Review Board Statement

Not applicable.

Data Availability Statement

The data presented in this study are available in this article.

Acknowledgments

Thanks to Monika Murawska Farm for providing the fruit for research.

Conflicts of Interest

The authors declare no conflicts of interest.

References

  1. Byczkiewicz, S.; Kobus-Cisowska, J.; Szulc, P.; Telichowska, A.; Szczepaniak, O.; Dziedzinski, M. Pigwowiec japoński (Chaenomeles japonica L.) jako surowiec o właściwościach prozdrowotnych—Aktualny stan wiedzy. Tech. Rol. Ogrod. Leśna 2019, 5, 22–25. [Google Scholar]
  2. Zhang, R.; Li, S.; Zhu, Z.; He, J. Recent advances in valorization of Chaenomeles fruit: A review ofbotanical profile, phytochemistry, advanced extraction technologies and bioactivities. Trends Food Sci. Technol. 2019, 91, 467–482. [Google Scholar] [CrossRef]
  3. Rumpunen, K. Chaenomeles: Potential new fruit crop for northern Europe. In Trends in New Crops and New Uses; ASHA Press: Alexandria, VA, USA, 2002; pp. 385–392. [Google Scholar]
  4. Zhang, L.; Li, S. Effects of micronization on properties of Chaenomeles sinensis (Thouin) Koehne fruit powder. Innov. Food Sci. Emerg. Technol. 2009, 10, 633–637. [Google Scholar] [CrossRef]
  5. Tarko, T.; Duda-Chodak, A.; Pogon, P. Charakterystyka owoców pigwowca japońskiego i derenia jadalnego. Żywność. Nauka. Technol. Jakość. 2010, 6, 100–108. [Google Scholar]
  6. Zhang, M.; Zhao, R.; Zhou, S.; Liu, W.; Liang, Y.; Zhao, Z. Chemical characterization and evaluation of the antioxidants in Chaenomeles fruits by an improved HPLC-TOF/MS coupled to an online DPPH-HPLC method. J. Environ. Sci. Health Part C 2018, 36, 43–62. [Google Scholar] [CrossRef]
  7. Du, H.; Wu, J.; Li, H. Polyphenols and triterpenes from Chaenomeles fruits. Chemical analysis and antioxidant activities assessment. Food Chem. 2013, 141, 4260–4268. [Google Scholar] [CrossRef]
  8. Nahorska, A.; Dzwoniarska, M.; Thiem, B. Owoce pigwowca japońskiego (Chaenomelesjaponica (Thunb.) Lindi. ex Spach) źródłem substancji biologicznie aktywnych. Postępy Fitoter. 2014, 4, 239–246. [Google Scholar]
  9. Aliasgarian, S.; Ghassemzadeh, H.; Moghaddam, M.; Ghaffari, H. Mechanical Damage of Strawberry During Harvest and Postharvest Operations. Acta Technol. Agric. 2015, 18, 1–5. [Google Scholar] [CrossRef]
  10. El-Ramady, H.R.; Domokos-Szabolcsy, E.; Abdalla, N.A.; Taha, H.S.; Fári, M. Postharvest Management of Fruits and Vegetables Storage. Sustain. Agric. Rev. 2015, 15, 65–152. [Google Scholar]
  11. Sarig, Y. Mechanical harvesting of fruit—Past achievements, current status and future prospects. Acta Hortic. 2012, 965, 163–169. [Google Scholar] [CrossRef]
  12. Rabcewicz, J. Perspectives of mechanical harvesting of stone and berry fruit. Informator Sadowniczy, 5 May 2013. (In Polish) [Google Scholar]
  13. Paniagua, A.C.; East, A.R.; Hindmarsh, J.P.; Heyes, J.A. Moisture loss is the major cause of firmness change during postharvest storage of blueberry. Postharvest Biol. Technol. 2013, 79, 13–19. [Google Scholar] [CrossRef]
  14. Ruse, K.; Rakcejeva, T.; Dukalska, L. Changes in Physically-Chemical Parameters of Latvian Cranberries During Storage. Proc. Latv. Univ. Agric. 2013, 30, 11–19. [Google Scholar] [CrossRef]
  15. Bohdziewicz, J.; Czachor, G. The impact of load on deformation progress for ball-shaped vegetables. Agric. Eng. 2010, 1, 85–91. [Google Scholar]
  16. Bohdziewicz, J.; Czachor, G. The Rheological Properties of Redcurrant and Highbush Blueberry Berries. Agric. Eng. 2016, 2, 15–22. [Google Scholar] [CrossRef]
  17. Diaz-Garcia, L.; Rodriguez-Bonilla, L.; Phillips, M.; Lopez-Hernandez, A.; Grygleski, E.; Atucha, A.; Zalapa, J. Comprehensive analysis of the internal structure and firmness in American cranberry (Vaccinium macrocarpon Ait.) fruit. PLoS ONE 2019, 14, e0222451. [Google Scholar] [CrossRef]
  18. Kowalska, H.; Marzec, A.; Domian, E.; Masiarz, E.; Ciurzyńska, A.; Galus, S.; Małkiewicz, A.; Lenart, A.; Kowalska, J. Physical and Sensory Properties of Japanese Quince Chips Obtained by Osmotic Dehydration in Fruit Juice Concentrates and Hybrid Drying. Molecules 2020, 25, 5504. [Google Scholar] [CrossRef]
  19. Cirak, C.; Radusiene, J. Factors affecting the variation of bioactive compounds in Hypericum species. Biol. Futur. 2019, 70, 198–209. [Google Scholar] [CrossRef]
  20. Cao, S.; Meng, L.; Ma, C.; Ba, L.; Lei, J.; Ji, N.; Wang, R. Effect of ozone treatment on physicochemical parameters and ethylene biosynthesis inhibition in Guichang Kiwifruit. Food Sci. Technol. 2022, 42, e64820. [Google Scholar] [CrossRef]
  21. Xu, D.Y.; Shi, M.; Jia, B.; Yan, Z.C.; Gao, L.P.; Guan, W.Q.; Wang, Q.; Zuo, J.H. Effect of ozone on the activity of antioxidant and chlorophyll-degrading enzymes during postharvest storage of coriander (Coriandrum sativum L.). J. Food Process. Preserv. 2019, 43, e14020. [Google Scholar] [CrossRef]
  22. Pinto, L.; Palma, A.; Cefola, M.; Pace, B.; D’Aquino, S.; Carboni, C.; Baruzzi, F. Effect of modified atmosphere packaging (MAP) and gaseous ozone pre-packaging treatment on the physico-chemical, microbiological and sensory quality of small berry fruit. Food Packag. Shelf Life 2020, 26, 100573. [Google Scholar] [CrossRef]
  23. Zhang, L.K.; Lu, Z.X.; Yu, Z.F.; Gao, X. Preservation of fresh-cut celery by treatment of ozonated water. Food Control 2005, 16, 279–283. [Google Scholar] [CrossRef]
  24. Zardzewiały, M.; Matlok, N.; Piechowiak, T.; Gorzelany, J.; Balawejder, M. Ozone Treatment as a Process of Quality Improvement Method of Rhubarb (Rheum rhaponticum L.) Petioles during Storage. Appl. Sci. 2020, 10, 8282. [Google Scholar] [CrossRef]
  25. Wang, T.; Yun, J.; Zhang, Y.; Bi, Y.; Zhao, F.; Niu, Y. Effects of ozone fumigation combined with nano-film packaging on the postharvest storage quality and antioxidant capacity of button mushrooms (Agaricus bisporus). Postharvest Biol. Technol. 2021, 176, 111501. [Google Scholar] [CrossRef]
  26. Lin, F.; Kaiyu, L.; Shufeng, M.A.; Wang, F.; Li, J.; Wang, L. Effects of ozone treatment on storage quality and antioxidant capacity of fresh-cut water fennel (Oenanthe javanica). Food Sci. Technol. 2023, 43, e108422. [Google Scholar] [CrossRef]
  27. Postawa, K.; Klimek, K.; Kapłan, M.; Wrzesińska-Jędrusiak, E.; Kułażyński, M. Application of ozonation as a clean method of herbs freshness prolongation: Experiment and model construction. J. Food Process Eng. 2021, 44, e13913. [Google Scholar] [CrossRef]
  28. Brodowska, A.J.; Nowak, A.; Śmigielski, K. Ozone in the food industry: Principles of ozone treatment, mechanisms of action, and applications: An overview. Crit. Rev. Food Sci. Nutr. 2017, 58, 2176–2201. [Google Scholar] [CrossRef]
  29. Kuźniar, P.; Belcar, J.; Zardzewiały, M.; Basara, O.; Gorzelany, J. Effect of Ozonation on the Mechanical, Chemical, and Microbiological Properties of Organically Grown Red Currant (Ribes rubrum L.) Fruit. Molecules 2022, 27, 8231. [Google Scholar] [CrossRef]
  30. Pérez-López, A.; Chávez-Franco, S.H.; Villaseñor-Perea, C.A.; Espinosa-Solares, T.; Hernandez-Gomez, L.H.; Lobato-Calleros, C. Respiration rate and mechanical properties of peach fruit during storage at three maturity stages. J. Food Eng. 2014, 142, 111–117. [Google Scholar] [CrossRef]
  31. Pan, H.; Yang, J.; Shi, Y.; Li, T. BP neural network application model of predicting the apple hardness. J. Comput. Theor. Nanosci. 2015, 12, 2802–2807. [Google Scholar] [CrossRef]
  32. Saeidirad, M.H.; Rohani, A.; Zarifneshat, S. Predictions of viscoelastic behavior of pomegranate using artificial neural network and Maxwell model. Comput. Electron. Agric. 2013, 98, 1–7. [Google Scholar] [CrossRef]
  33. Zhang, P.; Shen, B.; Ji, H.; Wang, H.; Liu, Y.; Zhang, X.; Ren, C. Nondestructive Prediction of Mechanical Parameters to Apple Using Hyperspectral Imaging by Support Vector Machine. Food Anal. Methods 2022, 1, 1397–1406. [Google Scholar] [CrossRef]
  34. Mohsen, A.; Shabankareh, S.H.; Kiapey, A.; Rezaeiasl, A.; Mahmoodi, M.J.; Torshizi, M.V. Assessing kiwifruit quality in storage through machine learning. J. Food Process Eng. 2024, 47, e14681. [Google Scholar]
  35. Qiao, J.; Wang, N.; Ngadi, M.; Kazemi, S. Predicting mechanical properties of fried chicken nuggets using image processing and neural network techniques. J. Food Eng. 2007, 79, 1065–1070. [Google Scholar] [CrossRef]
  36. PN-90/A-75101/03:1990; Determination of Dry Matter Content by the Weight Method. Polish Standard. Polish Committee for Standardization: Warsaw, Poland, 1990. (In Polish)
  37. Zapałowska, A.; Matłok, N.; Zardzewiały, M.; Piechowiak, T.; Balawejder, M. Effect of Ozone Treatment on the Quality of Sea Buckthorn (Hippophae rhamnoides L.). Plants 2021, 10, 847. [Google Scholar] [CrossRef] [PubMed]
  38. Antos, P.; Piechowicz, B.; Gorzelany, J.; Matłok, N.; Migut, D.; Józefczyk, R.; Balawejder, M. Effect of Ozone on Fruit Quality and Fungicide Residue Degradation in Apples during Cold Storage. Ozone Sci. Eng. 2018, 40, 482–486. [Google Scholar] [CrossRef]
  39. Matłok, N.; Piechowiak, T.; Zardzewiały, M.; Saletnik, B.; Balawejder, M. Continuous Ozonation Coupled with UV-C Irradiation for a Sustainable Post-Harvest Processing of Vaccinium macrocarpon Ait. Fruits to Reduce Storage Losses. Sustainability 2024, 16, 5420. [Google Scholar] [CrossRef]
  40. Zardzewiały, M.; Matłok, N.; Piechowiak, T.; Saletnik, B.; Balawejder, M.; Gorzelany, J. Preliminary Tests of Tomato Plant Protection Method with Ozone Gas Fumigation Supported with Hydrogen Peroxide Solution and Its Effect on Some Fruit Parameters. Sustainability 2024, 16, 3481. [Google Scholar] [CrossRef]
  41. Yu, X.; Lu, H.; Wu, D. Development of deep learning method for predicting firmness and soluble solid content of postharvest Korla fragrant pear using Vis/NIR hyperspectral reflectance imaging. Postharvest Biol. Technol. 2018, 141, 39–49. [Google Scholar] [CrossRef]
  42. Saiedirad, M.H.; Mirsalehi, M. Prediction of mechanical properties of cumin seed using artificial neural networks. J. Texture Stud. 2010, 41, 34–48. [Google Scholar] [CrossRef]
  43. Cevher, E.Y.; Yildirim, D. Using Artificial Neural Network Application in Modeling the Mechanical Properties of Loading Position and Storage Duration of Pear Fruit. Processes 2022, 10, 2245. [Google Scholar] [CrossRef]
  44. Vasighi-Shojae, H.; Gholami-Parashkouhi, M.; Mohammadzamani, D.; Soheili, A. Predicting Mechanical Properties of Golden Delicious Apple Using Ultrasound Technique and Artificial Neural Network. Food Anal. Methods 2020, 13, 699–705. [Google Scholar]
  45. Qureshi, A.S.; Khan, A.; Zameer, A.; Usman, A. Wind power prediction using deep neural network based meta regression and transfer learning. Appl. Soft Comput. 2017, 58, 742–755. [Google Scholar] [CrossRef]
Figure 1. The metamodel structure for the prediction of the mechanical characteristics of Japanese quince fruit.
Agriculture 14 01995 g001
Figure 2. Predicted values versus measured values of force for test data set. Full red line represents regression equation and dashed red line represents 95% confidence limit.
Agriculture 14 01995 g002
Figure 3. Predicted values versus measured values of deformation for test data set. Full red line represents regression equation and dashed red line represents 95% confidence limit.
Agriculture 14 01995 g003
Figure 4. Predicted values versus measured values of energy for test data set. Full red line represents regression equation and dashed red line represents 95% confidence limit.
Agriculture 14 01995 g004
Table 1. Results of water content and mechanical properties of Japanese quince fruits depending on the analyzed variables used for modeling.
VarietyDuration of
Storage
[days]
Ozonation Time
[min]
Moisture Content
[%]
Force
[N]
Deformation
[mm]
Energy
[mJ]
Darius1098.01 a ± 0.2813.42 a ± 1.221.20 a ± 0.3314.43 a ± 4.46
1598.23 a ± 0.4912.07 a ± 1.751.36 a ± 0.2312.86 a ± 1.71
3097.97 a ± 0.3113.42 a ± 2.021.14 a ± 0.1313.04 a ± 1.54
30097.04 a ± 0.3010.33 a ± 1.682.19 a ± 0.6121.13 a ± 1.44
1597.26 a ± 0.5112.07 a ± 0.992.71 b ± 0.3621.94 a ± 1.68
3097.00 a ± 0.3314.21 b ± 1.953.07 b ± 1.2326.65 b ± 3.54
60094.81 a ± 0.5513.11 a ± 2.222.91 a ± 0.5924.15 a ± 3.34
1594.95 a ± 0.4314.50 ab ± 1.793.15 a ± 0.3723.61 a ± 1.62
3095.31 a ± 1.2115.12 b ± 1.722.93 a ± 0.5022.91 a ± 2.46
Gold Calif1097.76 a ± 0.3912.63 a ± 2.020.95 a ± 0.1215.01 a ± 1.35
1598.06 a ± 0.4013.41 a ± 1.190.95 a ± 0.1214.70 a ± 0.73
3097.56 a ± 0.3613.59 a ± 1.941.07 a ± 0.3214.28 a ± 1.95
30096.65 a ± 0.3912.20 a ± 2.621.96 a ± 0.8323.8 a ± 7.64
1596.95 a ± 0.3114.83 b ± 1.951.88 a ± 0.2728.6 b ± 3.04
3096.45 a ± 0.3515.32 b ± 1.492.43 a ± 0.1727.6 b ± 1.59
60093.68 a ± 0.4714.85 a ± 1.982.47 a ± 0.5226.20 a ± 2.94
1594.90 a ± 0.5115.76 a ± 1.322.39 a ± 0.2727.23 a ± 2.58
3092.80 a ± 2.3114.23 a ± 2.302.38 a ± 0.6724.58 a ± 2.35
Maksym0098.33 a ± 0.449.71 a ± 1.440.86 a ± 0.1511.15 a ± 0.58
1596.99 a ± 0.9311.01 a ± 1.480.91 a ± 0.1712.91 a ± 1.77
3097.85 a ± 0.9010.20 a ± 1.380.94 a ± 0.1111.96 a ± 0.98
30097.26 a ± 0.399.13 a ± 2.391.45 a ± 0.1618.30 a ± 5.00
1595.94 a ± 0.8914.63 c ± 3.322.99 b ± 0.7725.22 b ± 3.59
3096.79 a ± 0.5612.68 b ± 2.631.65 a ± 0.1922.69 b ± 2.81
60094.83 a ± 0.2911.62 a ± 1.692.21 a ± 0.6118.35 a ± 2.30
1594.11 a ± 0.4115.39 b ± 2.443.06 b ± 0.8828.49 c ± 4.91
3094.04 a ± 0.8311.76 a ± 2.332.46 a ± 0.4423.70 b ± 2.01
North Lemon1097.90 a ± 0.4912.10 a ± 1.921.04 a ± 0.1816.08 a ± 3.05
1598.28 a ± 0.5312.08 a ± 1.720.88 a ± 0.0816.09 a ± 2.22
3097.91 a ± 0.6512.93 a ± 2.240.97 a ± 0.3116.54 a ± 2.65
30096.79 a ± 1.3711.64 a ± 1.202.18 a ± 0.5324.65 b ± 2.05
1597.16 a ± 0.4412.16 a ± 1.862.02 a ± 0.3826.6 b ± 2.94
3096.80 a ± 1.8410.20 a ± 1.502.87 b ± 0.6920.91 a ± 5.24
60093.71 a ± 1.5913.95 a ± 2.383.27 a ± 0.3725.45 a ± 2.88
1594.35 a ± 1.9312.70 a ± 2.053.49 a ± 0.6528.05 a ± 2.18
3095.33 a ± 0.5813.54 a ± 2.893.11 a ± 0.6827.41 a ± 5.57
Rasa1098.47 a ± 0.458.07 a ± 1.031.20 a ± 0.259.71 a ± 1.23
1598.24 a ± 0.538.45 a ± 0.911.30 a ± 0.2510.44 a ± 0.73
3097.43 a ± 0.948.58 a ± 0.701.11 a ± 0.2010.69 a ± 0.76
30097.21 a ± 0.488.66 a ± 0.912.36 a ± 0.3116.41 a ± 0.92
1596.98 a ± 0.638.74 a ± 2.402.68 a ± 0.4515.43 a ± 4.35
3096.18 a ± 1.1410.19 a ± 1.183.24 b ± 0.2518.55 a ± 2.87
60094.49 a ± 2.319.96 a ± 1.052.78 a ± 0.3617.73 a ± 1.00
1594.65 a ± 1.7310.05 a ± 2.763.16 a ± 0.5316.66 a ± 4.70
3093.97 a ± 1.6811.71 a ± 1.363.81 b ± 0.2920.03 a ± 3.10
Tamara1097.82 a ± 0.7311.04 a ± 1.140.86 a ± 0.1311.56 a ± 1.42
1597.69 a ± 1.1110.04 a ± 1.200.86 a ± 0.0911.24 a ± 0.82
3098.35 a ± 0.7411.52 a ± 0.930.83 a ± 0.0812.83 a ± 1.31
30096.57 a ± 0.9911.71 a ± 2.772.01 b ± 1.0121.46 a ± 6.27
1596.44 a ± 0.9711.19 a ± 0.581.51 a ± 0.1121.30 a ± 1.31
3097.09 a ± 0.7911.88 a ± 3.182.86 c ± 1.0322.91 a ± 5.45
60093.90 a ± 1.8013.39 ± 0.672.75 b ± 0.8924.55 b ± 3.50
1593.96 a ± 1.7611.95 a ± 1.102.48 ab ± 0.5421.24 a ± 1.72
3095.18 a ± 0.9211.58 a ± 1.042.06 a ± 0.2219.79 a ± 2.04
Data are expressed as mean values (n = 10) ± SD; SD—standard deviation. Mean values within columns with different letters are significantly different (p < 0.05).
Table 2. Moisture content and mechanical properties of Japanese quince fruits depending on the variety, duration of storage and gaseous ozonation time.
VariablesMoisture
Content
(%)
Force
(N)
Deformation
(mm)
Energy
(mJ)
VarietyDarius96.73 a ± 1.3613.18 d ± 2.122.28 b ± 0.9719.99 c ± 5.61
Gold Calif96.24 a ± 1.6014.09 e ± 2.151.83 a ± 0.7522.44 d ± 6.50
Maksym96.09 a ± 1.8711.79 bc ± 2.911.84 a ± 0.9519.20 bc ± 6.60
North Lemon96.47 a ± 1.6412.37 c ± 2.182.20 b ± 1.0922.42 d ± 5.79
Rasa96.33 a ± 1.659.38 a ± 1.822.40 c ± 0.9915.07 a ± 4.42
Tamara96.40 a ± 1.6711.59 b ± 1.771.80 a ± 0.9618.54 b ± 5.79
Time gaseous ozonation [min]096.40 a ± 1.6911.55 a ± 2.511.92 a ± 0.9018.85 a ± 6.09
1596.40 a ± 1.5312.28 b ± 2.742.10 ab ± 0.9820.14 b ± 6.74
3096.34 a ± 1.5812.37 b ± 2.572.16 b ± 1.0619.84 ab ± 6.07
Duration of
storage [days]
197.94 c ± 0.3711.36 a ± 2.281.02 a ± 0.2413.09 a ± 2.72
3096.81 b ± 0.3811.77 a ± 2.792.34 b ± 0.7922.46 b ± 5.18
6094.39 a ± 0.6713.06 b ± 2.502.83 c ± 0.6923.34 b ± 4.58
Mean96.38 ± 1.5712.07 ± 2.632.06 ± 0.9819.61 ± 6.32
Data are expressed as mean values (n = 10) ± SD; SD—standard deviation. Mean values within columns with different letters are significantly different (p < 0.05).
Table 3. Correlation coefficients between explanatory variables.
VarietyOzonation TimeDuration of
Storage
Variety1.000−0.001−0.065
Ozonation time−0.0011.0000.001
Duration of storage−0.0650.0011.000
Table 4. Error metrics of metamodels.
Meta-RegressorTrainTest
RRMSEMAPENSCRRMSEMAPENSC
Force
Decision tree0.741.720.110.540.681.910.130.45
Gradient boosting0.751.700.110.560.681.920.130.44
Random forest0.741.730.110.540.691.870.130.47
K nearest neighbors regression0.751.680.110.570.661.970.130.41
Extreme gradient boosting0.741.730.120.540.721.820.120.50
Support vector regression0.741.740.110.540.711.820.120.50
Deformation
Decision tree0.880.460.150.770.850.520.190.72
Gradient boosting0.870.460.160.760.870.500.190.75
Random forest0.870.460.150.760.870.490.180.75
K nearest neighbors regression0.870.460.160.770.840.540.200.70
Extreme gradient boosting0.870.470.160.760.880.460.180.78
Support vector regression0.870.470.150.750.880.460.170.78
Energy
Decision tree0.902.730.100.810.912.860.110.82
Gradient boosting0.902.670.100.820.902.940.110.81
Random forest0.902.750.100.810.912.810.110.83
K nearest neighbors regression0.902.680.100.820.902.940.110.81
Extreme gradient boosting0.902.770.110.800.922.740.100.84
Support vector regression0.902.780.110.800.922.750.100.83
The bold font represents the best models.
Disclaimer/Publisher’s Note: The statements, opinions and data contained in all publications are solely those of the individual author(s) and contributor(s) and not of MDPI and/or the editor(s). MDPI and/or the editor(s) disclaim responsibility for any injury to people or property resulting from any ideas, methods, instructions or products referred to in the content.

