Article

Movement Characteristics of Droplet Deposition in Flat Spray Nozzle for Agricultural UAVs

1
College of Electronic Engineering (College of Artificial Intelligence), South China Agricultural University, Guangzhou 510642, China
2
National Center for International Collaboration Research on Precision Agricultural Aviation Pesticides Spraying Technology, South China Agricultural University, Guangzhou 510642, China
3
College of Engineering, South China Agricultural University, Guangzhou 510642, China
*
Author to whom correspondence should be addressed.
Agriculture 2024, 14(11), 1994; https://doi.org/10.3390/agriculture14111994
Submission received: 13 September 2024 / Revised: 2 November 2024 / Accepted: 4 November 2024 / Published: 6 November 2024
(This article belongs to the Section Digital Agriculture)

Abstract

:
At present, research on aerial spraying operations with UAVs mainly focuses on the deposition outcomes of droplets, with insufficient depth in the exploration of the movement process of droplet deposition. The movement characteristics of droplet deposition as the most fundamental factors affecting the effectiveness of pesticide application by UAVs are of great significance for improving droplet deposition. This study takes flat spray nozzles as the research object, uses the Particle Image Velocimetry (PIV) technique to obtain movement data of water droplet deposition under the influence of rotor flow fields, and investigates the variation characteristics of droplet deposition speed under different influencing factors. The results show that the deposition speed and the distribution area of high-speed (>12 m/s) particles increase with the increase of rotor speed, spraying pressure, and nozzle size. When the rotor speed increases from 0 r/min to 1800 r/min, the average increase in maximum droplet deposition speed for nozzle models LU120-02, LU120-03 and LU120-04 is 33.26%, 19.02%, and 7.62%, respectively. The rotor flow field significantly increases the number of high-speed droplets, making the dispersed droplet velocity distribution more concentrated. When the rotor speed is 0, 1000, 1500, and 1800 r/min, the average decay rates of droplet deposition speed are 36.72%, 20.00%, 15.47%, and 13.21%, respectively, indicating that the rotor flow field helps to reduce the decrease in droplet deposition speed, enabling droplets to deposit on the target area at a higher speed, reducing drift risk and evaporation loss. This study’s results are beneficial for revealing the mechanism of droplet deposition movement in aerial spraying by plant protection UAVs, improving the understanding of droplet movement, and providing data support and guidance for precise spraying operations.

1. Introduction

Pesticides play a crucial role in modern agricultural production by serving as the most economical and effective technical means to control plant diseases, insect pests, and weeds, which contribute to enhanced yields and increased income in agricultural production [1]. Statistics indicate that the annual pesticide application in China is around 300,000 tons, with an effective utilization rate of only 39.8%, much lower than the international average level [2]. In recent years, plant protection UAVs using low-volume or ultra-low-volume aerial spraying have rapidly developed and been widely applied in China due to their high operational efficiency, low cost, and high pesticide utilization rate. Plant protection UAVs effectively address pest control challenges in tall crops, paddy fields, hilly terrain, and other areas, but they also face issues such as low droplet deposition, drift, and evaporation [3,4]. During the aerial spraying operations of plant protection UAVs, only a small portion of pesticide droplets reach the target crops. These problems not only reduce the effective utilization rate of pesticides but also lead to environmental pollution issues [5,6].
The main feature that distinguishes plant protection UAVs from other ground-based plant protection machinery is the rotor. The existence of rotors enables drones to take off and conduct aerial pesticide spraying operations, providing unparalleled advantages over other plant protection machinery. However, the existence of rotors also introduces a special parameter—rotor airflow [7]—into the aerial operations of UAVs. The airflow generated by rotors affects the trajectory of droplets, complicating the deposition process and causing droplet drift. To address this issue, researchers have investigated the influence mechanism of the rotor flow field on droplet deposition distribution from multiple perspectives, including vortex morphology [8,9], plant phenotype [10], load capacity [11], and rotor airflow distribution [12,13]. These studies indicate that rotor flow fields can accelerate the downward movement of droplet particles, reduce the number of droplets drifting into non-target areas, and improve the effect of protection operations, making them the primary factors influencing droplet deposition and drift.
Research on droplet deposition primarily focuses on the characteristics after droplets have settled on the target surface. For instance, water-sensitive paper (WSP) and fluorescent reagents are often employed to investigate the distribution characteristics of droplets on the target surface [14,15]. Additionally, some researchers investigate the interactions between the leaf surface and droplets [16,17], as well as the design of rapid deposition detection techniques [18]. Compared to these studies, the use of Particle Image Velocimetry (PIV) technology provides a more intuitive understanding of the motion trajectories of droplets in the air and the distribution of the flow field.
PIV technology, as a non-contact flow visualization measurement technique, provides high-precision flow velocity distribution information and has been widely used in fields such as fluid mechanics [19], combustion research [20,21], and ocean engineering [22]. Fan et al. [23] used PIV to study the effects of pre-filming air-blast atomizer structures on flow and atomization field characteristics, demonstrating the applicability of PIV in understanding complex flow fields and atomization processes. In the study of droplet deposition, PIV can effectively obtain velocity measurements of droplet flow fields during the deposition process by continuously capturing images of spray movement and better reflecting the droplet trajectories and flow field distribution, which is of great significance for studying how to improve droplet deposition effectiveness. Guan et al. [24] analyzed the impact of various factors, including nozzle height, spray pressure, and pesticide formulation, on the distribution of droplet size and velocity. Nadeem et al. [25] combined PIV technology with image processing techniques to achieve precise detection of sprayer flow rates by calculating the droplet quantity and volume. Gong et al. [26] used PIV technology to study the atomization mechanism of oil-based emulsions, revealing a tear mechanism for perforation generation that produces perforations with surface disturbances and irregular borders. Chang et al. [27] validated the effectiveness of numerical simulation results of rotor flow fields using PIV. This combined approach of PIV technology and numerical simulation provides a comprehensive understanding of flow field characteristics.
Based on the aforementioned research, it can be seen that certain studies have initiated the utilization of PIV technology for studying the droplet deposition process and made certain research progress. However, they overlooked the disturbance effects of rotor airflow on the droplet flow field. It is worth noting that the droplet deposition velocity, as the main intrinsic factor affecting the droplet deposition process, governs the deposition trajectory of the droplet. A higher downward velocity of droplets is more advantageous for rapid deposition into the target area and reduces the likelihood of droplet drift occurrence. At present, there is limited research on the distribution and variation characteristics of droplet deposition movement in plant protection UAV applications. Therefore, analyzing the velocity distribution of different droplet flow fields influenced by rotor airflow using PIV technology is highly significant. This paper uses a laser particle size analyzer to measure the droplet diameters from different nozzles and utilizes PIV technology to obtain the distribution of droplet deposition velocity under the influence of rotor flow fields. By analyzing the characteristics of deposition velocity with influencing factors, including spray pressure, nozzle aperture, and rotor speed, this research aims to reveal the motion mechanics of droplet deposition in aerial spraying operations conducted by plant protection UAVs, improve the comprehension and knowledge of droplet motion, and provide data reference for selecting parameters related to UAV nozzle models, rotor speeds, and spray pressures.

2. Materials and Methods

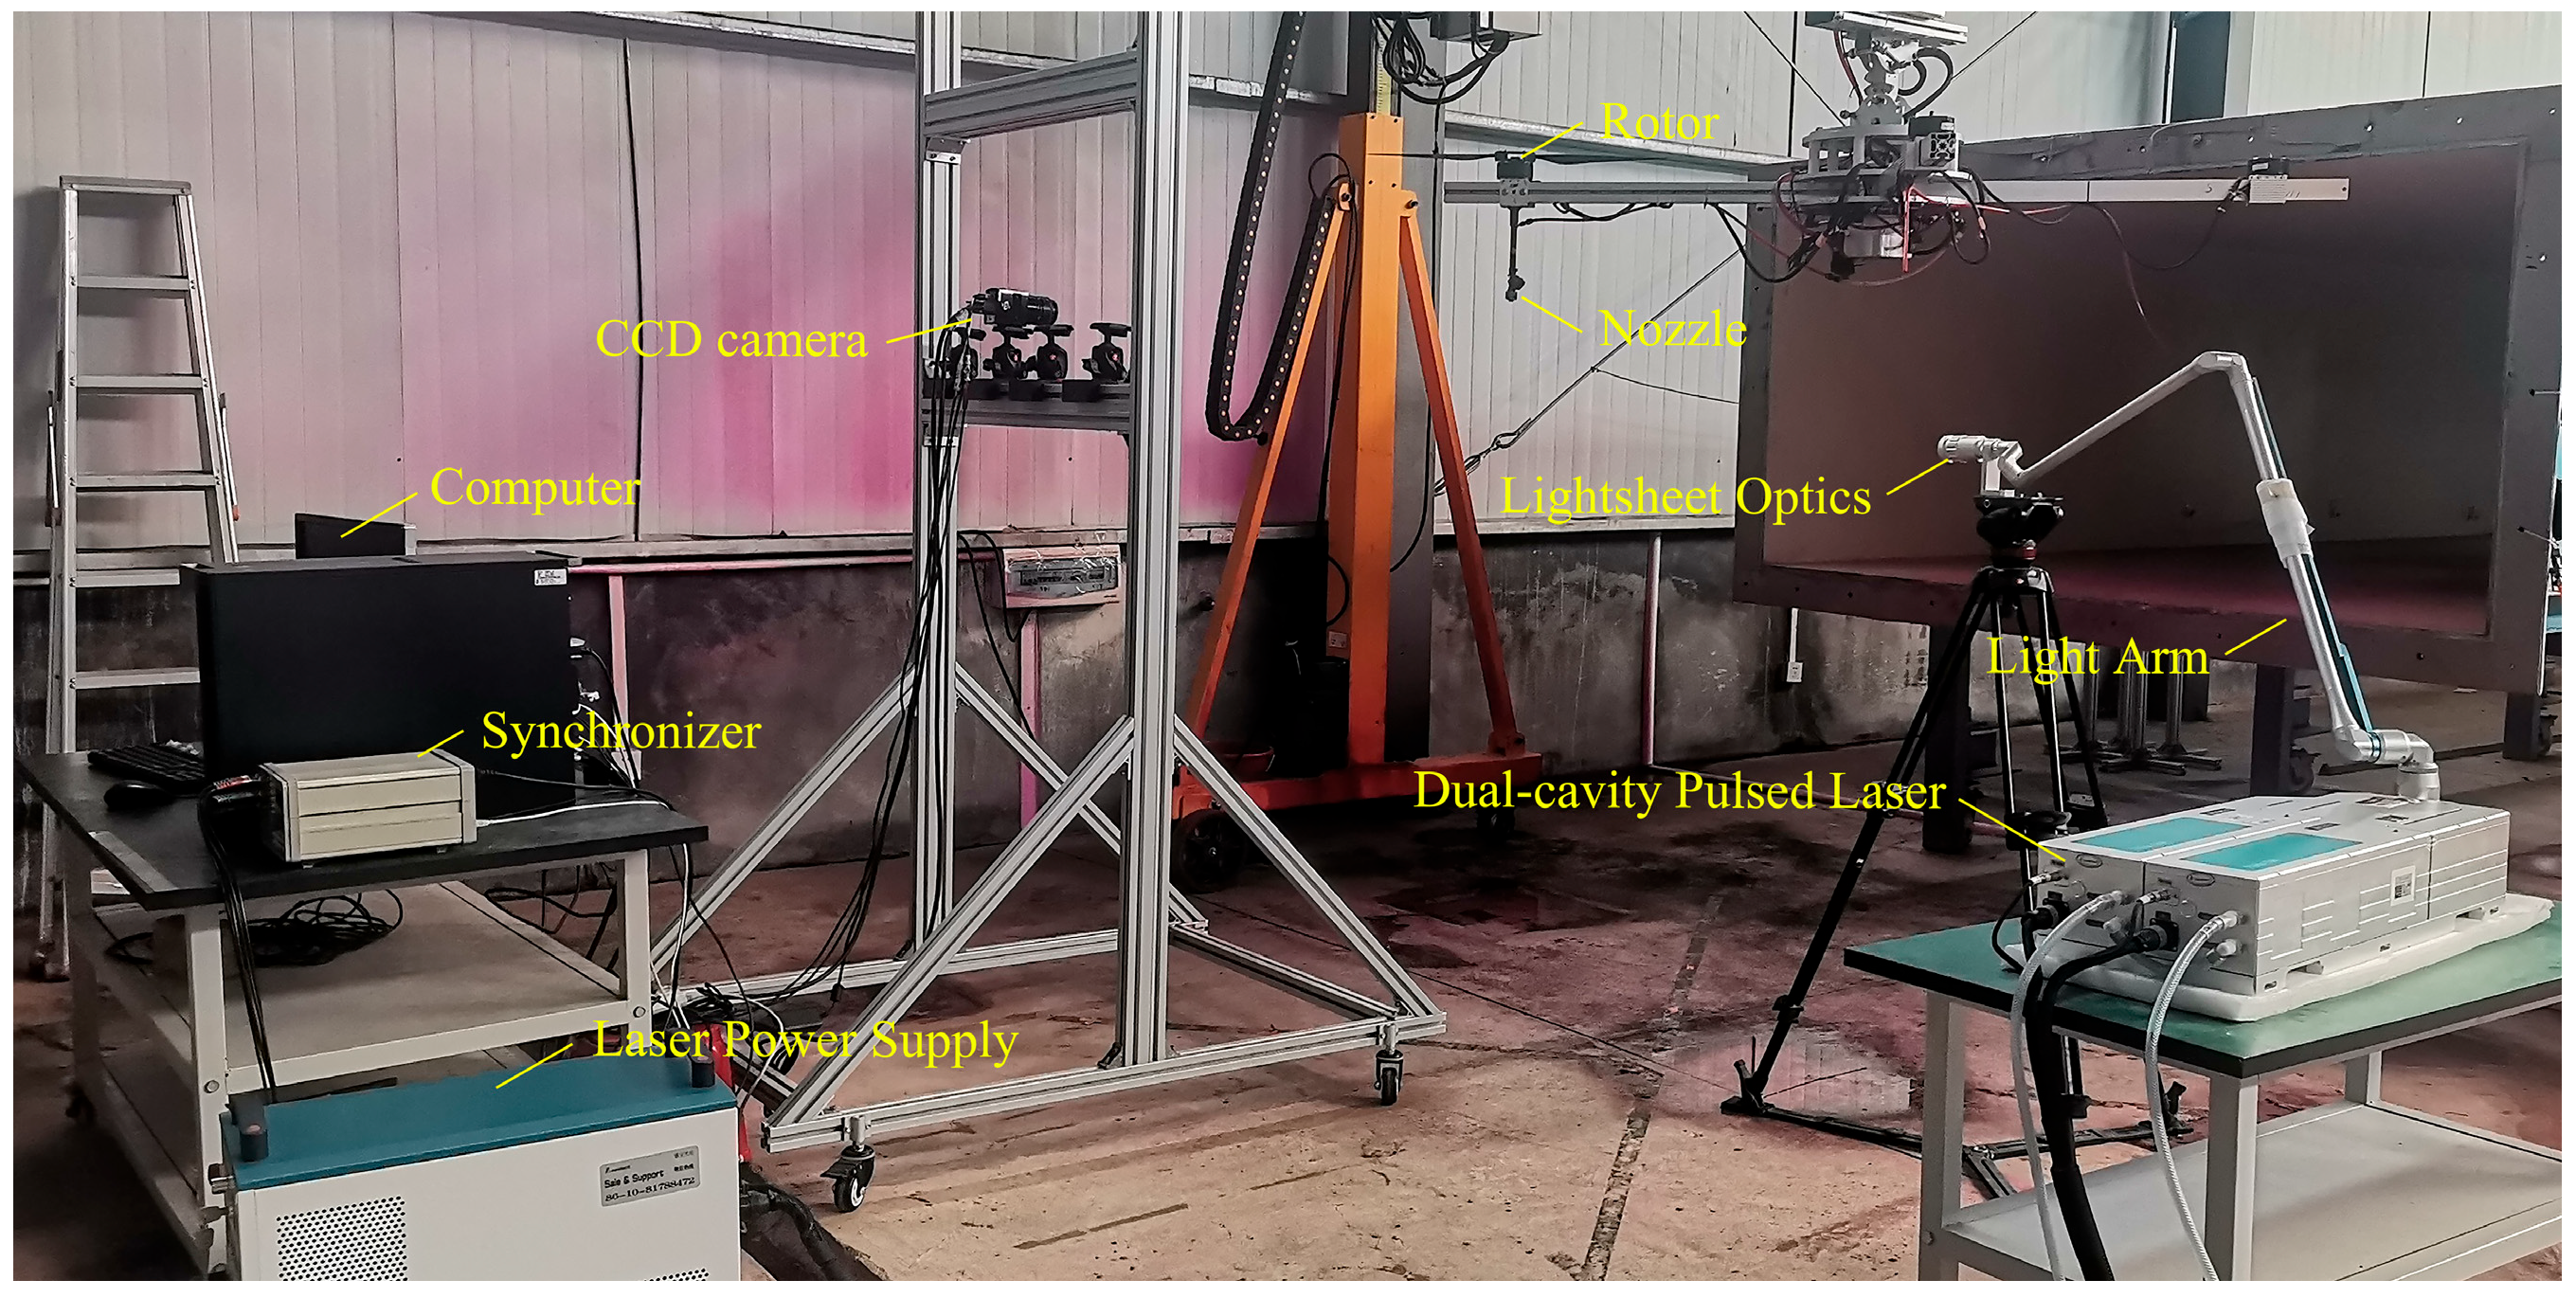
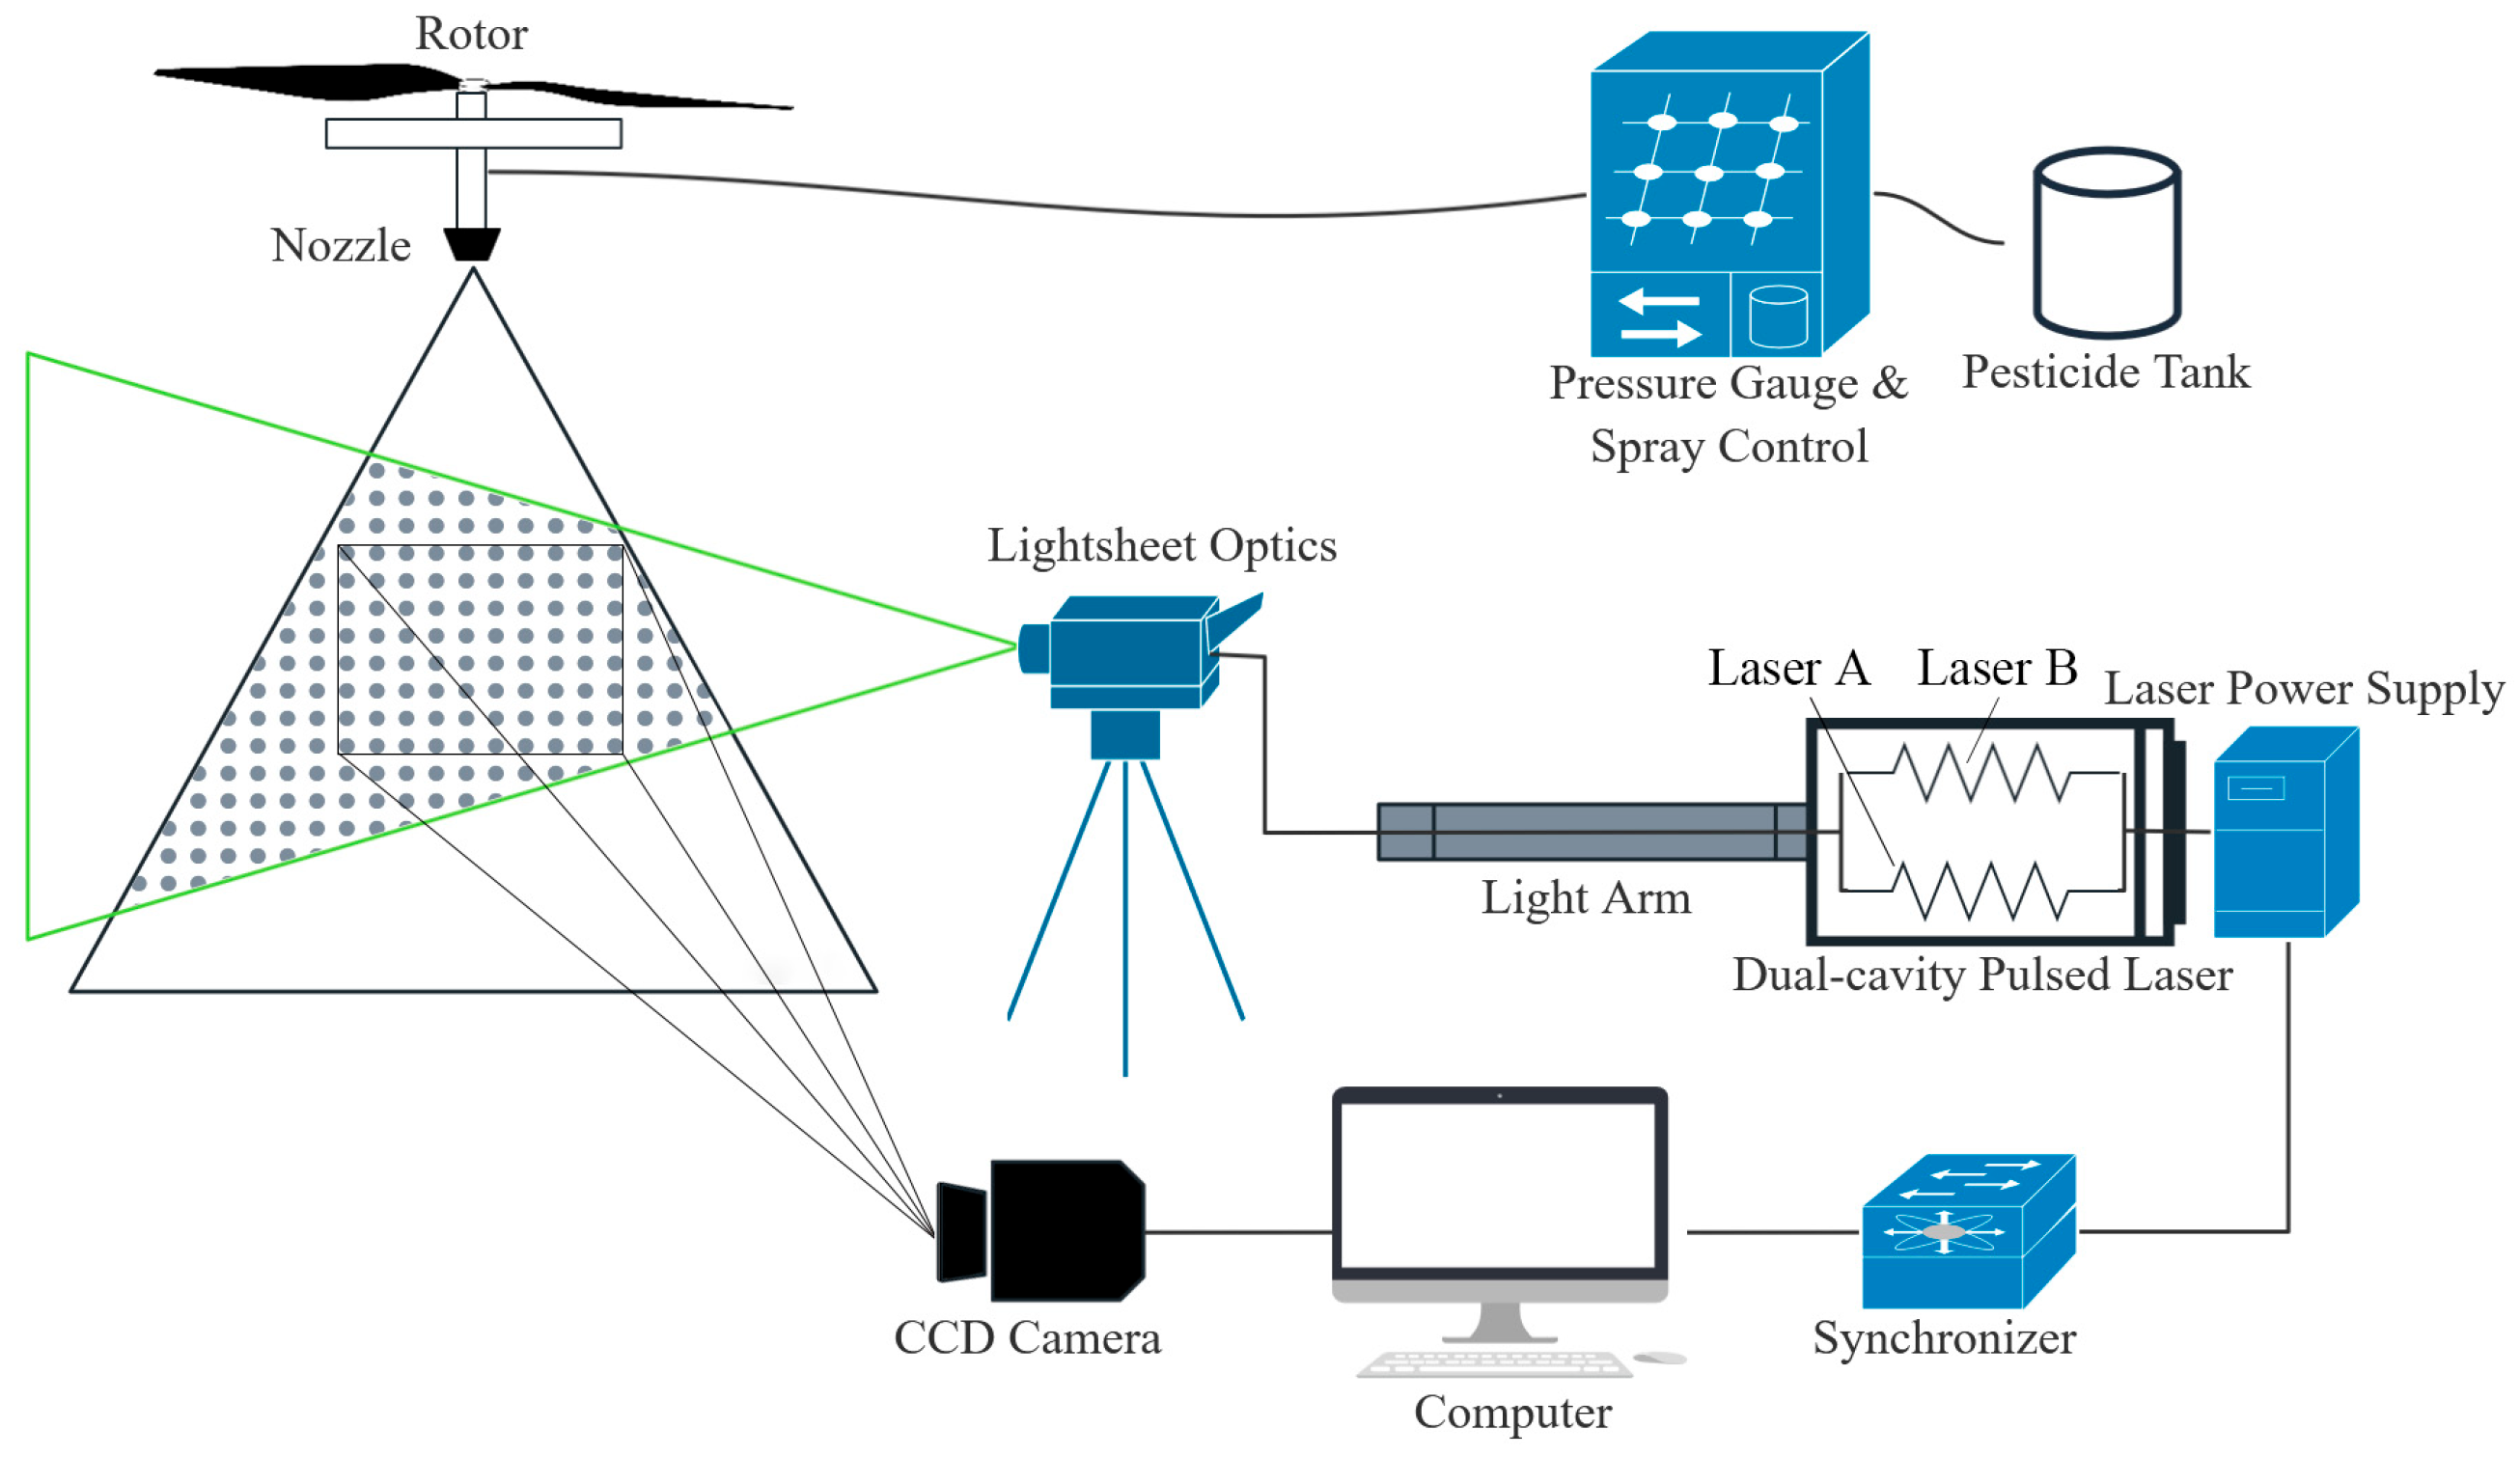
2.1. Instruments and Equipment

In this test, three different nozzle sizes of LU120 series flat spray nozzles (Lechler GmbH, Metzingen, Germany) were selected, which have a uniform spray distribution. The models used are LU120-02, LU120-03, and LU120-04, with a spray angle of 120°. At a pressure of 0.2 MPa, their corresponding flow rates are 0.65, 0.97, and 1.29 L/min, respectively. The nozzles were installed on an indoor spraying system, which mainly consisted of a pesticide tank, pump, flow meter, pressure gauge, and spray control console. The pesticide was pressurized by the pump and delivered to the nozzles through water pipes. After being atomized, the pesticide formed fine droplets, creating a spray flow field. The spray pressure of nozzles could be adjusted by the regulating valve within the range of 0 to 1.2 MPa.
The droplet diameter measurement was performed using the DP-02 laser particle size analyzer (OMEC Instruments Co., Ltd., Zhuhai, China). This device comprises a laser transmitter, a laser receiver, and a data processing system. It characterizes the particle size and distribution by analyzing the intensity distribution of different diffraction patterns collected by the detector. The measurement range of the laser particle size analyzer is from 1 to 1500 μm, with a repeatability accuracy of ±3%.
The two-phase flow UAV spraying platform consists of a spraying system and a rotor platform, as shown in Figure 1. The rotor platform is compatible with various UAV models, such as quadcopters, hexacopters, or octocopters. It can simulate the actual rotor flow field during plant protection UAV operation by controlling and monitoring the rotor speed through a mobile terminal. The spraying system is connected to the UAV rotor platform, with the nozzle located 30 cm below the rotor. The rotor used is from the DJI T30 plant protection UAV with a dimension of 91.44 cm. This test focuses on studying the spraying characteristics of a single nozzle under the influence of a single rotor-generated flow field, without considering the mutual interaction between multiple nozzles and multiple rotors.
The measurement and acquisition of the droplet deposition velocity field were conducted using PIV (TSI Incorporated, Minneapolis, MN, USA), as shown in Figure 2. PIV system mainly consists of dual-cavity pulsed laser, lightsheet optics, laser power supply, light arm, high-resolution inter-frame CCD camera, synchronizer, and computer. The dual-cavity pulsed laser operates at a maximum frequency of 15 Hz, generating two distinct lasers, laser A and laser B, which can emit alternately. Each laser has a maximum single-pulse energy of 2 J and a maximum pulse duration of 10 ns. The PIV system is capable of measuring velocities up to 200 m/s, with a measurement range of at least 600 mm × 400 mm. The synchronizer serves as the timing controller for the PIV system, used to coordinate the operation timing between the dual-cavity pulsed laser generator, high-resolution inter-frame CCD camera, and computer to ensure the accuracy of capture.

2.2. Measurement of Droplet Size

A laser particle size analyzer was used to measure the droplet diameter of three nozzles, with spray pressure parameters set at 0.2 MPa, 0.3 MPa, and 0.4 MPa. The distance between the emitter and receiver of the laser particle size analyzer is 120 cm. The nozzle was installed at the center between the laser transmitter and the receiver, with a distance of 40 cm between the nozzle and the measuring laser beam to ensure complete atomization of the droplets. During the experiment, the laser particle size analyzer was preheated for half an hour before the spray system was activated. Once the spray stabilized (5 s later), droplet diameter data were collected through the data processing system on the computer. According to the experimental parameters set in Table 1, the droplet diameter measurements were conducted in sequence, with each set of experiments repeated three times. Throughout the experiment, the indoor temperature was (26 ± 2) °C and humidity was (45 ± 5)%, meeting the environmental requirements for droplet diameter measurement. The results of the droplet size measurements are shown in Table 2.

2.3. Measurement of Droplet Deposition Velocity Field

In order to understand the characteristics of droplet deposition movement, the PIV system was selected to measure the distribution of droplet deposition velocity in the flow field. The fundamental principle of PIV technology involves illuminating the particles with a pulsed laser, capturing sequential images of the illuminated particles as they move within the flow field. By identifying and tracking individual particle positions across consecutive images through image processing, it becomes possible to analyze particle displacement and calculate velocity. The test was conducted in the wind tunnel laboratory of South China Agricultural University, with the test schematic illustrated in Figure 3.
In PIV technology, the selection and addition of tracer particles are crucial. High-quality tracer particles [28] require, (1) a density as close as possible to that of the test fluid; (2) a relatively small size; (3) a circular shape and uniform size distribution; and (4) high light-scattering efficiency. This study focuses on water droplets atomized by flat spray nozzles, which have small average diameters, relatively circular shapes, uniform distributions, and good light-scattering capabilities, resulting in a good imaging visualization effect. Therefore, the droplets themselves can be used as tracer particles for the test to directly measure the velocity information of the spray flow field without adding any other tracer particles.
Considering the equipment parameters and actual operational conditions, the spray pressure is selected as 0.2, 0.3, and 0.4 MPa, the rotor speed is chosen as 0, 1000, 1500, and 1800 r/min, as shown in Table 1.
Before the test, ensure that the hardware components of the PIV system are properly connected. Check the cooling water of the laser generator’s power supply (ensuring it is at least 3/4 full) and adjust the camera aperture to its minimum setting. Sequentially power the laser generator, synchronizer, and computer, and adjust the position of light sheet optics to align the generated laser with the atomization plane formed by the nozzle. Then, open the Insight4G software (v.11.2; TSI Incorporated, USA) for experiment calibration, adjust the position and focal length of the CCD camera so that it is perpendicular to the laser plane, and the nozzle is located at the top-center of the camera’s viewfinder. In this test, the distance between the camera and the nozzle atomization plane is 1000 mm; pulse frequency is 5 Hz, and time interval between Laser A and Laser B is 50 μs. The droplet deposition images were captured after the droplet flow field state stabilized.
The initial detecting position for droplet velocity was chosen directly below the nozzle at a distance of 65 mm to make sure droplets were sufficiently atomized. The region of interest (ROI) area is 400 mm × 420 mm, as depicted in Figure 4. For each designated operating condition, the experiment captured 200 sequential instantaneous images of the droplet flow field, repeated three times.

2.4. Data Processing

2.4.1. Processing of Droplet Diameter

The droplet size, as an important indicator for measuring the atomization characteristics of droplets, mainly includes the volume diameters (Dv10, Dv50, and Dv90) and the relative span (RS) of the droplet spectrum. Among them, Dv50 is the droplet diameter corresponding to 50% of the total droplet volume, which is considered an important indicator that best represents the size of the droplet particle size parameter; The relative span of the droplet spectrum is used to characterize the uniformity of droplet atomization, which can be calculated by the ratio of the absolute width of the droplet spectrum to the median diameter of the droplet volume. The calculation formula is RS = (Dv90 − Dv10)/Dv50. The measurement results of droplet size are shown in Table 2.

2.4.2. Visualization Processing of Droplet Deposition Movement

The images of droplet deposition captured by the PIV system are automatically transferred and saved to the computer, and the Insight 4G software is used to calculate the velocity vector data. The original image is shown in Figure 5a. To ensure the effectiveness of the data, the captured images must have a uniform particle distribution and sufficient particle concentration. In the Insight 4G software, the query window size of 64 × 64 pixels and a 25% overlap spacing are set to minimize particle correlation noise and ensure that the effective particles in each query window are between 8 and 20. Additionally, a standard deviation filter is used to reduce errors and outliers. Finally, the calculated droplet velocity data are imported into Tecplot Focus 2013R1 software (Tecplot Corporation, Bellevue, WA, USA) for visualization processing; the result is shown in Figure 5b.
In order to provide a more intuitive and quantitative description of the velocity changes of droplets under different conditions, Origin 2017 software (OriginLab Corporation, Northampton, MA, USA) was used to plot the velocity variation line graph of droplets based on droplet velocity data in the vertical direction at the nozzle center position (x = 150 mm). In addition, considering that the droplet velocity gradually decreases with the settling distance and time and that droplets with too small velocities are easily affected by the external environment and drift during the settling process, this paper selects the decay rate of droplet velocity (K) as one of the indicators to measure the characteristics of droplet movement, and its calculation formula is as follows:
K = ( V m V n ) / V m ,
where V m is the droplet velocity at a distance m from the nozzle, in m/s; V n is the droplet velocity at a distance n from the nozzle, in m/s.
In order to analyze the influence of different factors on the research results and further prove the influence of droplet size and spray pressure parameters on the movement characteristics of droplet deposition, the initial velocity of droplet movement and the velocity decay rate of droplet movement were taken as the result indicators, and SPSS software (v22.0; IBM Corporation, Armonk, NY, USA) was used for significance analysis. Two-factor variance analysis and Gabriel post-comparison test were conducted, and the significance level was 95%.

3. Results

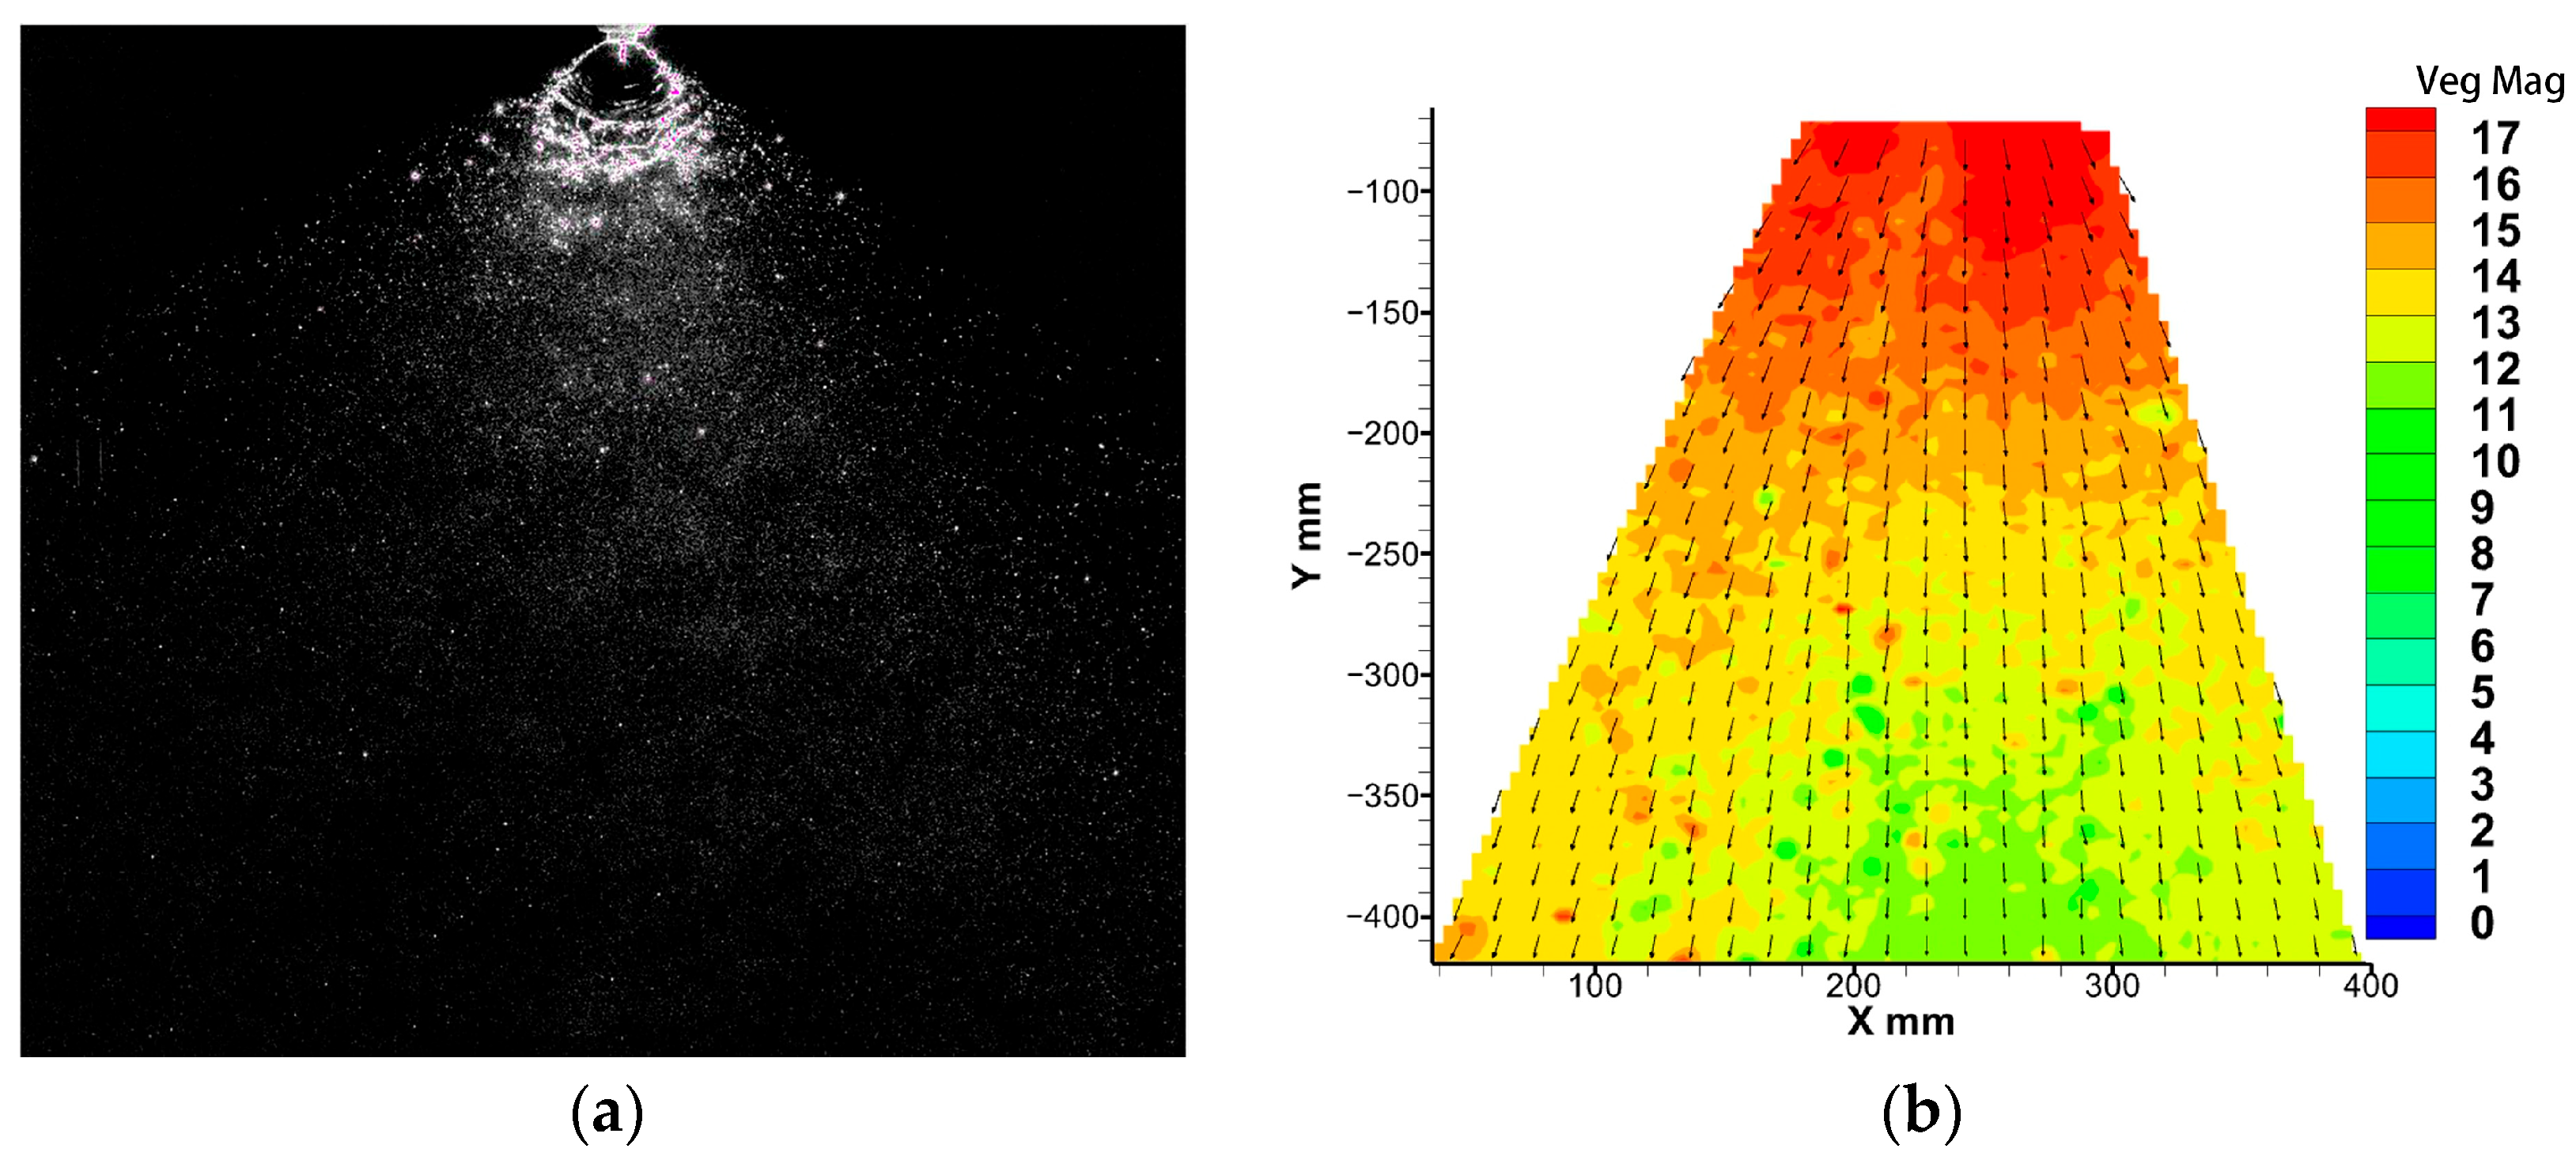
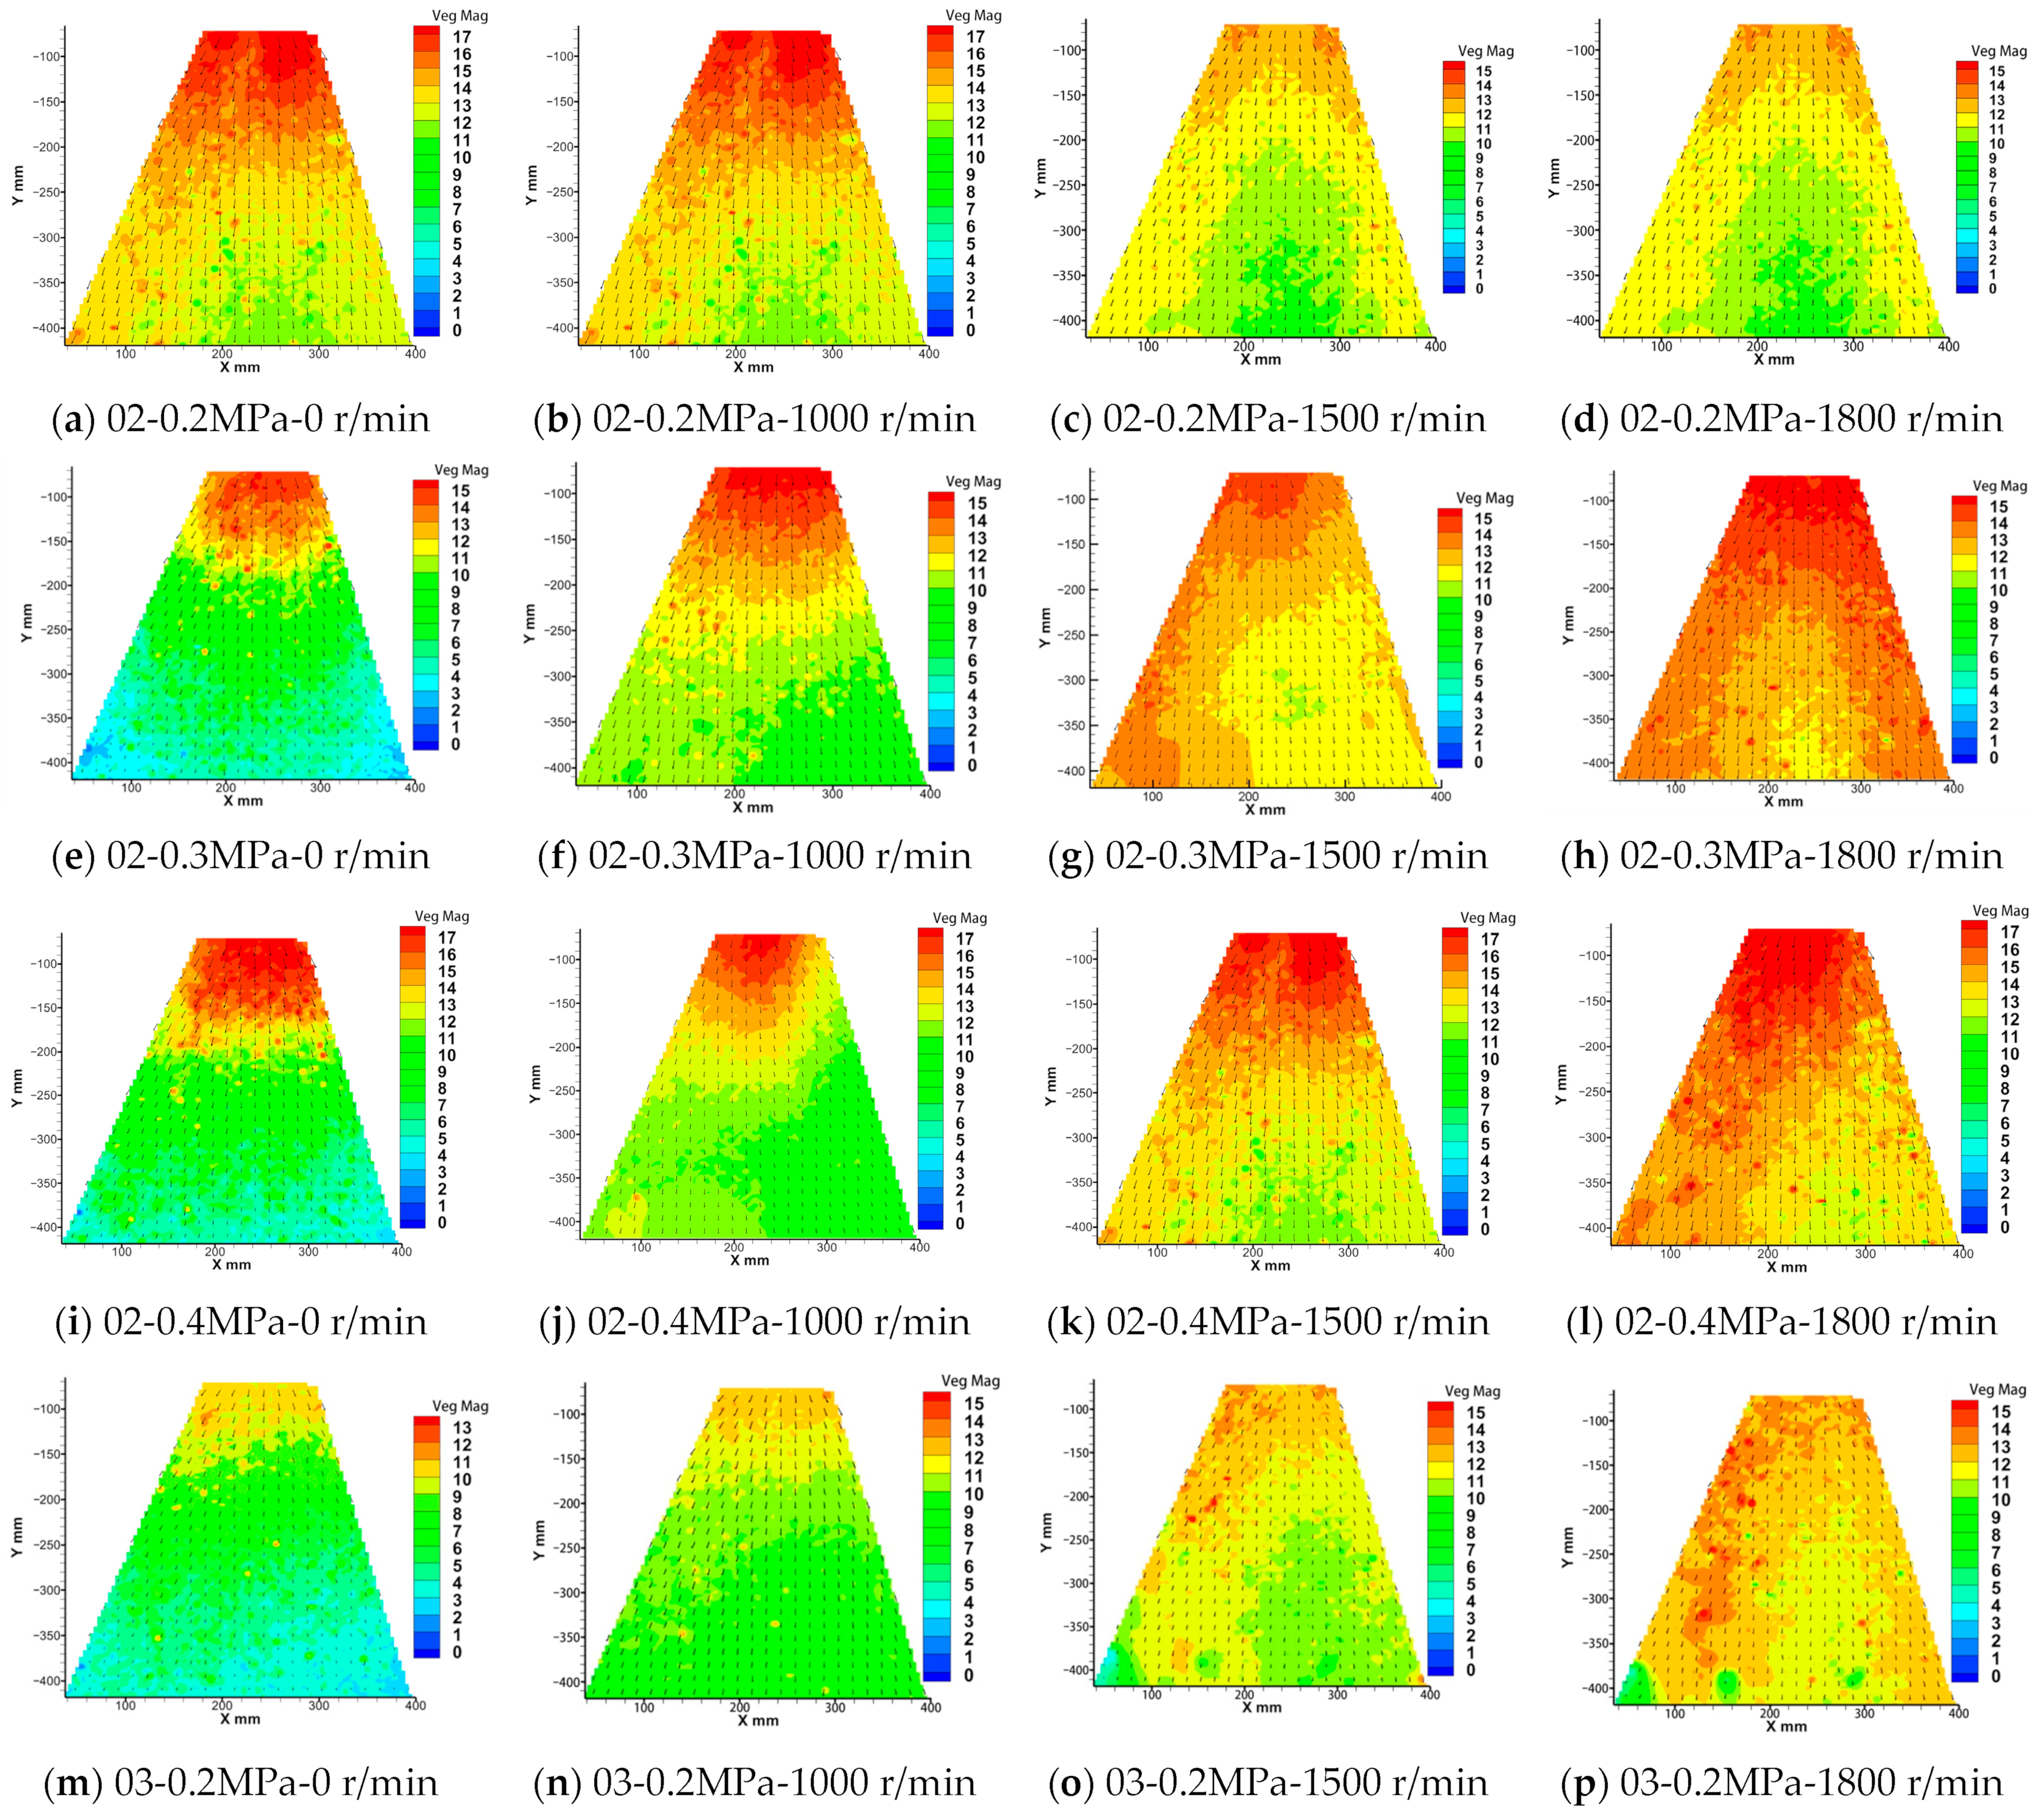
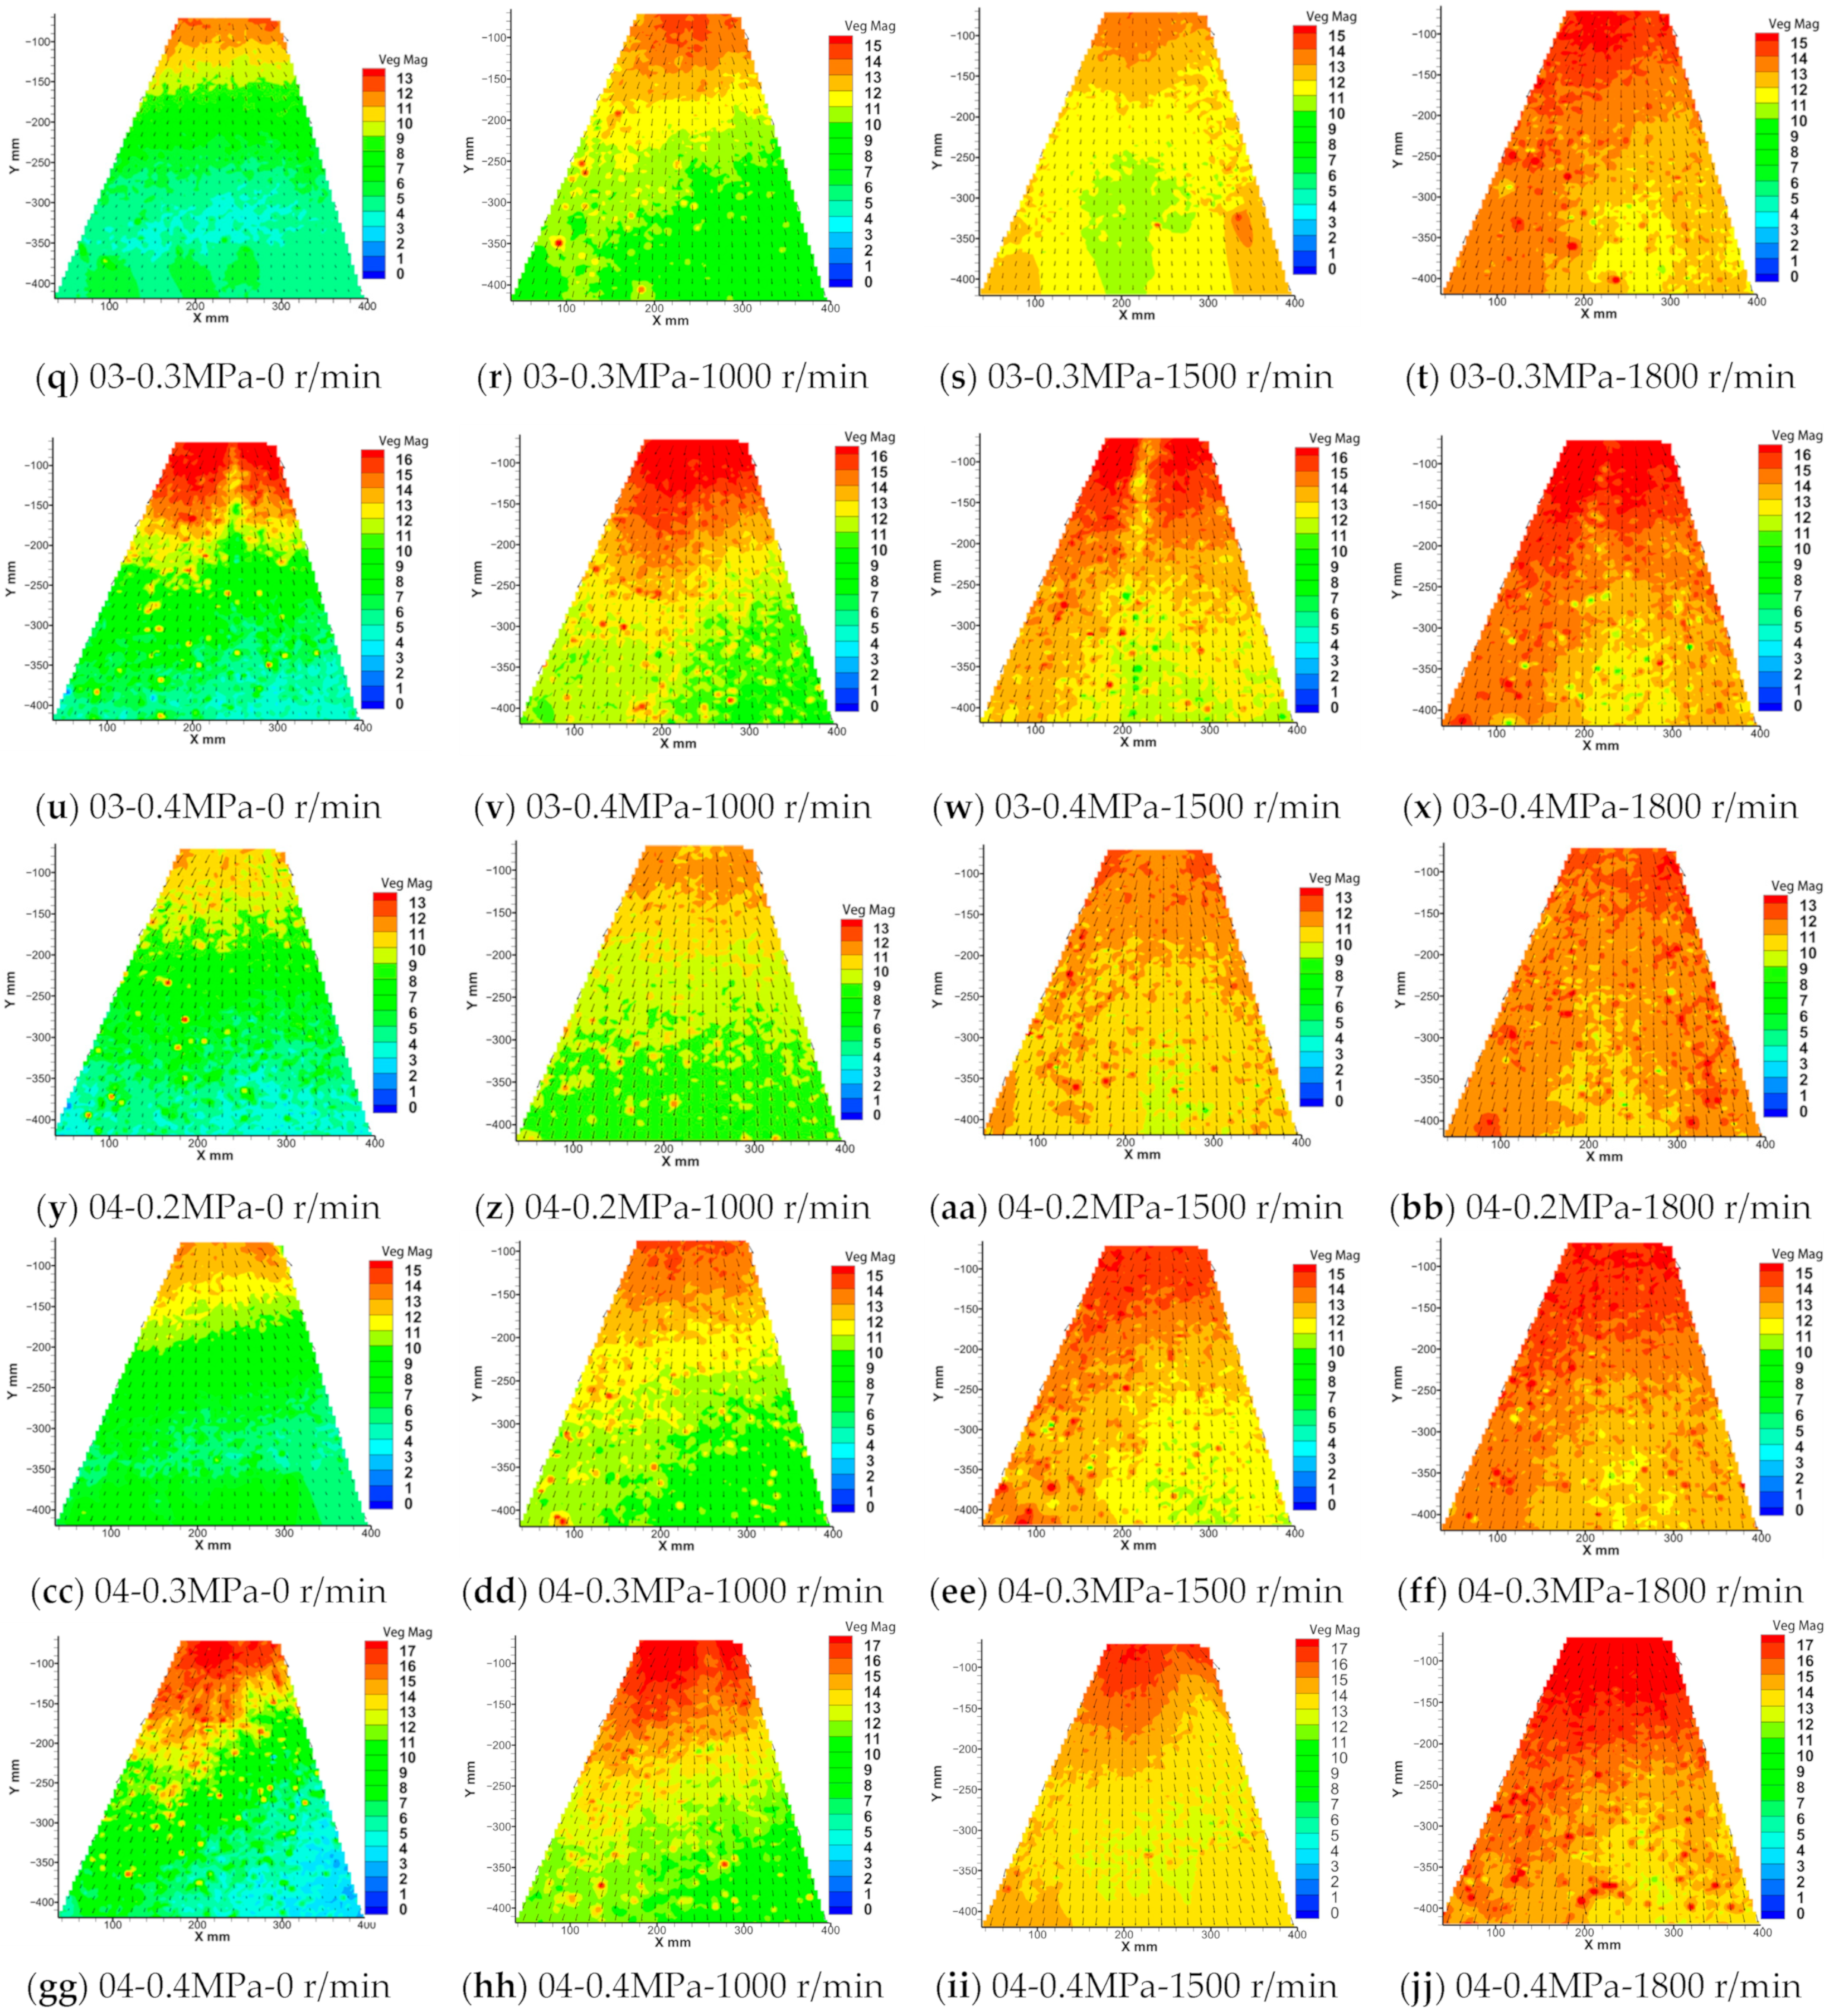
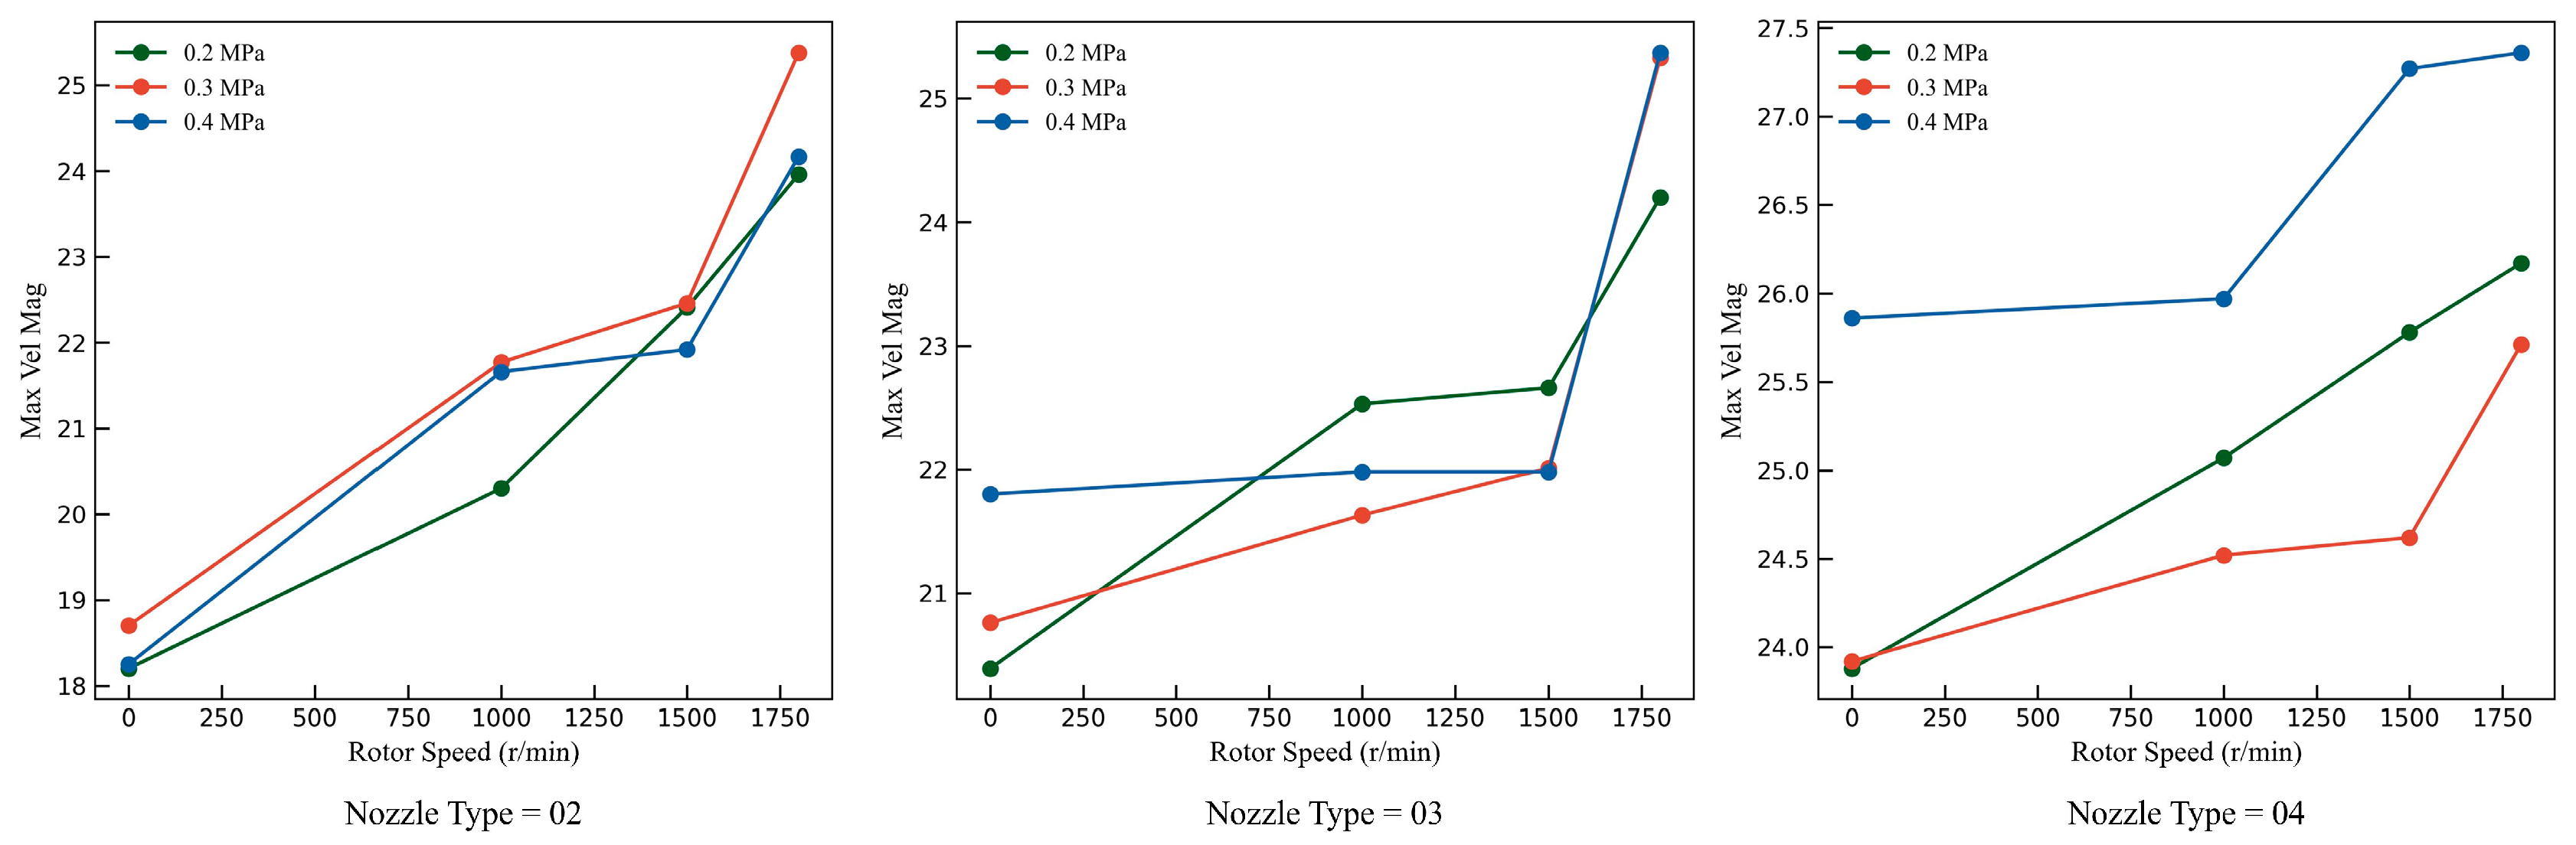
3.1. The Distribution of Droplet Velocity Field

Spray pressure and nozzle size will jointly affect the size of the droplet, and the droplet size parameters are closely related to the droplet settling speed and deposition drift rate, which can directly affect the spray quality and operation effect of the plant protection UAV [29].
It can be seen from Table 2 that with the increase in spray pressure, the volume median diameter (Dv50) shows a decreasing trend, that is, smaller droplets were generated. Moreover, this trend becomes increasingly significant as the nozzle size increases. Under the same spray pressure, a larger nozzle size tends to produce a higher Dv50 value, indicating that a larger nozzle size generates relatively larger droplets.
The distribution of the droplet velocity field under different nozzle sizes, spray pressures, and rotor speeds is shown in Figure 6. Overall, it can be observed that the droplet deposition velocity is highest at the initial position (y = 0) and gradually decreases as the distance from the initial position increases. This is because the droplets acquire initial kinetic energy upon being ejected from the nozzle, and then the droplets experience a deceleration caused by air resistance as they travel through.
Comparing the droplet velocity field under the same spray pressure and nozzle model, the overall droplet velocity and the distribution range of high-speed (>12 m/s) particles significantly increase with the increase in rotor speed. When the rotor speed is 0 r/min, the high-speed region is mainly concentrated near the nozzle, and the area is relatively small. However, when the droplets are influenced by the rotor flow field, the deposition speed and high-speed region gradually increase. When the rotor speed increases to 1800 r/min, the range of high-speed droplets extends to 420 mm below the nozzle. This is because the rotor flow field provides a downward force on the droplets, significantly increasing the number and distribution range of high-speed droplet particles. The stronger the rotor flow field, the larger the high-speed region of droplet deposition.
It can also be observed that the droplet deposition is significantly affected by the spray pressure. Under the same rotor flow field and nozzle model, as the spray pressure increases, the speed of the droplets near the nozzle also increases noticeably. Taking the droplet velocity distribution at a nozzle diameter of 04 and a rotor speed of 0 r/min as an example, when the spray pressure is 0.2 MPa, the maximum droplet velocity is around 11 m/s. When the spray pressure is increased to 0.4 MPa, the maximum droplet velocity also increases to approximately 17 m/s, and the range of high-speed droplets extends to around 250 mm below the nozzle.
To further analyze the impact of various factors on the deposition processes of droplets, Figure 7 compares the maximum velocity magnitude of each test group. With a constant nozzle type, as spray pressure increases, the droplet size gradually decreases, and the maximum movement speed of the droplet also increases, although the increase rate is relatively low. Using the 02 nozzle, increasing the spray pressure from 0.2 MPa to 0.3 MPa and 0.4 MPa resulted in maximum droplet velocity increases of 2.75% and 0.27%, respectively. Using the 03 nozzle, increasing the spray pressure from 0.2 MPa to 0.3 MPa and 0.4 MPa resulted in maximum droplet velocity increases of 1.81% and 6.92%, respectively. For the 04 nozzle, an increase in spray pressure from 0.2 MPa to 0.3 MPa and 0.4 MPa led to maximum droplet velocity increases of 0.17% and 8.29%, respectively. The maximum speeds for the 04 nozzle at spray pressures of 0.2 MPa and 0.3 MPa were quite similar, at 23.88 m/s and 23.92 m/s, respectively. This minimal difference could be attributed to the inadequate atomization under low pressure for larger diameter nozzles, resulting in a larger droplet size and insufficient initial kinetic energy of the droplets.
At a rotor speed of 0 r/min, as the nozzle diameter increases, the droplet size increases, and the maximum droplet velocity gradually increases. At a spray pressure of 0.2 Mpa, changing the nozzle model from 02 to 03 or 04 results in maximum droplet velocity increases of 12.03% and 31.21%, respectively. At a spray pressure of 0.3 Mpa, changing the nozzle model from 02 to 03 or 04 leads to increases in maximum droplet velocity by 11.02% and 27.91%, respectively. At a spray pressure of 0.4 Mpa, changing the nozzle model from 02 to 03 or 04 results in maximum droplet velocity increases of 19.45% and 41.70%, respectively. It can be inferred that in a static environment without the influence of rotor airflow, the movement speed of small droplets is easily affected by air drag and the forces exerted by other droplet groups in the environment, whereas larger droplets are less affected. Therefore, the maximum droplet velocity increases with the enlargement of the particle diameter.
Under the same spray pressure, the maximum speed of droplets increases with the rotor speed. When the rotor speed increased from 0 r/min to 1800 r/min, the average increase in the maximum velocity of droplets from nozzles 02, 03, and 04 was 33.26%, 19.02%, and 7.62%, respectively. As the nozzle diameter increases, the increment in the maximum droplet velocity with changes in rotor speed experiences a decrease. This indicates that droplets emitted from nozzles with larger diameters have larger droplet sizes, requiring sufficient forces from the rotor flow field to accelerate the droplet deposition. For nozzles with diameters of 03 and 04, when the spray pressure increased from 0.3 MPa to 0.4 MPa, the maximum deposition speed showed a significant increase. This is primarily because the increase in spray pressure can reduce droplet size to some extent. Under the same rotor flow field, the maximum speed of smaller droplets varies more significantly.

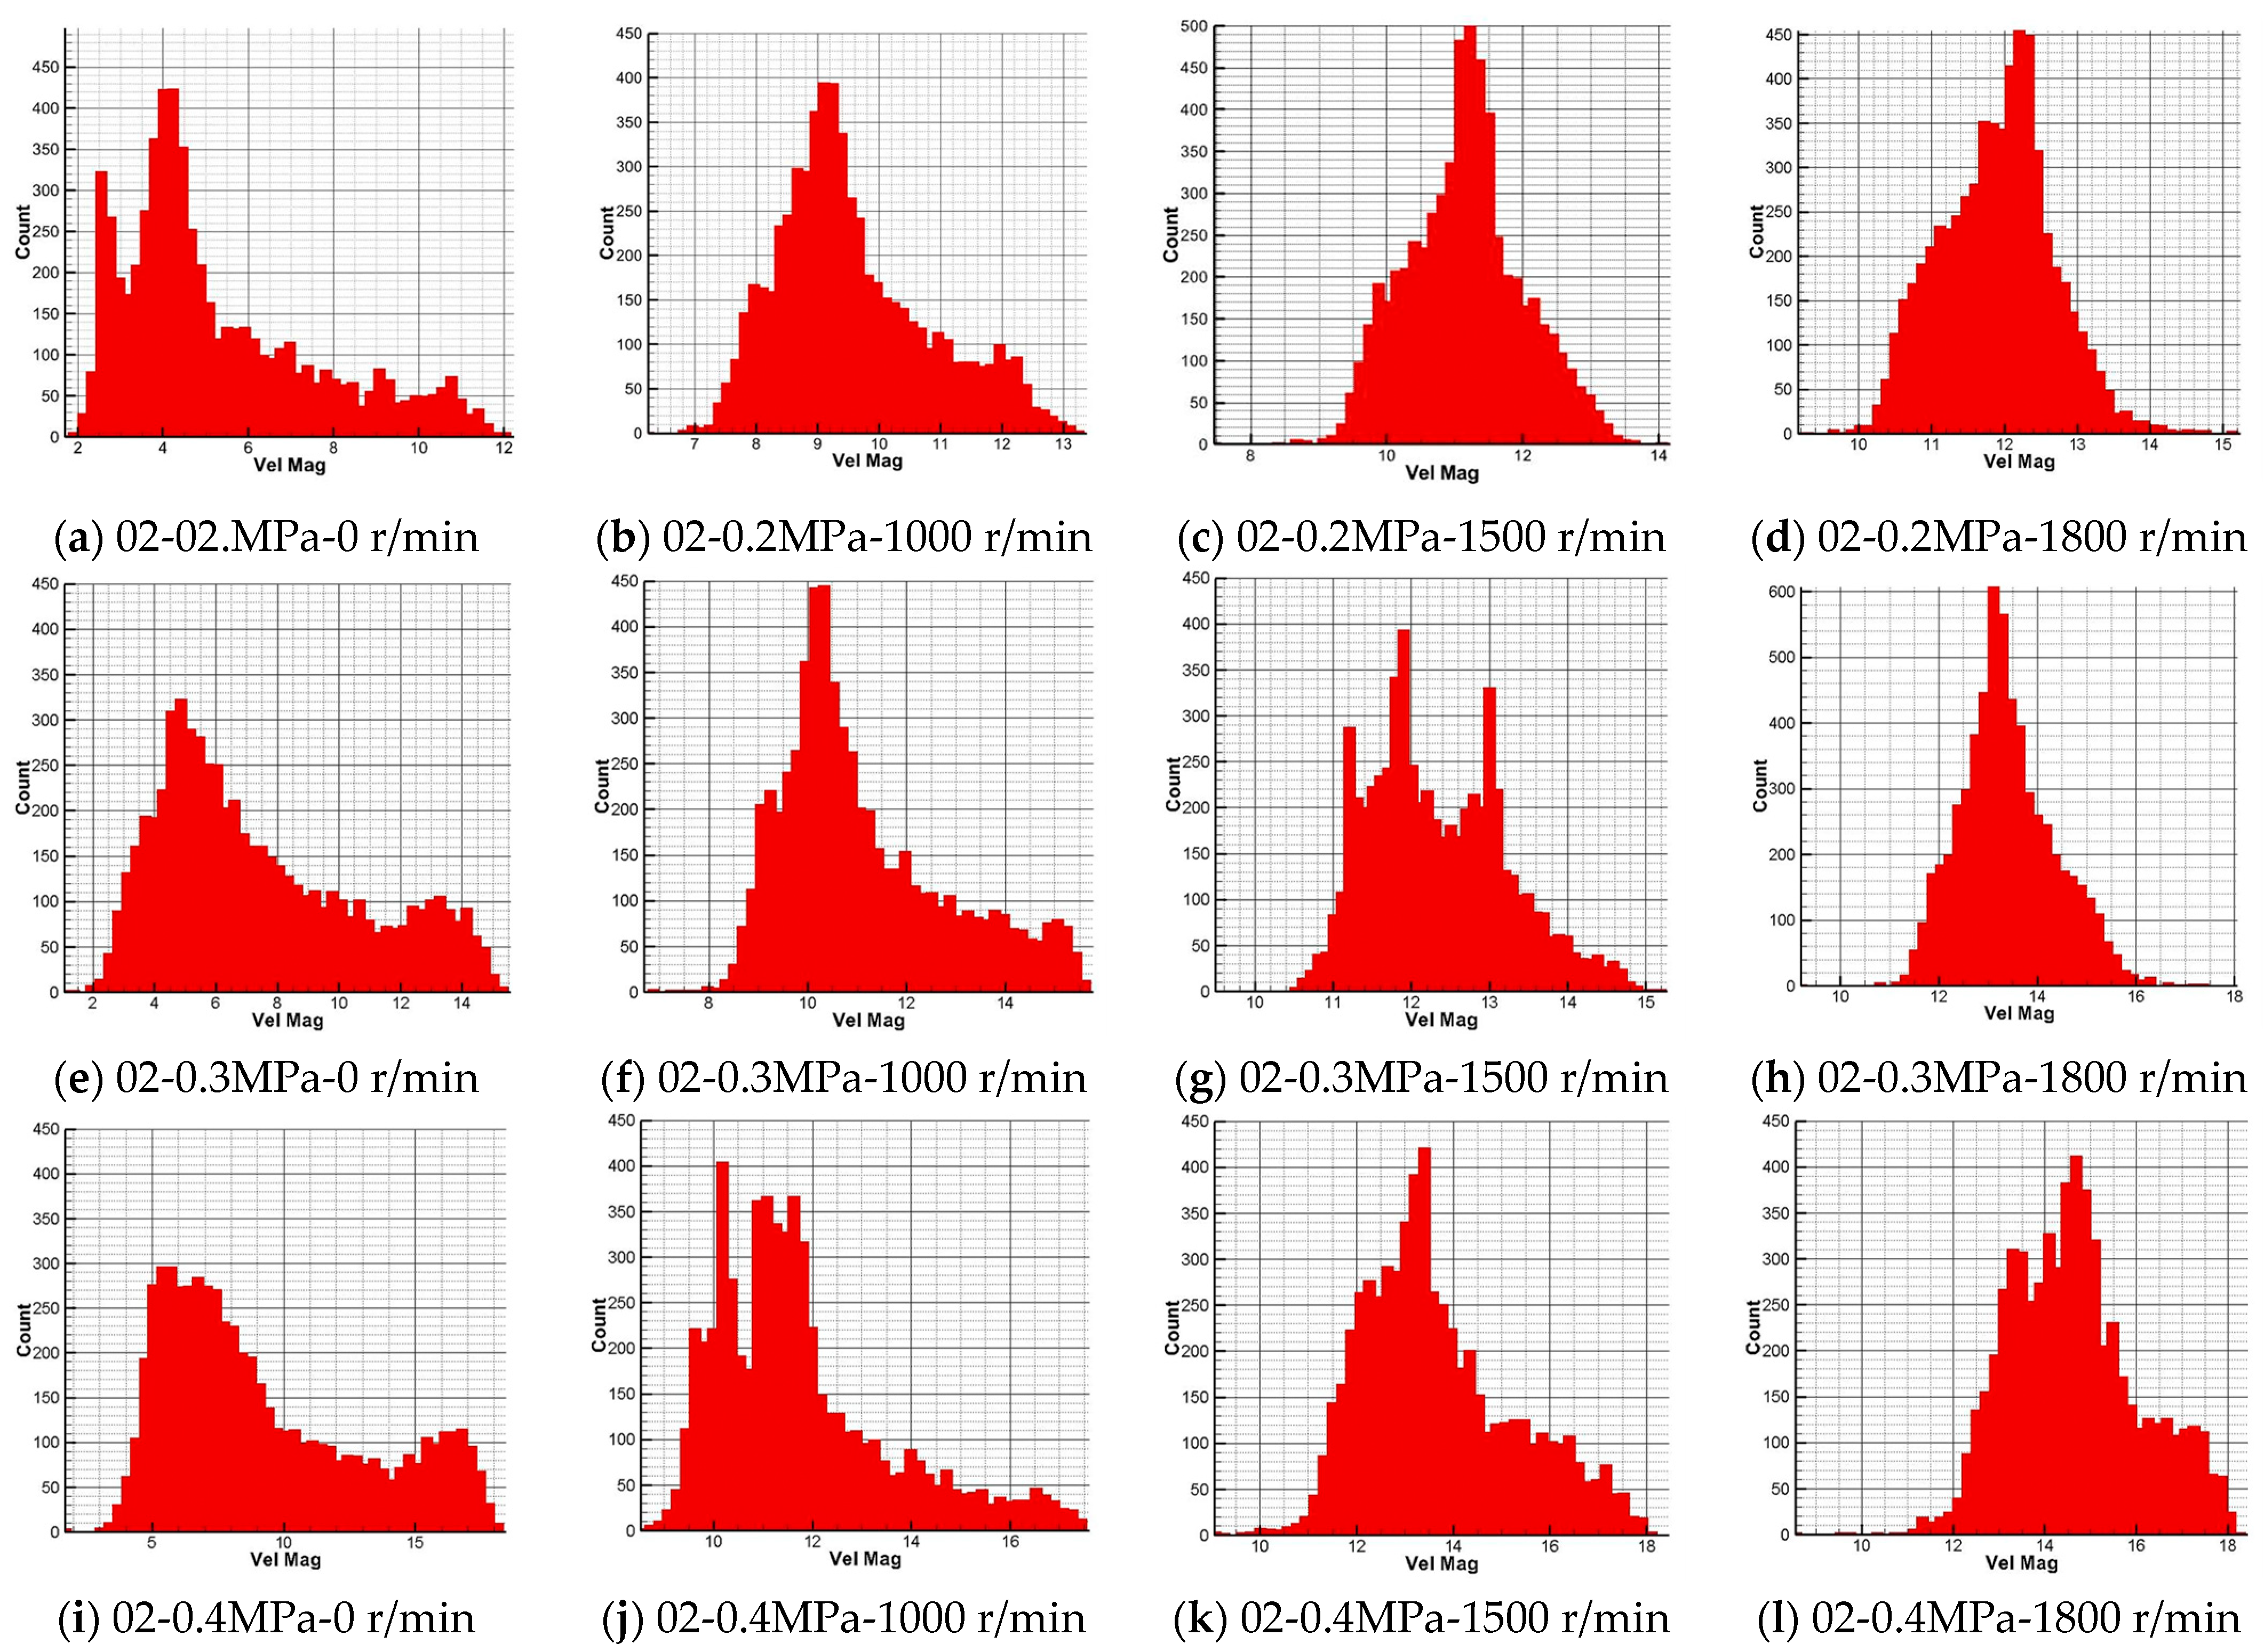
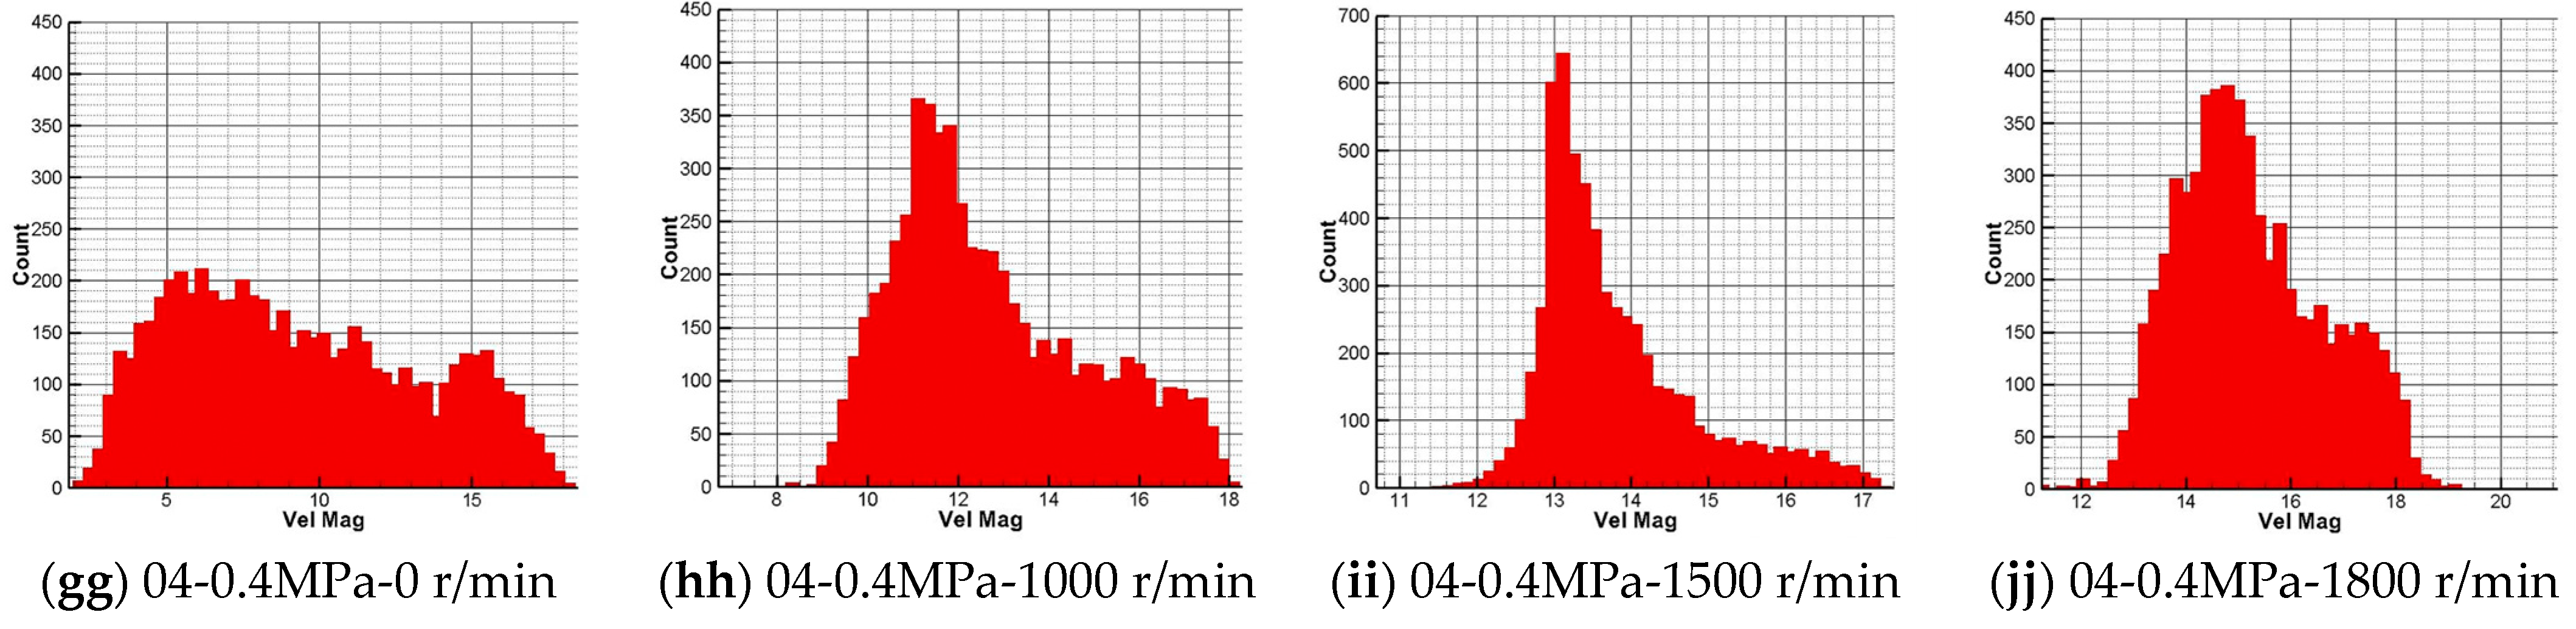
3.2. The Distribution of Droplet Quantities at Different Speeds

Figure 8 illustrates the distribution of droplet quantities at various speeds under different experimental conditions. Based on the experimental data, droplet velocities are categorized as follows: Speeds ranging from 0 to 6 m/s are defined as low-speed droplets; speeds from 6 to 12 m/s are termed medium-speed droplets; and speeds exceeding 12 m/s are classified as high-speed droplets.
It can be observed from Figure 8 that as the pressure increases from 0.2 MPa to 0.4 MPa, the overall distribution also shifts to the right. For example, when considering nozzle 03 at a rotor speed of 1500 r/min, the peak speed gradually increases from 10 m/s to 11.5 m/s and 13 m/s as the spray pressure increases, while the overall distribution pattern remains almost the same. The results indicate that with the increase in spray pressure, the droplet deposition velocity is higher, which aligns with the findings from the distribution of the droplet velocity field.
When the rotor speed is 0 r/min, the distribution of droplet quantity at different speeds exhibits a “one higher main peak on the left and one lower secondary peak on the right” pattern. The main peak appears in the low-speed droplet range, approximately between 5 and 6 m/s; the secondary peak appears in the medium-high-speed droplet range, roughly between 10 and 15 m/s. This segment primarily consists of droplets near the nozzle, which retain a relatively high deposition velocity after being emitted. Overall, the droplet velocities are mainly distributed within the range of 2–16 m/s, with the majority being low-speed droplets, followed by medium-speed droplets, and the fewest being high-speed droplets. However, as the spray pressure and nozzle diameter increase, the number of low-speed droplets gradually decreases, while the number of medium-high-speed droplets begins to rise.
When the rotor speed is 1000 r/min, the distribution of droplet velocities is similar to that at 0 r/min, but the entire distribution shifts rightward along the x-axis. The main peak appears in the medium-speed droplet range with an increased peak value, reaching 350–400 droplets. A secondary peak appears in the high-speed droplet range, with the peak value remaining relatively constant at approximately 100–150 droplets. Most droplet velocities are distributed within the range of 6–14 m/s, with the highest number of droplets in the medium-speed range. This indicates that the rotor flow field at 1000 r/min provides the droplets with more initial kinetic energy, thereby increasing their overall deposition speed.
As the rotor speed continues to increase, the distribution of droplet velocities begins to assume a normal distribution shape, with a narrower speed range and higher peak values. This suggests that the rotor flow field causes the previously dispersed speed distribution to become more concentrated and uniform. When the rotor speed increases to 1500 r/min, the peak droplet velocity is observed within the range of 11.5–12.5 m/s, with the peak quantity being about 400–700 droplets. The overall droplet velocity ranges from 9 to 15 m/s. At a rotor speed of 1800 r/min, the peak droplet velocity appears within the range of 11.5–14 m/s, with the peak quantity being approximately 400–800 droplets, and the overall droplet velocity is primarily concentrated within the range of 12–18 m/s, with the highest number of droplets in the high-speed range. Additionally, it can be observed that the speed distribution range at 1800 r/min is narrower than that at 1500 r/min, and the normal distribution pattern is more pronounced, indicating a more concentrated droplet velocity distribution at this speed.
In summary, as the rotor speed increases, the intensity of the rotor flow field gradually strengthens, resulting in an increase in the deposition speed of the droplets under its influence. This leads to a more concentrated and uniform distribution of droplet velocities, enabling most droplets to rapidly deposit onto the target crops and reducing the risk of pesticide drift.

4. Discussion

To further analyze the influence of rotor speed on the movement characteristics of droplet deposition in the rotor flow field, the droplet velocity at different heights along the vertical direction at the nozzle center position (x = 220 mm) was selected. According to formula (1), the corresponding droplet velocity and the average decay rate of droplet velocity were calculated. A variance analysis and Gabriel post-comparison test were conducted, and the results are shown in Table 3.
Table 3 presents the result of multifactor analysis of variance (ANOVA) regarding the effects of rotor speed on droplet velocity and decay rate. At a significance level of 0.05, there is no interaction effect between experimental factors, and rotor speed has a significant impact on droplet velocity and decay rate. Therefore, the main effects of rotor speed on droplet velocity and decay rate are analyzed separately; Figure 9 shows the results of multiple comparative analyses of rotor speed on droplet velocity and droplet velocity decay rate.
When the rotor speed is 0, 1000, 1500, and 1800 r/min, the average droplet velocity is 8.76 m/s, 11.5 m/s, 12.3 m/s, and 13.29 m/s, respectively. As the rotor speed increases, the droplet velocity also increases accordingly; The rotor speed has a significant impact on the droplet velocity (p = 0.017), and there are significant differences in droplet velocity between different rotor speed conditions. The largest increase in droplet velocity occurred when the rotor speed increased from 0 r/min to 1000 r/min, with an increase of 2.74 m/s; This indicates that the rotor flow field generated by the rotor speed has a significant impact on the increase of droplet velocity. As the rotor speed continues to increase, the increase in droplet velocity slows down, both at around 1 m/s.
The average decay rates of droplet velocity at rotor speeds of 0, 1000, 1500, and 1800 r/min are 36.72%, 20.00%, 15.47%, and 13.21%, respectively. As rotor speed increases, the decay rate of droplet velocity gradually decreases. Rotor speed significantly affects the decay rate of droplet velocity (p = 0.039), showing significant differences in decay rates under different rotor speed conditions. The largest reduction in the decay rate of droplet velocity occurs as rotor speed increases from 0 r/min to 1000 r/min, reaching up to 16.72%. However, as rotor speed further increases, the decreasing trend in the decay rate of droplet velocity slows down to below 5%. This demonstrates that the rotor flow field generated by rotor speed has a significant impact on the decay rate, which helps to mitigate the reduction in droplet velocity, enabling droplets to deposit quickly in the target area.

5. Conclusions

This study utilizes PIV technology to obtain data on water droplet deposition movements under the influence of rotor flow fields and investigates the variations and trends in droplet deposition velocities with changes in rotor speed, spray pressure, and nozzle size. The conclusions are as follows:
(1)
The droplet deposition velocities and the region of high-speed droplet distribution increase with the increase of rotor speeds, spray pressures, and nozzle sizes. As the rotor speed increases from 0 r/min to 1800 r/min, the average increases in maximum droplet deposition velocity for three different nozzle diameters are 33.26%, 19.02%, and 7.62%, respectively.
(2)
The rotor flow field significantly increases the number of droplets with high deposition velocities. With increasing rotor speed, the quantity of high-speed droplets increases, and the distribution range of droplets with different deposition velocities narrows. Droplets with more dispersed velocities become more concentrated.
(3)
Rotor speed notably affects both the droplet deposition velocity and the rate of velocity decay. At rotor speeds of 0, 1000, 1500, and 1800 r/min, the decay rates of average droplet velocities are 36.72%, 20.00%, 15.47%, and 13.21%, respectively. This indicates that the rotor flow field slows down the reduction in droplet deposition velocity, enabling droplets to deposit rapidly in the target area at higher speeds, thereby reducing drifting risks.
In summary, this study contributes to a deeper understanding of droplet dynamics in agricultural spraying applications. The relevant test data can help optimize spray systems and enrich existing research. We will keep exploring the various affecting agricultural practices and work on developing predictive models to improve application efficiency further.

Author Contributions

Conceptualization, S.C. and Y.L.; methodology, S.H. and X.X.; validation, J.L. and J.G.; formal analysis, S.H. and R.G.; investigation, X.X., J.L. and J.G.; resources, Z.Z. and Y.L.; writing—original draft preparation, S.H. and X.X.; writing—review and editing, S.C.; visualization, S.H. and R.G.; supervision, Z.Z. and Y.L.; project administration, S.C.; funding acquisition, S.C. All authors have read and agreed to the published version of the manuscript.

Funding

This study was funded by the Science and technology planning project of Guangdong (2022A1515011535), the National Key Research and Development Plan Project (2023YFD2000200), the Key R&D Project of Ningxia Hui Autonomous Region (2024BBF01013), and the 111 Project (D18019).

Data Availability Statement

The raw data supporting the conclusions of this article will be made available by the authors upon request.

Acknowledgments

We deeply thank reviewers and editors for giving relevant revision advice for the paper’s improvement.

Conflicts of Interest

The authors declare no conflicts of interest.

References

  1. Tudi, M.; Daniel Ruan, H.; Wang, L.; Lyu, J.; Sadler, R.; Connell, D.; Chu, C.; Phung, D.T. Agriculture Development, Pesticide Application and Its Impact on the Environment. Int. J. Environ. Res. Public Health 2021, 18, 1112. [Google Scholar] [CrossRef] [PubMed]
  2. Pan, X.; Dong, F.; Liu, X.; Xu, J.; Wu, X.; Zheng, Y. Development and Application of Pesticide in China in Past 70 Years. Mod. Agrochem. 2020, 19, 1–5+23, (In Chinese with English Abstract). [Google Scholar]
  3. Otto, S.; Loddo, D.; Baldoin, C.; Zanin, G. Spray Drift Reduction Techniques for Vineyards in Fragmented Landscapes. J. Environ. Manag. 2015, 162, 290–298. [Google Scholar] [CrossRef] [PubMed]
  4. Chen, P.; Douzals, J.P.; Lan, Y.; Cotteux, E.; Delpuech, X.; Pouxviel, G.; Zhan, Y. Characteristics of Unmanned Aerial Spraying Systems and Related Spray Drift: A Review. Front. Plant Sci. 2022, 13, 870956. [Google Scholar] [CrossRef]
  5. Aktar, W.; Paramasivam, M.; Sengupta, D.; Purkait, S.; Ganguly, M.; Banerjee, S. Impact Assessment of Pesticide Residues in Fish of Ganga River around Kolkata in West Bengal. Environ. Monit. Assess. 2009, 157, 97–104. [Google Scholar] [CrossRef]
  6. Syafrudin, M.; Kristanti, R.A.; Yuniarto, A.; Hadibarata, T.; Rhee, J.; Al-onazi, W.A.; Algarni, T.S.; Almarri, A.H.; Al-Mohaimeed, A.M. Pesticides in Drinking Water—A Review. Int. J. Environ. Res. Public Health 2021, 18, 468. [Google Scholar] [CrossRef]
  7. Shi, Q.; Liu, D.; Mao, H.; Shen, B.; Li, M. Wind-Induced Response of Rice under the Action of the Downwash Flow Field of a Multi-Rotor UAV. Biosyst. Eng. 2021, 203, 60–69. [Google Scholar] [CrossRef]
  8. Li, J.; Guo, S.; Yao, W.; Zhan, Y.; Li, Y. Distribution Characteristics of Droplet Size in Rice Field and Wind Tunnel Simulation Test under Airflow Operation. Trans. Chin. Soc. Agric. Mach. 2019, 50, 148–156, (In Chinese with English Abstract). [Google Scholar]
  9. Zhu, Y.; Guo, Q.; Tang, Y.; Zhu, X.; He, Y.; Huang, H.; Luo, S. CFD Simulation and Measurement of the Downwash Airflow of a Quadrotor Plant Protection UAV during Operation. Comput. Electron. Agric. 2022, 201, 107286. [Google Scholar] [CrossRef]
  10. Yang, S.; Xu, P.; Jiang, S.; Zheng, Y. Downwash Characteristics and Analysis from a Six-rotor Unmanned Aerial Vehicle Configured for Plant Protection. Pest Manag. Sci. 2022, 78, 1707–1720. [Google Scholar] [CrossRef]
  11. Zhan, Y.; Chen, P.; Xu, W.; Chen, S.; Han, Y.; Lan, Y.; Wang, G. Influence of the Downwash Airflow Distribution Characteristics of a Plant Protection UAV on Spray Deposit Distribution. Biosyst. Eng. 2022, 216, 32–45. [Google Scholar] [CrossRef]
  12. Tang, Y.; Fu, Y.; Guo, Q.; Huang, H.; Tan, Z.; Luo, S. Numerical Simulation of the Spatial and Temporal Distributions of the Downwash Airflow and Spray Field of a Co-Axial Eight-Rotor Plant Protection UAV in Hover. Comput. Electron. Agric. 2023, 206, 107634. [Google Scholar] [CrossRef]
  13. Liu, Z.; Gao, R.; Zhao, Y.; Wu, H.; Liang, Y.; Liang, K.; Liu, D.; Huang, T.; Xie, S.; Lv, J.; et al. Study on the Characteristics of Downwash Field Range and Consistency of Spray Deposition of Agricultural UAVs. Agriculture 2024, 14, 931. [Google Scholar] [CrossRef]
  14. Guo, S.; Li, J.; Yao, W.; Hu, X.; Wei, X.; Long, B.; Wu, H.; Li, H. Optimization of the Factors Affecting Droplet Deposition in Rice Fields by Rotary Unmanned Aerial Vehicles (UAVs). Precis. Agric. 2021, 22, 1918–1935. [Google Scholar] [CrossRef]
  15. Kharim, M.N.A.; Wayayok, A.; Mohamed Shariff, A.R.; Abdullah, A.F.; Husin, E.M. Droplet Deposition Density of Organic Liquid Fertilizer at Low Altitude UAV Aerial Spraying in Rice Cultivation. Comput. Electron. Agric. 2019, 167, 105045. [Google Scholar] [CrossRef]
  16. Zhang, J.; Huang, L.; Liu, G.; Lan, Y.; Wen, S. The Dynamic Wetting and Spreading Behavior of Pesticide Droplet on Rice Leaf Surface. Sci. Agric. Sin. 2024, 57, 2583–2598, (In Chinese with English Abstract). [Google Scholar]
  17. Cao, Y.; Wang, C.; An, Y.; Chen, Y.; Qiu, W. Droplet Deposition Behavior on the Surface of Wheat Leaves with Wind-Induced Vibration. Crop Prot. 2024, 181, 106699. [Google Scholar] [CrossRef]
  18. Lv, M.; Xiao, S.; Yu, T.; He, Y. Influence of UAV Flight Speed on Droplet Deposition Characteristics with the Application of Infrared Thermal Imaging. Int. J. Agric. Biol. Eng. 2019, 12, 10–17. [Google Scholar] [CrossRef]
  19. Grizzi, S.; Falchi, M.; Martellini, E.; Aloisio, G.; Pagliaroli, T. PIV Wake Survey of a Drone Propeller for Amphibious Applications. J. Phys. Conf. Ser. 2023, 2590, 012010. [Google Scholar] [CrossRef]
  20. Peterson, B.; Baum, E.; Ding, C.-P.; Michaelis, D.; Dreizler, A.; Böhm, B. Assessment and Application of Tomographic PIV for the Spray-Induced Flow in an IC Engine. Proc. Combust. Inst. 2017, 36, 3467–3475. [Google Scholar] [CrossRef]
  21. Moneib, H.A.; Mahfouz, A.; El-Fatih, A.; Emara, A. Near-Field Spray Characterization of a Spill Return Atomizer Using a PIV Laser Sheet. Fuel 2021, 289, 119792. [Google Scholar] [CrossRef]
  22. Jouvet, G.; Weidmann, Y.; Kneib, M.; Detert, M.; Seguinot, J.; Sakakibara, D.; Sugiyama, S. Short-Lived Ice Speed-up and Plume Water Flow Captured by a VTOL UAV Give Insights into Subglacial Hydrological System of Bowdoin Glacier. Remote Sens. Environ. 2018, 217, 389–399. [Google Scholar] [CrossRef]
  23. Fan, X.; Liu, C.; Mu, Y.; Wang, K.; Wang, Y.; Xu, G. Experimental Investigations of Flow Field and Atomization Field Characteristics of Pre-Filming Air-Blast Atomizers. Energies 2019, 12, 2800. [Google Scholar] [CrossRef]
  24. Guan, X.; Qiu, B.; Ou, M.; Dong, X.; Xue, X. Measurement experiments of particle size spectra and velocity field of three kinds of small flow nozzles. J. Chin. Agric. Mech. 2014, 35, 71–80. [Google Scholar]
  25. Nadeem, M.; Chang, Y.K.; Venkatadri, U.; Diallo, C.; Havard, P.; Nguyen-Quang, T. Water Quantification from Sprayer Nozzle by Using Particle Image Velocimetry (PIV) versus Imaging Processing Techniques. Pak. J. Agric. Sci. 2018, 55, 203–210. [Google Scholar]
  26. Gong, C.; Li, D.; Kang, C.; Wang, Y. Visualisation of the Evolution of Perforations in Oil-Based Emulsion Sheets Formed by Flat-Fan Spray Nozzles. Biosyst. Eng. 2021, 207, 68–80. [Google Scholar] [CrossRef]
  27. Chang, K.; Chen, S.; Wang, M.; Xue, X.; Lan, Y. Numerical Simulation and Verification of Rotor Downwash Flow Field of Plant Protection UAV at Different Rotor Speeds. Front. Plant Sci. 2023, 13, 1087636. [Google Scholar] [CrossRef]
  28. Grant, I. Particle Image Velocimetry: A Review. Proc. Inst. Mech. Eng. Part C J. Mech. Eng. Sci. 1997, 211, 55–76. [Google Scholar] [CrossRef]
  29. Ru, Y.; Fang, S.; Xue, J.; Hu, C.; Zhou, J. Experimental Study of the Influence Factors of the Droplet Size of Rotary Nozzles during Manned Helicopter Spraying Operations. Crop Prot. 2024, 177, 106550. [Google Scholar] [CrossRef]
Figure 1. Two-phase flow UAV spraying platform.
Agriculture 14 01994 g001
Figure 2. PIV system.
Agriculture 14 01994 g002
Figure 3. Scheme of PIV droplet deposition test system.
Agriculture 14 01994 g003
Figure 4. PIV capture area and ROI area.
Agriculture 14 01994 g004
Figure 5. Image processing of droplet velocity field. (a) Original image taken by the PIV system; (b) droplet velocity vector map after visualization processing.
Agriculture 14 01994 g005
Figure 6. Droplet velocity map: under the condition of nozzle (02, 03, and 04), spray pressure (0.2, 0.3, and 0.4 MPa), and rotor speed (0, 1000, 1500, and 1800 r/min).
Agriculture 14 01994 g006aAgriculture 14 01994 g006b
Figure 7. The variation in maximum velocity magnitude of droplet deposition.
Agriculture 14 01994 g007
Figure 8. Distribution of droplet quantity at different deposition speeds under the conditions of nozzle (02, 03, and 04), spray pressure (0.2, 0.3, and 0.4 MPa), and rotor speed (0, 1000, 1500, and 1800 r/min).
Agriculture 14 01994 g008aAgriculture 14 01994 g008bAgriculture 14 01994 g008c
Figure 9. The influence of rotor speed on the characteristics of droplet deposition movement. Groups with different letter (A, B, C, D) are significantly different based on Gabriel post-comparison.
Agriculture 14 01994 g009
Table 1. Experimental Design.
Spray Pressure (Mpa)Nozzle Type Rotor Speed (r/min)
0.2LU120-020
0.3LU120-031000
0.4LU120-041500
1800
Table 2. Measurement results of droplet size.
Spray Pressure (MPa)Nozzle TypeDv10/μmDv50/μmDv90/μmRS
0.20267.91 (±1.53)134.36 (±1.74)278.72 (±2.90)1.57 (±0.014)
0374.8 (±1.95)163.45 (±1.27)334.22 (±3.72)1.59 (±0.026)
0487.46 (±2.94)192.46 (±0.65)381.58 (±7.56)1.53 (±0.026)
0.30266.16 (±1.32)127.62 (±0.63)269.55 (±4.78)1.59 (±0.039)
0365.77 (±0.74)129.22 (±1.93)266.27 (±4.40)1.55 (±0.028)
0474.71 (±1.68)160.28 (±2.39)298.4 (±3.87)1.40 (±0.047)
0.40271.07 (±0.77)121.81 (±0.97)202.42 (±1.61)1.08 (±0.012)
0363.64 (±1.05)122.72 (±1.63)272.22 (±3.41)1.70 (±0.051)
0470.52 (±0.95)135.73 (±1.54)289.64 (±7.84)1.61 (±0.079)
Table 3. ANOVA for the effects of rotor speed on droplet velocity and droplet velocity decay rate.
Factor NameDroplet Velocity (m/s)Droplet Velocity Decay Rate (%)
F-Valuep-ValueSignificanceF-Valuep-ValueSignificance
Rotor Speed4.2840.017* 13.4070.039*
Rotor Speed * Nozzle Size1.1490.354 1.6060.220
Rotor Speed * Spray Pressure1.0520.392 0.1930.900
Spray Pressure * Nozzle Diameter * Rotor Speed1.2830.307 1.1520.353
1 “*” indicates that the effect is statistically significant at the p ≤ 0.05 level.
Disclaimer/Publisher’s Note: The statements, opinions and data contained in all publications are solely those of the individual author(s) and contributor(s) and not of MDPI and/or the editor(s). MDPI and/or the editor(s) disclaim responsibility for any injury to people or property resulting from any ideas, methods, instructions or products referred to in the content.

