Article

Evaluating the Performance of a Novel Digital Slippage System for Tractor Wheels Across Varied Tillage Methods and Soil Textures

by
Ahmed Abed Gatea Al-Shammary
1,
Andrés Caballero-Calvo
2,* and
Jesús Fernández-Gálvez
2
1
Soil Science and Water Resources Departments, College of Agriculture, University of Wasit, Kut 00964, Iraq
2
Department of Regional Geographical Analysis and Physical Geography, University of Granada, 18071 Granada, Spain
*
Author to whom correspondence should be addressed.
Agriculture 2024, 14(11), 1957; https://doi.org/10.3390/agriculture14111957
Submission received: 13 September 2024 / Revised: 28 October 2024 / Accepted: 29 October 2024 / Published: 31 October 2024
(This article belongs to the Section Agricultural Soils)

Abstract

:
Accurate measurement of slip rate (SR) in agricultural tractors, particularly in Iraq, is essential for optimizing tractive efficiency, fuel economy, and field efficiency. Presently, tractors in Iraq lack sensors for SR detection, posing a challenge. This research addresses the issue by introducing a wireless technology, the novel digital slippage system (NDSS), designed to precisely measure the SR of rear wheels. The NDSS was tested across diverse field conditions, involving six soil textures and various kinds of agricultural tillage equipment (A-TE). Different tillage practices, including conservational tillage (CT) with a chisel plough, traditional tillage (TT) with a moldboard plough and disc plough, and minimum tillage (MT) using disc harrowing and spring tooth harrowing, were examined. Results from the NDSS were compared to traditional techniques, demonstrating the cost effectiveness and overall performance. Silty loam soil exhibited higher SR values, while the silty clay soil showed lower values. SR varied significantly across soil textures, with more cohesive soils leading to reduced SR percentages. Additionally, tillage methods had a marked influence on SR values. The use of CT resulted in higher SR values of 18.35% compared to TT and MT systems, which recorded lower SR values of 13.69% and 6.03%, respectively. SR measurements were also found to be affected by the draft force during the loading of A-TE, emphasizing the role of operational conditions in tractor performance, especially in challenging field environments. Comparison between NDSS and traditional techniques revealed that the NDSS offered high accuracy, flexibility, configurability, and consistent performance. The NDSS demonstrated superior precision, making it an effective tool for assessing SR in agricultural tractors.

1. Introduction

Agriculture stands tall as a foundational pillar of the state in Iraq. As well as ensuring national security, it is intricately woven into the fabric of food security [1]. In the quest to elevate Iraq’s agricultural landscape [2], it is imperative to advance in machinery technology and precision agriculture [3,4,5,6]. In particular, the agricultural tractor takes center stage in agricultural mechanization (AM). From an economic standpoint, and considering the diverse conditions of the agricultural work, the efficacy of the utilized tractor becomes paramount. Optimization of tractor performance and reduction in fuel consumption are pivotal in AM [7,8].
The pursuit of high efficiency in tractor operations requires specific technical conditions, encompassing factors such as weight [9], tire pressure [10], soil texture [4,11,12], suitable speed [13], and compatibility with soil properties for optimized performance [14]. At the heart of this intricate interplay between operations and soil conditions lies the slip ratio (SR) of the tractor’s wheels [10,15,16,17,18]. Accurate determination of the SR is of critical importance, influencing the load applied to the soil tasks and the effectiveness of the tractor operations.
The term SR concerning tractor wheels refers to the relative movement in the direction of travel at the mutual contact surface of a traction device and the support surface [19,20]. The SR can be viewed as the measure of speed reduction in the tractor wheel compared to its speed without slippage [17,21].
The SR substantial influence extends to various aspects, including fuel efficiency [22,23], field capacity [24], and traction and pulling efficiency [25,26]. The significance of the SR lies in providing guidance on optimizing tractor usage within slippage limits under specific agricultural conditions [17].
The traditional method (CM) of determining the SR is indirectly achieved by calculating the number of revolutions of the driving wheels and the distance traveled under loaded and unloaded conditions. This involves Equations (1) and (2) [27,28]:
S R % = 1 U 0 U 1 × 100 ,
S R   ( % ) = 1 n 10 × 100 ,
where SR is the slip ratio, expressed as a percentage; U 0 is the number of wheel revolutions under unloaded conditions; U 1 is the number of wheel revolutions under loaded conditions; and n represents the difference between the unloaded and loaded wheel revolutions, divided by the unloaded wheel revolutions. These equations are likely to include variables such as wheel rotations and distances traveled, as well as additional variables like tire properties or tractor weight.
The CM for calculating SR, which relies on measuring wheel rotations and the distance covered, is subject to several limitations. The precision of SR estimates using CM can be influenced by various factors, including tire wear, tire pressure, driving conditions, and variations in wheel diameter. These factors can introduce errors in the CM measurements [29]. Additionally, the calibration of wheel rotations and distance measurements must be conducted according to the CM’s specifications. Calibration errors can result in discrepancies in the SR estimates. The CM typically measures SR in both static and unloaded conditions, as well as loaded states. However, these measurements may not capture all types of SR that occur during actual tractor operation.
Several factors, such as tractor speed, acceleration, and changes in load distribution, can affect SR [30]. However, these factors are often not accounted for in the conventional method. Furthermore, the CM involves the labor-intensive task of manually measuring and recording wheel rotations and distances covered [31]. This procedure can be especially challenging for large-scale operations or when frequent SR measurements are required [32].
To overcome these limitations, alternative methods, such as the use of sensors or GPS technology for measuring SR or wheel speed, are increasingly employed. These approaches offer more accurate and real-time measurements of SR under various operational conditions. The current study introduces a novel digital slippage system (NDSS), which addresses the shortcomings of the CM, such as lower accuracy and the lack of real-time data, by providing more precise SR measurements across different operational scenarios.
The utilization of SR methods in agricultural research needs accurate computations and specialized equipment. These devices may be classified into two methods: a radar device that measures the distance traveled, and rotational frequency or velocity in relation to the surface of the soil [33]. Each has its limitations, including errors and economic cost. One popular method for measuring slip ratio involves the use of radar equipment. This entails positioning two radars, one in a horizontal orientation and the other at an inclination of 37°, in order to obtain the required data. Nevertheless, despite the implementation of this configuration, there are still intrinsic constraints. An inherent constraint is the presence of errors in the measurements. The margin of error for these measurements varies from −5% to +5% for speeds ranging from 0.53 to 70.8 km/h, and from −3% to +3% for speeds range from 3.2 to 107 km/h. The occurrence of these inaccuracies can be attributed to the variability of the soil’s surface in the agricultural field, which negatively impacts the precision of the computations. Furthermore, the financial implications of deploying these radar-based devices should be carefully considered. The expense associated with procuring and upkeeping the radar equipment might provide a constraint for some scientific endeavors or agricultural activities. One needs to be cognizant of these constraints while utilizing SR methodologies that depend on radar apparatus for slip ratio evaluations. Researchers and practitioners should assess the potential inaccuracies and financial implications linked to these devices and determine their appropriateness for certain uses in agricultural settings.
Numerous studies have delved into developing slip control and measuring devices for tractors using microcontroller-based embedded systems [17,19,21,22,23,25,34]. These devices not only measure wheel SR but also effectively manage it within an optimum range to maximize tractive efficiency. They possess the ability to measure supplementary parameters such as velocity ratio, power take-off (PTO) torque, and draft requirement, offering real-time feedback to the operator for enhanced soil tilth and energy input. However, the process of designing and developing a microcontroller-based embedded system for tractors presents several challenges, including ensuring precision, parameterizing the system, and validating its practicability.
A comprehensive review of the literature highlights that the maximum permissible SR for tractor wheels should not exceed 15% [35,36]. This limitation is significant, as surpassing this threshold leads to significant degradation of the soil structure, potentially falling below the critical level structure coefficient [11,22]. An equation has been developed to calculate the maximum SR allowed, considering soil properties such as the bulk deformation coefficient and the rolling resistance coefficient [37]. The maximum acceptable SR depends on soil parameters and soil textures (Ts), with greater values of the bulk deformation coefficient and rolling resistance coefficient resulting in a lower permissible SR threshold [14]. Therefore, accounting for these factors is essential when establishing the maximum allowable SR for tractor wheels.
Various factors significantly influence SR during tractor operation, including the driving system (four-wheel drive, rear wheel drive, or front wheel drive) [7,11], the specific tools employed for tillage [19,38], tillage speed [19], soil texture [11,39], soil water content [40], soil compaction [39,41], the weight on the rear wheel [14,42], tire pressure and wheel size [10,33,43], hitch height [44], and pulling force [45]. These factors have the potential to impact traction performance, rolling resistance, and weight distribution, subsequently influencing SR.
In the realm of Iraqi agriculture, crafting control systems for measuring SR faces considerable challenges. A prominent hurdle is the absence of sensors on most agricultural tractors, leaving a void in the accurate determination of the SR. Despite its pivotal role, acquiring this percentage proves challenging during operational conditions, often relying on conventional methods and guesswork and, at times, being overlooked, despite its optimal utility in evaluating tractor performance. Another impediment lies in achieving precision in SR measurement across diverse field conditions, encompassing factors such as Ts and load conditions [46].
Prior studies have yet to delve into the dual task of determining SR while concurrently developing SR control and measuring devices for tractors utilizing microcontroller-based embedded systems in Iraq. While several studies have detailed the development of SR control for tractors, ensuring steadfast and accurate SR control, these initiatives lack comprehensive testing under various field conditions. The primary objective of such testing is geared towards amplifying tractive performance and alleviating operator fatigue. Moreover, compared to conventional methods, the data management and analysis techniques employed in earlier studies fall short in terms of precision and accuracy.
The central questions of this study are as follows: “How does the NDSS compare to the conventional method (CM) for determining SR in terms of accuracy and reliability? What is the impact of different soil textures (Ts) and tillage systems (A-TE) on the SR measured by the NDSS?”
To address these questions, this study is structured around three primary objectives. First, it aims to deploy the NDSS, equipped with wireless capabilities, to measure the SR of tractors. The development of the NDSS integrates mechatronic technologies (IMT), combining hardware components and software applications to ensure precise control and SR measurement. The system utilizes a microcontroller-based embedded platform, enabling the seamless integration and operation of various electrical and computational elements within the NDSS.
This research further seeks to establish a correlation between the SR values measured by the NDSS and those predicted by the CM within a specified SR range. This experimental comparison offers valuable insights into the precision and reliability of the NDSS in SR measurement. Additionally, this study aims to assess the performance of the NDSS across different Ts and A-TE, providing a comprehensive understanding of how varying soil conditions and agricultural implements affect SR.
To ensure rigorous analysis, the precision of the NDSS in measuring SR was evaluated under diverse conditions using a split-plot experimental design with a systematic arrangement of plots. This approach guarantees the generation of reliable results and a thorough examination of the NDSS’s practical applications in real-world agricultural scenarios.

2. Materials and Methods

In this section, the implementation of the NDSS is elucidated, covering the hardware electronic configuration, software organization, and execution of the NDSS. The procedure outlines both the theoretical and experimental aspects of the NDSS. Additionally, an overview of the experimental sites, the experimental setup, and the process of data analysis is provided.

2.1. Novel Digital Slippage System (NDSS) Implementation

The NDSS for measuring tractor wheel SR is built on mechatronic technologies encompassing hardware electronic components and software applications. A general description of the NDSS is presented in Figure 1, and the electronic circuits are detailed in Figure 2.

2.1.1. Hardware

The hardware electronic components of the NDSS include an Arduino microcontroller, a laser distance sensor (LIDAR) module, four hall effect sensors, an RF transmitter and receiver Module, and a power supply, as shown in Figure 2.
A. Arduino microcontroller:
The microcontroller board, based on the ATmega2560, serves as the central control unit responsible for data collection, processing, decision-making, and control operations associated with SR detection and monitoring. It is equipped with 54 digital input/output pins.
B. Laser distance sensor (LIDAR) module:
The LIDAR module plays a crucial role in precisely measuring the distances covered by the tractor, employing laser technology for utmost accuracy. With a remarkable range of 0.03 to 50 m and an excellent precision up to +1 mm, it operates based on the principle of LiDAR (Light Detection and Ranging). It emits laser pulses in the 520 nm wavelength, which is within the green spectrum of light. The laser used in this sensor is classified as Class 3, indicating that it is a moderately powerful laser. The power output is specified to be greater than 1 milliwatt. The LIDAR module is strategically placed at the front of the tractor, as depicted in Figure 1. The LiDAR structure is engineered to be durable and capable of enduring the challenging circumstances commonly encountered in agricultural settings. It is designed to be robust and impervious to dust, moisture, and vibrations, ensuring reliable performance even in harsh tillage conditions.
C. Hall effect (HE) sensor:
Four Allegro 3144-based HE sensors are used to measure the actual and theoretical speeds of the tractor wheels precisely. These sensors are employed in conjunction with four magnetic pins that are affixed to discs positioned on the front and rear wheels of the tractor. The magnetic pins, fixed on one side of the wheels, interact with the HE sensors, strategically positioned in the final transmission device frame, to generate a series of pulses that run parallel to one another. Additionally, the duration required for a single revolution of the wheel can be precisely measured. It is worth noting that these sensors operate efficiently with a 5 V DC input and offer both digital and analog outputs, rendering them compatible with the Arduino Mega microcontroller.
D. 315 Mhz RF transmitter and receiver module:
The 315 MHz RF transmitter and receiver module plays a crucial role in wirelessly communicating measurement data from the Arduino ATmega2560 to a PC. To streamline this wireless connection, a second Arduino microcontroller that is outfitted with a receiver module is utilized, enabling the remote transfer of data related to SR. It then stores it on a PC. This wireless capability improves the adaptability and expandability of the NDSS, allowing for distributed sensing and monitoring of slippage occurrences.
E. HC-05 Bluetooth:
The HC-05 Bluetooth module is used to control the operation of the NDSS. It can be integrated into the NDSS to enable wireless control of its operation. It acts as a communication interface between the system and a controlling device, such as a smartphone, tablet, or PC. It operates at 2.4 GHz.
The NDSS uses an adapter with an input power of 12 V. The resulting output power is 5 V. It is connected indirectly by the Vin and GND pins.

2.1.2. Software

The software organization of the NDSS entails a program installed on a PC that interfaces with the interfacing circuit for measurement and calculation purposes. The Arduino board operates in conjunction with LabView software, which must be installed on the PC. To ensure comprehensive power generation measurement, the Arduino board software should also be installed on a PC server equipped with Virtual Instrument Package Manager Software (VIPMS, Version Number:1.2.0.13) and Arduino 1.8.19 software.
Moreover, the Arduino board is connected to MATLAB (R2014a) through the MATLAB Support Package for Arduino, utilizing an HC-05 Bluetooth slave module on the main Arduino board and a master Bluetooth module integrated into the PC. This configuration enables the reading of all output voltage signals from the sensors within the MATLAB environment.

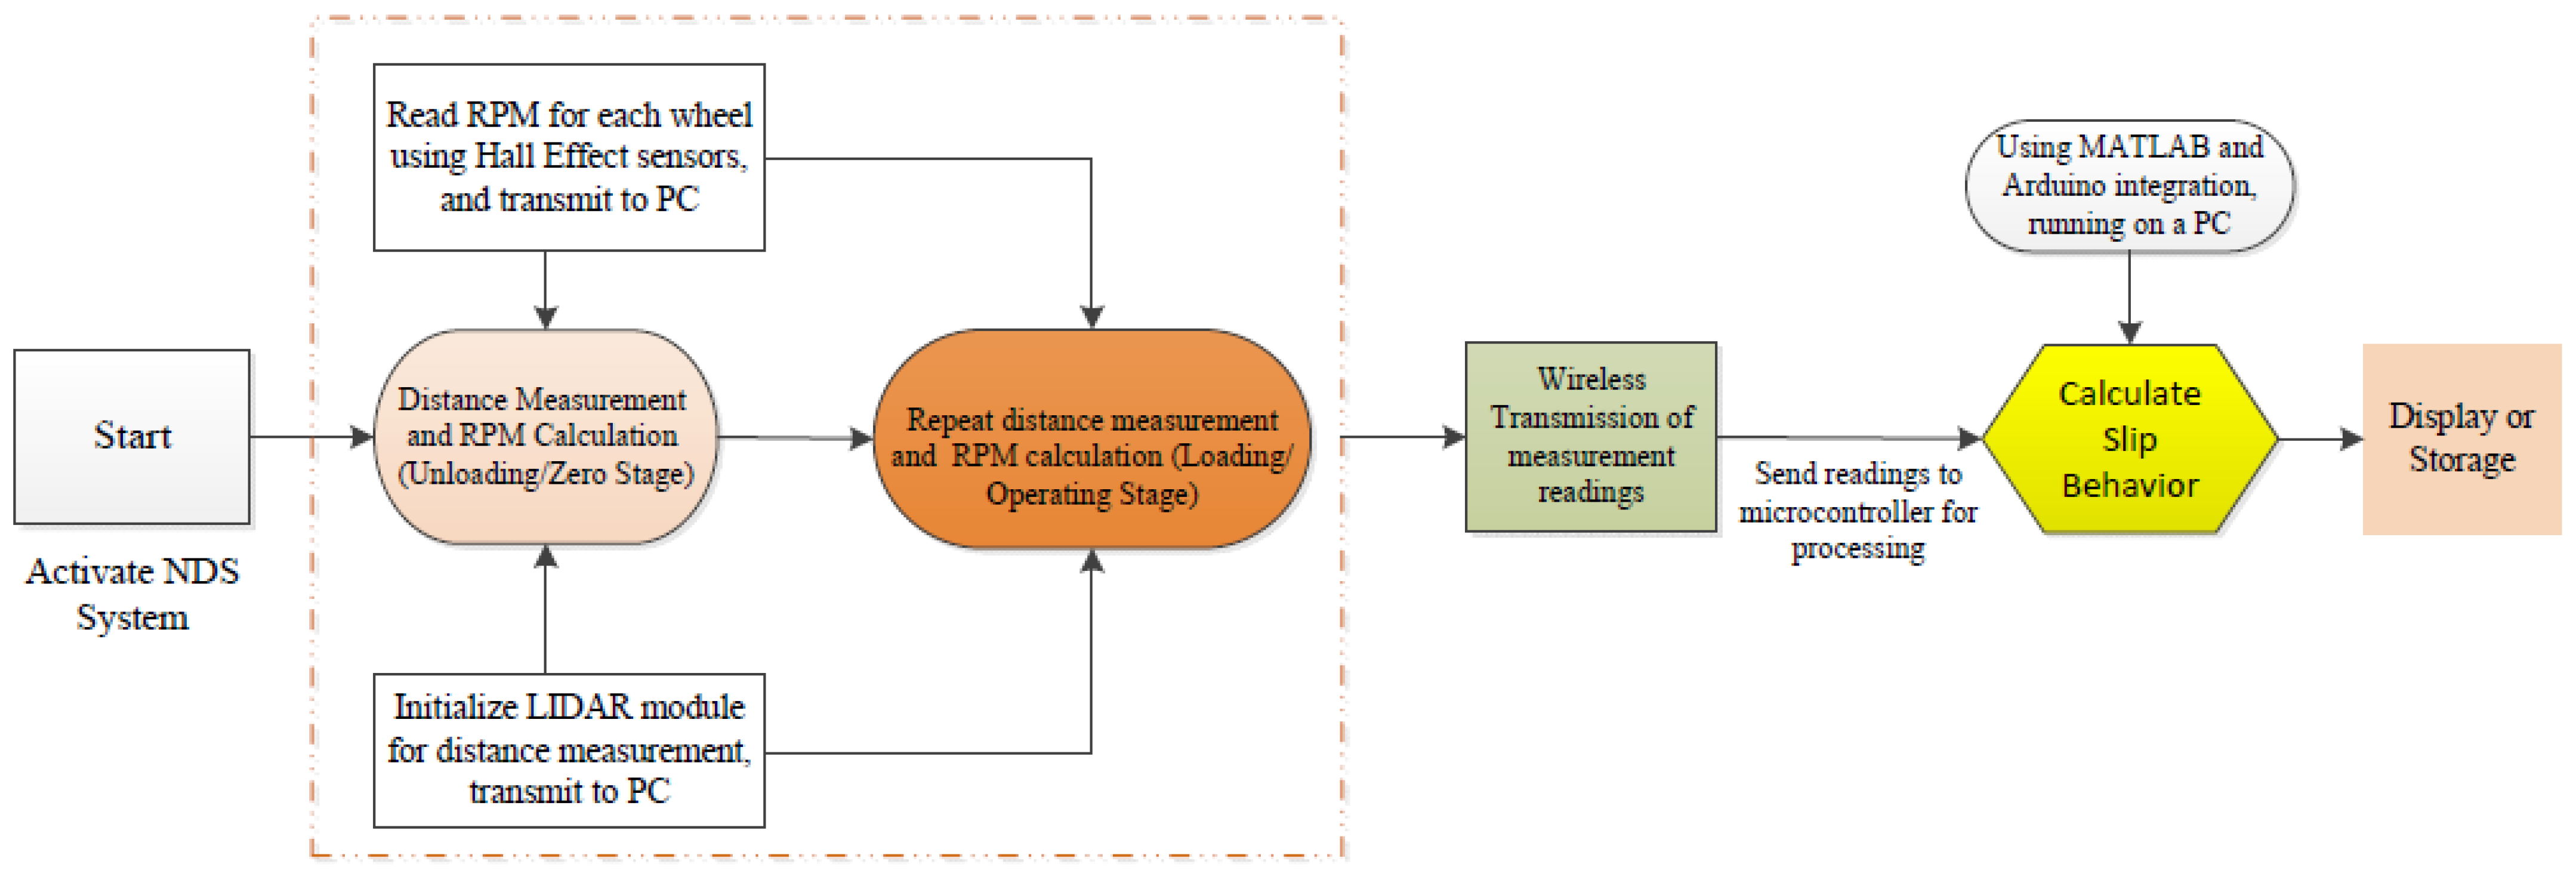
2.2. Procedure of the Theoretical and Experimental Work of the NDSS

Figure 3 provides a flowchart outlining the algorithm utilized by the firmware of the proposed NDSS. The NDSS operates as follows:
  • Distance measurement and revolutions per minute (RPM) calculation in the unloading or specified zero conditions stage:
    -
    Upon activating the NDSS, a microcontroller instructs the LIDAR module to initiate distance measurement for the tractor. The LIDAR module sensor measures the time from the activation of the Trig/Tx pin, which generates ultrasonic waves, until a high voltage is detected on the Echo/Rx pin, indicating the arrival of the wave after bouncing off an obstacle or object in front of the sensor.
    -
    By knowing the wave’s propagation velocity and the measured time, the distance can be calculated using the following equation:
    D i s t a n c e = T i m e × S p e e d   o f   S o u n d 2 .
    -
    Simultaneously, the system calculates the RPM for each wheel of the tractor using four hall effect (HE) sensors installed near the wheels. These sensors provide information about the number of RPMs for each wheel. The RPM results can be transmitted to a PC using the Arduino program connected to a receiver module and then saved.
  • Distance measurements and RPM calculation under loading and operating conditions at the same specified area:
    -
    The measured signals from the LIDAR module sensor and the four HE sensors (corresponding to the four wheels of the tractor) are read again when the tractor is loaded with agricultural equipment and operated under different conditions.
    -
    These readings are then sent to the microcontroller for processing.
  • Wireless transmission of the results: The results obtained from steps 1 and 2 are wirelessly transmitted to a PC using a 315 MHz RF transmitter and receiver module.
  • Calculation of slip behavior:
    -
    The slip behavior of the tractor wheels is calculated by connecting the Arduino board with MATLAB using the MATLAB Support Package for Arduino. It performs the necessary calculations to determine the SR. This involves mathematical operations, data analysis, and applying the slip percentage equation.
    -
    The slip percentage is calculated using the following equation:
    S l i p   ( % ) = ( 1 u n l o a d i n g l o a d i n g   )   x   100 .    
  • Display or storage: MATLAB can display the calculated slip behavior on the PC’s screen, providing real-time feedback. Additionally, MATLAB can save the results for further analysis or archival purposes.
The imperative task at hand involves computing the SR for each of the four authentic wheels mounted on the tractor during every period, following the design specifications. However, our study emphasizes meticulously measuring the SR exclusively at the rear wheels of the tractor.
Figure 3. Flowchart of proposed NDSS firmware algorithm.
Agriculture 14 01957 g003

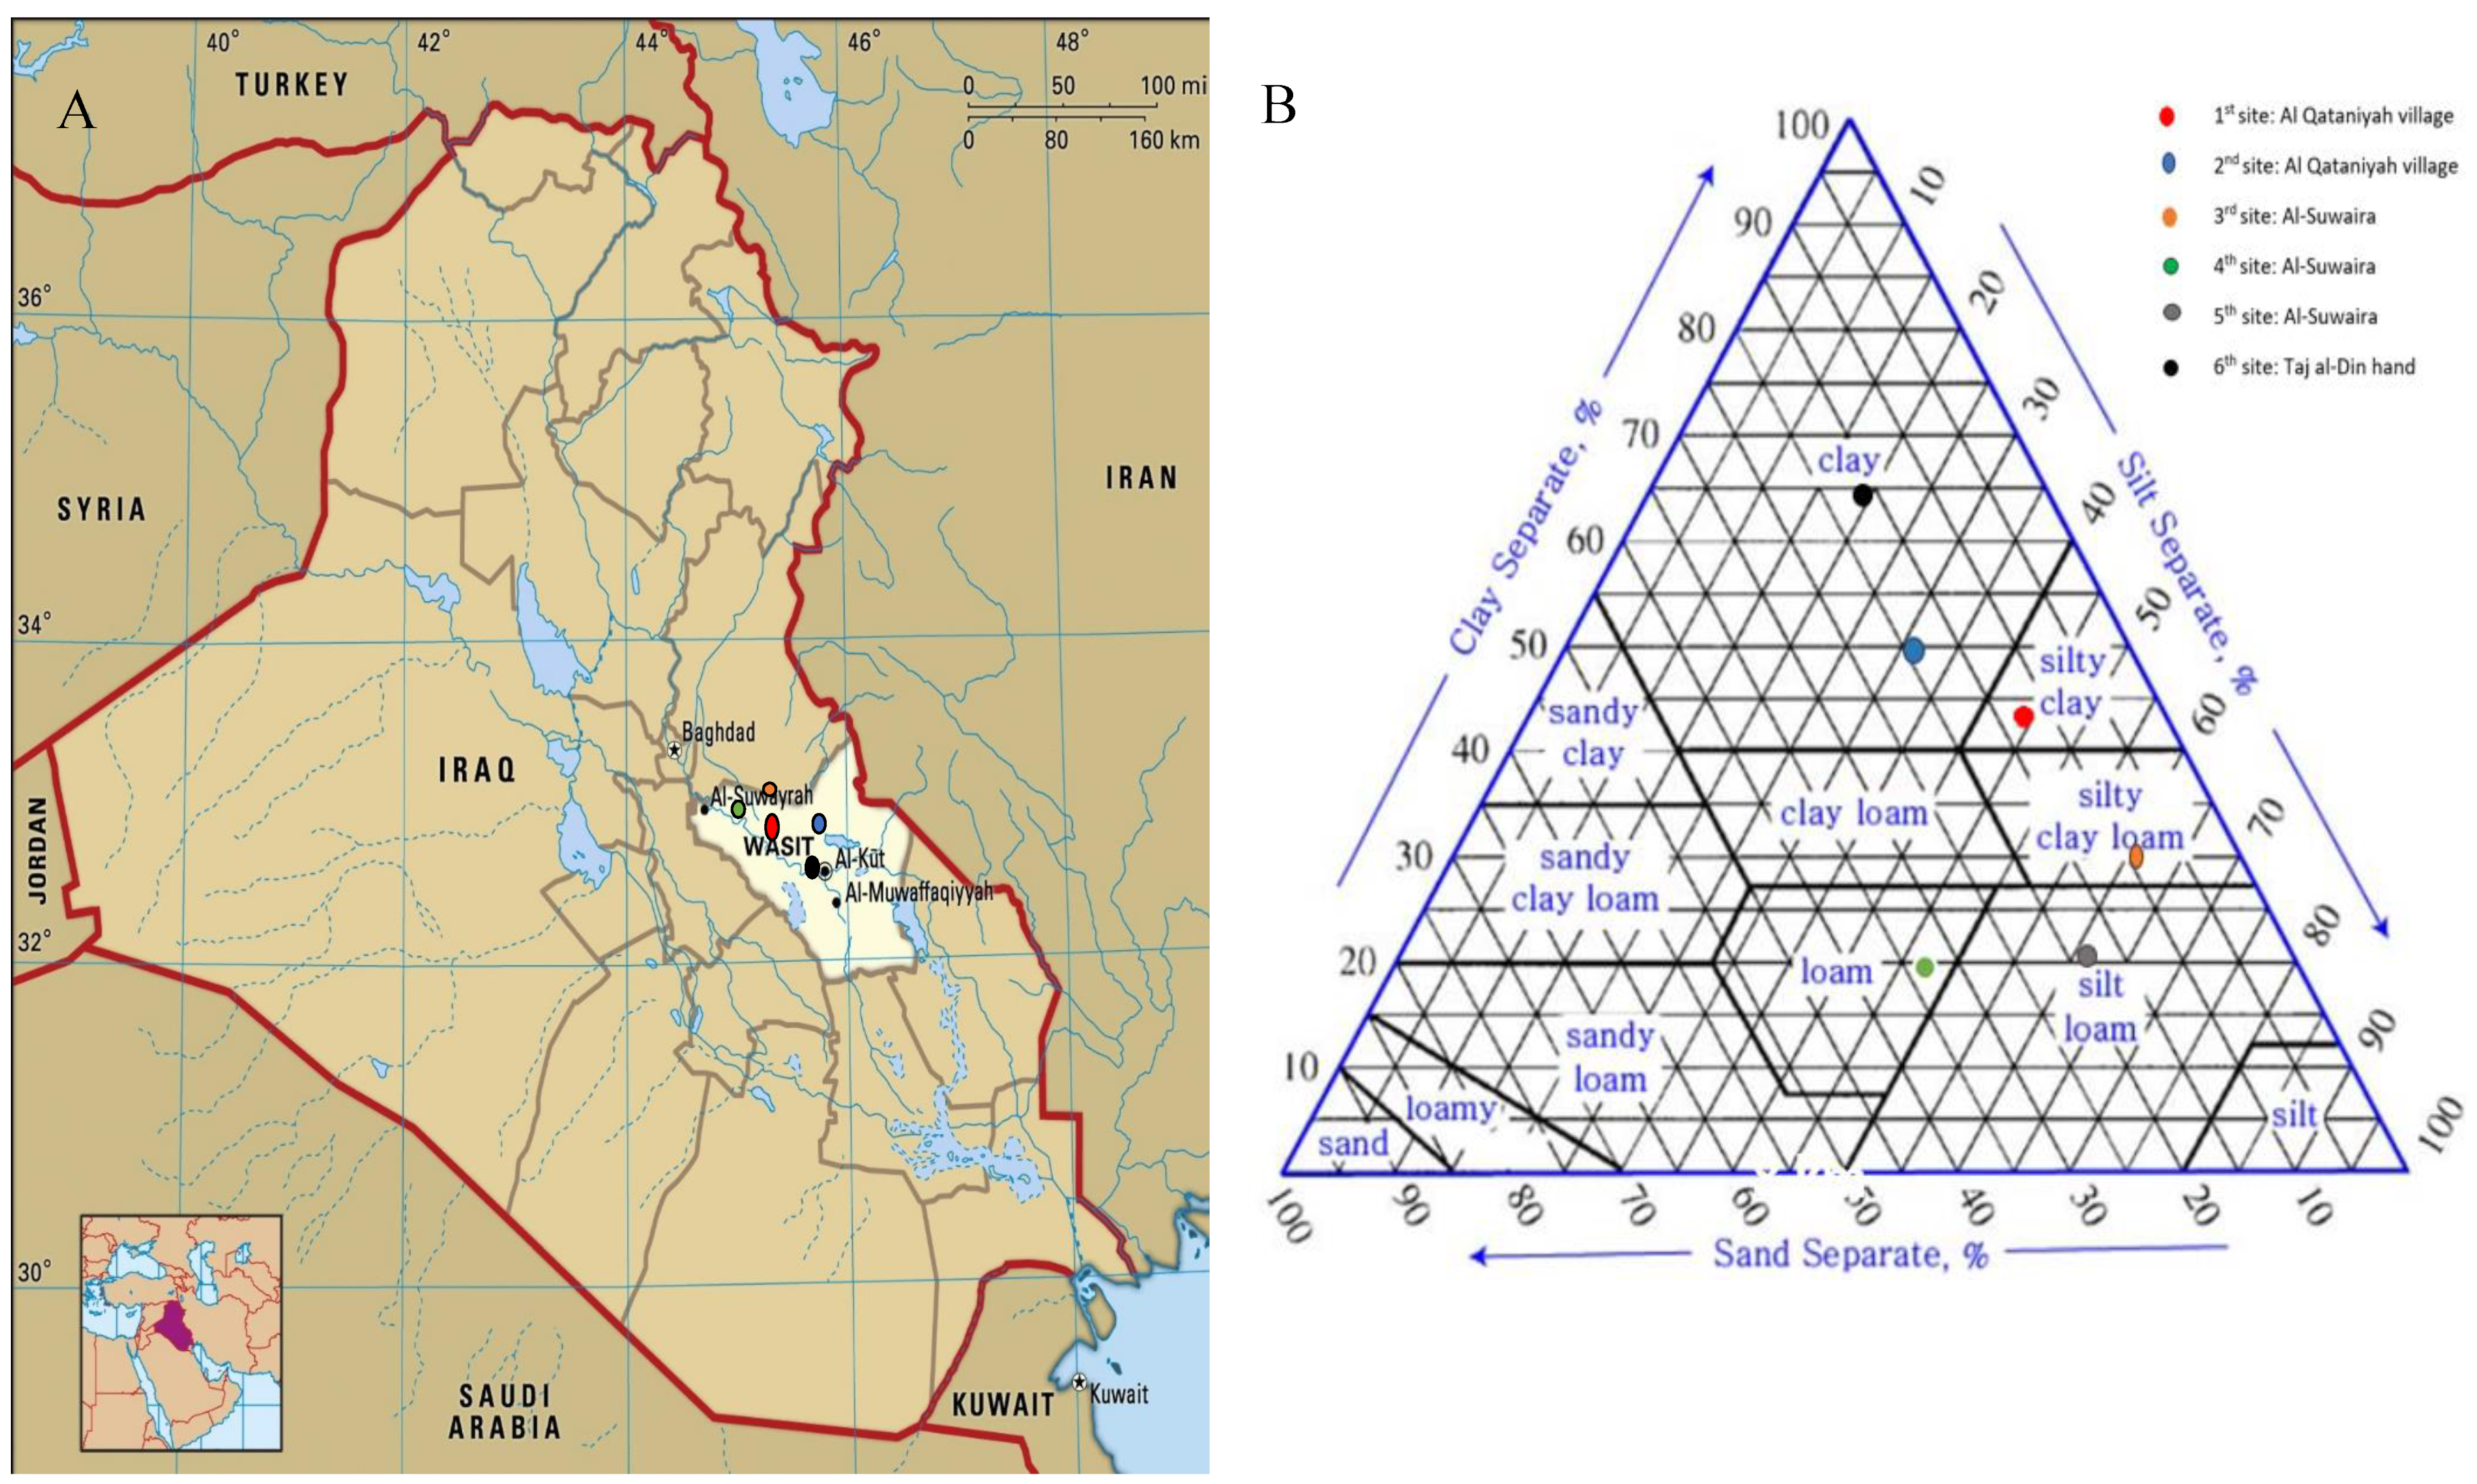
2.3. Experiment Sites

Six fields were selected for this study conducted between September and November 2021, located in three different zones: Al Qataniyah village, Al-Suwair, and Taj al-Din hand (Table 1 and Figure 4). These zones are situated approximately 82 km South of the capital town of Baghdad and 3 km from the Tigris River in the southern part of Iraq. It is important to note that all sites were privately owned, and proper authorizations were obtained.
The experimental sites exhibit an arid and semi-arid climate with an annual average ambient temperature ranging from 30 to 42 °C and annual precipitation between 200 and 600 mm [47]. The soil in all six field sites is classified as Entisols according to Soil Survey Staff [48]. Prior to the commencement of the experiments (during the months of April to June 2021), as depicted in Figure 4B, the particle size distributions of the topsoil (0–30 cm) were measured in six areas with different textures. The clay content varied from 20 to 54% across the study zones, while the silt content ranged from 30 to 60%.
In terms of land use, a long-term conventional tillage system (<30 years) was practiced in all zones (Table 1). The first and second sites (Al Qataniyah village) cultivated winter wheat (Triticum aestivum L.) for less than 30 years, while the third site (Al-Suwaira) followed a crop rotation system of maize (Zea mays) and wheat for less than 10 years. The fourth and fifth sites (Al-Suwaira) cultivated winter cover crops for less than 10 years. The sixth site (Taj al-Din hand) practiced a rotation cropping system of maize and barley (Hordeum vulgare) (Table 1).
Soil samples obtained during field tests were analyzed for physical and chemical characteristics under different conditions, encompassing various soil textures (Ts), soil organic matter (OM), bulk density (ρb), pH, and electrical conductivity (EC), as outlined in Table 1. Soil ρb and soil moisture content (µ) were measured using a digital electromechanical system (DES) sensor following Alshammary et al. [49] methodology. Organic matter content was determined using the ignition method according to Nakhli, S. A. A., S. Panta, J. D. Brown, J. Tian, and P. T. Imhoff [50]. The soil pH and EC were measured using a pH meter (HACH\HQ 41-1d) and an EC meter (HACH\EC71), respectively.

2.4. Experimental Setup

To assess the NDSS processing and display unit’s capability in measuring the SR of a rear-wheel drive tractor, a comprehensive experiment was conducted using the Massey–Ferguson 650 tractor. This tractor boasts a robust 142 CV engine (6 cylinders, liquid-cooled, in-line, direct injection (DI)), a 12-speed synchronized transmission operating at 2200 rpm, and Michelin Multibib Tyres (front/rear) (size 14.9-R30/18.4-R42), with the tire pressure set to 1.6 bar.
The SR is influenced by various factors such as Ts and types of agricultural tillage equipment. Specific variables were chosen based on their impact on measurement accuracy. The primary variable, Ts, included six distinct categories: silty clay, clay, silty clay loam, loam, silty loam, and clay sixth site. Each Ts category had sub-variables related to different types of tillage systems or A-TE. The experiment encompassed three tillage systems: conservational tillage (CT), traditional or conventional tillage (TT), and minimum tillage (MT). A control treatment (no loading) was also included for comparison. Each treatment underwent three replications.
Each field was divided into 18 plots, each measuring 75 m in length and 5 m in width. These plots were saturated, and after 3 days, agricultural machinery and equipment were introduced. The µ was determined using the procedure of Al-Shammary, A. A. G., L. S. S. Al-Shihmani, A. Caballero-Calvo, and J. Fernández-Gálvez [51].
Under the CT system, a chisel plough (CP) was employed with tillage depths ranging between 25 and 30 cm. For the TT system, both a moldboard plough (MP) and a disc plough (DP) were utilized at a tillage depth of 20 cm. In the MT system, disc harrowing (DH) and spring-tooth harrowing (TH) methods were used with a tillage depth of 12 cm.

2.5. Qualitative Assessments of NDSS Accuracy in Measuring SR

Root-mean-square deviation (RMSD), mean of absolute error (MAE), standard deviation of the prediction error (SDPE), Lin’s concordance correlation coefficient (LCCC), and relative deviation (RD) were used to assess the accuracy of the NDSS in measuring SR qualitatively, compared to the traditional methods (CM), providing robust statistical validation of the system’s precision [19,52,53] according to the following expressions:
R M S D P S R = i = 1 n ( S R N D S S S R C M ) 2 n ,
M A E   S R = 1 n i = 1 n S R N D S S S R C M | ,
S D P E   S R = 1 n 1 i = 1 n [ ( S R N D S S S R C M ) M A E ] 2 ,
L C C C = 2 ρ σ N D S S   σ C M σ N D S S 2 + σ C M 2 + ( µ N D S S µ C M ) 2 ,
R D = 1   N i = 1 n S R N D S S S R C M S R C M × 100 ,
where n is the total number of data points or observations in the dataset; S R N D S S S R C M represent the SR values measured by the NDSS and the expected SR values from traditional methods (CM), respectively; ρ is the correlation coefficient between the SR values from the NDSS and the CM; σNDSS and σCM are the standard deviations of the SR values measured by NDSS and CM, respectively; and µ N D S S µ C M represent the mean SR values from the NDSS and CM, respectively.
A lower RMSD indicates a smaller average variance between the datasets, reflecting a higher level of agreement or similarity between the NDSS and CM measurements. The LCCC, which ranges from −1 to 1, provides a measure of concordance between the variables: A value of 1 signifies perfect agreement; a value of 0 suggests no agreement beyond what could be expected by random chance; and negative values indicate a systematic discrepancy or a complete reversal in the relationship between the variables. Lower RD values indicate the suitability of NDSS to measure the SR.

2.6. Data Analysis

Data analysis was carried out using OriginPro 2020 for graphing and data organization. The split-plot design with a systematic plot arrangement was employed, and analyses were performed using SAS 9.4 software [54]. The significance between means was assessed using the least significant difference (LSD) test at a significance level below 0.05. Additionally, regression analysis was conducted using Origin Pro 2020 to explore the relationship between the NDSS and CM.

3. Results and Discussion

In this section, we showcase the SR measurements for the rear wheel of the tractor throughout each period using the NDSS. These measurements are presented under various agricultural practices. To enhance clarity and facilitate interpretation, we have included tables and graphs as visual aids to vividly portray the SR data.

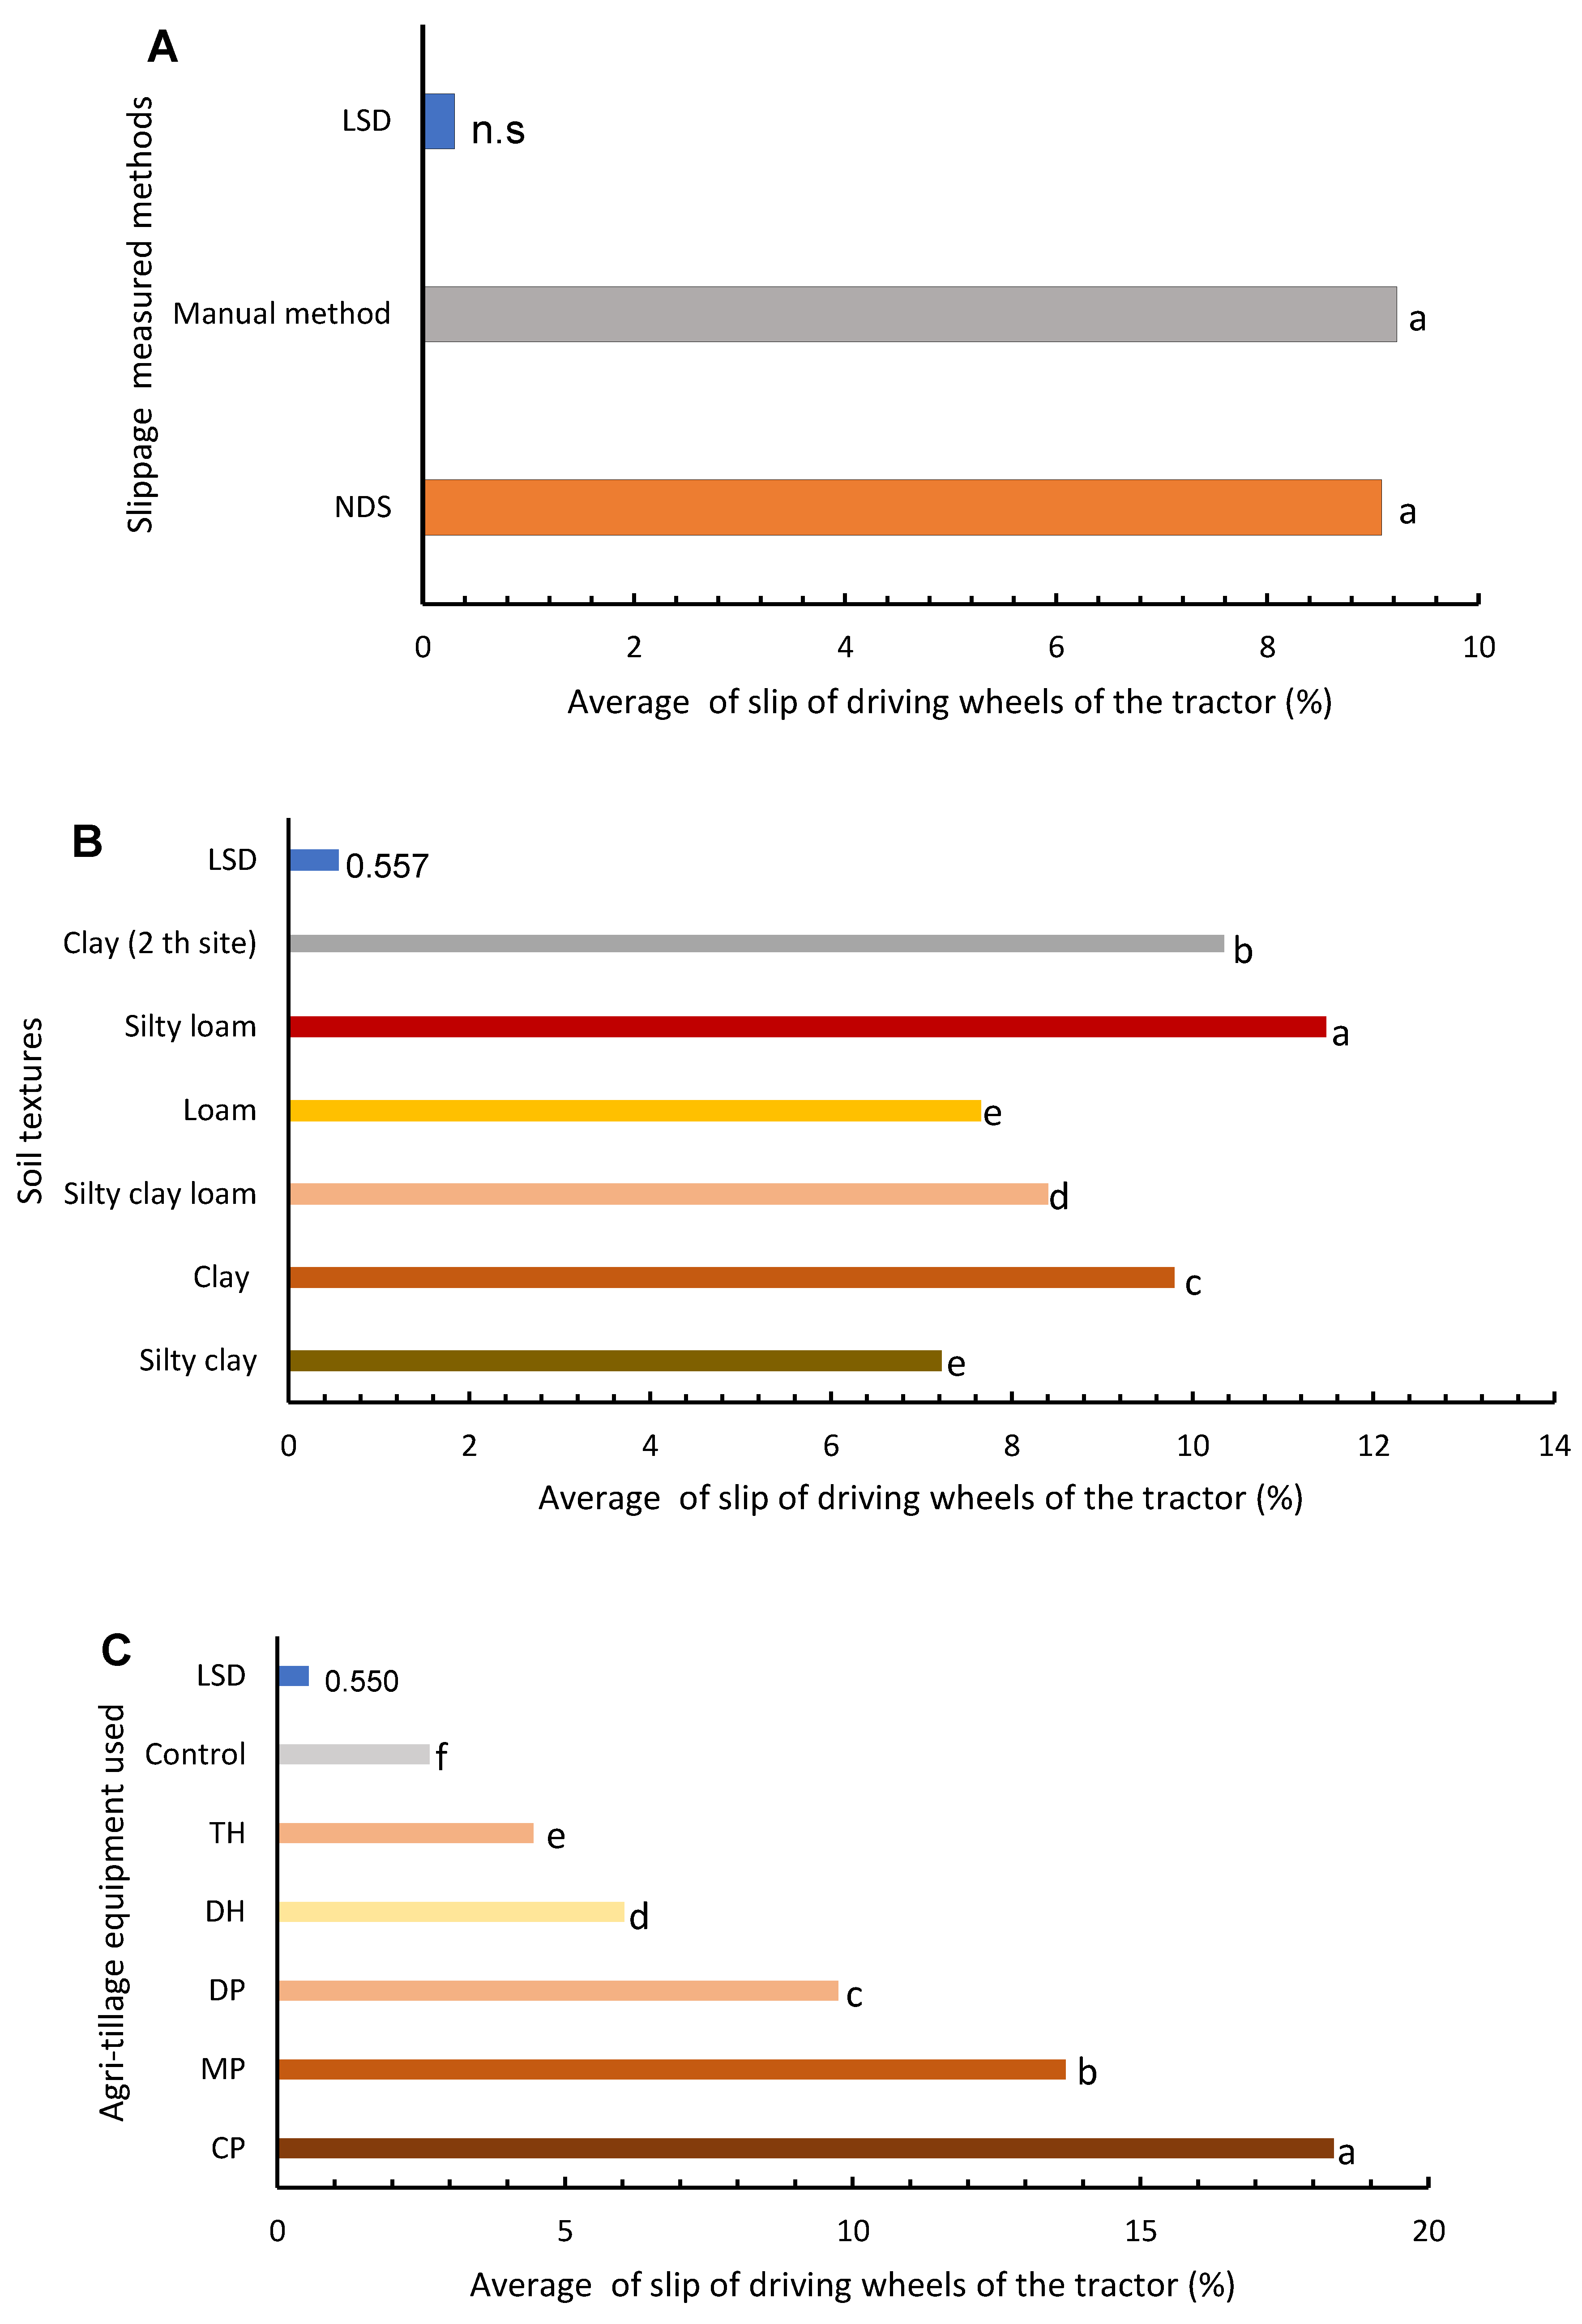
3.1. Analyzing Tractor Rear Slip Behaviors

In our investigation, we conducted experiments to assess the precision of NDSS measurement device for tractor rear wheels. A total of 216 soil treatments were selected to examine the performance of the NDSS. The results of this investigation are graphically presented in Figure 5A–C and Figure 6A–F, providing both a schematic representation and a comparative analysis against the CM.
Our scrutiny revealed that the slip of the driving wheels of the tractor, as indicated by the NDSS measured methods, did not exhibit any significant differences when compared to the CM (Figure 5A). However, further investigation employing LSD analyses is required to compare soil treatments. This analysis, presented in Figure 5B,C, highlighted that the SR values were influenced by Ts and the draft force during the loading of A-TE.
Specifically, our findings indicated that Ts such as silty loam, clay (sixth site), clay, silty clay loam, loam, and silty clay significantly decreased the percentage of SR by 10.7, 5.7, 16.6, 9.8, and 5.9%, respectively, when compared to loam (p < 0.05) (Figure 5B). Interestingly, the soil texture of silty clay did not significantly affect the SR (p > 0.05) when compared to loam. These observations suggest that the SR tends to decrease in cohesive soils and increase in soft or sandy soils. The fine particle content, such as clay and silt content, has a notable effect on electromagnetic conductivity, which is associated with soil texture and can influence the SR according to previous studies [39,55]. In their study, Kostić, M., M. Rajković, N. Ljubičić, B. Ivošević, M. Radulović, D. Blagojević, and N. Dedović [39] performed field experiments in which they used a tractor connected to a GPS and SR measuring sensors to traverse various soil types. The study aims to examine the correlation between wheel SR and soil physical properties to enhance precision agricultural methodologies. The study found an interesting relationship between the SR of tractor wheels and the physical parameters of the soil. The research highlights the possibility of using tractor-wheel SR data as a cost-efficient and non-invasive method for evaluating soil physical characteristics. These findings emphasize the significance of incorporating these data into precision agricultural systems to attain more effective and focused soil management practices. While Davies, D., J. Finney, and S. Richardson [55] studied the influence of tractor weight and wheel SR on the compaction of soil, an important factor in agricultural practices, others researchers conducted trials in the field with a tractor using different weights and wheel SR conditions. They quantified soil compaction by evaluating factors including bulk density, penetration resistance, and pore size distribution. It conducted a comparison of these observations across different soil types while considering varied combinations of tractor weight and wheel slip. Based on the study, both the weight of the tractors and the amount of wheel slide have important effects on soil compaction.
Furthermore, the findings indicate that the draft force during the loading of A-TE significantly influenced the SR values. The SR values, representing the soil resistance, were significantly affected by the type of tillage practice A-TE used (p < 0.05) (Figure 5C). Specifically, under CP, MP, and DP, the SR values were 18.35, 13.69, and 9.75%, respectively. These values were significantly higher compared to the SR values under DH, TH, and control treatments, which were 6.03, 4.44, and 2.64%, respectively. The reason behind these differences can be attributed to the optimal wheel SR increase in the conservation tillage system. As the traction resistance increases, the movement of the wheels, the tractor performance, and the running of the hauliers during ditching decrease [56]. Moreover, increasing soil depth during tillage requires a greater force to pull the plough, due to the larger mass of soil that the plow blade must cut through. This added resistance slows down the tractor’s operational speed, which, in turn, affects the SR [57,58]. The study conducted by Wang, Q., X. Wang, W. Wang, Y. Song, and Y. Cui [56] introduces an integrated control approach for a wheeled electric tractor designed specifically for ploughing operations. The investigation focuses on a particular variety of tractors that is outfitted with a battery pack that can roll. The investigation entails carrying out field tests in which the wheeled electric tractor carries out plowing operations under different conditions. They also gather data on the velocity of the tractor, the rate at which it slips, the amount of power it consumes, and other pertinent characteristics. The findings indicate that the combined control method efficiently regulates the velocity and slip ratio of the tractor, resulting in increased plowing capacity and energy conservation. This technology helps the tractor to adjust to different soil types and retain the best possible traction performance while conserving energy consumption.
Additionally, the motion resistance increases as the operation depth of the tillage equipment increases. On the other hand, the SR decreases as the ploughing resistance decreases, as seen in conventional and minimum tillage systems [14,21,24,59,60,61,62,63].
The average values of tractor rear SR measurements, obtained using the NDSS and CM, were analyzed for various A-TE at six agri-experimental sites. The results, depicted in Figure 6, demonstrate that the average SR values increased with the use of CP and MP for all Ts, according to both methodologies. However, these values decreased when control treatments were applied. The rationale behind this phenomenon is that increased tillage depths in CP and MP systems lead to a linear increase in the load on the plough. This is caused by the thicker tilled soil layer during the ploughing operation, particularly with certain tillage implements like the MP [58]. Consequently, the increased soil tillage depth results in higher rolling and tillage resistance, leading to an overall increase in SR [14,64,65]. Askari, M., Y. Abbaspour-Gilandeh, E. Taghinezhad, R. Hegazy, and M. Okasha [14] present the utilization of response surface methodology (RSM) to predict and improve the overall energy efficiency of a tractor–implement system in semi-deep tillage. The results highlight the significant effect of tillage tines, speeds, and depths on the total energy efficiency. Additionally, the RSM method offers precise forecasts and visual depictions of these impacts. The determined ideal conditions can guide the design and functioning of tractor–implement systems to achieve improved energy efficiency in semi-deep tillage.
The Upadhyay, G. and H. Raheman [65] investigation examines the SR phenomena that occur during tillage operations, using two different methods: free rolling and powered disc harrow. The study generally investigates sandy clay loam soil. The study highlights the significance of reducing slip in order to optimize tillage operations and offers significant insights for choosing suitable tillage techniques based on soil conditions. Furthermore, achieving optimal SR and ploughing depth can be accomplished by controlling the tillage speed, disk angle, and tilt angle of the plough, as has been previously noted in studies [22,26,38,63,66]. On the other hand, the reduction in SR observed in DH, TH, and control treatments can be attributed to their lower draft force requirement across all Ts.
The slippage measurement techniques did not significantly affect the SR values (Figure 6). However, the highest SR values for tractors using different A-TE were observed with the NDSS and CM at the silty loam x CP site, registering 19.33% and 19%, respectively (see Figure 6E). Similarly, at the clay (sixth site) × CP location, the NDSS and CM measured SR values of 19.33% and 19.63%, respectively (Figure 6F). On the other hand, the lowest SR values for control treatments at the loam x CP site were found using both the NDSS and CM (Figure 6C). Similar findings were observed for the silty clay loam × control treatments (Figure 6D). Consequently, our results demonstrate that the tillage systems (CP, MP, DP, DH, TH) compared to the control treatment exhibit a consistent trend in both slippage measurement methods, indicating that the average SR values were influenced by variations in soil texture.

3.2. Statistical Analysis of Tractor Rear Wheel Slip Rate

Descriptive statistics were employed to scrutinize the digitalized SR exhibited by tractor rear wheels across six distinct Ts. The analysis takes into account the influence of various A-TE, with SR values estimated using both an NDSS wireless method and the traditional control method (CM) (Table 2). The NDSS and CM methods offer insights into the minimum and maximum SR values, along with the coefficient of variation (CV) and standard error of the mean (SEM) for SR values during tillage operations.
Table 2 showcases the significant variability in SR values across treatments with different Ts. Notably, the highest SR values of 19.33 and 19.63% were observed in clay soil (sixth site) using the NDSS and CM methods, respectively. The order of SR values across Ts was loam > clay > silty clay loam > loam > silty clay. This variation is influenced by the distinctive physical characteristics of the Ts, impacting traction and wheel stability [14]. Additionally, A-TE selection plays a role [33], introducing differences in traction and SR values. The study performed by Md-Tahir, H., J. Zhang, J. Xia, C. Zhang, H. Zhou, and Y. Zhu [33] shows the significance of improving the design of rigid lugged wheels for agricultural tractors. This optimization aims to increase traction performance while enhancing the interface between the wheels and the soil in field operations. The outcomes indicate that specific characteristics of lug design, such as the height and angle of the lugs, significantly affect the traction performance. They find the most effective lug design combinations that enhance traction efficiency and reduce SR. In addition, they investigate the consequences of lug design on soil compaction, showing the significance of maintaining a balance between traction performance and soil preservation.
The intricate interplay between Ts and A-TE underscores their close relationship and the consequential impact on tractor performance. Further investigation is warranted for a deeper understanding of these processes governing SR as assessed by the NDSS.
The average SR values obtained using the NDSS align well with those from the conventional approach across various Ts. Silty loam characteristics yielded the highest average SR values (11.46 and 11.48% for NDSS and traditional approaches, respectively). In contrast, the silty clay soil recorded the lowest average SR values for both methods at 7.25 and 7.19%, respectively. This consistency in results highlights the agreement between the two SR measurement techniques when calculating the average SR values over a range of Ts.
The high CV for SR values using both methods across various Ts underscore a significant contribution of this study. Regardless of the measurement method, Ts properties exert a notable influence on the SR values. Specifically, NDSS-derived average CV values for the silty clay, loam, and silty clay loam textures were 80.9, 80.2, and 78.9%, respectively (Table 2). These results affirm the substantial effect of Ts on the SR values, emphasizing the need to consider such factors when evaluating SR through different measurement methods.
It is important to note that the NDSS and CM methods for SR measurement were implemented simultaneously; however, variations in field conditions, tillage depths, and soil µ may have caused slight fluctuations in the SR values. This inherent challenge highlights the need for further research to minimize discrepancies between the SR values measured by the NDSS and those indicated by traditional methods.

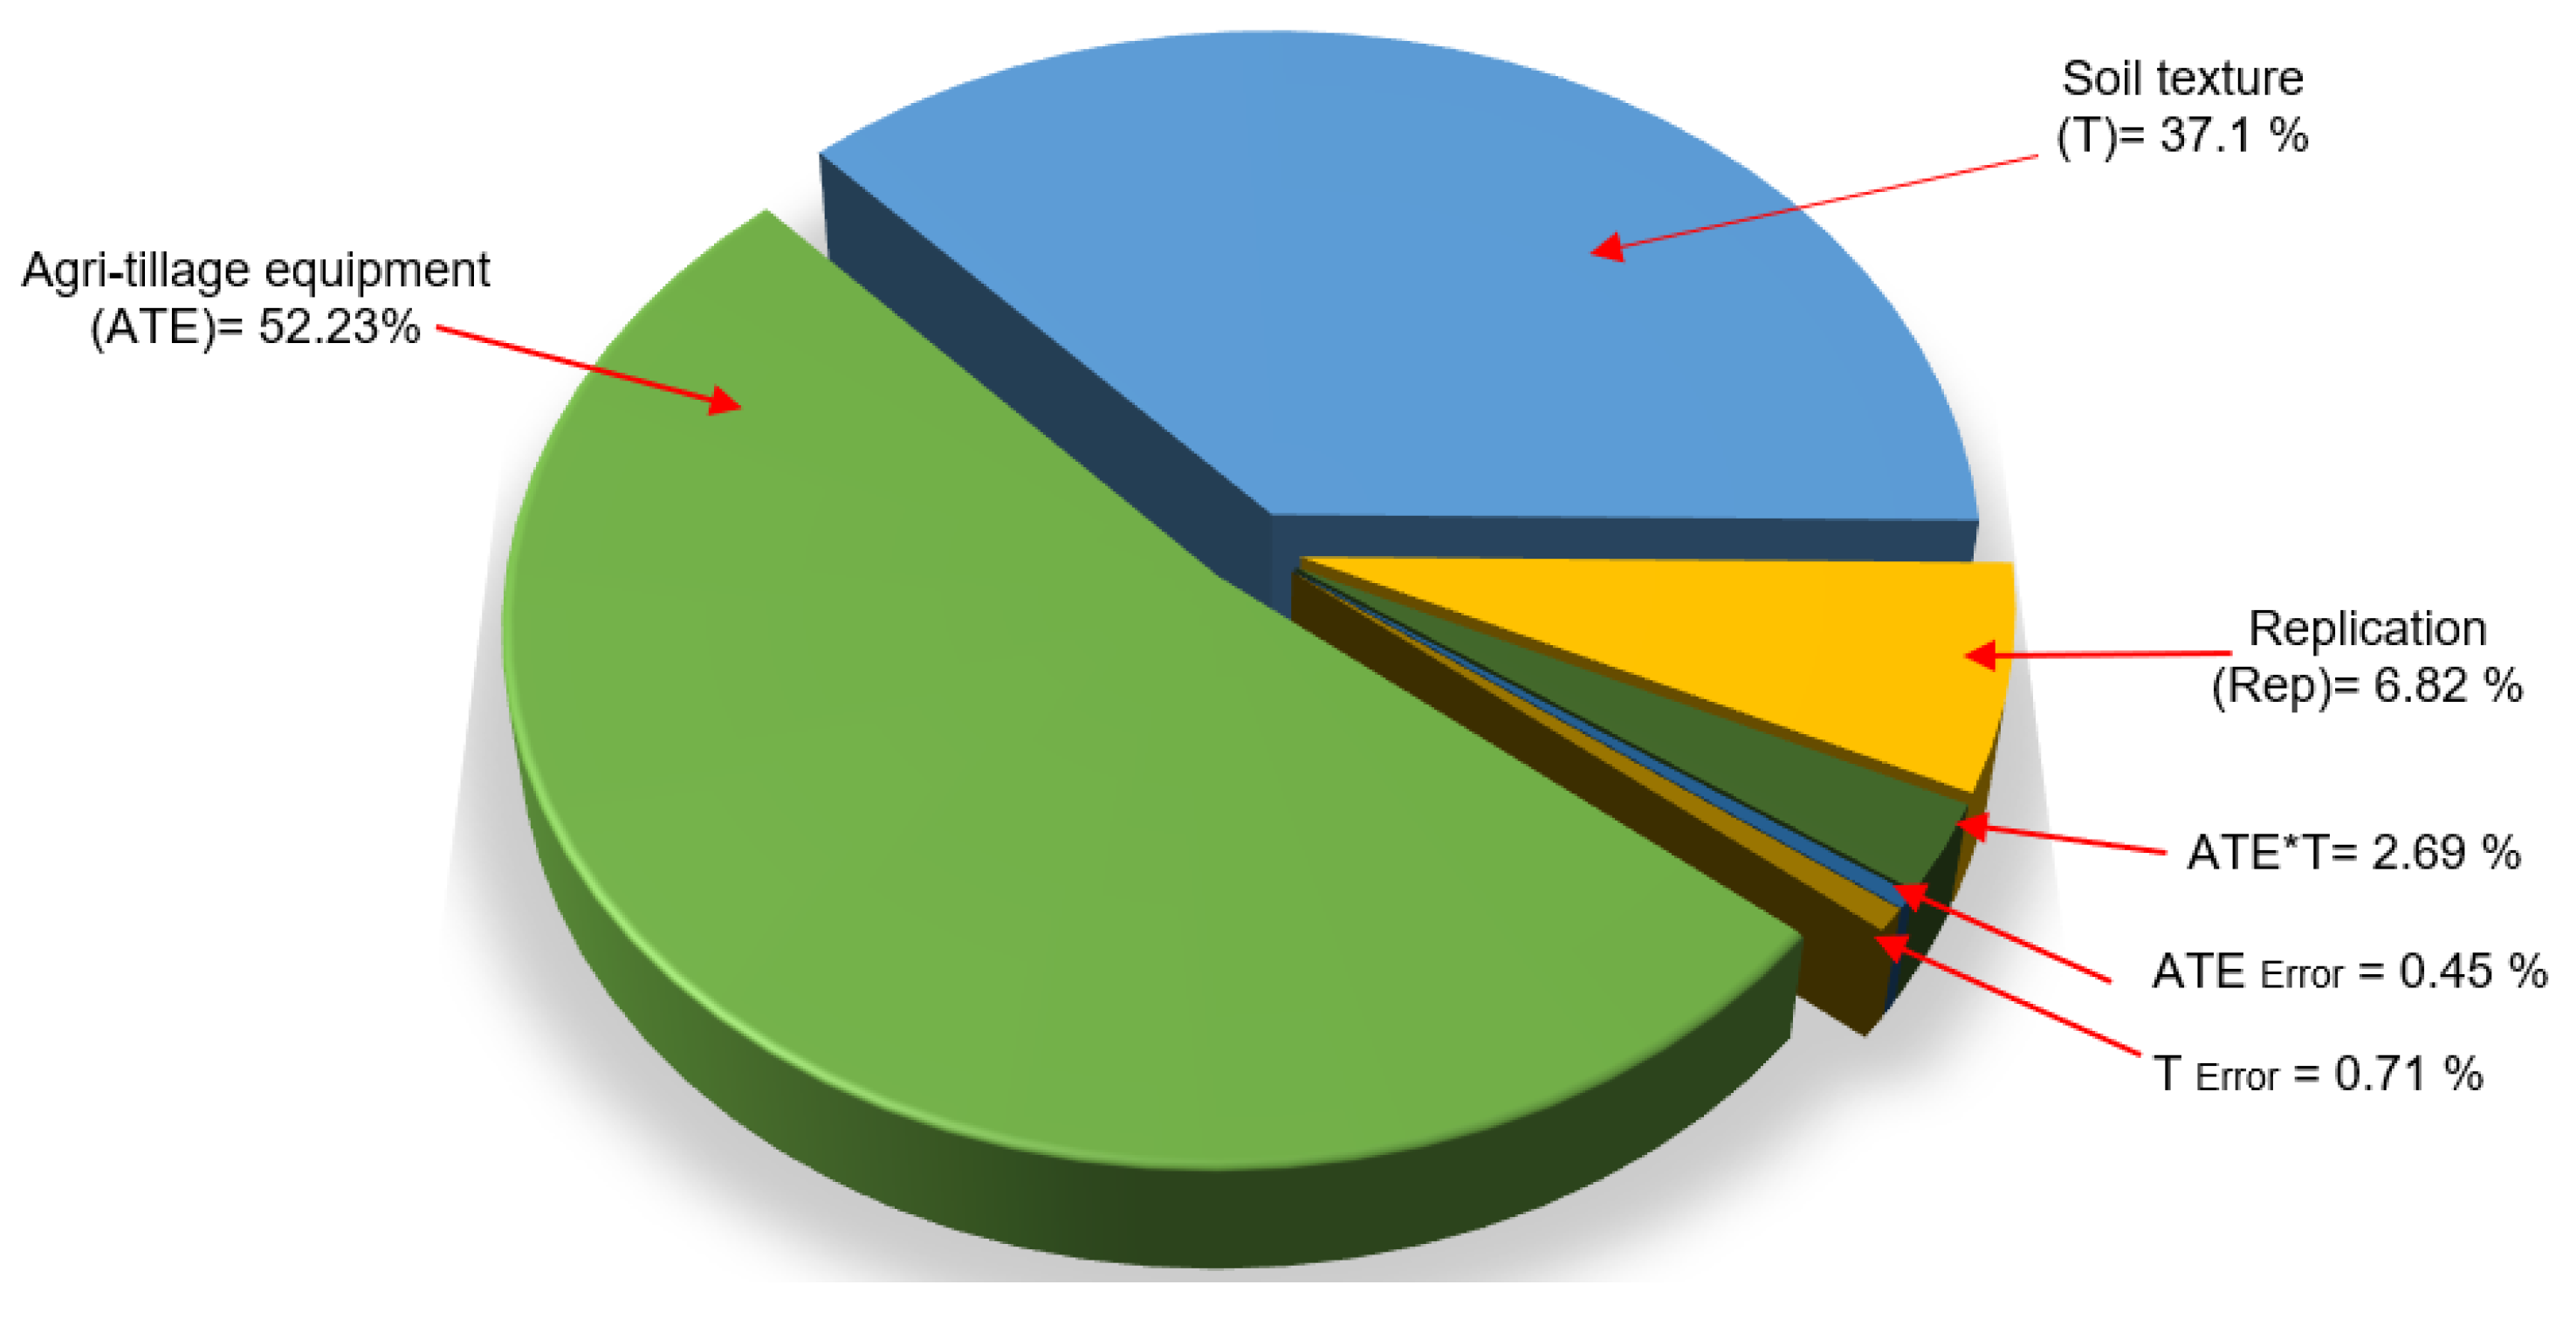
3.3. ANOVA for Tractor Rear Wheel SR

The ANOVA for the NDSS-determined SR values across different Ts and A-TE are presented in Table 3. Significance was determined based on p- and F-values below a predetermined threshold indicating significant differences.
The study revealed that both Ts and A-TE exerted a significant individual impact on the SR values at a 5% significance level. The estimated F values were 69.27 for Ts and 902.74 for A-TE, signifying noteworthy effects from both components. Interestingly, the F value for A-TE indicated a more substantial influence on the SR values compared to Ts. Conversely, the statistical assessment revealed that the measurement method, represented by the SR values (M), was not statistically significant. This suggests that the choice of the measurement method did not have a substantial impact on the SR values. Furthermore, the variations in Ts and A-TE combinations did not exhibit significant differences in the SR values.
These findings emphasize the individual and significant effects of Ts and A-TE on SR values, with A-TE exerting a more pronounced influence. Additionally, the selection of the measuring technique and the resulting variations in Ts and A-TE did not yield any significant differences in the SR values.

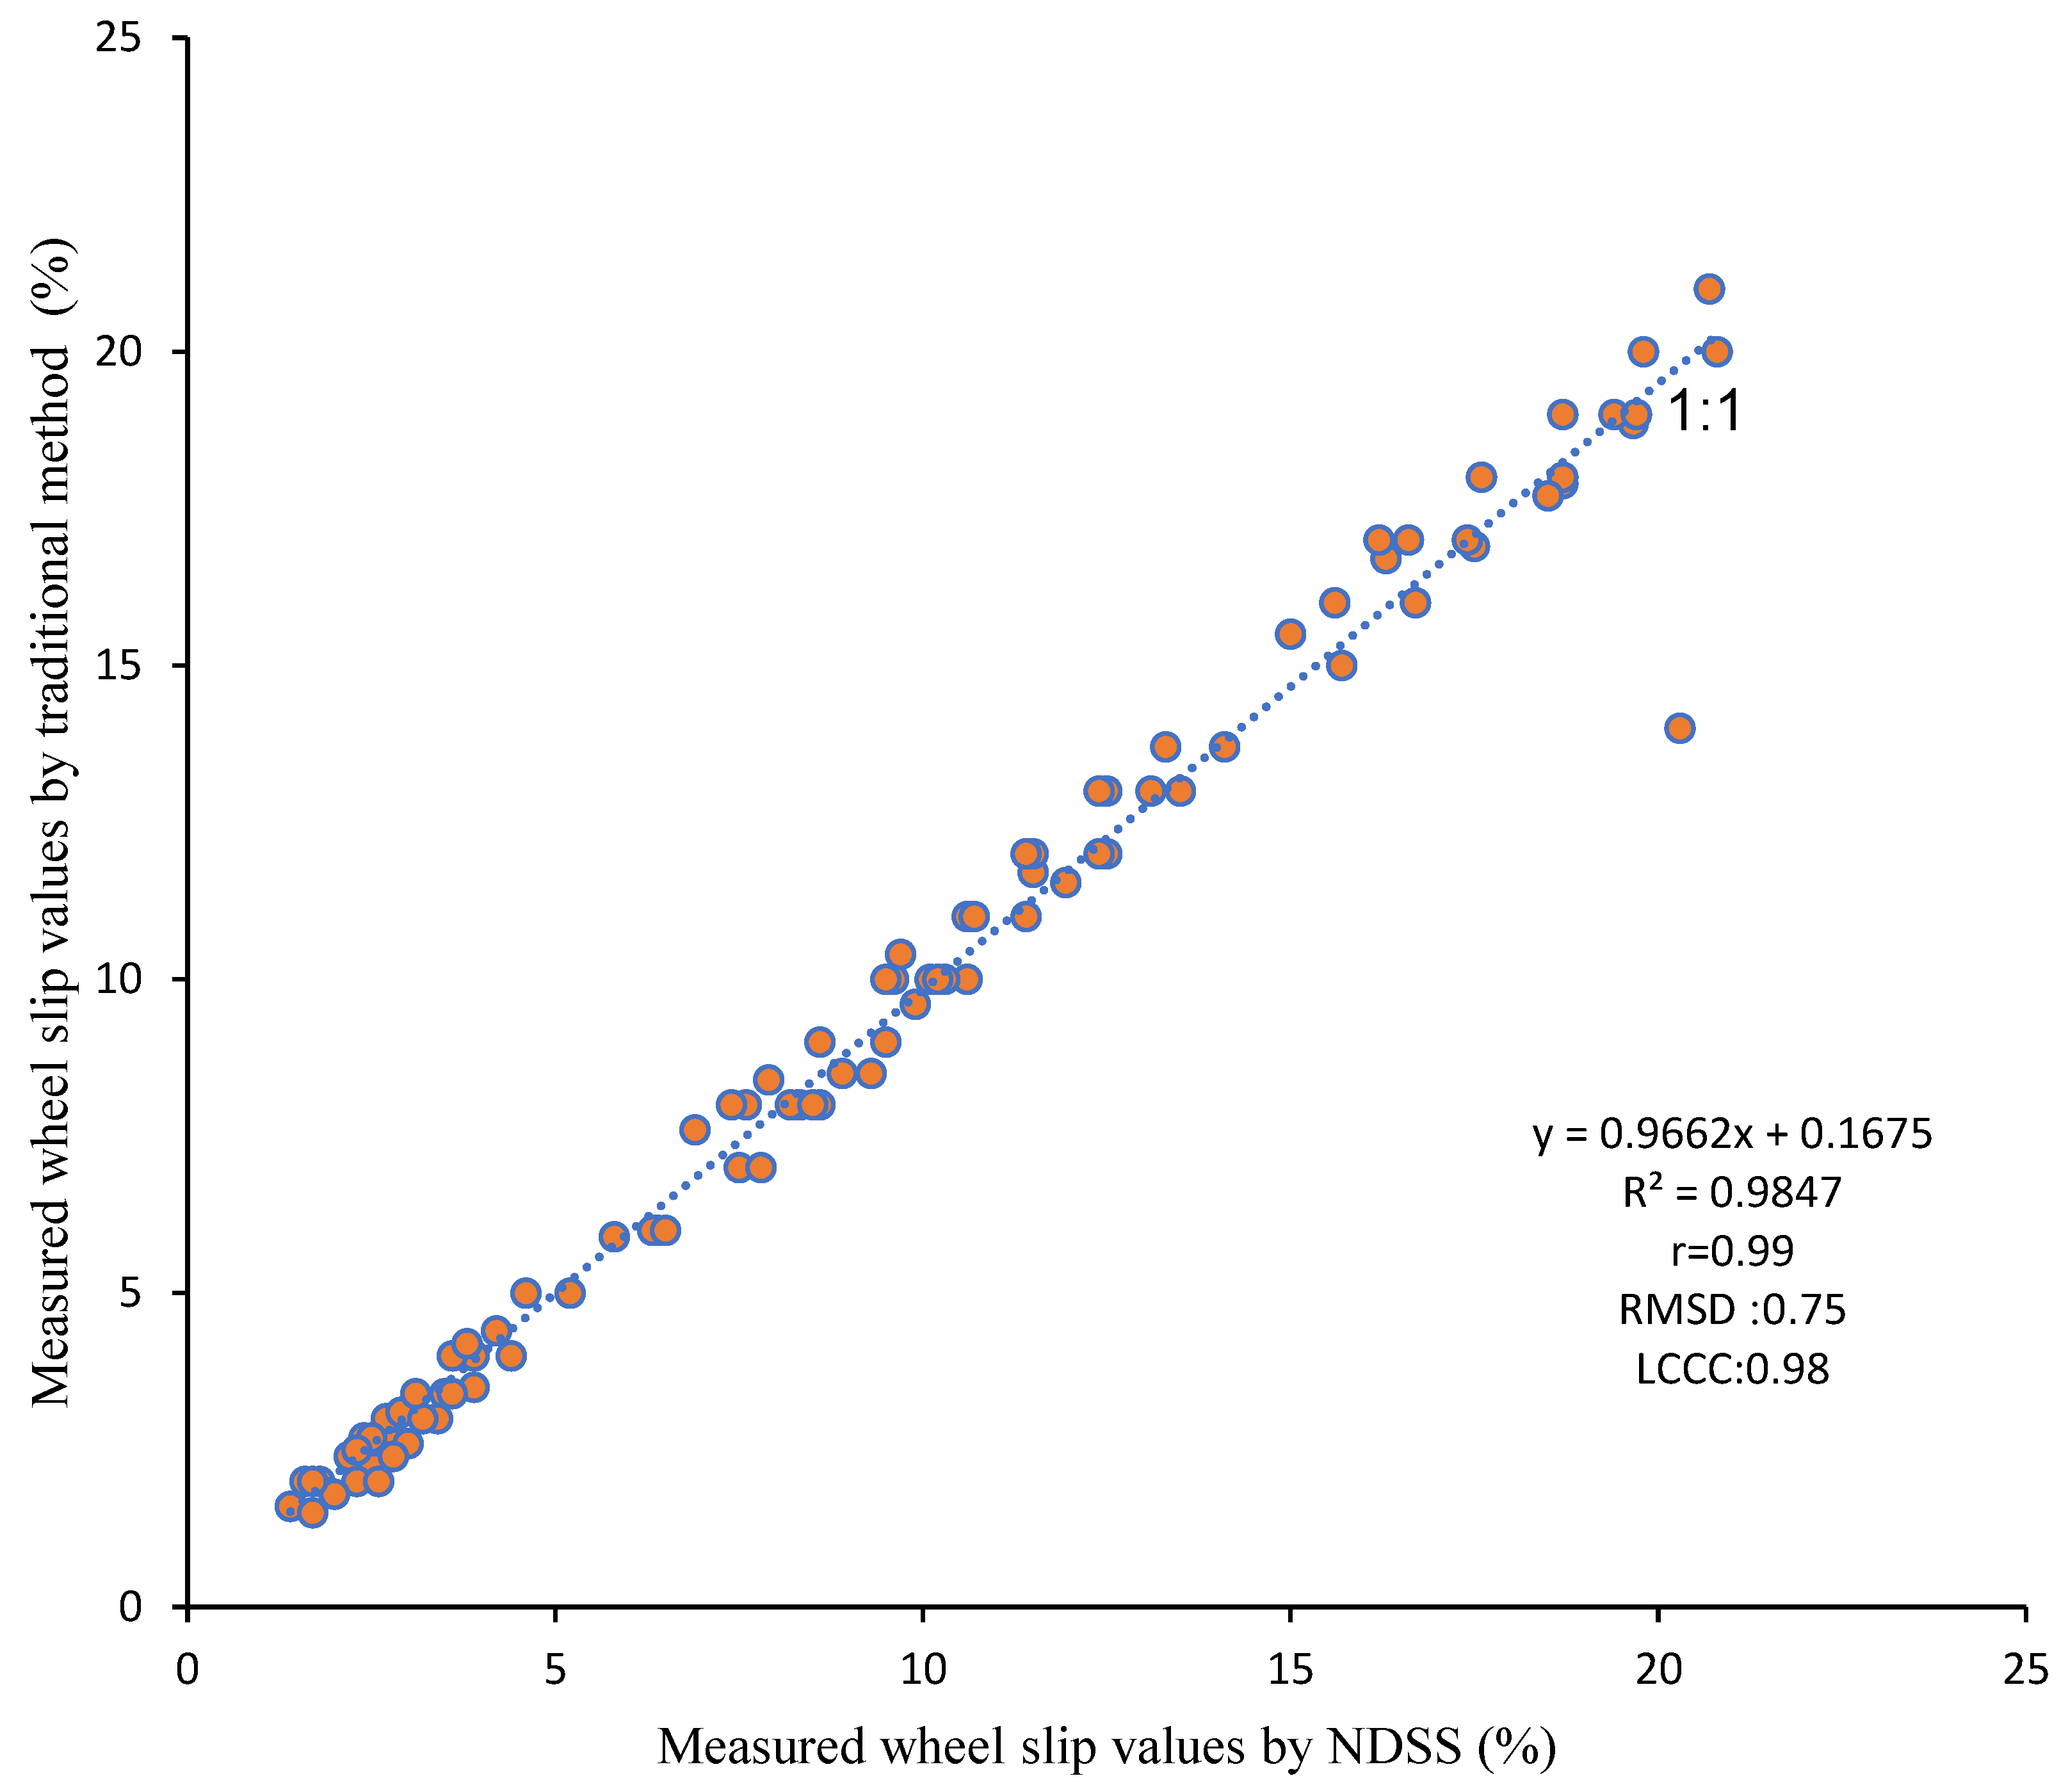
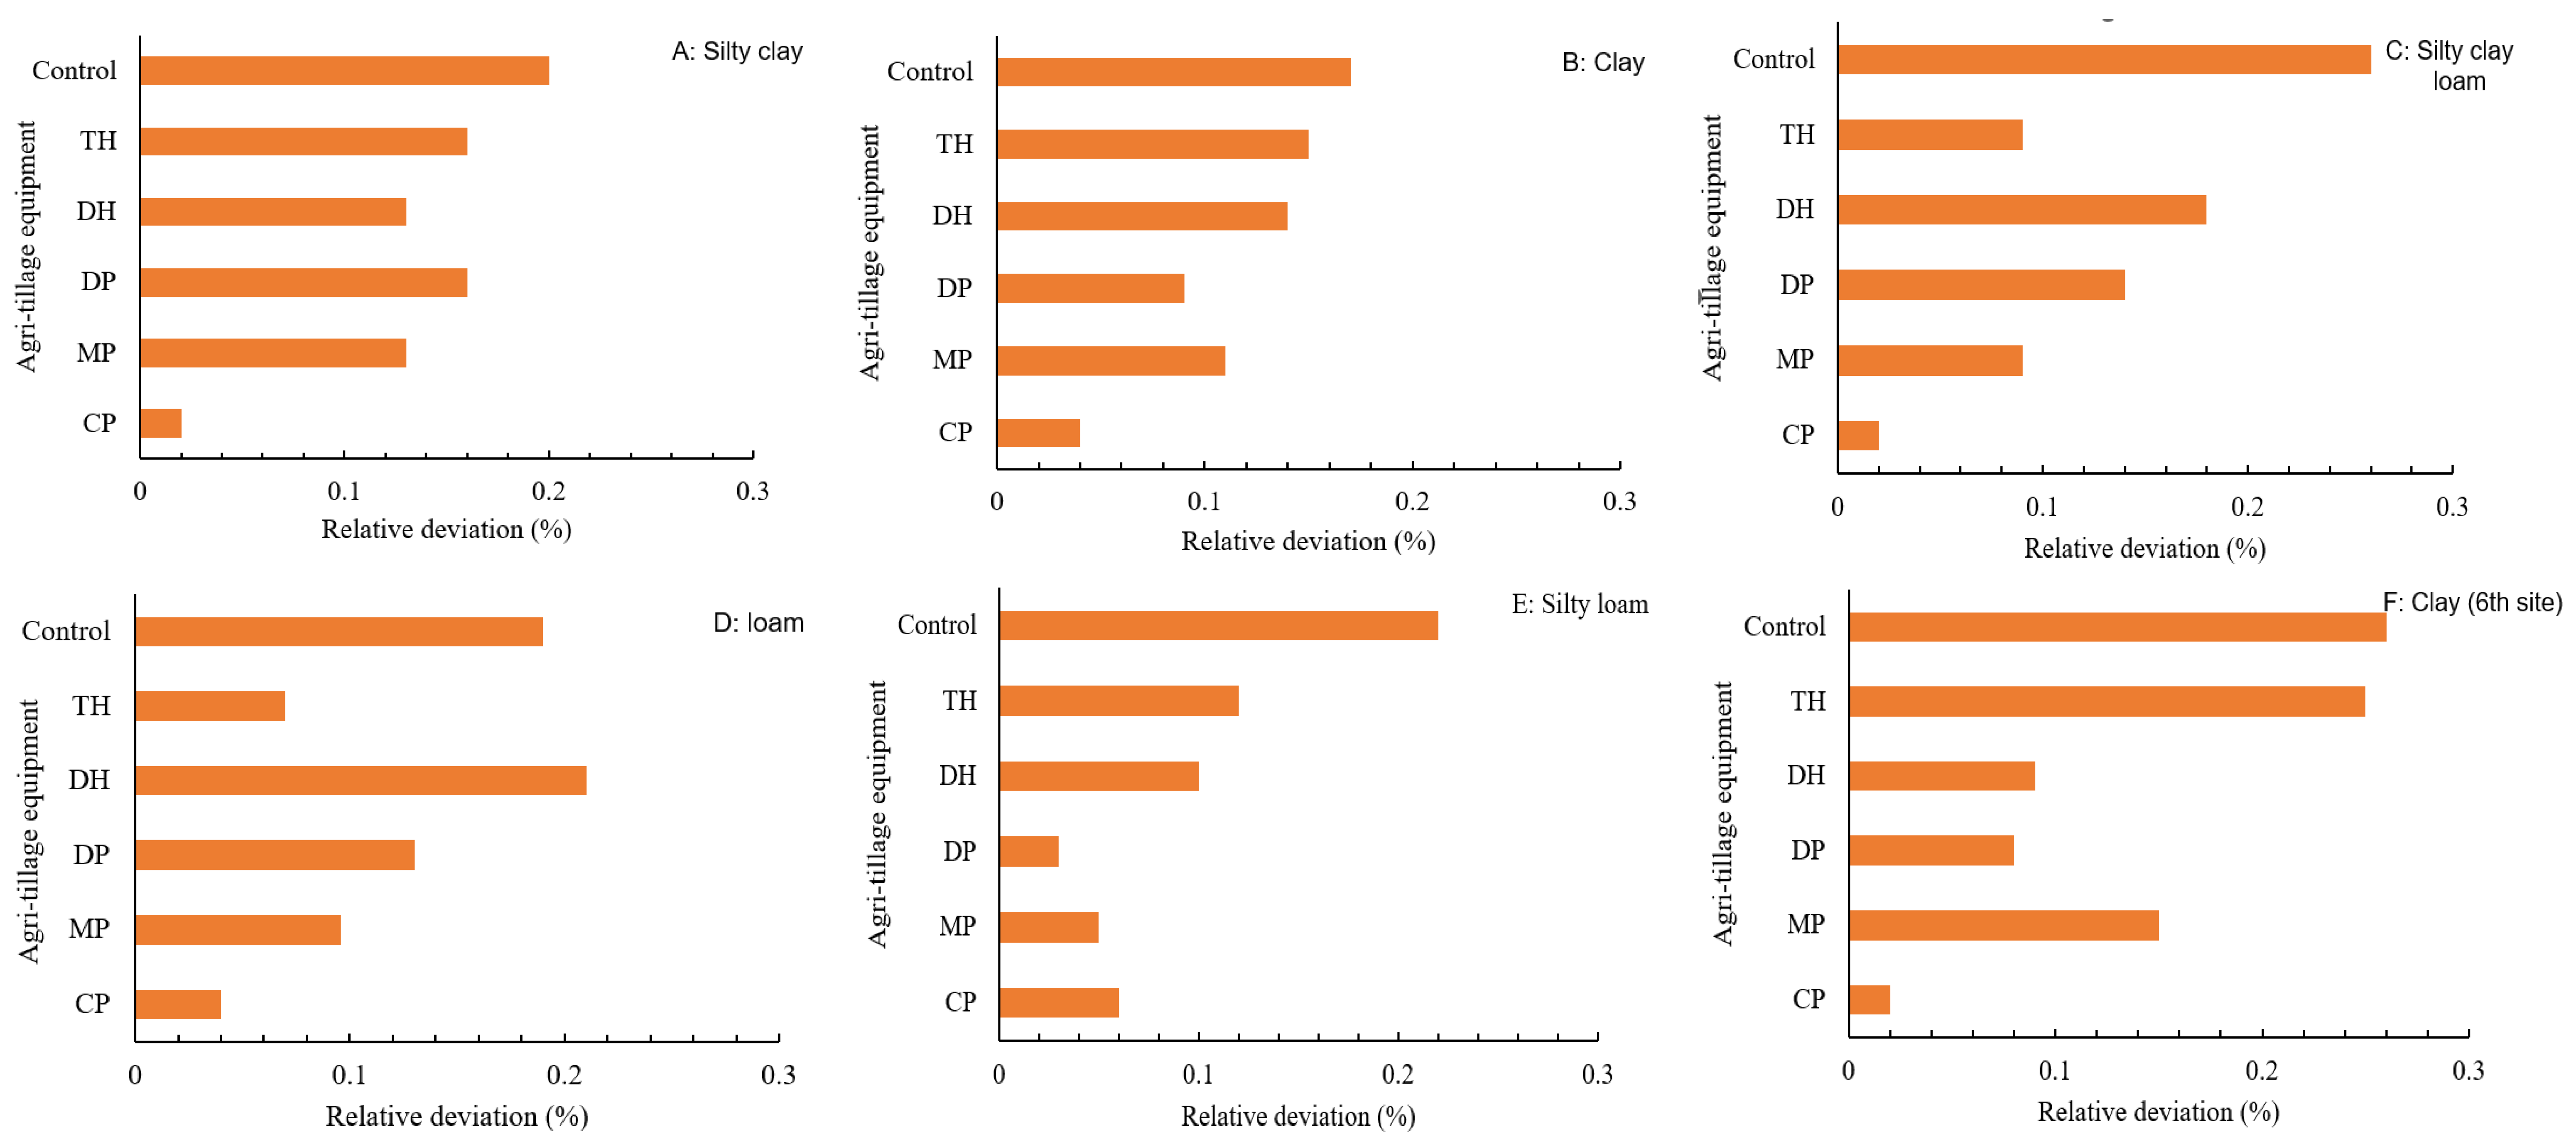
3.4. Evaluating NDSS Performance in SR Measurements

One of this study’s key revelations is the substantial contributions of A-TE, Ts, and their interaction to the impact of SR behaviors in tractor wheels, as depicted in Figure 7. This investigation indicates that A-TE contributes approximately 52.23% of the overall effect, Ts account for 37.1%, and their interaction represents 2.69%. This underscores the dominant influence of A-TE on SR behaviors, although the relationship is intricate and susceptible to various factors. Different A-TE types, such as moldboard, disc, chisel plough, and furrow, significantly impact SR behaviors [5,22,36,56]. In their study, the authors of [5] focused on developing a model that uses the discrete element method (DEM) and multibody dynamics (MBD) to predict the draft forces experienced by agricultural tractors during ploughing operations at various depths. The results indicate that the DEM-MBD coupling model offers precise forecasts of draft forces for various ploughing depths. The model accurately shows the intricate interplay between the soil and the tractor, enabling a more accurate calculation of draft forces for ploughing operations.
While soil tillage (Ts) encompasses parameters like moisture content (µ), bulk density (ρb), and clay + silt content, each influencing SR [39,67,68,69], the study conducted by [39] examines the utilization of georeferenced tractor wheel SR data to forecast the geographical diversity of soil physical characteristics. The investigation uses machine learning methodologies to identify the correlations between wheel SR and the properties of the soil. The results highlight the efficacy of this method in precision agriculture, allowing farmers to enhance their soil management practices by considering differences between regions in soil characteristics. These results underscore the complex interaction affecting SR behaviors between A-TE, Ts, and other related components, emphasizing the need for careful consideration in optimizing tractor performance and minimizing SR. Further exploration is crucial to deepen our understanding of the underlying mechanisms and formulate strategies to mitigate the influence of these factors on SR behaviors.
Within the observed range of SR values (1.4 to 21%), a strong linear correlation was found between the observed and expected values when analyzing the NDSS using the entire dataset. The high correlation coefficient (R = 0.99) demonstrates the reliability of the NDSS in accurately measuring SR values (Figure 8).
A qualitative assessment using Lin’s concordance correlation coefficient (LCCC) and the root-mean-square deviation (RMSD) further confirms the accuracy of SR results across various Ts, with a low RMSD index of 0.75% and a high LCCC value of 0.96%. These results demonstrate a significant agreement and high precision in SR measurements among different Ts.
The precision of SR measurements with the NDSS is evaluated based on validation data presented in Table 4. The statistics reveal low mean prediction error (MPE) values and a maximum coefficient of determination (R2) (Figure 8), indicating high accuracy in measuring SR. The accuracy is influenced by both A-TE and Ts, with the control treatment showing higher standard deviation of prediction error (SDPE) values. Notably, the highest SDPE values occur in clay-textured soil sites (sixth site), while the lowest SDPE values are associated with loam soil texture. This emphasizes the importance of considering Ts alongside standard effectiveness metrics when evaluating the NDSS performance in SR measurements.
Figure 9 illustrates the influence of Ts and A-TE on selected underestimations and overestimations of SR values determined by the NDSS. The greatest overestimations are in clay-textured soil (second site), while silty clay loam consistently shows the highest underestimations. Additionally, the NDSS consistently underestimates SR values in the DP tillage system compared to other A-TE treatments.
To further assess the accuracy of the NDSS compared to the CM, the relative deviation (RD) was employed (Figure 10). CP treatment exhibited a lower average RD across all observations, indicating higher accuracy. Conversely, control treatments with different Ts exhibited higher RD values.
These findings provide valuable insights into the accuracy and deviation of the NDSS compared to the CM across different Ts and treatments. Therefore, the NDSS method proves to be highly suitable for measuring SR behaviors of tractor wheels across various field sites and different A-TE. Its flexibility, configurability, and remarkable accuracy make it a crucial instrument in agricultural research and tractor performance evaluation for precise SR assessment.

3.5. Assessing the Cost of Implementing the NDSS

Table 5 outlines the comprehensive evaluation of expenses incurred in constructing the NDSS. The meticulous assessment focused on pricing for diverse hardware components, resulting in a cost of USD 129.3. This total includes expenses related to various hardware components and additional elements essential for NDSS functionality.

3.6. Limitations of the NDSS and Future Research

While this study has provided valuable insights, it is crucial to acknowledge its limitations and identify avenues for future research:
  • Applicability to specific context: This study focused on assessing SR in rear-wheel-drive tractors used in Iraq. To extend the findings to other regions or diverse agricultural scenarios, additional empirical research is necessary. The applicability of the NDSS in varied contexts needs thorough exploration. For example, using machine learning algorithms to improve data analysis and predictive capabilities.
  • Scaling challenges: While the NDSS demonstrated accurate measurements, its application on a larger scale may face several challenges. Factors such as machinery speed, soil friction coefficients, tillage depths, equipment cost, availability, and levels of technical expertise could pose barriers to widespread adoption and long-term evaluations. Future research should address these challenges for broader implementation, leading to design refinements based on the NDSS.
  • Comprehensive variable consideration: The study predominantly investigated the impact of Ts and A-TE on SR. However, other variables such as weather conditions, terrain characteristics, and operator expertise were not systematically explored. Future research endeavours should aim to include a more comprehensive range of variables for a holistic understanding of the SR dynamics.
  • Validation against established procedures: While the NDSS demonstrated similar results to traditional methods, future research should validate it against other established procedures to enhance its resilience and reliability. Comparisons with diverse measurement techniques will strengthen the NDSS’s credibility and provide a more comprehensive assessment of its performance.
Addressing these limitations will contribute to the robustness and practicality of the NDSS in real-world agricultural settings, ensuring its effectiveness across diverse conditions and applications.

4. Conclusions

This research investigated the development of an NDSS wireless technology in determining SR for tractor rear wheels, comparing its performance against CM. The study delved into the capacity of the NDSS to measure SR across diverse field conditions, considering the influence of Ts and A-TE. The key findings can be summarized as follows:
  • Consistency in SR measurement methods: The methods utilized to quantify SR demonstrated remarkable consistency across diverse field conditions, showcasing the robustness of both the NDSS and CM.
  • Influence of Ts and A-TE: Both Ts and A-TE exerted significant effects on SR, emphasizing the importance of these factors in assessing tractor performance.
  • Outstanding statistical performance of the NDSS: The NDSS showcased exceptional statistical performance (R2 = 0.98; RMSD: 0.75%; LCCC: 0.96%) across all soil treatments, closely aligning with values anticipated by CM.
  • Enhanced accuracy of NDSS: The NDSS demonstrated heightened accuracy in SR measurements compared to the CM, evidenced by reduced MPE and SDPE values across Ts and A-TE.
  • Impact of soil tillage depths and characteristics: Soil tillage depths, µ, and electromagnetic conductivity emerged as significant factors influencing SR, as assessed by the NDSS.
  • Reliability of NDSS: The NDSS proved to be a reliable instrument for assessing SR in rear tractor wheels, offering high precision and substantial agreement with CM. The findings underscore the necessity of considering soil conditions and ploughing methods when interpreting SR measurements obtained through the NDSS.
In conclusion, the NDSS stands as a promising technology for advancing the measurement and understanding of tractor slip behaviors, paving the way for improved agricultural practices and performance evaluation.

Author Contributions

Conceptualization: A.A.G.A.-S., A.C.-C. and J.F.-G.; Methodology: A.A.G.A.-S., A.C.-C. and J.F.-G.; Software: A.A.G.A.-S.; Validation: A.C.-C. and J.F.-G.; Formal analysis: A.A.G.A.-S.; Investigation: A.A.G.A.-S.; Data curation: A.C.-C. and J.F-G.; Writing—original draft preparation: A.A.G.A.-S.; Writing—review and editing: A.C.-C. and J.F.-G.; Supervision: A.C.-C.; Project administration: A.A.G.A.-S.; Funding acquisition: A.A.G.A.-S. All authors have read and agreed to the published version of the manuscript.

Funding

This research received no external funding.

Institutional Review Board Statement

Not applicable.

Data Availability Statement

Data are available on request from the authors.

Conflicts of Interest

The authors declare no conflicts of interest.

References

  1. Goering, C.E. Century of tractor development: 1907–2007. Trans. ASABE 2008, 51, 379–383. [Google Scholar] [CrossRef]
  2. Jongerden, J.; Wolters, W.; Dijkxhoorn, Y.; Gür, F.; Öztürk, M. The politics of agricultural development in Iraq and the Kurdistan Region in Iraq (KRI). Sustainability 2019, 11, 5874. [Google Scholar] [CrossRef]
  3. Wen, C.-K.; Ren, W.; Zhu, Q.-Z.; Zhao, C.-J.; Luo, Z.-H.; Zhang, S.-L.; Xie, B.; Meng, Z.-J. Reducing operation emissions and improving work efficiency using a pure electric wheel drive tractor. Engineering 2024, 37, 230–245. [Google Scholar] [CrossRef]
  4. Li, X.; Xu, L.; Liu, M.; Yan, X.; Zhang, M. Research on torque cooperative control of distributed drive system for fuel cell electric tractor. Comput. Electron. Agric. 2024, 219, 108811. [Google Scholar] [CrossRef]
  5. Kim, Y.-S.; Lee, S.-D.; Baek, S.-M.; Baek, S.-Y.; Jeon, H.-H.; Lee, J.-H.; Abu Ayub Siddique, M.; Kim, Y.-J.; Kim, W.-S.; Sim, T.; et al. Development of DEM-MBD coupling model for draft force prediction of agricultural tractor with plowing depth. Comput. Electron. Agric. 2022, 202, 107405. [Google Scholar] [CrossRef]
  6. Al-Shammary, A.A.G.; Al-Shihmani, L.S.S.; Fernández-Gálvez, J.; Caballero-Calvo, A. Optimizing sustainable agriculture: A comprehensive review of agronomic practices and their impacts on soil attributes. J. Environ. Manag. 2024, 364, 121487. [Google Scholar] [CrossRef]
  7. Moinfar, A.; Shahgholi, G.; Gilandeh, Y.A.; Gundoshmian, T.M. The effect of the tractor driving system on its performance and fuel consumption. Energy 2020, 202, 117803. [Google Scholar] [CrossRef]
  8. Janulevičius, A.; Damanauskas, V.; Pupinis, G. Effect of variations in front wheels driving lead on performance of a farm tractor with mechanical front-wheel-drive. J. Terramech. 2018, 77, 23–30. [Google Scholar] [CrossRef]
  9. Singh, A.; Nawayseh, N.; Singh, H.; Dhabi, Y.K.; Samuel, S. Internet of agriculture: Analyzing and predicting tractor ride comfort through supervised machine learning. Eng. Appl. Artif. Intell. 2023, 125, 106720. [Google Scholar] [CrossRef]
  10. Janulevičius, A.; Damanauskas, V. Prediction of tractor drive tire slippage under different inflation pressures. J. Terramech. 2022, 101, 23–31. [Google Scholar] [CrossRef]
  11. Moinfar, A.; Shahgholi, G.; Gilandeh, Y.A.; Kaveh, M.; Szymanek, M. Investigating the effect of the tractor driving system type on soil compaction using different methods of ANN, ANFIS and step wise regression. Soil Tillage Res. 2022, 222, 105444. [Google Scholar] [CrossRef]
  12. Siddique, M.A.A.; Baek, S.-M.; Baek, S.-Y.; Jeon, H.-H.; Kim, Y.-J.; Kim, Y.-S.; Kim, W.-S.; Lee, D.-H.; Lim, R.-G.; Kim, T.-J. Application of auto power shift (APS) controller for minimizing fuel consumption and performance evaluation of an agricultural tractor. Comput. Electron. Agric. 2023, 214, 108279. [Google Scholar] [CrossRef]
  13. Obalalu, A.M.; Alqarni, M.M.; Odetunde, C.; Memon, M.A.; Olayemi, O.A.; Shobo, A.B.; Mahmoud, E.E.; Ali, M.R.; Sadat, R.; Hendy, A.S. Improving agricultural efficiency with solar-powered tractors and magnetohydrodynamic entropy generation in copper–silver nanofluid flow. Case Stud. Therm. Eng. 2023, 51, 103603. [Google Scholar] [CrossRef]
  14. Askari, M.; Abbaspour-Gilandeh, Y.; Taghinezhad, E.; Hegazy, R.; Okasha, M. Prediction and optimizing the multiple responses of the overall energy efficiency (OEE) of a tractor-implement system using response surface methodology. J. Terramech. 2022, 103, 11–17. [Google Scholar] [CrossRef]
  15. Battiato, A.; Diserens, E. Influence of Soil on the Traction Performance of a 65 kW MFWD Tractor. J. Agric. Sci. 2019, 11, 11. [Google Scholar] [CrossRef]
  16. Čiplienė, A.; Gurevičius, P.; Janulevičius, A.; Damanauskas, V. Experimental validation of tyre inflation pressure model to reduce fuel consumption during soil tillage. Biosyst. Eng. 2019, 186, 45–59. [Google Scholar] [CrossRef]
  17. Soylu, S.; Çarman, K. Fuzzy logic based automatic slip control system for agricultural tractors. J. Terramech. 2021, 95, 25–32. [Google Scholar] [CrossRef]
  18. Damanauskas, V.; Janulevičius, A. Differences in tractor performance parameters between single-wheel 4WD and dual-wheel 2WD driving systems. J. Terramech. 2015, 60, 63–73. [Google Scholar] [CrossRef]
  19. Nataraj, E.; Sarkar, P.; Raheman, H.; Upadhyay, G. Embedded digital display and warning system of velocity ratio and wheel slip for tractor operated active tillage implements. J. Terramech. 2021, 97, 35–43. [Google Scholar] [CrossRef]
  20. ASAE Standard S296.2; Uniform Terminology for Traction of Agricultural Tractors. Self-Propelled Implements, and Other Traction and Transport Devices. ASAE Standard: St Joseph, MI, USA, 1983.
  21. Shafaei, S.M.; Loghavi, M.; Kamgar, S. Fundamental realization of longitudinal slip efficiency of tractor wheels in a tillage practice. Soil Tillage Res. 2021, 205, 104765. [Google Scholar] [CrossRef]
  22. Zhang, S.-l.; Wen, C.-k.; Ren, W.; Luo, Z.-h.; Xie, B.; Zhu, Z.-x.; Chen, Z.-j. A joint control method considering travel speed and slip for reducing energy consumption of rear wheel independent drive electric tractor in ploughing. Energy 2023, 263, 126008. [Google Scholar] [CrossRef]
  23. Gupta, C.; Tewari, V.K.; Ashok Kumar, A.; Shrivastava, P. Automatic tractor slip-draft embedded control system. Comput. Electron. Agric. 2019, 165, 104947. [Google Scholar] [CrossRef]
  24. Zhang, S.; Ren, W.; Xie, B.; Luo, Z.; Wen, C.; Chen, Z.; Zhu, Z.; Li, T. A combined control method of traction and ballast for an electric tractor in ploughing based on load transfer. Comput. Electron. Agric. 2023, 207, 107750. [Google Scholar] [CrossRef]
  25. Pranav, P.K.; Tewari, V.K.; Pandey, K.P.; Jha, K.R. Automatic wheel slip control system in field operations for 2WD tractors. Comput. Electron. Agric. 2012, 84, 1–6. [Google Scholar] [CrossRef]
  26. Zhang, S.; Wu, Z.; Chen, J.; Li, Z.; Zhu, Z.; Song, Z.; Mao, E. Control method of driving wheel slip rate of high-power tractor for ploughing operation. Nongye Gongcheng Xuebao/Trans. Chin. Soc. Agric. Eng. 2020, 36, 47–55. [Google Scholar] [CrossRef]
  27. ASAE ANSI/ASAE S296.5; General Terminology for Traction of Agricultural Traction and Transport Devices and Vehicles. ASAE: St. Joseph, MI, USA, 2003.
  28. Lockeretz, W. Energy implications of conservation tillage. J. Soil Water Conserv. 1983, 38, 207–211. [Google Scholar]
  29. Wen, C.-K.; Wang, H.-W.; Luo, C.-H.; Fu, W.-Q.; Zhu, Q.-Z.; Yin, Y.-X.; Meng, Z.-J. Development and testing of a ground recognition system for tractor field operations. Comput. Electron. Agric. 2023, 213, 108190. [Google Scholar] [CrossRef]
  30. Wen, C.; Xie, B.; Song, Z.; Yang, Z.; Dong, N.; Han, J.; Yang, Q.; Liu, J. Methodology for designing tractor accelerated structure tests for an indoor drum-type test bench. Biosyst. Eng. 2021, 205, 1–26. [Google Scholar] [CrossRef]
  31. Zhu, S.; Wang, L.; Zhu, Z.; Mao, E.; Chen, Y.; Liu, Y.; Du, X. Measuring method of slip ratio for tractor driving wheels based on machine vision. Agriculture 2022, 12, 292. [Google Scholar] [CrossRef]
  32. Qiu, Z.; Shi, G.; Zhao, B.; Jin, X.; Zhou, L. Combine harvester remote monitoring system based on multi-source information fusion. Comput. Electron. Agric. 2022, 194, 106771. [Google Scholar] [CrossRef]
  33. Md-Tahir, H.; Zhang, J.; Xia, J.; Zhang, C.; Zhou, H.; Zhu, Y. Rigid lugged wheel for conventional agricultural wheeled tractors—Optimising traction performance and wheel–soil interaction in field operations. Biosyst. Eng. 2019, 188, 14–23. [Google Scholar] [CrossRef]
  34. Singh, T.; Verma, A.; Singh, M. Development and implementation of an IOT based instrumentation system for computing performance of a tractor-implement system. J. Terramech. 2021, 97, 105–118. [Google Scholar] [CrossRef]
  35. Ekinci, Ş.; Çarman, K. Effects of some properties of drive tires used in horticultural tractors on tractive performance. J. Agric. Sci. 2017, 23, 84–94. [Google Scholar]
  36. Bulgakov, V.; Aboltins, A.; Beloev, H.; Nadykto, V.; Kyurchev, V.; Adamchuk, V.; Kaminskiy, V. Maximum admissible slip of tractor wheels without disturbing the soil structure. Appl. Sci. 2021, 11, 6893. [Google Scholar] [CrossRef]
  37. Shafaei, S.; Loghavi, M.; Kamgar, S. On the reliability of intelligent fuzzy system for multivariate pattern scrutinization of power consumption efficiency of mechanical front wheel drive tractor. J. Biosyst. Eng. 2021, 46, 1–15. [Google Scholar] [CrossRef]
  38. Han, J.; Yan, X.; Tang, H. Method of controlling tillage depth for agricultural tractors considering engine load characteristics. Biosyst. Eng. 2023, 227, 95–106. [Google Scholar] [CrossRef]
  39. Kostić, M.; Rajković, M.; Ljubičić, N.; Ivošević, B.; Radulović, M.; Blagojević, D.; Dedović, N. Georeferenced tractor wheel slip data for prediction of spatial variability in soil physical properties. Precis. Agric. 2021, 22, 1659–1684. [Google Scholar] [CrossRef]
  40. Kim, W.-S.; Kim, Y.-J.; Park, S.-U.; Kim, Y.-S. Influence of soil moisture content on the traction performance of a 78-kW agricultural tractor during plow tillage. Soil Tillage Res. 2021, 207, 104851. [Google Scholar] [CrossRef]
  41. Raghavan, G.; McKyes, E.; Chassé, M. Effect of wheel slip on soil compaction. J. Agric. Eng. Res. 1977, 22, 79–83. [Google Scholar] [CrossRef]
  42. Bauer, F.; Porteš, P.; Polcar, A.; Čupera, J.; Fajman, M. Differences in the wheel loads and contact pressure of the in-furrow and on-land rear tractor tyres with mounted and semi-mounted ploughs. Soil Tillage Res. 2022, 215, 105190. [Google Scholar] [CrossRef]
  43. Sunusi, I.I.; Zhou, J.; Wang, Z.Z.; Sun, C.; Ibrahim, I.E.; Opiyo, S.; Soomro, S.A.; Sale, N.A.; Olanrewaju, T. Intelligent tractors: Review of online traction control process. Comput. Electron. Agric. 2020, 170, 105176. [Google Scholar] [CrossRef]
  44. Kumar, R.; Raheman, H. Design and development of a variable hitching system for improving stability of tractor trailer combination. Eng. Agric. Environ. Food 2015, 8, 187–194. [Google Scholar] [CrossRef]
  45. Shafaei, S.M.; Loghavi, M.; Kamgar, S. Benchmark of an intelligent fuzzy calculator for admissible estimation of drawbar pull supplied by mechanical front wheel drive tractor. Artif. Intell. Agric. 2020, 4, 209–218. [Google Scholar] [CrossRef]
  46. Almaliki, S.A.; Himoud, M.S.; Muhsin, S.J. Mathematical model for evaluating slippage of tractor under various field conditions. Basrah J. Agric. Sci. 2021, 34, 49–59. [Google Scholar] [CrossRef]
  47. Kaky, E.; Nolan, V.; Khalil, M.I.; Ameen Mohammed, A.M.; Ahmed Jaf, A.A.; Mohammed-Amin, S.M.; Mahmood, Y.A.; Gilbert, F. Conservation of the Goitered gazelle (Gazella subgutturosa) under climate changes in Iraq. Heliyon 2023, 9, e12501. [Google Scholar] [CrossRef]
  48. Staff, S.S. Keys to Soil Taxonomy; United States Department of Agriculture: Washington, DC, USA, 2014. [Google Scholar]
  49. Alshammary, A.A.G.; Kouzani, A.Z.; Kaynak, A.; Khoo, S.Y.; Norton, M.; Gates, W.P.; AL-Maliki, M.; Rodrigo-Comino, J. The performance of the DES sensor for estimating soil bulk density under the effect of different agronomic practices. Geosciences 2020, 10, 117. [Google Scholar] [CrossRef]
  50. Nakhli, S.A.A.; Panta, S.; Brown, J.D.; Tian, J.; Imhoff, P.T. Quantifying biochar content in a field soil with varying organic matter content using a two-temperature loss on ignition method. Sci. Total Environ. 2019, 658, 1106–1116. [Google Scholar] [CrossRef]
  51. Al-Shammary, A.A.G.; Al-Shihmani, L.S.S.; Caballero-Calvo, A.; Fernández-Gálvez, J. Impact of agronomic practices on physical surface crusts and some soil technical attributes of two winter wheat fields in southern Iraq. J. Soils Sediments 2023, 23, 3917–3936. [Google Scholar] [CrossRef]
  52. Kumar, A.; Pandey, K.P. A device to measure dynamic front wheel reaction to safeguard rearward overturning of agricultural tractors. Comput. Electron. Agric. 2012, 87, 152–158. [Google Scholar] [CrossRef]
  53. Al-Shammary, A.A.G.; Kouzani, A.; Saeed, T.R.; Rodrigo-Comino, J. A new digital electromechanical system for measurement of soil bulk density. Comput. Electron. Agric. 2019, 156, 227–242. [Google Scholar] [CrossRef]
  54. SAS, I. Base SAS 9.4 Procedures Guide: Statistical Procedures; SAS Institute Inc.: Cary, NC, USA, 2013. [Google Scholar]
  55. Davies, D.; Finney, J.; Richardson, S. Relative effects of tractor weight and wheel-slip in causing soil compaction. J. Soil Sci. 1973, 24, 399–409. [Google Scholar] [CrossRef]
  56. Wang, Q.; Wang, X.; Wang, W.; Song, Y.; Cui, Y. Joint control method based on speed and slip rate switching in plowing operation of wheeled electric tractor equipped with sliding battery pack. Comput. Electron. Agric. 2023, 215, 108426. [Google Scholar] [CrossRef]
  57. Oduma, O.; Ugwu, E.C.; Ehiomogue, P.; Igwe, J.E.; Ntunde, D.I.; Agu, C.S. Modelling of the effects of working width, tillage depth and operational speed on draft and power requirements of disc plough in sandy-clay soil in South-East Nigeria. Sci. Afr. 2023, 21, e01815. [Google Scholar] [CrossRef]
  58. Dong, X.; Jin, J.; Jia, Z.; Qi, Y.; Chen, T.; He, L.; Zou, M. Design and passability study of soil-plowing wheel facing soft terrain. J. Terramech. 2025, 117, 101002. [Google Scholar] [CrossRef]
  59. Upadhyay, G.; Raheman, H. Comparative assessment of energy requirement and tillage effectiveness of combined (active-passive) and conventional offset disc harrows. Biosyst. Eng. 2020, 198, 266–279. [Google Scholar] [CrossRef]
  60. Ahmadi, I. A power estimator for an integrated active-passive tillage machine using the laws of classical mechanics. Soil Tillage Res. 2017, 171, 1–8. [Google Scholar] [CrossRef]
  61. Behera, A.; Raheman, H.; Thomas, E.V. A comparative study on tillage performance of rota-cultivator (a passive—Active combination tillage implement) with rotavator (an active tillage implement). Soil Tillage Res. 2021, 207, 104861. [Google Scholar] [CrossRef]
  62. Fawzi, H.; Mostafa, S.A.; Ahmed, D.; Alduais, N.; Mohammed, M.A.; Elhoseny, M. TOQO: A new Tillage Operations Quality Optimization model based on parallel and dynamic Decision Support System. J. Clean. Prod. 2021, 316, 128263. [Google Scholar] [CrossRef]
  63. Shafaei, S.M.; Loghavi, M.; Kamgar, S. Feasibility of implementation of intelligent simulation configurations based on data mining methodologies for prediction of tractor wheel slip. Inf. Process. Agric. 2019, 6, 183–199. [Google Scholar] [CrossRef]
  64. Zhu, D.; Shi, M.; Yu, C.; Yu, Z.; Kuang, F.; Xiong, W.; Xue, K. Tool-straw-paddy soil coupling model of mechanical rotary-tillage process based on DEM-FEM. Comput. Electron. Agric. 2023, 215, 108410. [Google Scholar] [CrossRef]
  65. Upadhyay, G.; Raheman, H. Comparative analysis of tillage in sandy clay loam soil by free rolling and powered disc harrow. Eng. Agric. Environ. Food 2019, 12, 118–125. [Google Scholar] [CrossRef]
  66. Esmaeilian, Y.; Babaeian, M.; Caballero-Calvo, A. Optimization of castor bean (Ricinus communis L.) cultivation methods using biostimulants in an arid climate. Euro-Mediterr. J. Environ. Integr. 2023, 8, 823–834. [Google Scholar] [CrossRef]
  67. Mamkagh, A.M. Effect of soil moisture, tillage speed, depth, ballast weight and, used implement on wheel slippage of the tractor: A review. Asian J. Adv. Agric. Res. 2019, 9, 1–7. [Google Scholar] [CrossRef]
  68. Al-Shammary AA, G.; Lahmod, N.R.; Fernández-Gálvez, J.; Caballero-Calvo, A. Effect of tillage systems combined with plastic film mulches and fertilizers on soil physical properties in a wheat-agricultural site in southern Iraq. Cuad. Investig. Geográfica 2023, 49, 51–63. [Google Scholar] [CrossRef]
  69. Al-Shammary, A.A.G.; Caballero-Calvo, A.; Jebur, H.A.; Khalbas, M.I.; Fernández-Gálvez, J. A novel heat-pulse probe for measuring soil thermal conductivity: Field test under different tillage practices. Comput. Electron. Agric. 2022, 202, 107414. [Google Scholar] [CrossRef]
Figure 1. Hardware components of the NDSS system.
Agriculture 14 01957 g001
Figure 2. (A) Circuit diagram depicting the novel digital slippage (NDSS) in conjunction with the HC-05 Bluetooth module. (B) Receiver module: receives wireless data from the transmitter module and connects to the laptop via an Arduino Mega or microcontroller for processing.
Agriculture 14 01957 g002
Figure 4. (A) Map of study regions (six locations). (B) Particle size distributions of six soils.
Agriculture 14 01957 g004
Figure 5. Results of the real slip rate (SR) behaviors of a tractor, influenced by: (A) slippage measurement methods, (B): Different soil textures, and (C): the agri-tillage equipment., L.S.D: Least significant difference (0.05), n.s, no significant main effect. Lowercase letters is Alphabet notation (AN), has been used as style for the proper presentation of mean comparison using the LSD test.
Agriculture 14 01957 g005
Figure 6. Average values of tractor rear wheel slip measurement using novel digital slippage (NDSS) and the traditional method (CM) with different kinds of agri-tillage equipment employed at six agri-experimental sites, each characterized by distinct soil textures. L.S.D: Least significant difference (0.05). Lowercase letters is Alphabet notation (AN), has been used as style for the proper presentation of mean comparison using the LSD test.
Agriculture 14 01957 g006
Figure 7. Contribution values of variations in longitudinal slip behaviors of tractor wheels, measured by NDSS, across different soil textures, agronomic practices, and replications. *: interaction between A-TE and Ts.
Agriculture 14 01957 g007
Figure 8. Rear wheel slip rate (SR) measured by NDSS and estimated using traditional or reference methods across six experimental sites with diverse soil textures and various types of equipment. The qualitative accuracy of SR results is indicated by linear regression (R2), correlation coefficient (r), root mean square deviation (RMSD), and linear concordance correlation coefficient (LCCC).
Agriculture 14 01957 g008
Figure 9. Calculation of underestimation and overestimation of novel digital slippage (NDSS) in percentage (%) for soil texture and agri-tillage equipment.
Agriculture 14 01957 g009
Figure 10. Relative deviation (RD) of empirical data from the slip behaviors of tractor wheels measured by the novel digital slippage (NDSS) method across different agri-tillage equipment operations at six agri-experimental sites.
Agriculture 14 01957 g010
Table 1. Description of the experimental treatments and the physical and chemical characteristics of the soils under different sites.
Treatments ID Number of Observations ReadCoordinates/Treatment/DescriptionsSoil Depths
0–25 cm
Land UsedDate of Test
Main factor
Six Agri-fields ID/soil texture (Ts)
ρb
g cm−3
µ
%
SOM
%
pHES
ds m−1
Al Qataniyah villageSilty clay 36 32.916431 N, 44.944235 E1.4013.06.07.001.70wheat (Triticum aestivum L.)3–5 September 2021
Clay 36 32.938117 N,
44.979167 E
1.5523.05.07.3611.22wheat (Triticum aestivum L.)8–9 September 2021
Al-SuwairaSilty clay loam 36 32.989947 N, 44.794185 E1.4517.55.87.703.81Maize (Zea mays) and wheat23–25 September 2021
Loam 36 32.949358 N, 44.739880 E1.3926.07.47.141.47Cultivating winter cover crops29–30 September 2021
Silty loam 36 32.953473 N, 44.798662 E1.4715.06.67.733.58Wheat21–24 October 2021
Taj al-Din handClay 36 32.924266 N, 44.848932 E1.5121.0 Rotation cropping system of maize and barley (Hordeum vulgare)11–14 November 2021
Split plot
Tillage system/Agri-tillage equipment
(A-TE)
Conservational tillage (CT)Chisel plough (CP) 36 CP is commonly used in CT systems, where farmers aim to minimize soil erosion, enhance soil health, and reduce fuel usage. It is equipped with 11 blades, has a working width of 2.16 m, a working depth of 0.30 m, and a weight of 300 kg. It is manufactured in Iraq.
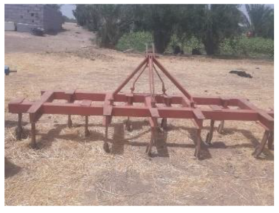
Agriculture 14 01957 i001
Conventional tillage (TT)Moldboard plough (MP) 36 MP have been extensively utilized in the TT system. The length of the MP is 2.18 m. It has three moldboards and a width of 1.19 m. The tillage depth is 0.27 m and the height is 0.11 m. The MP was created in Iraq.Agriculture 14 01957 i002
Disc plough (DP) 36 The DP is commonly used in both MT and TT systems. It consists of four discs. The disc diameter is 660 mm. The working width may be adjusted to 90 cm, 110 cm, or 130 cm. The working depth is 26 cm. The weight of the equipment is 425 kg produced in Turkey.
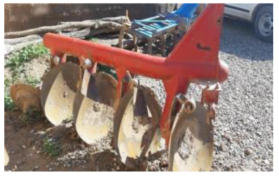
Agriculture 14 01957 i003
Minimum tillage (MT)Disc harrowing (DH) 36 The DH (Maschio type), 1.85 m operating width, 365 kg weight, 45 ° rear cover opening angle, hanging type. Smooth-edged DH (type 170, manufactured by the State Company for Mechanical Industries (SCMI) in Iraq.
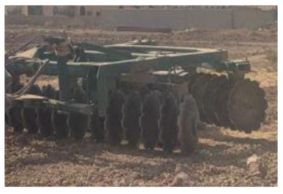
Agriculture 14 01957 i004
Spring-tooth harrowing
(TH)
36 The TH is commonly used in various agricultural tillage systems, including TT, MT, and organic farming. It weighs 295 kg, with a working width of 2.69 m, a working depth of 0.20 m, and 11 teeth. It is produced at SCMI, Iraq.
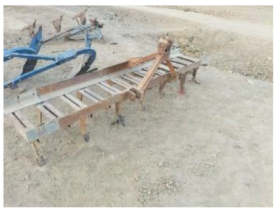
Agriculture 14 01957 i005
Control treatment (no loading) 36 Whereby the tractor drives twice (back and forth) through the experimental unit assigned to each research location without loading.
Split-split plot
Method measured the SR
Novel digital slippage system (NDSS) 108 Both the traditional approach and the NDSS method may be used to measure the SR of a tractor’s wheel. Section 2.1 and Section 2.2 examine the NDSS.
The determination of SR by CM is indirectly accomplished by computing the number of rotations of the driving wheels and the distance travelled under both loaded and empty situations, as indicated in equations 1 and 2. It has been established at a standardized plot length of 75 m for all experimental configurations, which was uniformly maintained throughout all experiments. This standardization facilitates the consistent use of the formulae and guarantees the comparability of the SR measurements [27].
Traditional method(CM) 108
Table 2. Statistical descriptive data for tractor rear wheel slip at six agricultural fields: novel digital slippage system (NDSS) and traditional method (CM) with various agri-tillage equipment.
Experimental Fields IDMeasured for Tractor Rear Wheel Slip CVSEMMinimumMaximum Mean
% %%%
Silty clayNDSS80.91.30016.567.25
CM79.41.26016.167.19
ClayNDSS62.51.32018.929.53
CM66.51.50019.7210.60
Silty clay loamNDSS78.91.45018.238.30
CM80.51.51018.968.50
LoamNDSS80.21.35016.867.60
CM81.91.40017.567.70
Silty loamNDSS51.11.30019.3311.46
CM50.41.30019.0011.48
Clay (sixth site)NDSS58.71.35019.3310.30
CM57.71.34019.6310.40
Table 3. The ANOVA of the tractor rear wheel slip obtained using NDSS at different soil textures and Agri-tillage equipment.
Source of VariationDegrees of FreedomANOVA SSMean SquareF-ValuePr > F
Rep26.1592583.0796292.150.1203
Method measured the SR (M)11.120896 1.1208960.78 0.3782
M × Rep20.637156 0.3185780.22 0.8012
Texture
(Ts)
5497.221794 99.444359 69.27 <0.0001
Agri-tillage equipment
(A − TE)
56480.135683 1296.027137 902.74<0.0001
M × TS51.935481 0.387096 0.27 0.9292
M × A-TE51.233259 0.246652 0.17 0.9727
TS × A-TE25147.262706 5.890508 4.10 <0.0001
Error165236.8849481.435666----
Total2157372.591183------
Table 4. Test performance of the NDSS for measuring wheel slip across different soil textures and agri-tillage practices.
Experimental Fields IDCPMPDPDHTHControl
MPESDPEMPESDPEMPESDPEMPESDPEMPESDPEMPESDPE
%%%%%%%%%%%%
Silty clay−0.400.29−0.401.100.500.88−0.200.54−0.200.290.300.17
Clay0.800.601.861.100.500.610.530.72−0.200.54−0.330.39
Silty clay loam0.730.390.560.88−0.360.880.330.600.160.23−0.260.32
Loam0.700.490.400.82−0.630.83−0.260.490.200.150.260.26
Silty loam−0.330.880.500.66−0.300.330.030.660.020.660.200.61
Clay (6th site)0.300.33−0.661.52−0.030.660.400.600.461.150.000.46
MPE: the systematic error or bias; SDPE: standard deviation of the prediction error.
Table 5. Hardware component prices for NDSS wheel slip measurement.
Hardware ComponentQuantityEstimated Cost (USD)
Arduino microcontroller (Arduino Mega)2 boards33.5
Laser distance sensor (LDS) Module161.1
Hall effect (HE) sensor (Allegro 3144)4 sensors are required8.0
315 MHz RF transmitter and receiver module11.7
Bluetooth module HC-0517.0
Power supply18.0
Additional components or equipment required (solderless breadboard 400 tie-point, extension flexible wire, plastic Arduino box enclosure case) 10.0
Total estimated cost-129.3
Disclaimer/Publisher’s Note: The statements, opinions and data contained in all publications are solely those of the individual author(s) and contributor(s) and not of MDPI and/or the editor(s). MDPI and/or the editor(s) disclaim responsibility for any injury to people or property resulting from any ideas, methods, instructions or products referred to in the content.

