1. Introduction
The concept of profitability is multifaceted, encompassing a range of economic theories and practical implications that reflect its evolving significance in modern economic contexts. Understanding profitability necessitates a thorough examination of its theoretical underpinnings, its socio-economic implications, and its role in contemporary economic discourse. From a theoretical standpoint, profitability has been perceived through various lenses that diverge from classical economic theories, which often regard profit as the outcome of monopoly power or exceptional circumstances [
1]. Tugan-Baranowsky [
2] delved deeper into the theoretical foundations by emphasizing the need to explain the existence of profit and its socio-economic nature, highlighting the inherent enigma of why the value of production exceeds total costs. This perspective underscores the complexities surrounding the generation of profit and challenges the conventional economic paradigms that attempt to define it. In contemporary economics, the discourse around profitability has expanded beyond traditional measures to encompass broader concepts such as shareholder value creation, which represents a more comprehensive approach to assessing economic performance [
3].
The implications of profitability are evident across different sectors, including agriculture. The profitability of agricultural enterprises often lags behind other sectors, largely due to rising input costs, volatile sales, and systemic economic disparities [
4]. Long-term trends indicate that agricultural commodity prices have not kept pace with inflation, resulting in a reduction in real profits for farmers over time [
5]. Researchers have paid attention to the fact that profitability is influenced by technological innovation [
6], market conditions [
7,
8], and government support [
9]. This necessitates an in-depth understanding of how diverse agricultural practices, organizational structures, and market forces impact financial outcomes and the sustainability of farming enterprises.
The agricultural sector’s sensitivity to market fluctuations is particularly pronounced in grain production markets, such as wheat, where price volatility poses persistent challenges. Studies highlight profitability challenges in Poland’s wheat production sector. Despite increasing yields, income from wheat cultivation shows high variability due to fluctuating prices and production costs [
10]. Fertilizers represent the largest share of production costs, accounting for 39–40% of total expenses [
10]. While wheat income is projected to increase by 23.4% by 2020, profitability may decrease due to faster-rising costs [
11]. The sector’s underdevelopment is attributed to low remuneration, high labor intensity, and inefficient land markets [
12]. Interestingly, low-intensity cultivation technologies have shown more favorable economic results compared to high-intensity methods, with profitability ratios being 10.0–52.7% higher [
13]. This suggests that adopting less intensive cultivation practices may help maintain economic efficiency while reducing environmental impact [
13]. However, the sector remains vulnerable to yield and price variabilities, which can significantly impact income [
11]. Researchers have examined the impact of yield variations, product prices, and input prices on the profitability of various crops [
14,
15,
16,
17]. Projections utilizing classical trend models reveal substantial volatility in these markets, complicating profitability management [
14]. Jarzębowski [
18] further explored efficiency within the grain sector, emphasizing the necessity for both economic and environmental assessments of diverse wheat production methods. Additionally, integrated agricultural structures, such as cooperatives and self-managing entities, demonstrate greater resource efficiency and financial stability. These organizational forms contribute positively to profitability by mitigating risks associated with market volatility [
19]. Such findings highlight the pressing need for robust risk management strategies to stabilize incomes and ensure the long-term viability of agricultural enterprises.
Political support, manifested through subsidies and policy frameworks, plays a critical role in influencing agricultural profitability. For instance, Coppola, Haddow, and, Bullock [
9] analyzed the long-term viability of farms in Italy, indicating that alterations in EU direct payments could jeopardize profitability for certain farm types. This underscores the importance of understanding policy shifts and subsidy frameworks in assessments of agricultural profitability. The Income Stabilization Tool (IST), introduced under the second pillar of the Common Agricultural Policy (CAP) for 2014–2020, exemplifies how targeted financial support co-financed by member states can assist in managing risk. This system aims to stabilize farmers’ incomes, reduce variability, and bolster average income levels, extending beyond the EU context.
While the studies we have discussed provide invaluable insights into enhancing profitability through effective management, organizational integration, innovation, and an awareness of external economic conditions, it is essential to recognize the ongoing challenges posed by market fluctuations and policy changes. This raises the following critical research questions:
The case of wheat production illustrates both the volatility intrinsic to agricultural markets and the pivotal role of sectoral support in mitigating these risks and enhancing profitability. Understanding the interplay between economic volatility and political support remains vital for sustaining agricultural profitability in an increasingly unpredictable economic landscape. Through this dual approach, stakeholders can better navigate the complexities that define profitability in the agricultural sector, leading to more sustainable outcomes for farmers and the economy at large.
While the profitability of agriculture remains a central concern, the shifting economic landscape necessitates a reevaluation of how profitability is measured and understood, particularly in light of ongoing income disparities and market pressures. This paper addresses a critical gap in the literature by developing an econometric simulation model specifically tailored to analyze and forecast wheat production profitability. Unlike the existing literature, which often employs generalized models or focuses on single-element impact studies, this research integrates multiple economic variables and policy interventions, providing a comprehensive framework for understanding the intricate dynamics of agricultural profitability. This study distinguishes itself by linking market volatility with political support mechanisms, thereby offering a nuanced view that acknowledges the dual influence of economic conditions and policy frameworks on profitability.
The expected implications of the main results are significant. By simulating different scenarios, the model provides stakeholders with a powerful tool for predicting and adapting to changes in wheat production profitability. This ability to anticipate shifts in market conditions and policy impacts can lead to more informed decision-making, ultimately enhancing strategic planning and resource allocation. The insights gained from this study could drive more effective policy designs that stabilize agricultural incomes and promote sustainability in the sector.
This article introduces a well-structured econometric simulation model aimed at analyzing and forecasting changes in wheat production profitability, effectively capturing the intricacies of economic mechanisms within this sector. This model is grounded in a system of interrelated recursive equations that facilitate the forecasting of production profitability over successive years. By establishing a foundation of theoretical assumptions specifically tailored to the unique characteristics of the wheat market, the authors integrate econometric forecasting methods with expert insights. This approach allows the model to not only simulate changes in profitability in response to varying economic conditions but also to account for causal relationships involving critical variables such as resource use, production levels, price fluctuations, and income dynamics related to wheat and others major agricultural commodities. The proposed model serves as a compelling alternative to complex frameworks such as AGMEMOD, CAPRI, FAPRI, or AGLINK-COSIMO, ultimately providing a clearer understanding of profitability dynamics within the wheat sector.
In addition to its foundational structure, the article emphasizes the model’s practical application through a recursive approach that accommodates the dynamism inherent in economic contexts. This innovative methodology enables rigorous scenario simulations that illustrate potential shifts in production profitability, offering valuable insights for stakeholders in the agricultural sector. The authors validate the model empirically using data from the Farm Account Data Network (FADN), ensuring strong alignment with market realities and profitability dynamics. By leveraging this robust framework, the modeling results forecast the profitability of wheat production in Poland for the years 2023–2027, allowing stakeholders—including producers and policy-makers—to assess the impacts of policy changes, market fluctuations, and external factors on agricultural profitability. This capability equips them with the tools necessary for informed decision-making and strategic planning amidst inherent market uncertainties, thus enhancing the overall resilience and sustainability of the wheat sector.
2. Materials and Methods
Modeling changes in the profitability of wheat production has emerged as a vital tool in the economic analysis of this agricultural sector, enabling not only the assessment of current profitability but also the forecasting of future trends and the strategic allocation of resources [
19,
20]. Despite these advancements, research underscores the necessity for enhanced methodologies in evaluating agricultural profitability [
21,
22]. Simulation models in particular have gained prominence in this regard. For instance, studies have demonstrated the efficacy of simulation modeling in optimizing crop spatial allocation to maximize revenue [
23]. Additionally, a numerical simulation algorithm was developed to evaluate the international trade competitiveness of small commodities, showcasing good performance in competitiveness analysis [
24]. More advanced econometric simulation models have also been created to predict historical behavior within the agricultural sector and to analyze the impacts of various public policies on resource use, output, and income levels of major agricultural commodities.
In the context of the wheat market, these models serve a critical role. Research highlights the significance of price support policies on grain prices, production costs, and farmers’ incomes [
25]. The implementation of minimum purchase price policies can elicit both positive and negative repercussions on grain markets, influencing production, consumption, and imports [
26]. Furthermore, agent-based models have been employed to simulate wheat market operations, particularly to assess how Agriculture Support Price (ASP) programs affect market agents, thereby offering insights for the design of more effective support pricing mechanisms [
27]. Understanding these simulation methodologies is essential for policy-makers, as they provide the analytical framework necessary to make informed decisions that balance profitability, market stability, and food security in wheat production.
2.1. General Description of the Method
The model presented in this study is built as a set of structurally and recursively linked formulas (equations and functions) that reflect the relationships and dependencies in shaping production profitability in various sectors, including wheat production. The simulation is based on forecasts of variables explaining profitability, which are recursively linked to the structural model for the wheat sector.
In the presented methodological approach, we rely on a system of recursive equations. The starting point for constructing the simulation model of changes in the profitability of wheat production as a sector is the general model of agricultural production profitability presented in the book by Bezat-Jarzębowska et al. [
28]. The reasoning we adopted follows that of the general model in the monograph; however, the variables considered in the analysis and the construction of interrelations between them are based on the specifics of the wheat sector. Firstly, this mainly pertains to the revenue side of the profitability indicator, which primarily concerns the production volume (harvest) determined by the following:
The variable representing the area of agricultural land (factor of land) allocated for this production;
The variable representing the obtained yield level (productivity of the land factor).
Forecasts of these variables will be determined using appropriate econometric functions.
Based on the forecasted production volume (harvest), the forecasted volume of marketable production (procurement) is determined as the primary variable influencing revenue levels (the share of procurement in production plus inventory is determined by expert judgment and the elasticity model of procurement concerning price levels).
Secondly, the variable determining revenue levels, which is subject to forecasting, will of course be the procurement price of wheat, as the average value for the quality standards accepted in procurement. On the cost side, variables related to the level of applied (purchased) fertilizers and their average level will be considered. Forecasts may also relate to fuel consumption and its price levels (costs of use) and potentially the costs of purchasing plant protection products. The lease level will be assumed as a fixed value, not as a forecasted variable, representing an approximation of the rent level (it is simultaneously a cost and income).
Some of these variables are exogenous (e.g., price relationships that are received vs. paid), while others are endogenous to the sector (e.g., fertilization efficiency). For the purposes of simulating changes in the profitability of wheat production, revenue- and cost-side variables of this formula will be forecasted, taking into account the effects of agricultural policy. The ratio of these two groups of variables determines the profitability of wheat production at the sector level. Once transformed into a formula based on growth rates of the included values, it will be used as a model for simulation purposes. The growth rates of individual components of the profitability coefficient are simultaneously, for forecasting purposes, variables of the respective equations and functions. The linkage of these equations creates a recursive system (a simulation model of profitability changes, assessing the changes in profitability levels), in which a given equation or function is explained by successive equations and functions and results from them. This is fundamental in a mathematical–analytical approach.
For individual variables included in the model, econometric cause-and-effect functions or trend equations (exponential smoothing, autoregression) are defined, e.g., for the rate of change in procurement prices or the rate of change in harvest volumes. These approximated and estimated econometric models form the basis for the scenario assumptions adopted in the simulation of changes in wheat production profitability at the sectoral level.
These forecasts are generated using ARIMA and causal–effect econometric models, further calibrated with expert adjustments and assumptions regarding their implementation conditions. The modeling results forecast the profitability of wheat production in Poland for the years 2023–2027. This approach allows for the creation of variant forecasts and scenario simulations of changes in wheat production profitability. The empirical verification of this approach, conducted using data from the Farm Accountancy Data Network (FADN) as well as market reports, enabled an ex post analysis of profitability changes and the factors influencing these changes in the studied sectors. The data span from 2010 to 2022, providing a comprehensive time series analysis for the variables under consideration. The period of analysis, from 2010 to 2027, provides a comprehensive view of both past trends and future forecasts in wheat production. Starting in 2010, it offers historical insights into market dynamics and policy impacts. Extending to 2027 allows for future projections that guide strategic planning and policy-making. This timeline helps identify long-term trends and prepares stakeholders for potential scenarios in the agricultural sector. In this article, statistical assessments of variables include the average values and standard deviation, the coefficients of variation, and the mean rates of change (
Table 1).
These statistics substantiate the accuracy of the model, indicating that it reliably reflects real-world changes in profitability levels and the underlying mechanisms in the wheat market. The combination of empirical data and statistical rigor ensures that the model offers a credible and insightful framework for understanding profitability dynamics in the agricultural sector, particularly within the context of wheat production.
2.2. The Analytical Model
Before defining the analytical form of the model, we discuss its assumptions. Firstly, agricultural producers are presumed to act rationally, aiming to maximize profits by selecting wheat varieties and cultivation practices based on cost–benefit analysis. External factors, such as agricultural policies and subsidies, are considered stable in the short term, though their long-term impacts are uncertain [
29]. The model assumes that wheat markets are homogeneous and operate under competitive equilibrium conditions, where farmers are price-takers. Farmers adjust their costs relative to market prices to maintain profitability, supported by the assumption that domestic prices are tied to international prices, adjusted by a specific spread. Furthermore, key variables like production volume and factor inputs are determined by economic production models and behavioral frameworks that incorporate profitability and agricultural policy impacts. The model’s complexity is highlighted by its detailed specification and inclusion of variables reflecting agricultural policy instruments, directly influencing profitability functions and related variables.
In a model capturing changes in wheat production profitability, we refer to three key elements: efficiency, price-related factors, and transfers resulting from state support. Regarding efficiency improvement, variables such as acreage and yields are highlighted. Within the formula for price relations, we consider the following: (1) purchase price levels influenced by market demand and supply, trade policies, and global price trends; and (2) production factor prices. Meanwhile, under support from the Common Agricultural Policy (CAP), various forms of subsidies, direct payments, and support programs are encompassed. These interventions aim to stabilize farmers’ incomes, mitigate market volatility risks, and promote sustainable agriculture. The net effects of sectoral interventions are crucial for assessing overall wheat production profitability, as financial support can significantly enhance profitability, especially amidst low market prices or high production costs.
The starting point for constructing the model is the adopted concept of profitability (
π), which is defined as the ratio of revenue to costs adjusted for the effects of agricultural policy instruments (applied either to the entire agriculture sector or the specific sector under analysis), expressed as follows:
where:
- -
is the volume of wheat procurement at the sector level (marketable production sold by farms);
- -
is the average procurement price level (received prices);
- -
represents the total quantity of fertilizers purchased by farms for wheat production at the sector level;
- -
is the average price level paid for artificial fertilizers (for the average NPK structure);
- -
represents the effects of sectoral interventions (support) increasing revenues in wheat production;
- -
represents the estimated approximate effects of sectoral interventions reducing wheat production costs;
- -
represents the effects of fiscal burdens that increase wheat production costs.
This formulation captures the integrated impact of agricultural policies on both revenue and costs, providing a simplified indicator of wheat production profitability.
A closer analysis and transformation of Formula (1) allows for the identification of three sources (factors) that influence or determine the level of profitability in wheat production, which is significant for the development of the simulation model. These sources of changes in profitability are related to production efficiency, market conditions, and the effects of support from agricultural policy instruments.
2.2.1. Production Efficiency
The efficiency (productivity) source of the profitability of wheat production from Formula (1) is expressed by the following equation:
The level of efficiency (technical) in wheat production is determined by the ratio of the total harvest/obtained yields (production) to the incurred inputs, primarily fertilization. For the wheat production sector, the volume of its production (harvest) is determined by the product of the sown area and the obtained yields (in the terminology of microeconomics and agricultural economics, this is the product of the quantity of the land factor used and its productivity), i.e.,:
where:
- -
is the sown area; —wheat yields.
The productivity level of the land factor (η) used for wheat production (yield level) in a recursive relationship is determined by the following:
- -
The level of fertilization (intensity of mineral fertilization) per hectare of arable land (per unit of land factor), denoted as ;
- -
The technical efficiency of mineral fertilization (the amount of obtained production relative to the used fertilizers, or the amount of production per unit of fertilization, e.g., in kilograms or monetary units in constant prices), denoted as .
2.2.2. Market Conditions
The second source of profitability changes in Formula (1) is the ratio of wheat procurement prices to the prices paid for purchased and applied artificial fertilizers (possibly, market-valued inputs like manure are also considered on a ceteris paribus basis), known as price scissors, i.e.:
The impact of this factor on production profitability is clear: increasing the price ratio improves profitability and vice versa. The relation (1b) is also a component of Formula (5). Therefore, the problem lies in the functions or models for forecasting procurement prices and artificial fertilizer prices (with an average NPK composition). The theoretical basis for these econometric price models could be the cobweb model, King’s effect model, or models of procurement price sensitivity to supply changes (given the demand for wheat), with the possible use of MATIFF futures quotations with appropriate spreads or market reports.
2.2.3. Effects of Support from Agricultural Policy Instruments
The third component (source) determining profitability levels is the net effects (after deducting burdens) of the influence of agricultural policy solutions (sector interventions) on revenues and costs in wheat production:
This is a significant factor that should be considered in the simulation of changes in wheat production profitability as a source of these changes. However, this factor is challenging to forecast using econometric models, apart from trend extrapolation. The effects of this support are estimative, even when recorded and assessed in documents with result indicators. Forecasts regarding the support effects can be conducted jointly or separately, i.e., separately for actions increasing revenues and separately for programs reducing costs.
In
Figure 1, the functional relationships influencing the model structure among the determinants of changes in agricultural production profitability are presented. It acts as a roadmap for the construction of the structural model and the econometric models of its variables. The structural model reflects the mechanisms underlying changes in production profitability.
2.3. Simulation Model of Wheat Production Profitability Changes
The simulation model of wheat production profitability changes is based on expressing these changes in indicators, i.e., the growth rates (changes) of variables included in Formula (1). The same applies to auxiliary formulas (functions) explaining the shaping of variables included in it. Therefore, formulas used to forecast variables in the initial Formula (1) are transformed into indicator form (growth rates). Expressing these formulas in growth rates facilitates and primarily objectifies the forecasting of variables and, most importantly, allows for the scenario-based simulation of changes in wheat production profitability. Scenario forecasts concern the height of the growth rates of variables included in Formula (1), such as production (harvests, sown area, yields, procurement, fertilizer usage, fertilization efficiency, wheat and fertilizer prices, price scissors, support, and burden ratios).
After logarithmizing the ratio presented by Formula (1), we have the linear equation for wheat production profitability:
where:
- -
represents the balance of burdens and support on the cost side.
Next, the following are calculated:
- -
The growth rates of wheat production volume, procurement price changes, and support effect growth rates (overall revenue growth rates);
- -
The growth rates of applied artificial fertilizers and their price growth rates, as well as the net support and burden effect growth rates (overall production cost growth rates);
- -
All rates with respect to time (t), assuming one year as the basic unit.
After logarithmic differentiation, we obtain:
where:
- -
is the rate of change in production profitability.
This is the basic equation for the rate of change in wheat production profitability. As can be seen from Equation (8), the rate of growth (change) in production profitability is a fairly complex variable. Despite this, the economic sense of this notation is clear, i.e., the essence of changes in wheat production profitability. The essence is that the rate of change in wheat production profitability is primarily determined by the following:
- -
The ratio of the growth rate of revenues to the growth rate of fertilization application to obtain these revenues (production, at given procurement prices).
- -
It depends on the rate of support effects related to agricultural policy.
The ratio between the growth rate of revenues and the growth rate of inputs incurred in the form of fertilizer usage is, of course, the most important. However, the relationships between the variables determining both sides, i.e., the growth rates of revenues and costs of applied inputs, are also important, considering the above-mentioned efficiency (endogenous) and market (exogenous) sources, i.e., price relations. We will summarize this separately below in growth rates.
2.4. Revenue Growth Structure—Sources of Its Changes
The growth rate of revenues in wheat production (in %) is the sum of the growth rate of production volume (sold),
; the growth rate of wheat procurement price,
; and the growth rate of support effects,
. Thus, we have the following equation:
The growth rate of fertilizer application costs (for wheat production) is the sum of the growth rate of fertilizer consumption,
; the growth rate of fertilizer prices,
; and the growth rate of the effects of cost-reduction instruments,
. Thus, we have the following equation:
Combining equations, we obtain a clear model for the rate of change in wheat production profitability. The changes in profitability rates are determined by the variables shown above. This model can serve as a fundamental simulation model for changes in the profitability of agricultural production as a sector of the national economy, and it can also be used as a baseline model for various agricultural sectors. Thus, we have the following equation:
This equation indicates that the rate of change in profitability is the difference between the sum of the growth rates of production volume, procurement price, and support effects and the sum of the growth rates of fertilizer consumption, fertilizer prices, and cost-reduction instruments.
From the perspective of simulating changes in the profitability of wheat production within a sectoral framework, it is important to note that each growth rate (or rate of change) in Equation (1) can be forecasted through scenario analysis. This can be approached in several ways. First, scenario levels for these rates can be established for a given forecasting period using expert knowledge and qualitative analysis. Second, their levels (values) during the forecast period can be determined based on analytical models that logically connect dependencies, also considering growth rates. Third, econometric models or trend models (such as trend functions, exponential smoothing, autoregression) or causal–effect models (including factor models and motivational–behavioral models) can be used to forecast the growth rates in Equation (11). This is the stage of model implementation where parameters for these variables are approximated and estimated as predictors to obtain their forecasts, i.e., values for the forecast period, incorporating expert components and possible model calibration.
Expanding on this, utilizing the potential of the model from Equation (11) in its simulation functions involves the ability to incorporate forecast scenarios for its variables, namely growth rates (. Various approaches can be employed for constructing these forecasts, including expert assessments, econometric predictive models based on causal relationships or developmental trends, and analytical–logical models. All the specified rates of change (growth), both in Equation (11) and others, are expressed in percentages or relative to the previous year (the approach commonly used in reports and public analyses). The recursive structure is maintained, where each subsequent equation explains the variables in the preceding equation.
As mentioned, logical–analytical models directly correspond to the discussed simulation model and indeed serve to build forecasts of these growth rates within this model. It is also noted that the models themselves possess simulation characteristics. They are based on economic laws and principles, including those of agricultural economics.
3. Results—Simulations of Changes in Wheat Production Profitability and Its Components
In the analysis of wheat production profitability, key factors influencing farmers’ income variability were considered, such as procurement prices and their relation to the value of consumed production inputs (production costs), production efficiency measured by yields, and the level of subsidies and other forms of support from the Common Agricultural Policy (CAP). The forecast is based on the simulation model described in the article.
3.1. Results of the Simulation of Changes in the Level and Components of Wheat Production Profitability—Baseline Scenario
Figure 2 presents the changes in profitability over the period 2006–2027, with values for the years 2023–2027 being forecasts. Additionally, the graph includes the decomposition of the factors influencing these changes. As can be seen, profitability changes do not follow a clear trend. They fluctuate, with periods of increasing profitability alternating with periods of decline. However, it can be observed that both in the periods preceding the forecast and in the forecast periods, the fluctuations in wheat production profitability are smaller. Regarding the factors responsible for these changes, it should be noted that their contribution to shaping the level of profitability change is not constant and varies from year to year within the analysis.
To deepen the analysis, we will focus on the individual factors considered in the assessment of changes in wheat production profitability. From the visual assessment of the decomposition of factors affecting profitability changes, it can be inferred that during the analyzed period and the forecast period, the most frequent and significant factor was the price scissors. This prominence underscores its significant influence on agricultural economics, particularly in periods characterized by volatile market conditions and fluctuating input costs.
The economic implications of price scissors are multifaceted. When the price of wheat rises relative to input costs, the widening of the price scissors enhances profitability for producers, potentially incentivizing increased production and investment. Conversely, a scenario where input costs escalate faster than wheat prices can narrow the price scissors, diminishing profitability and posing financial challenges to agricultural enterprises. The frequency with which price scissors feature as a primary factor in profitability assessments highlights their sensitivity to market dynamics and policy interventions affecting agricultural markets. Factors such as global commodity price trends, currency fluctuations impacting input costs, and governmental agricultural policies play pivotal roles in shaping the magnitude and direction of price scissors.
Understanding and effectively managing price scissors are crucial for agricultural stakeholders and policy-makers alike. Strategies aimed at stabilizing input costs, improving market transparency, and implementing targeted agricultural policies can mitigate the adverse effects of narrowed price scissors and enhance the resilience of agricultural profitability.
3.2. Simulation of Wheat Production Profitability Changes—Pessimistic and Optimistic Scenarios
In agricultural economic analyses, scenarios play a crucial role in assessing potential outcomes under varying conditions. This study explores two scenarios—optimistic and pessimistic—aimed at evaluating the profitability dynamics of wheat production based on different trajectories of procurement prices and production input costs.
According to these assumptions, the negative scenario pertains to a situation less favorable for the agricultural producer compared to the baseline scenario. Consequently, the optimistic scenario presents a more favorable situation for the agricultural producer compared to the baseline scenario. In the optimistic scenario, it is assumed that the procurement price of wheat will follow a path above the baseline scenario, while the cost path of production inputs (i.e., the value of consumed production inputs per ton of wheat) will be below the baseline scenario. Conversely, in the pessimistic scenario, it is assumed that the procurement price of wheat will be lower than that assumed in the baseline scenario, while the cost path of production inputs will take values higher than those assumed in the baseline scenario.
The trajectories of exogenous variables corresponding to wheat procurement prices and production input purchases in the optimistic and pessimistic scenarios were determined using confidence intervals for these variables. The procedure for establishing these trajectories proceeded as follows: Initially, forecasts of variable values (both prices) were determined for the baseline variant. Next, 80% confidence intervals were computed for each variable. The third step varied depending on the scenario.
In the optimistic scenario, the upper bound of the 80% confidence interval for wheat procurement price and the lower bound of the 80% confidence interval for production input cost were adopted as the trajectories of the exogenous variables. In contrast, for the pessimistic scenario, the lower bound of the 80% confidence interval for wheat procurement price and the upper bound of the 80% confidence interval for production input cost were used as the trajectories of the exogenous variables.
This approach reduces the arbitrariness of assumptions regarding the trajectories of exogenous variables in alternative scenarios and allows for an analysis of domestic wheat producers’ resilience to shocks related to fluctuations in both wheat procurement prices and fertilizer costs.
The trajectory of exogenous variables used in the simulation is depicted in the
Figure 3 and
Figure 4.
The analysis assumes maintaining the level of support (both income support and cost reduction for wheat producers) at the level set in the baseline scenario. This decision is based on the premise that through appropriate economic policy calibration, it is possible to offset the impact of alternative trajectories of exogenous variables concerning both considered prices on the profitability of wheat production. This approach limits the cognitive value derived from studying alternative scenarios. Nevertheless, there remains the possibility to estimate an appropriate policy response that could stabilize the market.
3.2.1. Optimistic Scenario
Below is the
Table 2 outlining the assumptions regarding the trajectories of exogenous variables adopted in the optimistic scenario.
These assumptions reflect a scenario where the procurement price of wheat is expected to be at the upper limit of its 80% confidence interval, while production input costs are anticipated to be at the lower limit of their 80% confidence interval.
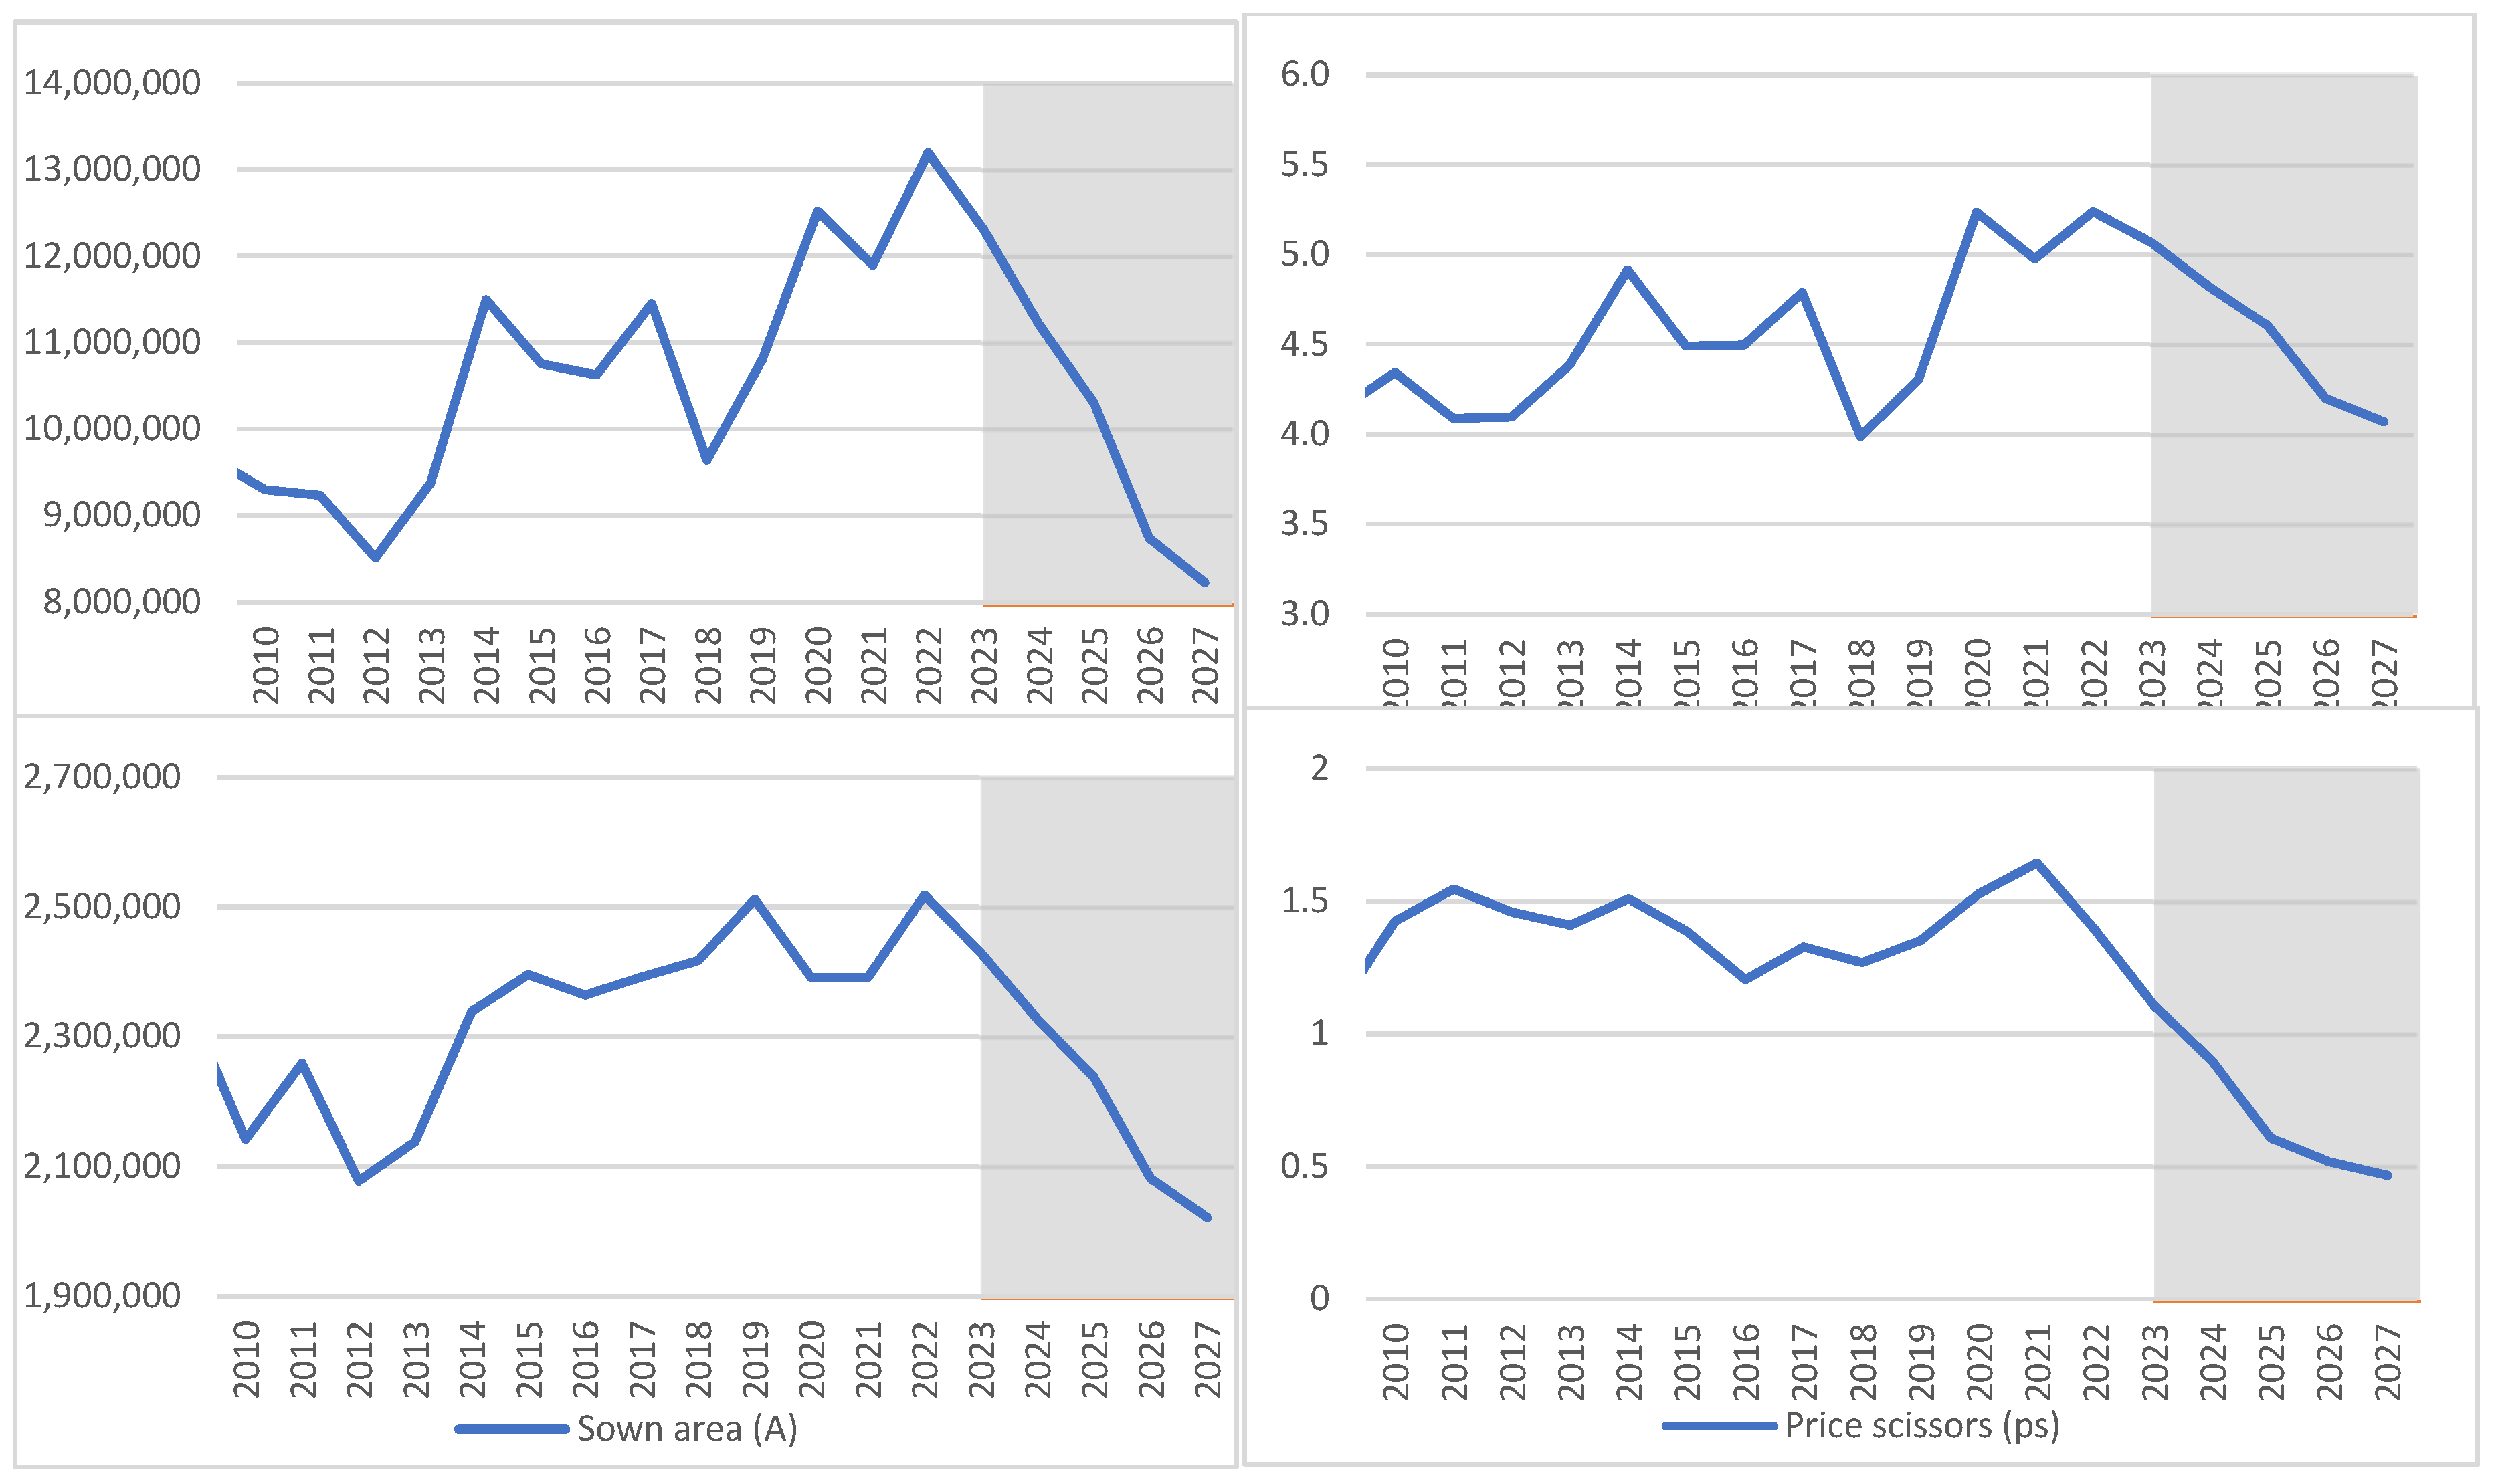
The estimation of endogenous variables based on the adopted price trajectories is depicted in
Figure 5.
In the optimistic scenario, it is assumed that the trajectory of wheat procurement prices will exceed that of the baseline scenario, while the trajectory of production input costs will be lower than the baseline. Consequently, the simulation results indicate a favorable shift in the wheat price scissors for producers. Additionally, wheat yields per hectare, sown area, and total wheat production in tons are all observed to increase. These variables exhibit values surpassing those projected in the baseline scenario.
In the optimistic scenario, the assumption is made that wheat procurement prices will follow a trajectory higher than that projected in the baseline scenario. This expectation is coupled with the anticipation that production input costs will trend lower compared to the baseline. As a result of these assumptions, the simulation outcomes reveal a positive adjustment in the price scissors for wheat producers. The price scissors conceptually illustrate the relationship between the price received for wheat and the costs incurred for its production inputs, demonstrating a scenario where the increase in procurement prices outpaces the rise in production costs.
Moreover, the simulation forecasts indicate an upward trend in wheat yields per hectare, expanded sown areas, and an overall increase in wheat production volume measured in tons. These positive trends are indicative of enhanced productivity and efficiency within the wheat production sector under the optimistic scenario. The values projected for these variables exceed those forecasted in the baseline scenario, underscoring the potential economic benefits and improved profitability for wheat producers in the optimistic scenario context. This scenario analysis underscores the strategic importance of price trends and input costs in influencing agricultural profitability and production dynamics.
According to the simulation results, there is an improvement in wheat production profitability compared to the baseline scenario. As indicated by the decomposition presented in
Figure 6, this improvement is primarily due to favorable price relations for producers, which stem directly from the assumptions of the optimistic scenario.
3.2.2. Pessimistic Scenario
Below is the
Table 3 outlining the assumptions regarding the trajectories of exogenous variables adopted in the pessimistic scenario.
In this scenario, the trajectory of wheat procurement prices is expected to be lower than in the baseline scenario, while the trajectory of production input costs is anticipated to be higher. This scenario represents a less favorable situation for wheat producers, implying reduced profitability compared to the baseline.
The estimation of endogenous variables obtained based on the adopted price trajectories is presented in the
Figure 7.
The assumptions regarding the trajectories of wheat procurement prices and production input costs in the pessimistic scenario are associated with an unfavorable change in the price scissors for wheat producers. This adverse price relationship is accompanied by a noticeable downward trend in wheat yields per hectare, sown area, and total wheat production in tons (
Figure 8).
According to the simulation results, there is a deterioration in wheat production profitability over the forecast horizon. The changes in profitability assume negative values, indicating a decline in the profitability index. As the decomposition shows, this is primarily due to the unfavorable relationship between the received prices and the paid input costs, which stems from the assumptions of the pessimistic scenario.
The conducted simulations emphasize the multifaceted nature of profitability changes in wheat production, revealing how external economic conditions, policy shifts, and production efficiency intertwine to affect profitability outcomes. Notably, the baseline scenario reaffirms the significant volatility inherent in wheat markets, where profitability neither follows a linear trajectory nor remains static over time. The optimistic scenario underscores the potential for enhanced profitability through favorable procurement prices and reduced input costs, fostering conditions conducive to increased production volume and efficiency. Conversely, the pessimistic scenario alerts to the vulnerabilities facing wheat producers when prices decline or input costs rise, thereby shrinking profit margins. These simulations not only validate the model’s robustness but also provide critical insights into how different economic scenarios can drive strategic adjustments in production practices and policy interventions, thereby aiding in risk management and decision-making for stakeholders across the wheat production sector.
Recent studies resonate closely with the analysis of agricultural profitability in wheat production by underscoring the intricate interplay of factors influencing income variability and profitability. For instance, studies by Gugała et al. [
10] and Jabłoński et al. [
11] highlight the volatility in wheat cultivation income due to fluctuating prices and rising production costs, particularly fertilizers, which constitute a significant portion of expenses. This aligns with the findings on market volatility as a crucial determinant of profitability changes. The research by Czyżewski and Majchrzak [
30] further elaborates on the concept of price scissors, where the disparity between agricultural and industrial terms of trade can profoundly impact agricultural earnings. This dovetails with the analysis showing that increases in wheat prices relative to input costs can enhance profitability, while the reverse can compress margins, emphasizing the need for the effective management of input prices and trade conditions.
4. Discussion—Utility of the Wheat Production Profitability Simulation Model
4.1. Scientific Contribution
The scientific contributions of this paper are significant and multifaceted, addressing both theoretical frameworks and practical applications in the field of agricultural economics, specifically regarding wheat production profitability. The model contributes to the academic discourse by providing a structured framework to investigate the intricate dynamics of wheat production profitability. This advancement enriches the existing body of knowledge by providing a fresh perspective on modeling profitability in agricultural contexts, moving beyond traditional optimization approaches. The presented paper has a theoretical dimension and can serve as a roadmap for creating simple simulation models.
The model demonstrated that price relationships and production efficiencies are pivotal determinants of profitability, aligning with previous studies that have stressed the importance of market dynamics in agricultural economics. For instance, prior research has highlighted how fluctuations in input costs relative to output prices can significantly impact farmers’ income levels [
21,
22]. The empirical results of this study, showcasing how favorable price scissors can lead to increased production yields and overall profitability, reinforce these established concepts and underline the model’s validity.
Moreover, the results indicate a complex interplay between market volatility, political support, and profitability. These findings support the working hypothesis that government policies and market conditions directly influence agricultural profitability, a notion echoed in the literature surrounding the impacts of the Common Agricultural Policy (CAP) and other subsidy frameworks [
25]. The nuances captured by the simulation model provide deeper insights into how specific interventions can stabilize or destabilize wheat production profitability, suggesting that tailored policy measures could enhance the resilience of agricultural producers amid economic uncertainties.
By providing a theoretically grounded yet practically applicable model, this study enhances the intersection of empirical research and strategic decision-making in the agricultural sector.
4.2. Limitations of the Study
This study acknowledges several limitations. Firstly, it relies on aggregated data from the Farm Accountancy Data Network (FADN) rather than micro-level farm data, which restricts the ability to analyze specific interventions at the individual farm level and limits the granularity of insights into the factors affecting wheat production profitability. Additionally, while the simulation model is designed to capture various scenarios related to wheat production profitability, its primary focus is on the Polish wheat market. As a result, the model’s assumptions and parameters may not be directly applicable to other crops or regions without adjustments. It is crucial to address the potential biases introduced by the aggregated nature of the data utilized in our study. The Farm Accountancy Data Network (FADN), while a pivotal resource, may not encapsulate the diverse operational practices and economic conditions present across different farms. This aggregation can obscure significant variations and nuances in the data that are essential for understanding the complexity of wheat production profitability.
Furthermore, the pessimistic and optimistic scenarios used in the model are based on confidence intervals and expert assumptions. These may not fully account for all potential market dynamics or unexpected economic shifts that might impact wheat profitability. While the model includes agricultural policy impacts, it may not entirely capture the dynamic nature of policy changes and their nuanced effects over time.
Finally, the model may not precisely incorporate unforeseen external influences, such as extreme weather events or geopolitical disturbances, which could significantly affect market conditions and agricultural profitability. Recognizing these limitations is crucial for contextualizing the findings and identifying opportunities for further research to enhance the model’s applicability and robustness in different contexts. The temporal dimension of data collection poses challenges, as historical data may not accurately reflect current market conditions or future trends. Therefore, the evolving nature of agricultural markets necessitates the ongoing reassessment and validation of the model’s assumptions and parameters. To address these issues, future research should prioritize the incorporation of real-time data and micro-level farm analyses to enhance the accuracy and relevance of the insights produced by the model. This will not only improve our understanding of the specific drivers of profitability but also facilitate more actionable policy recommendations tailored to the diverse needs of stakeholders in the agricultural sector.
4.3. Practical Application
This paper emphasizes the importance of scenario analyses in understanding potential profitability outcomes, which is critical for strategic planning and risk management in the agricultural sector. By exploring optimistic and pessimistic scenarios, this research allows for a nuanced understanding of how external factors may impact profitability, equipping stakeholders with the tools needed to navigate uncertainties in the market.
Decision-makers benefit significantly from the model’s capacity to forecast future trends in wheat production profitability under varying economic conditions. By simulating diverse scenarios, the model enables decision-makers to assess the potential impacts of policy interventions, market fluctuations, or external shocks on agricultural profitability. This capability enhances their ability to formulate evidence-based policies, mitigate risks, and strategically allocate resources to support agricultural sustainability and economic resilience.
4.4. Future Research Directions
Future research could further strengthen the model’s scientific relevance by incorporating additional functional representations or extending its application to broader regional datasets. Such expansions would allow for more comprehensive scenario analyses and provide deeper insights into strategic decision-making processes in agricultural economics. Investigating the long-term impacts of climate change on production costs and yields could also provide valuable insights into the sustainability of wheat production. Additionally, comparative studies examining other crop sectors could enhance the generalizability of the model and its implications for overall agricultural profitability. Furthermore, exploring the integration of advanced technologies, such as precision agriculture, into the model could offer innovative approaches to optimizing resource allocation and enhancing production efficiency, ultimately contributing to more sustainable agricultural practices.
By situating the findings within the broader context of agricultural economics and emphasizing the need for future exploration, this discussion underscores the significance of the simulation model as a tool for informing policy and practice in the dynamic landscape of agricultural production.
5. Conclusions
The analysis of agricultural profitability, particularly in wheat production, reveals a complex structure of influences that shape income variability for agricultural producers. Addressing the research questions, the structure of the sources of changes in agricultural profitability is multifaceted, encompassing factors such as procurement prices and their relationship to production costs, production efficiency, and the levels of subsidies provided by the Common Agricultural Policy (CAP). These variables interact dynamically, revealing how fluctuations in market conditions can lead to significant changes in profitability. The findings highlight that that market volatility is a predominant factor influencing agricultural profitability changes, especially through the lens of “price scissors”. When the price of wheat rises relative to input costs, profitability enhances, incentivizing increased production and investment. Conversely, escalating input costs can narrow the price scissors and diminish profitability, demonstrating this concept’s sensitivity to both market dynamics and policy interventions.
The simulation model illustrated in the article serves as a significant tool for analyzing these profitability changes, allowing for evidence-based decision-making in a sector characterized by inherent uncertainties and fluctuations. By employing sophisticated econometric techniques and integrating empirical data, the model effectively captures the complexities of market dynamics and interrelated relationships among key variables. It demonstrates how changes in price relationships significantly influence production yields and total output. The model’s adaptive nature allows for scenario-based analyses, enhancing its relevance in addressing the inherent uncertainties in agricultural markets. Additionally, the potential for further refinement through the incorporation of diverse data sources and functional representations indicates a promising avenue for future research, thereby solidifying its foundation in agricultural economics.
The contributions of this paper lie not only in the development of a robust modeling framework but also in its implications for enhancing agricultural practices, policy formulation, and economic resilience in the face of evolving market conditions. The wheat production profitability simulation model represents a pivotal tool that bridges theoretical insights with practical applications in agricultural economics. Its versatility and analytical depth empower stakeholders across academia, agriculture, and policy-making to navigate complex challenges, optimize decision-making processes, and foster sustainable agricultural development.


