Article

Effects of Enhanced Phytoremediation Techniques on Soil Aggregate Structure

1
Land Consolidation and Rehabilitation Center, Ministry of Natural Resources, Beijing 100035, China
2
School of Land Science and Technology, China University of Geosciences (Beijing), Beijing 100083, China
3
Technology Innovation Center of Land Engineering, Ministry of Natural Resources, Beijing 100035, China
*
Author to whom correspondence should be addressed.
Agriculture 2024, 14(11), 1882; https://doi.org/10.3390/agriculture14111882
Submission received: 25 September 2024 / Revised: 21 October 2024 / Accepted: 22 October 2024 / Published: 24 October 2024
(This article belongs to the Section Agricultural Soils)

Abstract

:
In response to the current serious problem of soil cadmium (Cd) contamination in agricultural land, phytoremediation technology is a green and environmentally friendly application prospect; however, its remediation efficiency is currently limited. An enhanced phytoremediation technique was constructed using the biodegradable chelator aspartate diethoxysuccinic acid (AES) combined with the plant growth regulator gibberellic acid (GA3) to enhance the formation of maize. This technique has been proven to have a superior remediation effect. However, the safety of the restoration technique is of particular importance. The remediation process not only removes the contaminants, but also ensures that the original structure and stability of the soil is not damaged. In this regard, the constructed enhanced phytoremediation technique was further investigated in this study using soil columns. In combination with microscopic tests, such as X-ray diffraction and scanning electron microscopy, this study investigated the effects of the remediation process on the distribution characteristics of Cd in soil aggregates, and the structure and stability of soil aggregates. This was conducted by analyzing, as follows: plant growth conditions; the morphology, structure and mineral composition of soil aggregates in different soil layers; and the changes in these characteristics. The results demonstrated that the enhanced phytoremediation technique constructed in this study has a negligible impact on the morphology and mineral composition of soil aggregates, while exerting a limited influence on soil structure stability. This indicates that the technique can facilitate the safe utilization of remediated contaminated soil.

1. Introduction

The contamination of agricultural land with cadmium (Cd) has emerged as a significant environmental concern, warranting urgent attention within soil ecosystems [1,2,3]. This contamination not only leads to the degradation of the quality of agricultural land, but also poses a grave threat to food security and human health. Therefore, it is urgent to explore cost-effective and environmentally friendly remediation technologies. The remediation of Cd-contaminated agricultural land must not only achieve the removal of pollutants, but also ensure that the original structure and stability of the soil are maintained. This is essential to ensure the safe use of Cd-contaminated agricultural land and sustainable development. A stable soil structure is characterized by a balanced distribution of microorganisms, water, minerals, and oxygen, which collectively contribute to the maintenance of soil health. However, it should be noted that natural ecological changes and man-made production and management activities can have an impact on soil structure. In our previous study, we demonstrated that the remediation technique of the biodegradable chelator, aspartate diethoxysuccinic acid (AES), in combination with the plant growth regulator gibberellic acid (GA3) to enhance maize formation (optimal ratio of 10−6 mol/L GA3 in combination with 6 mmol/kg AES), can be effective in remediating Cd-contaminated soil [4,5]. In the course of our experiments, we selected maize as the remediation plant. In comparison to the characteristics of ultra-enriched plants, such as a lengthy growth cycle and a relatively small biomass, maize exhibits several advantages. These include a large biomass, a relatively short growth cycle, less stringent soil requirements, strong environmental adaptability, and the potential for the remediation of heavy metal-contaminated soil [6,7]. In addition, considering that maize has a fast root development at seedling stage, it has a high enrichment capacity for Cd [8,9]. Therefore, maize was selected as the phytoremediation material in this study, and seedling experiments were conducted.
Soil aggregates are the most basic structural unit. As the main form in which soil exists, aggregates are a key factor in soil resistance to external forces [10,11]. A highly stable soil aggregate structure has been demonstrated to enhance soil fertility properties and improve soil erosion resistance [12,13]. Soil aggregates are regarded as a significant indicator in the assessment of soil structure, quality, and stability. Furthermore, the intrinsic properties of aggregates influence the distribution of substances within the soil [14]. The process of remediation of heavy metal-contaminated soils affects the composition and structure of soil aggregates and may have an impact on the deep soil structure, which places higher demands on the study of remediation technologies for Cd-contaminated soils [15]. In addition, chemicals and other materials used in the remediation process, such as chelating agents, could react with the soil’s own clay minerals, oxides, organic matter, and heavy metals combined with soil colloids, thus affecting the components and structure of the soil, which could potentially have an impact on soil stability [16]. Through scanning electron microscopy (SEM) and X-ray diffraction (XRD), these microscopic tests can analyze the changes in soil morphology and structure before and after remediation by enhanced phytoremediation techniques, and further analyze the adsorption of heavy metals and their mechanisms. This can provide a theoretical basis for the bioremediation of heavy metal contamination, and is of great significance to the study of heavy metal remediation.
In response to the current serious problem of soil Cd pollution in agricultural land, phytoremediation technology has green and environmentally friendly application prospects, but its remediation efficiency is very limited. In previous research, we constructed an enhanced phytoremediation technology. However, the safety of the remediation technology is also particularly important. The remediation process should not only remove the pollutants, but also ensure that the original structure and stability of the soil will not be damaged. Based on our previous research, this study further investigated the constructed enhanced phytoremediation technology by using the soil column device. The specific objectives of this study are as follows: (1) to analyze the growth of plants during the remediation process, and to investigate the distribution of Cd in aggregates of different particle sizes in different soil layers by selecting indicators such as the average weight diameter of the aggregates, the distribution factor of heavy metals and the mass loading. (2) Combined with modern spectroscopy and other microscopic testing and analyzing methods, we analyze the changes in the morphology, elemental composition and soil mineral composition of soil aggregates before and after remediation. (3) Through the above analyses, the mechanism of enhanced phytoremediation was further explained.
The main contribution of this study is that we used the soil column device to study the characteristics and stability of soil aggregates through different soil depths. The distribution of Cd in soil aggregates was analyzed, and the effects of enhanced phytoremediation on soil structure and the mechanism of this remediation technology were investigated to provide technical support for the remediation of Cd-contaminated soil in agricultural land, and to serve as a reference with informative value for evaluating the environmental friendliness of the remediation technology.

2. Materials and Methods

2.1. Experimental Design

Based on the conclusions obtained from the previous study [4,5], experimental treatments for the intensive maize remediation of Cd-contaminated soil were carried out using concentrations of 10−6 mol/L GA3 and 6 mmol/kg AES. At the same time, the following six experimental treatments were set up: not planting maize and not applying AES; not planting maize and only applying AES; planting maize only; planting maize and applying AES; and planting maize and applying GA3. Each of the treatments was replicated three times. Plant samples and soil samples were collected simultaneously for analysis at the end of the experiment. The experimental setup is shown in Table 1.

2.2. Material Preparation

The seeds of maize (Zea mays L.) were provided by the Henan Academy of Agricultural Sciences. After the maize seeds germinated, the germinated seeds were sown in the top 2 cm of soil. GA3 was purchased from Maclean Biochemical Technology Co., Ltd., Shanghai, China. AES was purchased from Kemira Company, Helsinki, Finland. The chemical formula of AES is C16H23NO14. The molecule’s structural composition incorporates functional units that are capable of engaging in coordination. Such functional groups include carboxyl groups (–COOH), which possess a lone pair of electrons and are thus capable of forming coordination bonds with metal ions, thereby generating stable chelates. Once the corn seeds had emerged, two seedlings were retained for the corn seedling experiment per treatment. The AES was applied to the soil on the 30th day of maize growth. After 24 h of the chelating treatment, GA3 was sprayed on maize leaves using a spray can. Harvesting was carried out after 7 days. It has been shown that chelating agents are effective 3–10 d after application. Therefore, in this study, plant samples were harvested after 7 d of the chelator treatment and soil samples were also collected for analytical tests [17]. In addition, it has been shown that the root system of maize exhibits accelerated development during the seedling stage and demonstrates a high capacity for Cd enrichment. The enrichment of heavy metals during the seedling stage has been shown to negatively impact the growth and development of maize at subsequent stages, including the pulling stage, the ear stage, and the flower and grain stage. The severity of this impact can ultimately result in the death of maize at the pulling stage [5,18].
Soil profile samples were collected from agricultural land in Shunyi District, Beijing, at depths of 0–20 cm, 20–40 cm, and 40–60 cm. The soil type was identified as tidal soil with a medium loamy texture. The background concentration of Cd in the soil was determined to be 0.35 mg/kg. After soil collection, debris, such as plant roots and small stones, were removed, placed in a ventilated area to dry naturally, and sieved through a 2 mm sieve to be used to fill the soil columns. Artificially added contaminants can ensure the consistency and reproducibility of the experimental conditions, which facilitates the subsequent analysis of data and the verification of results. Exogenous heavy metal Cd (in the form of CdCl2 solution) was added to the air-dried soil. The Cd content reached more than the risk intervention value for agricultural soil contamination [19]. The risk intervention value for Cd content in soil is 4 mg/kg when soil pH > 7.5. After 60 days, basal fertilizer (N: 100 mg/kg soil, P: 80 mg/kg soil, K: 100 mg/kg soil) was applied in the form of urea (CO (NH2)2) and a potassium dihydrogen phosphate (KH2PO4) solution. The treated soil was thoroughly mixed to maintain a moisture content at about 60% of the field moisture content and then left for 1 week. The basic physicochemical properties of the soil were as follows: 13.4 g/kg organic matter; 0.111% total nitrogen (TN); 0.135% total phosphorus (TP); 2.16% total potassium (TK); 103 mg/kg hydrolyzed nitrogen; 176 mg/kg available phosphorus; 6.0 cmol/kg cation exchange capacity; 6.53 mg/kg total cadmium; and a pH of 7.95.

2.3. Experimental Device

This study was carried out using the soil column experimental method, which is illustrated in Figure 1. The soil column device is a cylinder with a height of 730 mm and an inner diameter of 100 mm, constructed from acrylic. The device was designed and produced by our research team. According to the collection depths of the soil samples (0–20 cm, 20–40 cm and 40–60 cm), the pre-treated soil was filled into the corresponding depths of the soil columns after weighing the mass of soil at different depths, according to the density of natural soil. Each layer was filled with approximately 3.0 kg of soil and gently compacted with tools to a thickness of 20 cm, thus maintaining the soil in a firm state that was consistent with its natural composition. The soil from 0–20 cm was contaminated soil treated with CdCl2 solution. The soil in the layers 20–40 cm and 40–60 cm had no added contaminants and was sieved and naturally air-dried. The soil column device comprised a 0–20 cm soil layer filled with Cd-contaminated soil, prepared in advance, and a quartz sand layer of a specified thickness, acid-soaked and washed, situated at the bottom of the device. The quartz sand was surrounded by a nylon mesh at the top and bottom of the quartz sand layer. Sampling holes were established on the soil column device, and two sampling holes were set up at each soil depth, with a certain distance between them in the vertical direction. The sampling holes were used to collect soil samples from different soil depths during the experiment.

2.4. Sample Analysis

2.4.1. Plants

At the end of the experiment, the entire plant and root system were carefully stripped from the soil by cutting the aboveground and belowground portions of the vegetation in the vicinity of the roots, with the objective of preserving the root system’s structural integrity. Subsequently, two parts were individually labelled and sorted. The roots were observed at two soil depths, 20–40 cm and 40–60 cm, of the soil column. The aboveground parts of the maize were harvested for stems and leaves. The aboveground components of maize were harvested as stems and leaves. The plant roots were treated using the digging and rinsing method, whereby the entire maize root system was excavated and placed in a mesh pocket. The soil was then rinsed with off with water to remove any remaining soil, with the utmost care taken to avoid damaging the root system. Finally, the roots were dried on the surface with absorbent paper. The plant height was determined using a scale, and the plant samples were harvested separately according to the aboveground and root components. These were then killed, dried at 105 °C for 30 min, and then kept at 70 °C until a constant weight was reached. The dry weight was then recorded, and the samples were stored in a dry Ziploc bag for subsequent testing and analysis. Fresh plant samples were taken from randomly selected leaves, on which circular samples were punched with a perforator for the determination of physiological and biochemical activities of the plant [5,20,21]. Superoxide dismutase (SOD) activity was determined by the nitrogen blue four azole (NBT) method. A sample of 0.5 mL of the above enzymatic liquor was collected, and then 1.5 mL of 0.05 mol/L phosphate buffer, 0.3 mL of 130 mmol/L Met solution, 0.3 mL of 0.75 mmol/L NBT solution, 0.3 mL of 0.1 mmol/L EDTA-Na2 solution, and 0.3 mL of 0.02 mmol/L riboflavin were added. Using a dark tube as a blank control, UV absorbance was measured at 560 nm. The malondialdehyde (MDA) content in the plants was measured by the thiobarbituric acid colorimetry method. Three grams of leaves were cut into pieces and added to 30 mL of phosphoric acid buffer. The leaves were ground into a homogenate, centrifuged, extracted, and combined with the supernatant to a fixed volume. Then, the enzyme solution was prepared for refrigeration. The activity of catalase (CAT) was determined by ultraviolet absorption. A sample of the enzyme in the amount of 2.5 mL was added to 2.5 mL of 0.1 mol/L H2O2. Afterwards, 2.5 mL 10% H2SO4 was added to the sample, which was then heated in a 30 °C water bath for 10 min; then, this solution was titrated with 0.1 mol/L KMnO4 until the pink coloration disappeared. The UV absorbance was measured at a wavelength of 240 nm. The activity of peroxidase (POD) was determined by the guaiacol method. A sample of the above enzyme solution in the amount of 0.1 mL was taken. Then, 2.9 mL of 0.05 mol/L phosphate buffer, 1.0 mL of 2% H2O2, and 1.0 mL of 0.05 mol/L guaiacol were added. The solution was heated in a 37 °C water bath for 15 min. Then, 2.0 mL of 20% trichloroacetic acid was added to terminate the reaction. The solution was then centrifuged, and the absorbance was measured at a wavelength of 470 nm.
After grinding the plant samples, microwave digestion was carried out with mixed acid (V (HNO3):V (HCIO4) = 5:1). After filtration, the Cd content in plant was determined by ICP-MS (Agilent 7500, Agilent Technologies Inca., Santa Clara, CA, USA). Celery was used for quality control and a blank test was conducted for the whole process.

2.4.2. Soil

1.
Analysis of soil chemical properties and heavy metal content
The physical and chemical properties of the soil were determined following “Analytical methods of soil agricultural chemistry” [22] and “Soil agrochemical analysis” [23]. The pH was determined by means of a glass electrode pH meter, employing a 1:2.5 ratio of soil to water suspension. The TN content was measured by the semi-micro Kjeldahl method. The TP content was measured by vanadium molybdenum yellow spectrophotometry. The TK content was measured by the flame photometric method. Determination of the soil cation exchange capacity was conducted using the ammonium chloride–ammonium acetate exchange method. Soil organic matter was determined using a TOC analyzer.
The soil was microwave-digested using a mixed acids solution (V (HCl):V (HNO3):V (H2O2) = 3:1:1); the Cd content of the soil was determined by ICP-MS (Agilent 7500, USA) after acid removal, constant volume, and filtration. To ensure the accuracy and precision of the determination process, parallel samples, blank samples, and national standard samples (GBW07405a (GSS-5a)) were set up. The standard deviations of the parallel samples were within 5%; the recoveries of each heavy metal element ranged from 86.3% to 113.3%, indicating satisfactory quality control;
2.
Aggregate particle size fraction of soil
Soil aggregates were separated by the wet sieve method and determined using a soil aggregate analyzer (TTF-100, Shunlong Experimental Instrument Factory, Shaoxing, Zhejiang, China) equipped with sieve sets with apertures of 2 mm, 0.2 mm, 0.02 mm, and 0.002 mm, in descending order. Sieving resulted in soil aggregate samples of <0.002 mm, 0.002–0.02 mm, 0.02–0.2 mm, and 0.2–2 mm particle sizes. The procedure was as follows: 50 g of air-dried soil was weighed and placed at the top of the sieve set, the sieve set and the soil were placed in the soil aggregates analyzer, and deionized water was added slowly. The instrument was switched on and the sieve was moved up and down with an amplitude of 40 mm and a vibration frequency of 15 times/min and vibrated for 30 min. The water–soil mixture was collected from each sieve into a clean container, placed in an oven at 40 °C, dried, weighed, and the mass fractions of soil aggregates of different particle sizes were calculated;
3.
Analysis of surface morphology and mineral composition of soil aggregates
Soil particles were analyzed using a scanning electron microscope (SEM, S-4800, Hitachi ltd., Tokyo, Japan) to observe the micro-morphological and structural characteristics of the soil particles, based on the physical effects that occur when soil particles are irradiated by X-rays.
An X-ray diffractometer (XRD, D8 Advance, Bruker Scientific Technology Co. Ltd., Karlsruhe, Germany) was used to examine soil particles of each grain size using X-ray diffraction of the crystal formation to determine the type of mineral, the composition of the physical phase, and the degree of crystallinity. In addition, using the relative area of the diffraction peaks of each physical phase, the relative percent content of each mineral was calculated. In this study, the mineral composition was analyzed and the XRD measurement conditions were set to 40 mA current, 40 kV voltage, 0.02° step size, and a scanning angle range of 3–70°.

2.5. Methodology for Calculating the Indicators

2.5.1. Biological Concentration Factor

The biological concentration factor (BCF) is an indicator of the plant’s ability to take up heavy metals from the soil, quantifying the transport of Cd from the soil to plant tissues [24]. The formula is as follows:
B C F = C a C s
where C a represents the concentration of Cd aboveground in the plant and C s represents the initial soil Cd concentration, both in mg/kg.

2.5.2. Translocation Factor

The translocation factor (TF) is an indicator of the ability of heavy metals to be transferred from roots to aboveground in plants and can show the distribution pattern of Cd in plants [25]. The formula is as follows:
T F = C a C r
where C a represents the concentration of Cd in the aboveground part of the plant and C r represents the concentration of Cd in the roots, both in mg/kg.

2.5.3. Extraction Efficiency

The extraction efficiency (EE) is calculated using the following formula:
E E = C a × M a T s × 100 %
where C a represents the concentration of Cd aboveground in the plant (mg/kg), M a represents the dry weight aboveground in the plant (kg), and T s represents the total amount of soil Cd (mg).

2.5.4. Mean Weighted Diameter

The mean weight diameter (MWD) of aggregates is used to show the stability of soil aggregates, with higher values representing more stable soil aggregates. The formula is as follows:
M W D = i = 1 4 x i × ω i
where x i denotes the average particle diameter (mm) of the soil aggregate fraction at particle size i , and ω i denotes the percentage (%) of the dry weight of the soil aggregate fraction at particle size i .

2.5.5. Distribution Factor

The heavy metal distribution factor (DF) was used to characterize the enrichment of heavy metal elements in soil aggregates of different grain sizes and was calculated using the following formula:
D F x = X f r a c t i o n X b u l k
where X f r a c t i o n denotes the concentration of Cd in soil aggregates of different grain sizes (mg/kg) and X b u l k denotes the concentration of Cd in soil (mg/kg).

2.5.6. Grain-Sized Fraction Metals Loading

The grain-sized fraction metals loading (GSF) was calculated using the following formula:
G S F l o a d i n g = C i × G S i i = 1 4 ( C i × G S i ) × 100
where C i denotes the concentration of Cd in soil aggregates at particle size i (mg/kg) and G S i denotes the mass fraction of soil aggregates at particle size i (%).
All experimental data were statistically analyzed using Microsoft Excel 2016 software; IBM SPSS Statistics 25.0 software (SPSS Inc., Chicago, IL, USA) was used to analyze the data for variance, correlation, standard deviation and significance of difference at p < 0.05, with different letters (a, b, c, d, e) used to denote significant differences. Three replicates of the data were used to calculate the mean and standard deviation and also plotted using Origin 2024 software (OriginLab Inc., Northampton, MA, USA).

3. Results

3.1. Growth of Maize Under Different Treatments in the Soil Column Experiment

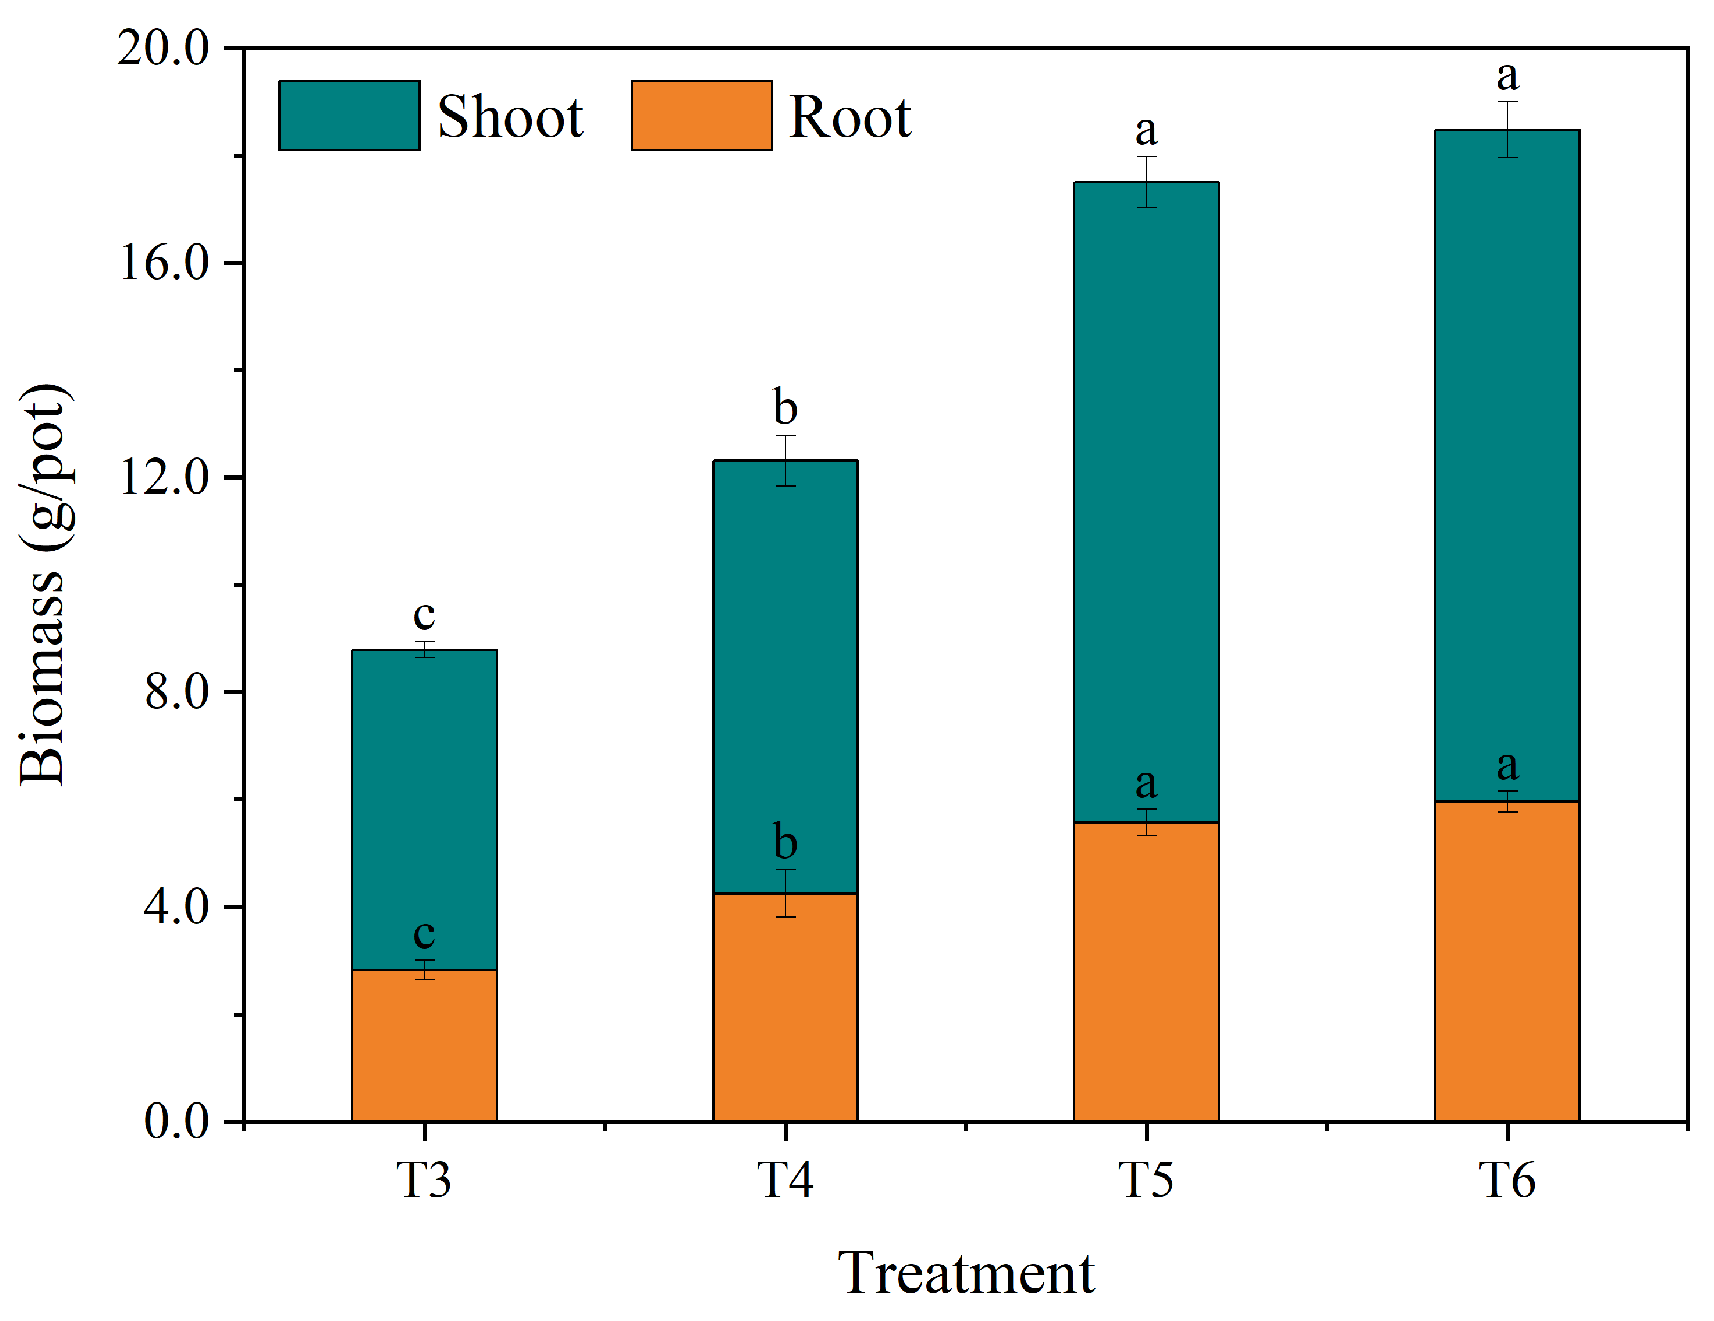
3.1.1. Maize Biomass

In this study, biomass was calculated as the dry weight of the plant. Shoot and root biomass samples of maize under different treatments are shown in Figure 2. The maize grew well throughout the experiment; no obvious symptoms of toxicity were observed on the plants in any of the treatments. All treatments significantly (p < 0.05) increased aboveground biomass and root biomass of maize compared to the maize-only treatment (T3). The highest maize biomass was observed in the AES combined with the GA3-fortified maize treatment (T6), with aboveground, root and total biomass reaching 12.52 g/pot, 5.96 g/pot. The results demonstrated that the biomass of the maize plants was significantly increased in all treatments compared to that of the control treatment (T3). The highest biomass was observed in the AES combined with the GA3-fortified maize treatment (T6), with an increase of 109.70%, 111.35% and 110.23% in the aboveground, root and total biomass, respectively, compared to the control treatment.

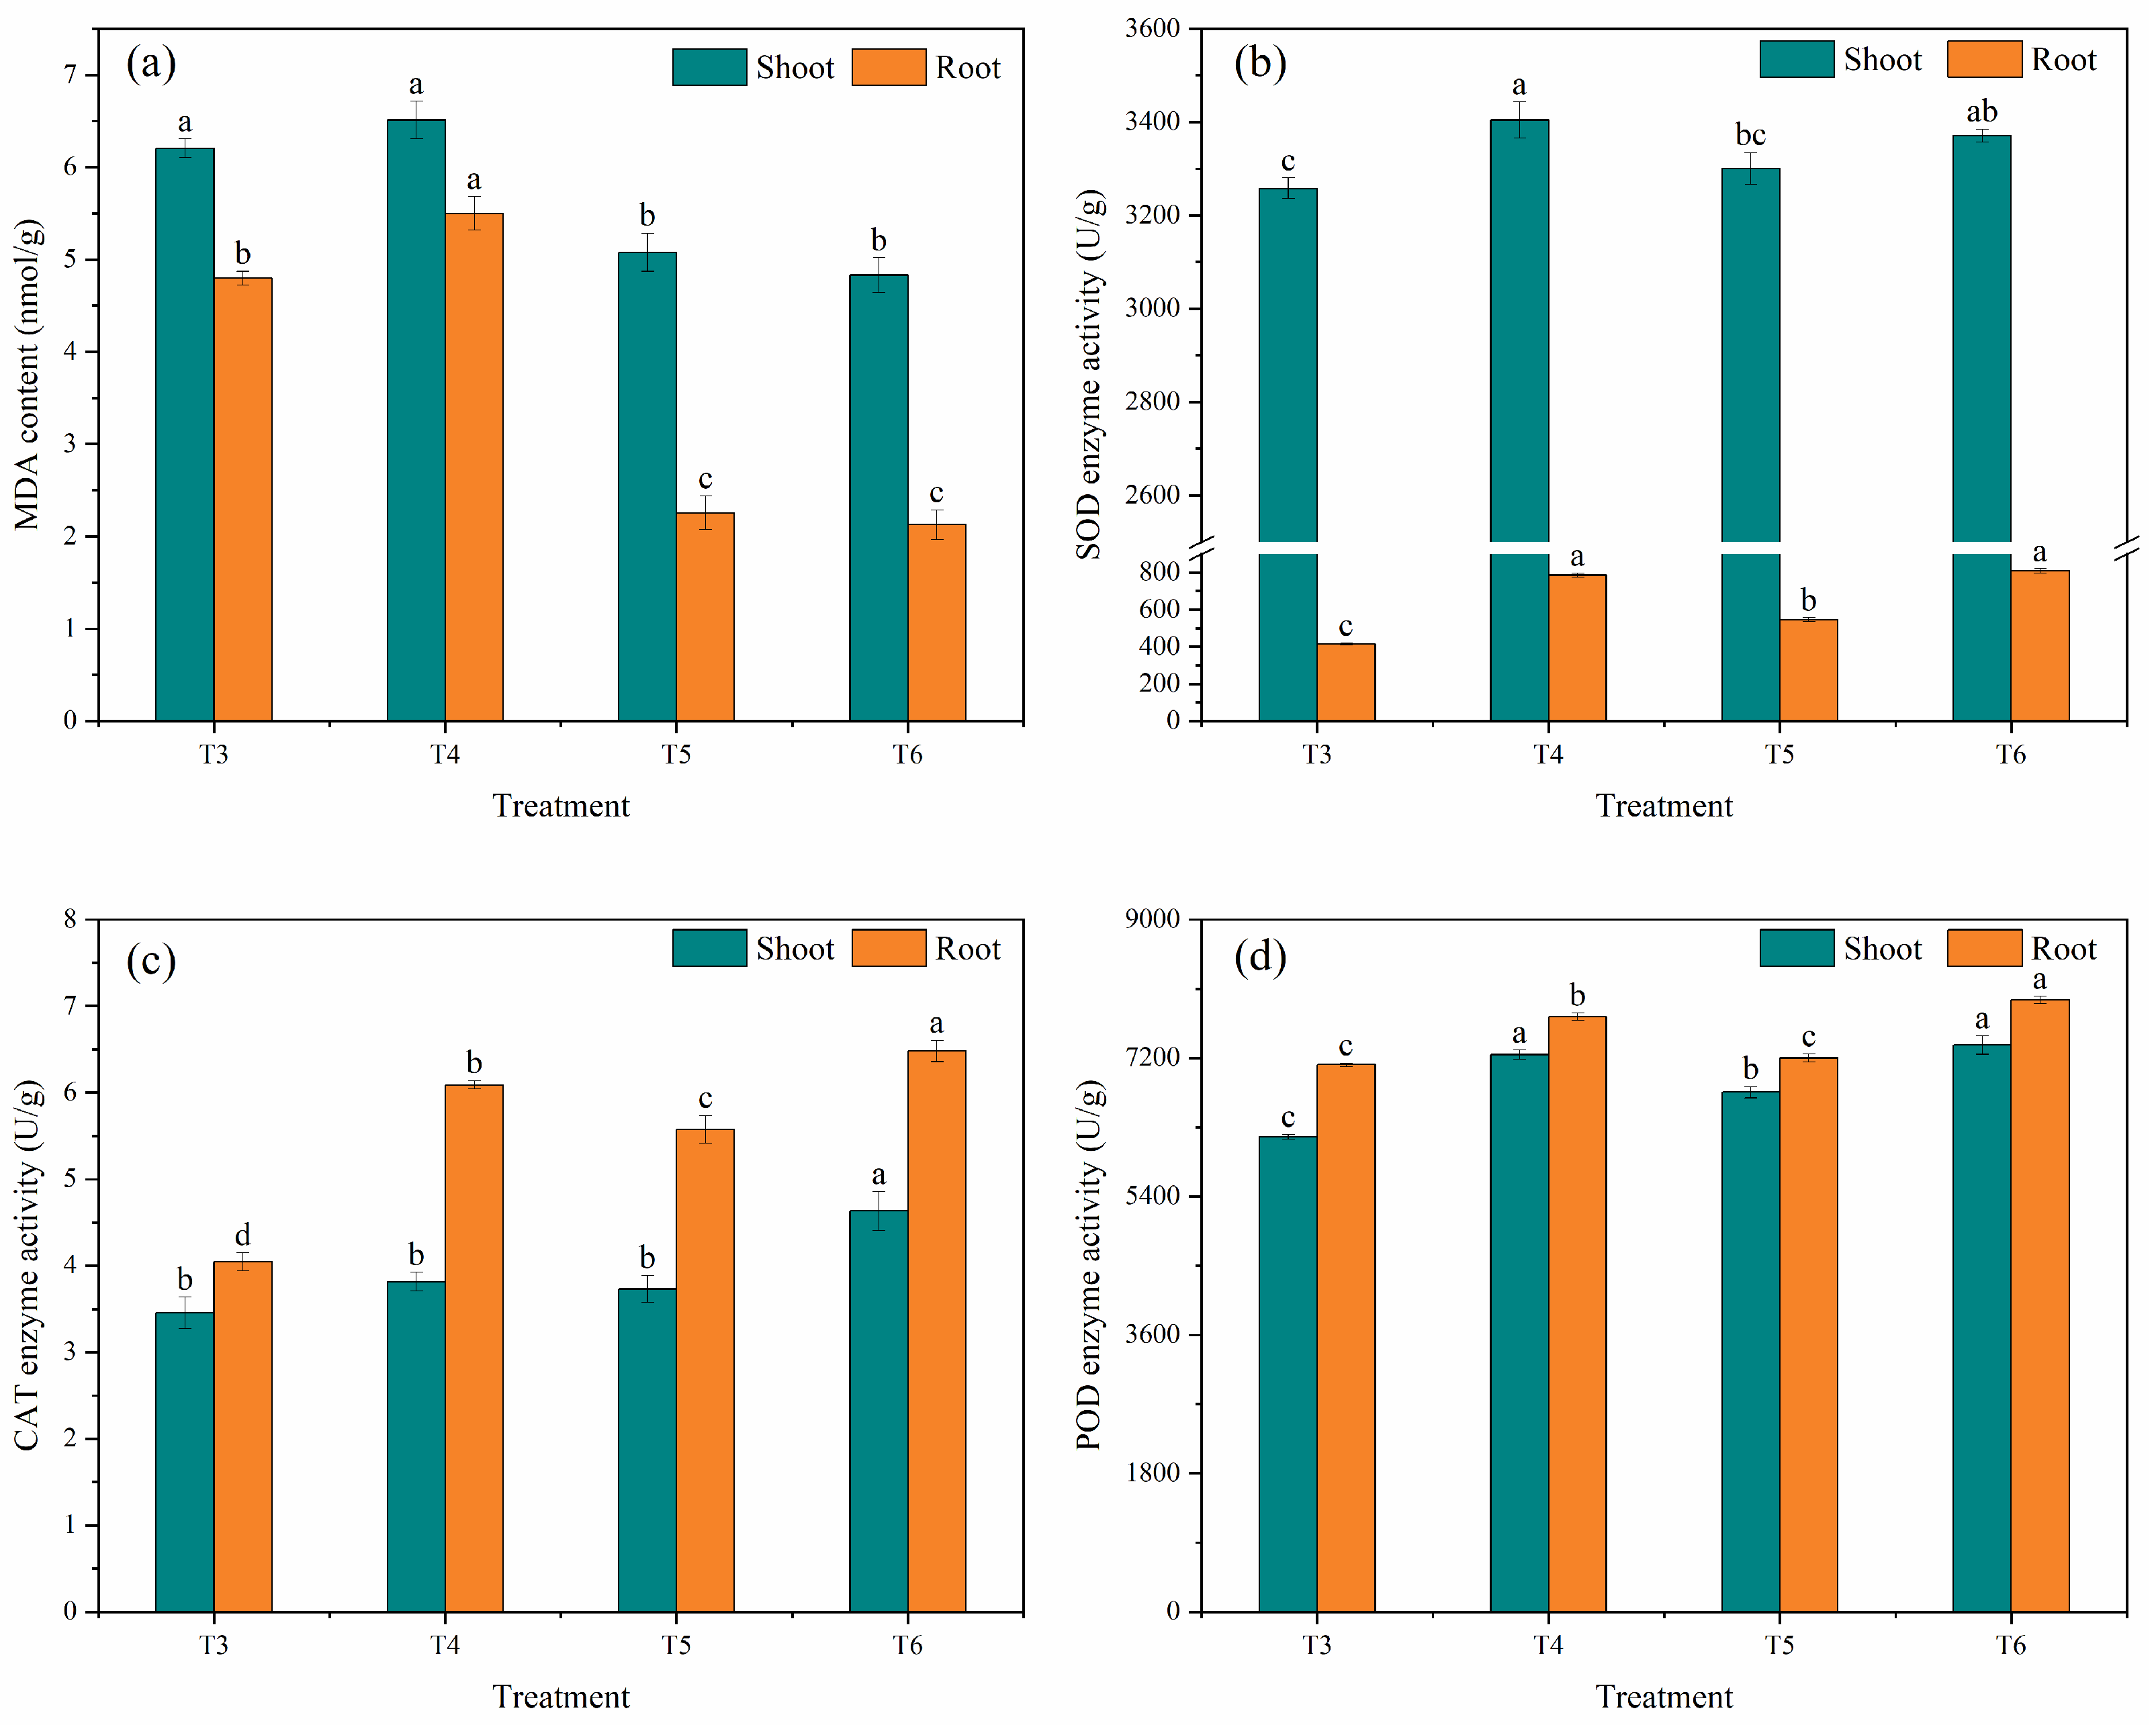
3.1.2. Physiological and Biochemical Activities of Maize

Plants possess a robust defense system within their cellular structure, which enables them to mitigate the effects of Cd stress by regulating the activity of antioxidant enzymes within their antioxidant system, cellular membrane, and scavenging reactive oxygen species (ROS). This reduces the toxicity of heavy metals [26]. Figure 3 illustrates the MDA content and antioxidant enzyme activities of maize aboveground and roots under different treatments.
The application of the AES-enhanced maize treatment (T4) resulted in a 4.92% increase in the aboveground and a 14.71% increase in the root MDA content of maize, when compared to the maize-only treatment (T3). AES increased the amount of Cd desorbed or extracted in a soluble form, thereby rendering it available to the plant. Furthermore, the plant roots that were extracted demonstrated a higher level of Cd absorption. Consequently, the plants exhibited elevated levels of oxidative damage and increased MDA content. With the exception of the T4 treatment, the aboveground and root MDA contents of the GA3-fortified maize treatment only (T5) and the AES combined with GA3-enhanced maize treatment (T6) were significantly lower (p < 0.05) compared to the T3 group. This was related to the application of GA3, which has been demonstrated to reduce oxidative stress damage to plants. The greatest reduction in MDA content was observed under the T6 treatment, with a 22.15% and 55.62% reduction in the aboveground and root MDA content, respectively.
With regard to antioxidant enzyme activities in maize aboveground and roots, there was an observable increase in SOD, CAT and POD activities in the other treatment groups when compared to the T3 group. Notably, superoxide dismutase (SOD) activity in maize roots exhibited a marked increase, reaching 89.46% and 95.05% in the T4 and T6 groups, respectively, in comparison to the T3 control. Furthermore, CAT activity also varied considerably, with a more than 50% increase in root enzyme activity observed in both the T4 and T6 groups in comparison to the T3 control.

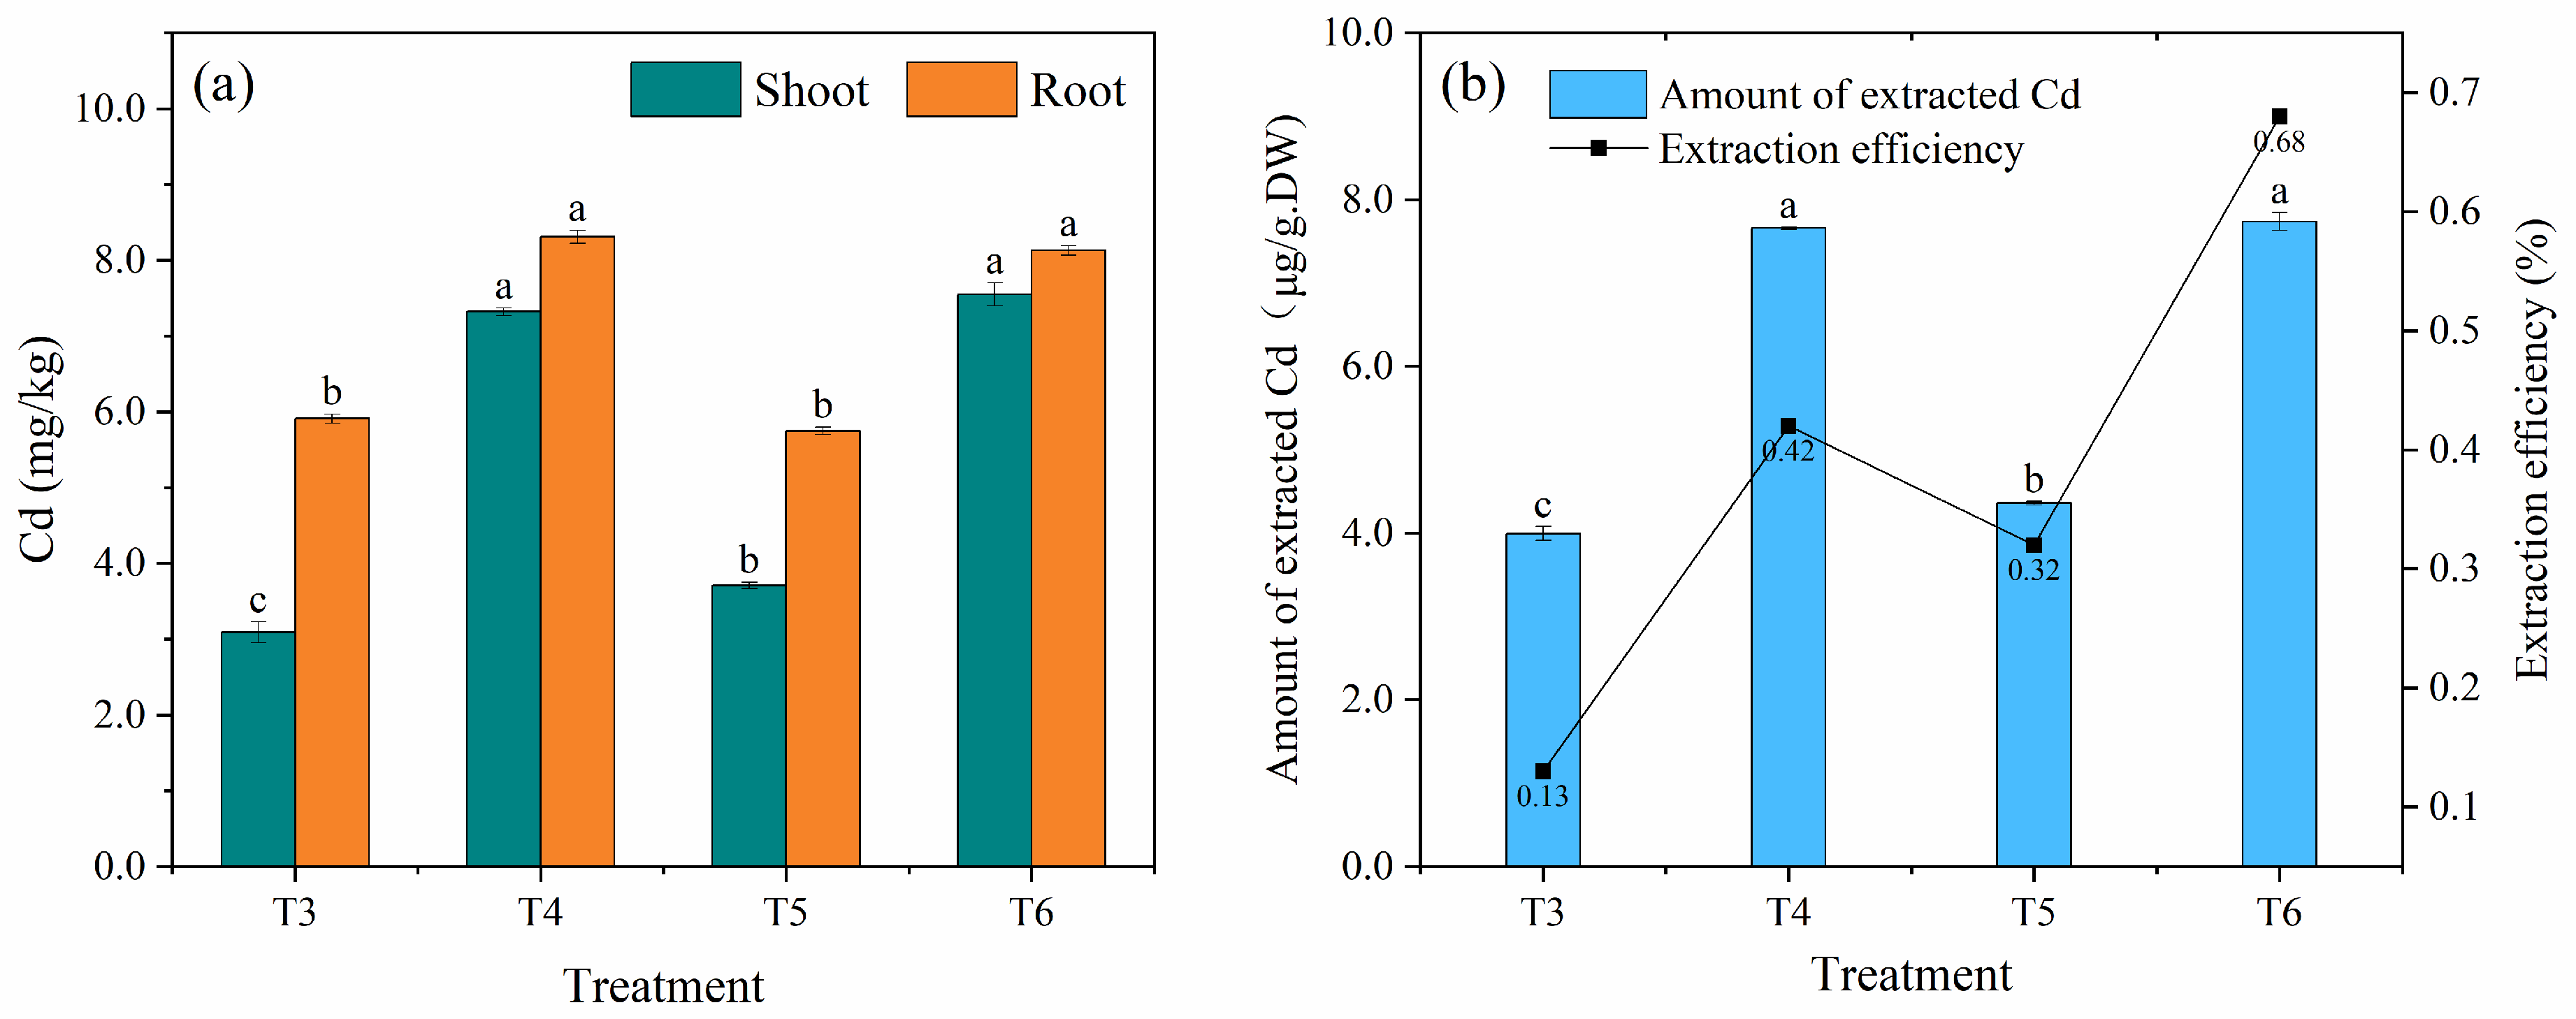
3.1.3. Remediation Effect of Cd-Contaminated Soil under Different Treatments in Soil Column Experiments

Figure 4a illustrates the shoot and root Cd contents of maize under different treatments. In comparison to the planted maize treatment only (T3), the AES-enhanced maize treatment only (T4) and the AES combined with the GA3-enhanced maize treatment (T6) demonstrated a notable elevation in the aboveground and root Cd concentrations of maize. However, the alterations in Cd concentrations between these two treatments were not statistically significant in the T4 and T6 groups. However, both treatments exhibited higher concentrations than the GA3-fortified maize treatment only (T5), indicating that the impact of AES on the aboveground and root Cd concentrations of plants was more pronounced than that of GA3. In the T5 group, the concentration of Cd in the upper part of the maize field increased by 20.06% in comparison to the T3 group, while the concentration of Cd in the roots decreased by 2.71% in comparison to the T3 group. The application of plant growth regulators has been demonstrated to regulate the transport of heavy metal ions and nutrients within plant cells, thereby increasing the concentration of Cd in the aboveground parts of the plant.
Figure 4b illustrates the total extraction of Cd and the aboveground extraction efficiency of maize under various treatments. As illustrated in the figure, the total extraction of Cd by maize and the efficiency of aboveground Cd extraction exhibited an increase in the other treatments in comparison to the T3 group [27]. The total extraction of Cd and the above-ground extraction efficiency of maize under different treatments are illustrated in Figure 4b. As illustrated in the figure, the total extraction of Cd by maize and the efficiency of aboveground Cd extraction exhibited an increase in the other treatments relative to the T3 group. The total extraction reached a maximum value of 7.74 μg/g DW in group T6, representing a 307.17% increase over group T3. Subsequently, groups T4 and T5 exhibited total extractions of 7.66 μg/g DW and 4.36 μg/g DW, respectively. The magnitude of the aboveground extraction efficiency of Cd was T6 > T4 > T5 > T3. The aboveground extraction efficiency of the T6 group reached the maximum value of 0.68%. In related studies, some scholars have employed the use of GA3 and the degradable chelator EDDS with the objective of enhancing phytoremediation of Cd-contaminated soils. The aboveground extraction efficiency of plants has been observed to reach up to 0.125% [28]. The efficiency with which plants extract Cd determines the efficacy of the remediation process. The technique employed in the present study was more effective than that used in other studies. If the extraction amount of Cd by maize roots is taken into consideration, it can be posited that the extraction efficiency of the T6 group could reach 1.02%. The T6 group exhibited the highest extraction amount and efficiency of Cd by maize, indicating that the combined application of AES and GA3-enhanced maize restoration promoted the extraction and enrichment of Cd by maize.
The objective of phytoremediation techniques is to enhance the accumulation of heavy metals in the plant aboveground. The aggregation characteristics of maize in the various treatment groups containing BCF and TF are presented in Table 2. The order of Cd accumulation and translocation capacity of plants in different treatment groups was T6 > T4 > T5 > T3. The accumulation of Cd in plants was found to be significantly (p < 0.05) increased in the T4 and T6 groups in comparison to the T3 group. However, no significant difference was observed in the T5 group. The maximum values for BCF and TF were observed in the T6 group, which exhibited values 2.44 and 1.78 times higher, respectively, than those observed in the T3 group.

3.2. Composition of Aggregates and Distribution of Cd in Each Soil Layer under Different Treatments in the Soil Column Experiment

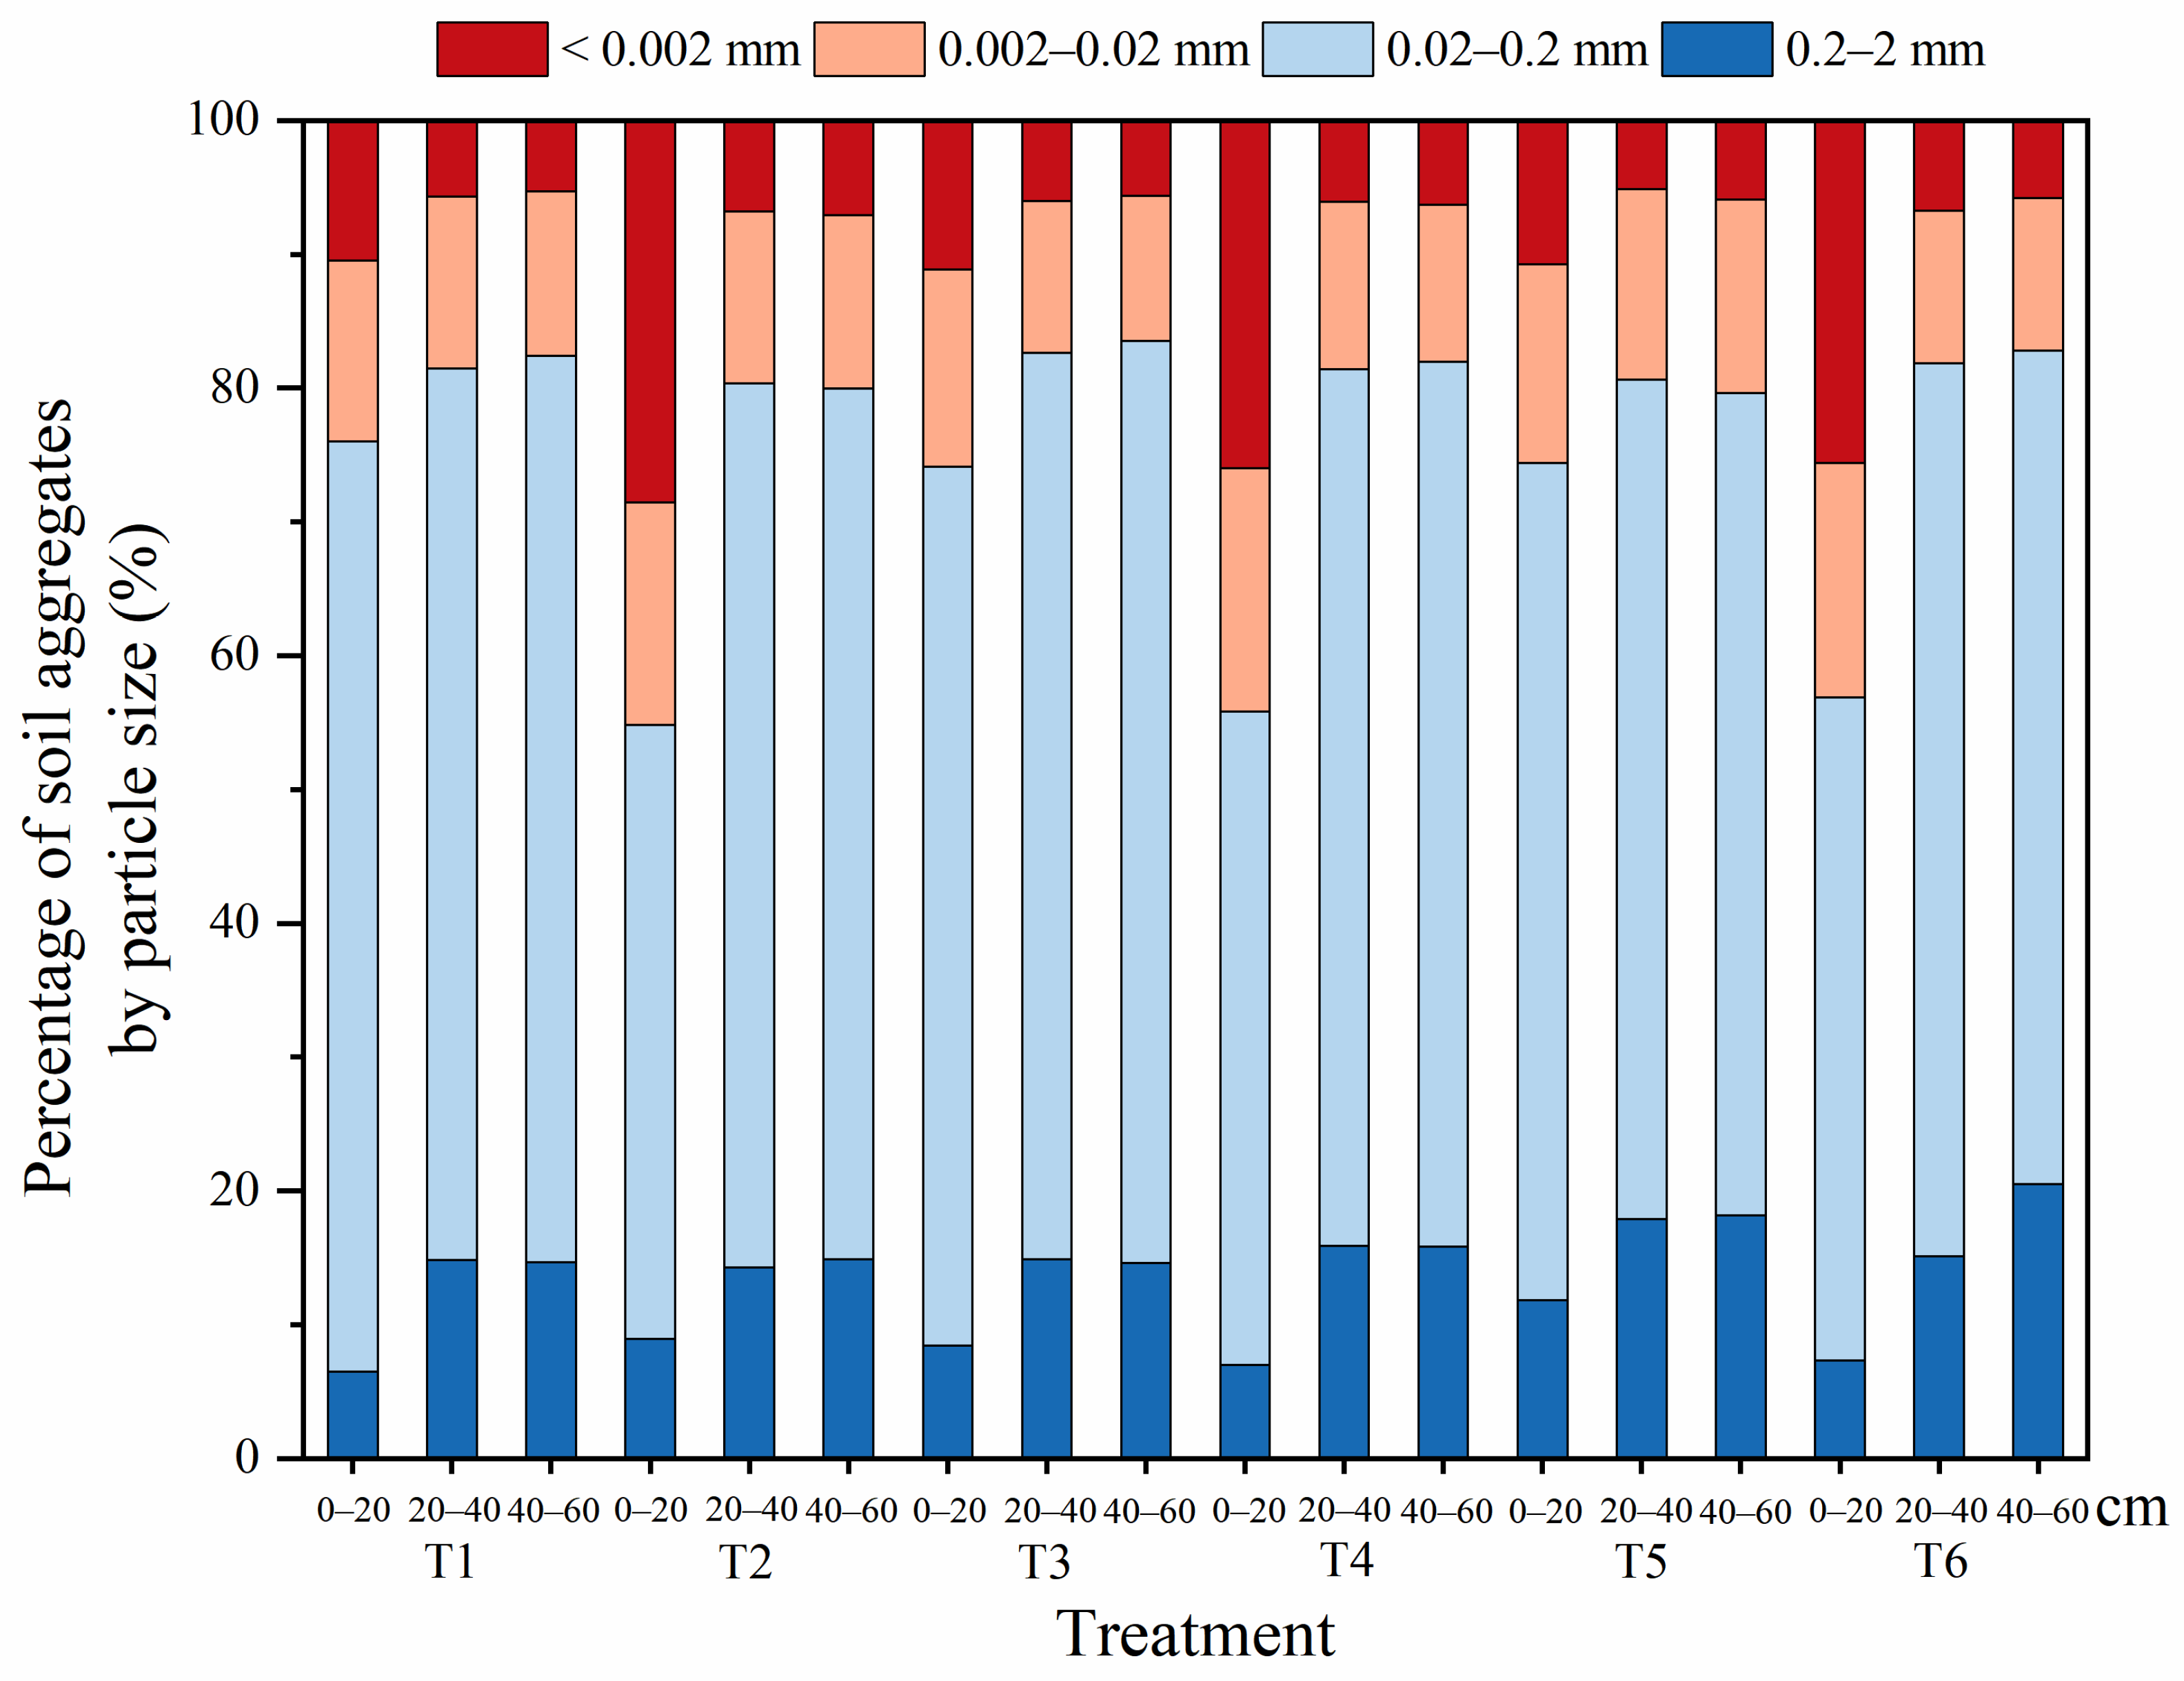
3.2.1. Composition of Aggregates in Each Soil Layer under Different Treatments in the Soil Column Experiment

In this study, four types of soil water-stable aggregates were obtained by the wet sieving method, with particle sizes < 0.002 mm, 0.002–0.02 mm, 0.02–0.2 mm, and 0.2–2 mm. The composition of soil aggregates under different treatments is shown in Figure 5. Agglomerates with a grain size of 0.02–0.2 mm were the dominant form in all soil depths under different treatments, representing a range of 45.86–69.51% in the 0–20 cm soil depth, 62.71–66.77% in the 20–40 cm soil depth, and 61.46–68.95% in the 40–60 cm soil depth. In the 0–20 cm soil layer, the untreated T1 group exhibited the highest proportion of aggregates with a grain size of 0.02–0.2 mm (69.51%), followed by 0.002–0.02 mm (13.54%), and <0.002 mm (10.48%). Conversely, the lowest number of aggregates was observed in the 0.2–2 mm grain size (6.48%). Following the AES treatment only (T2), AES-enhanced maize treatment only (T4) and the AES combined with GA3-enhanced maize treatment (T6), the content of agglomerates in the <0.002 mm and 0.002–0.02 mm grain sizes was significantly increased, with the proportion of agglomerates in the 0.02–0.2 mm grain sizes. In the T2 group of treatments, the proportion of agglomerates in the 0.02–0.2 mm grain size reached 28.56% and 16.62%, respectively. The proportion of agglomerates in the 0.02–0.2 mm grain size was significantly decreased. In both treatments, maize-only (T3) and GA3-enhanced maize-only (T5), where no AES was applied, there was no significant change in the percentage of agglomerates at the <0.002 mm and 0.002–0.02 mm grain sizes and an increase in the percentage of agglomerates at the 0.2–2 mm grain size, with a greater change in T5 than in T3, when compared with the T1 group. The two grain-size agglomerates, <0.002 mm and 0.002–0.02 mm, exhibited a significant increase in the T4 and T6 groups in comparison to the T1 group (p < 0.05). However, no significant difference was observed between the two groups.
As shown in Figure 5, aggregates of 0.02–0.2 mm grain size in the 20–40 cm soil layer still occupied a large proportion, all above 60%, followed by 0.2–2 mm (14.26–17.91%) and 0.002–0.02 mm (11.35–14.23%). The smallest proportion of the soil aggregates was <0.002 mm (5.14–6.80%) and there was no significant difference between the treatment groups. The proportion of soil aggregates of each grain size exhibited a similar pattern in the 40–60 cm soil depth.
The MWD of soil is an important evaluation index of soil stability; the higher the MWD value, the more stable the soil aggregates are. The MWD values of soil at each soil depth under different treatments are shown in Table 3.
In the 0–20 cm soil layer, the T5 and T3 groups exhibited significantly higher MWD values (0.20 mm and 0.17 mm, respectively) than the other treatment groups (p < 0.05). In contrast, the MWD values observed in both the T4 and T6 groups were significantly reduced in comparison to the T1 group (p < 0.05). The results demonstrate that the planting of maize has the effect of increasing the MWD value, thereby improving soil aggregate stability. In contrast, the application of AES has an impact on soil aggregate stability, albeit to a limited extent.
In the soil layer between 20 and 40 centimeters in depth, the greatest MWD was observed in the T5 group, at 0.27 millimeters. This value was significantly higher than that observed in the other treatments, and no significant differences were noted among the latter. The maximum value of MWD was observed in the T6 group at a depth of 40–60 cm, reaching 0.30 mm. With regard to the variation of MWD in the soils of all soil horizons, it was observed that the values of MWD in the deeper soils (20–60 cm) were significantly greater than those of the surface soils (0–20 cm), which exhibited a relatively stable structure.

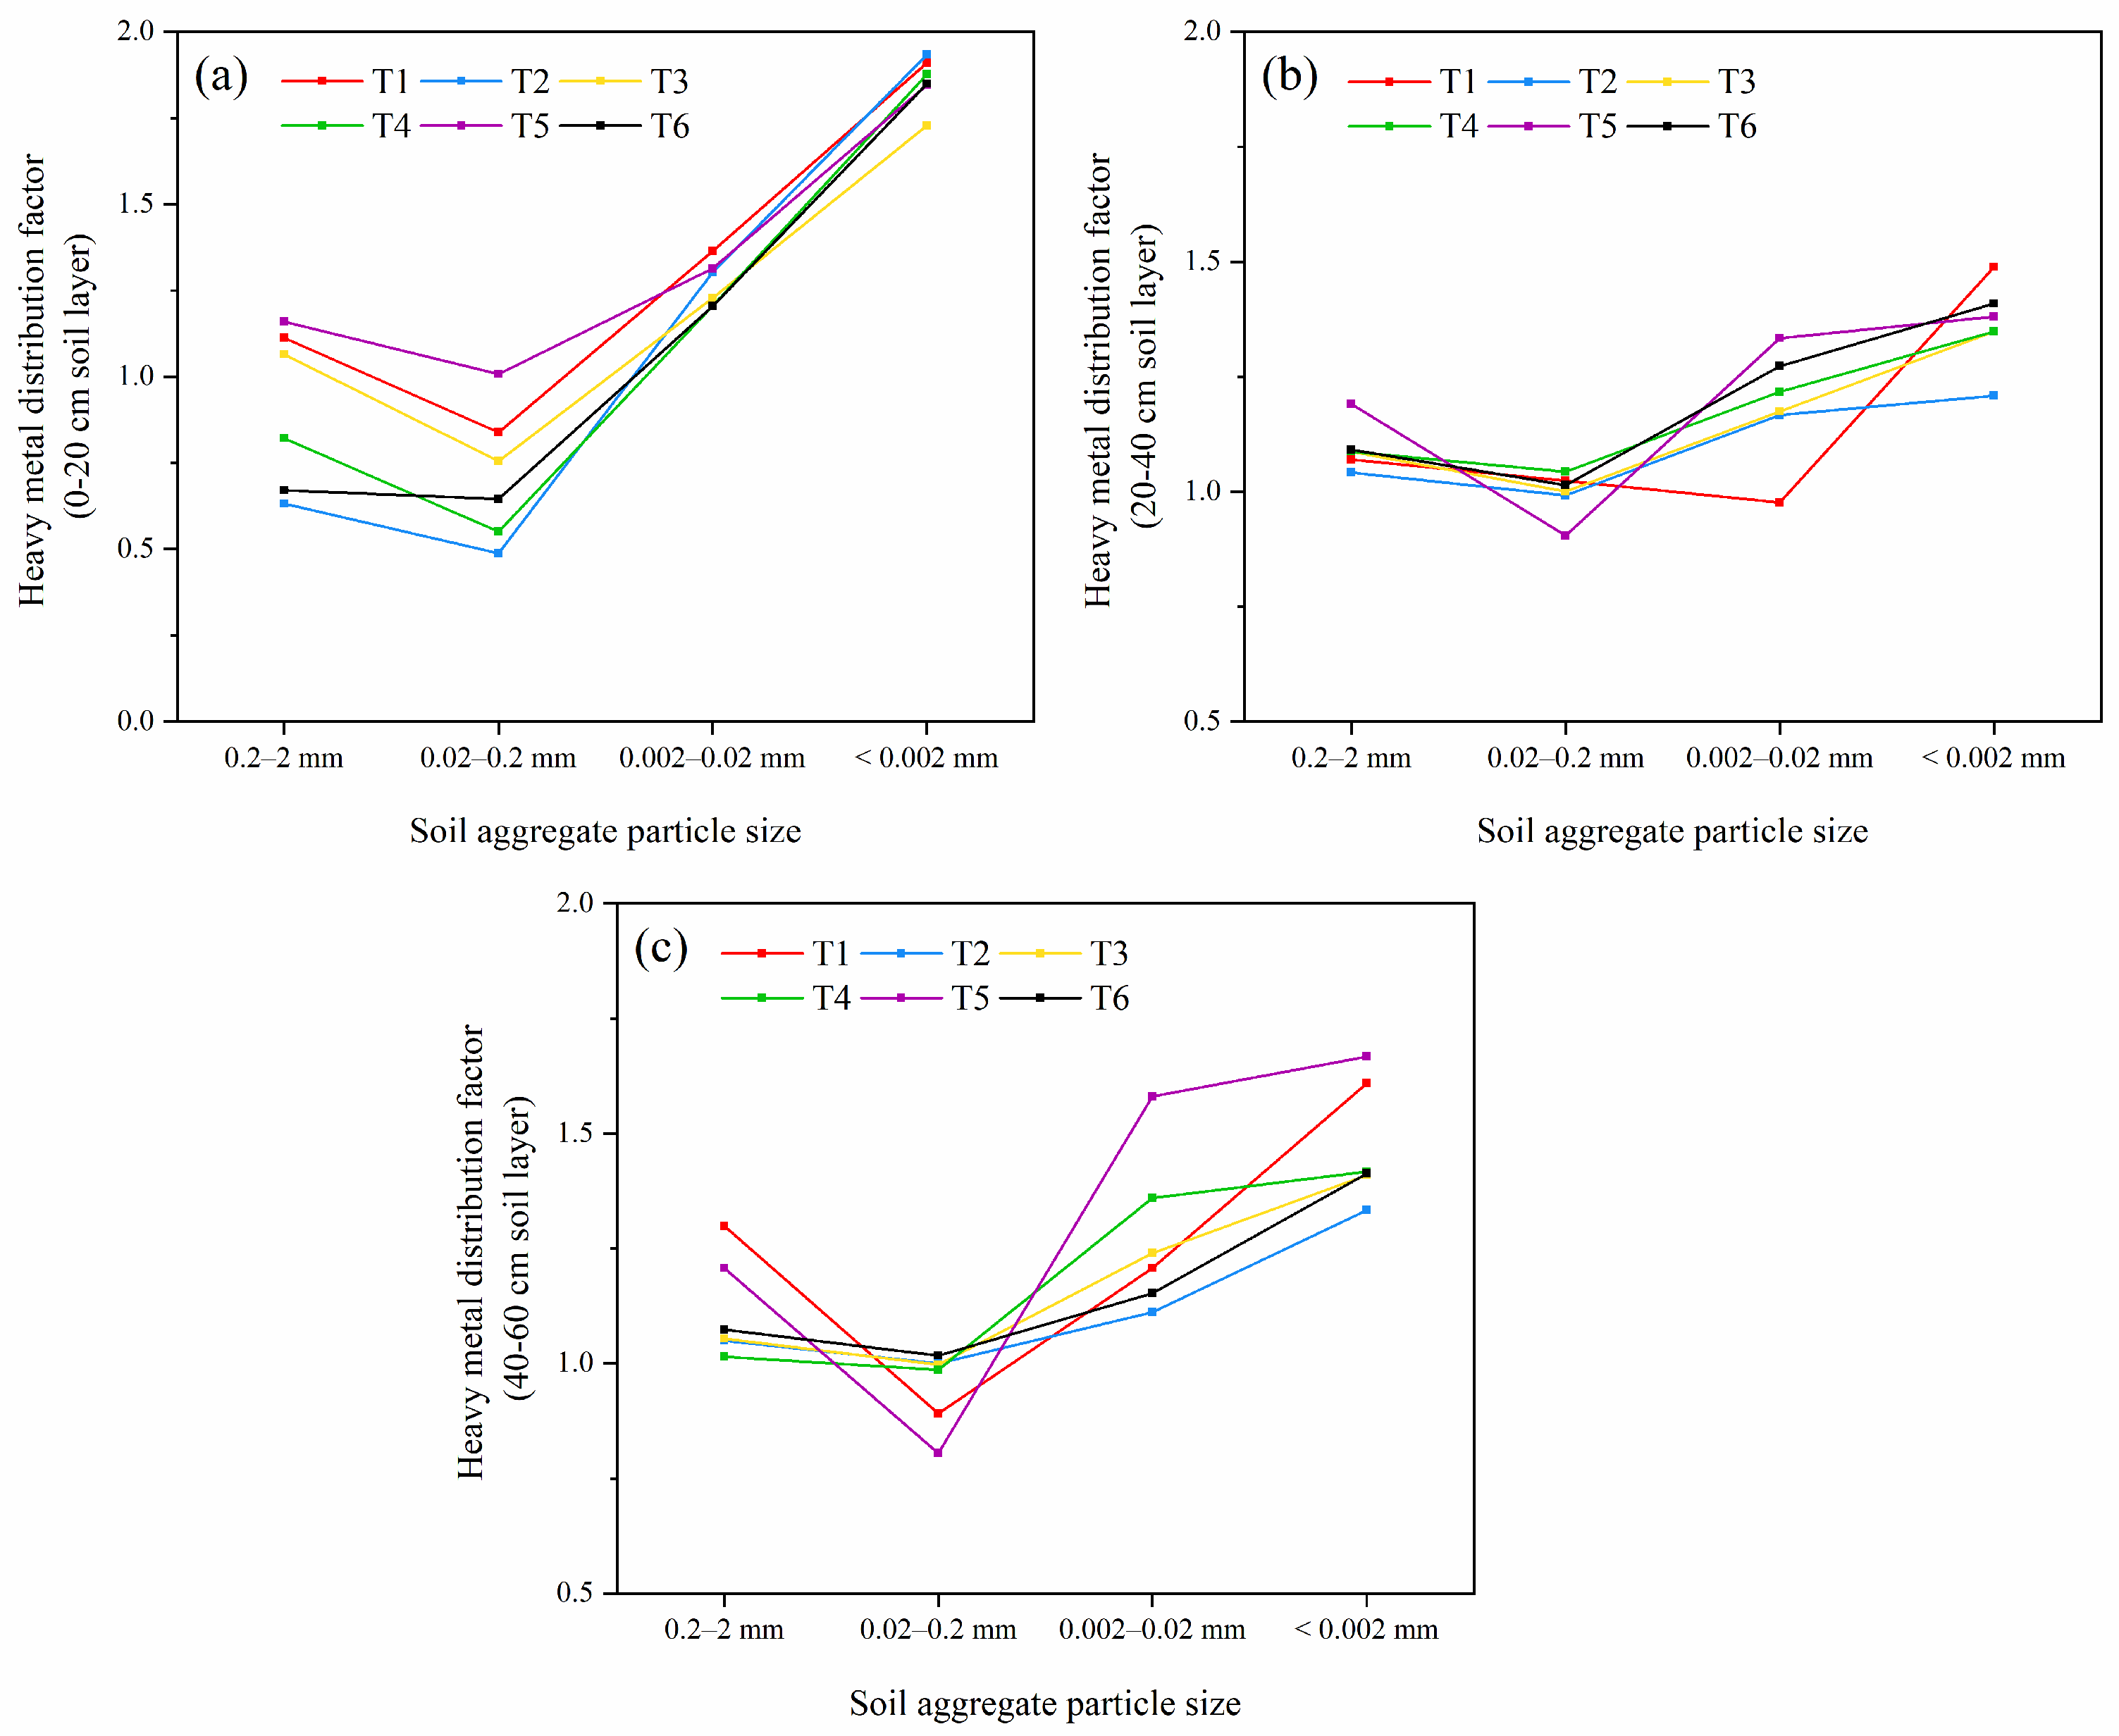
3.2.2. Distribution of Cd in Soil Aggregates of Different Particle Sizes

Table 4 illustrates the distribution of Cd in soil aggregates of varying grain sizes. Across the diverse treatments within each soil layer, the highest Cd concentrations were observed in aggregates with a grain size of <0.002 mm, while the lowest concentrations were noted in aggregates with a grain size of 0.02–0.2 mm. The concentrations in the remaining grain-sized aggregates fell between these two extremes.
The concentration of Cd in the 0–20 cm soil layer was significantly (p < 0.05) lower in grain-sized agglomerates of <0.002 mm in the GA3-fortified maize-only treatment (T5) and the maize-only treatment (T3) compared to the untreated T1 group. It has been demonstrated that the active heavy metals present in small-sized agglomerates are more readily absorbed by plant roots [29]. Consequently, during the phytoremediation of Cd-contaminated soils, plants may selectively extract and accumulate Cd from small-sized aggregates, thereby influencing the Cd concentration in these aggregates.
Furthermore, the concentration of Cd in agglomerates with a grain size of less than 0.002 mm was markedly elevated in three treatments: AES-only (T2), AES-fortified maize-only (T4), and AES combined with GA3-fortified maize (T6). The greatest increase was observed in the T2 group, reaching 13.15%, while the T4 and T6 groups exhibited 6.67% and 3.71% increases, respectively. This phenomenon may be attributed to the application of the chelating agent.
The use of DF enabled the analysis of the enrichment of Cd in agglomerates of varying particle sizes, thus facilitating the identification of the particle size at which Cd is preferentially enriched. A value of DF greater than 1 indicates that heavy metal elements are preferentially enriched in soil aggregates of the corresponding particle size. The distribution factors of Cd in soil aggregates of various particle sizes under different treatments in this study are presented in Figure 6. In the 0–20 cm soil layer, the distribution factors for aggregates of <0.002 mm and 0.002–0.02 mm grain size were greater than 1 for all treatments, with a particularly notable increase observed for the <0.002 mm grain size. Furthermore, the distribution factor of Cd was found to be greatest in the <0.002 mm particle size in the 20–40 cm and 40–60 cm soil depths. In conclusion, Cd was primarily distributed in the <0.002 mm small particle-sized aggregates.

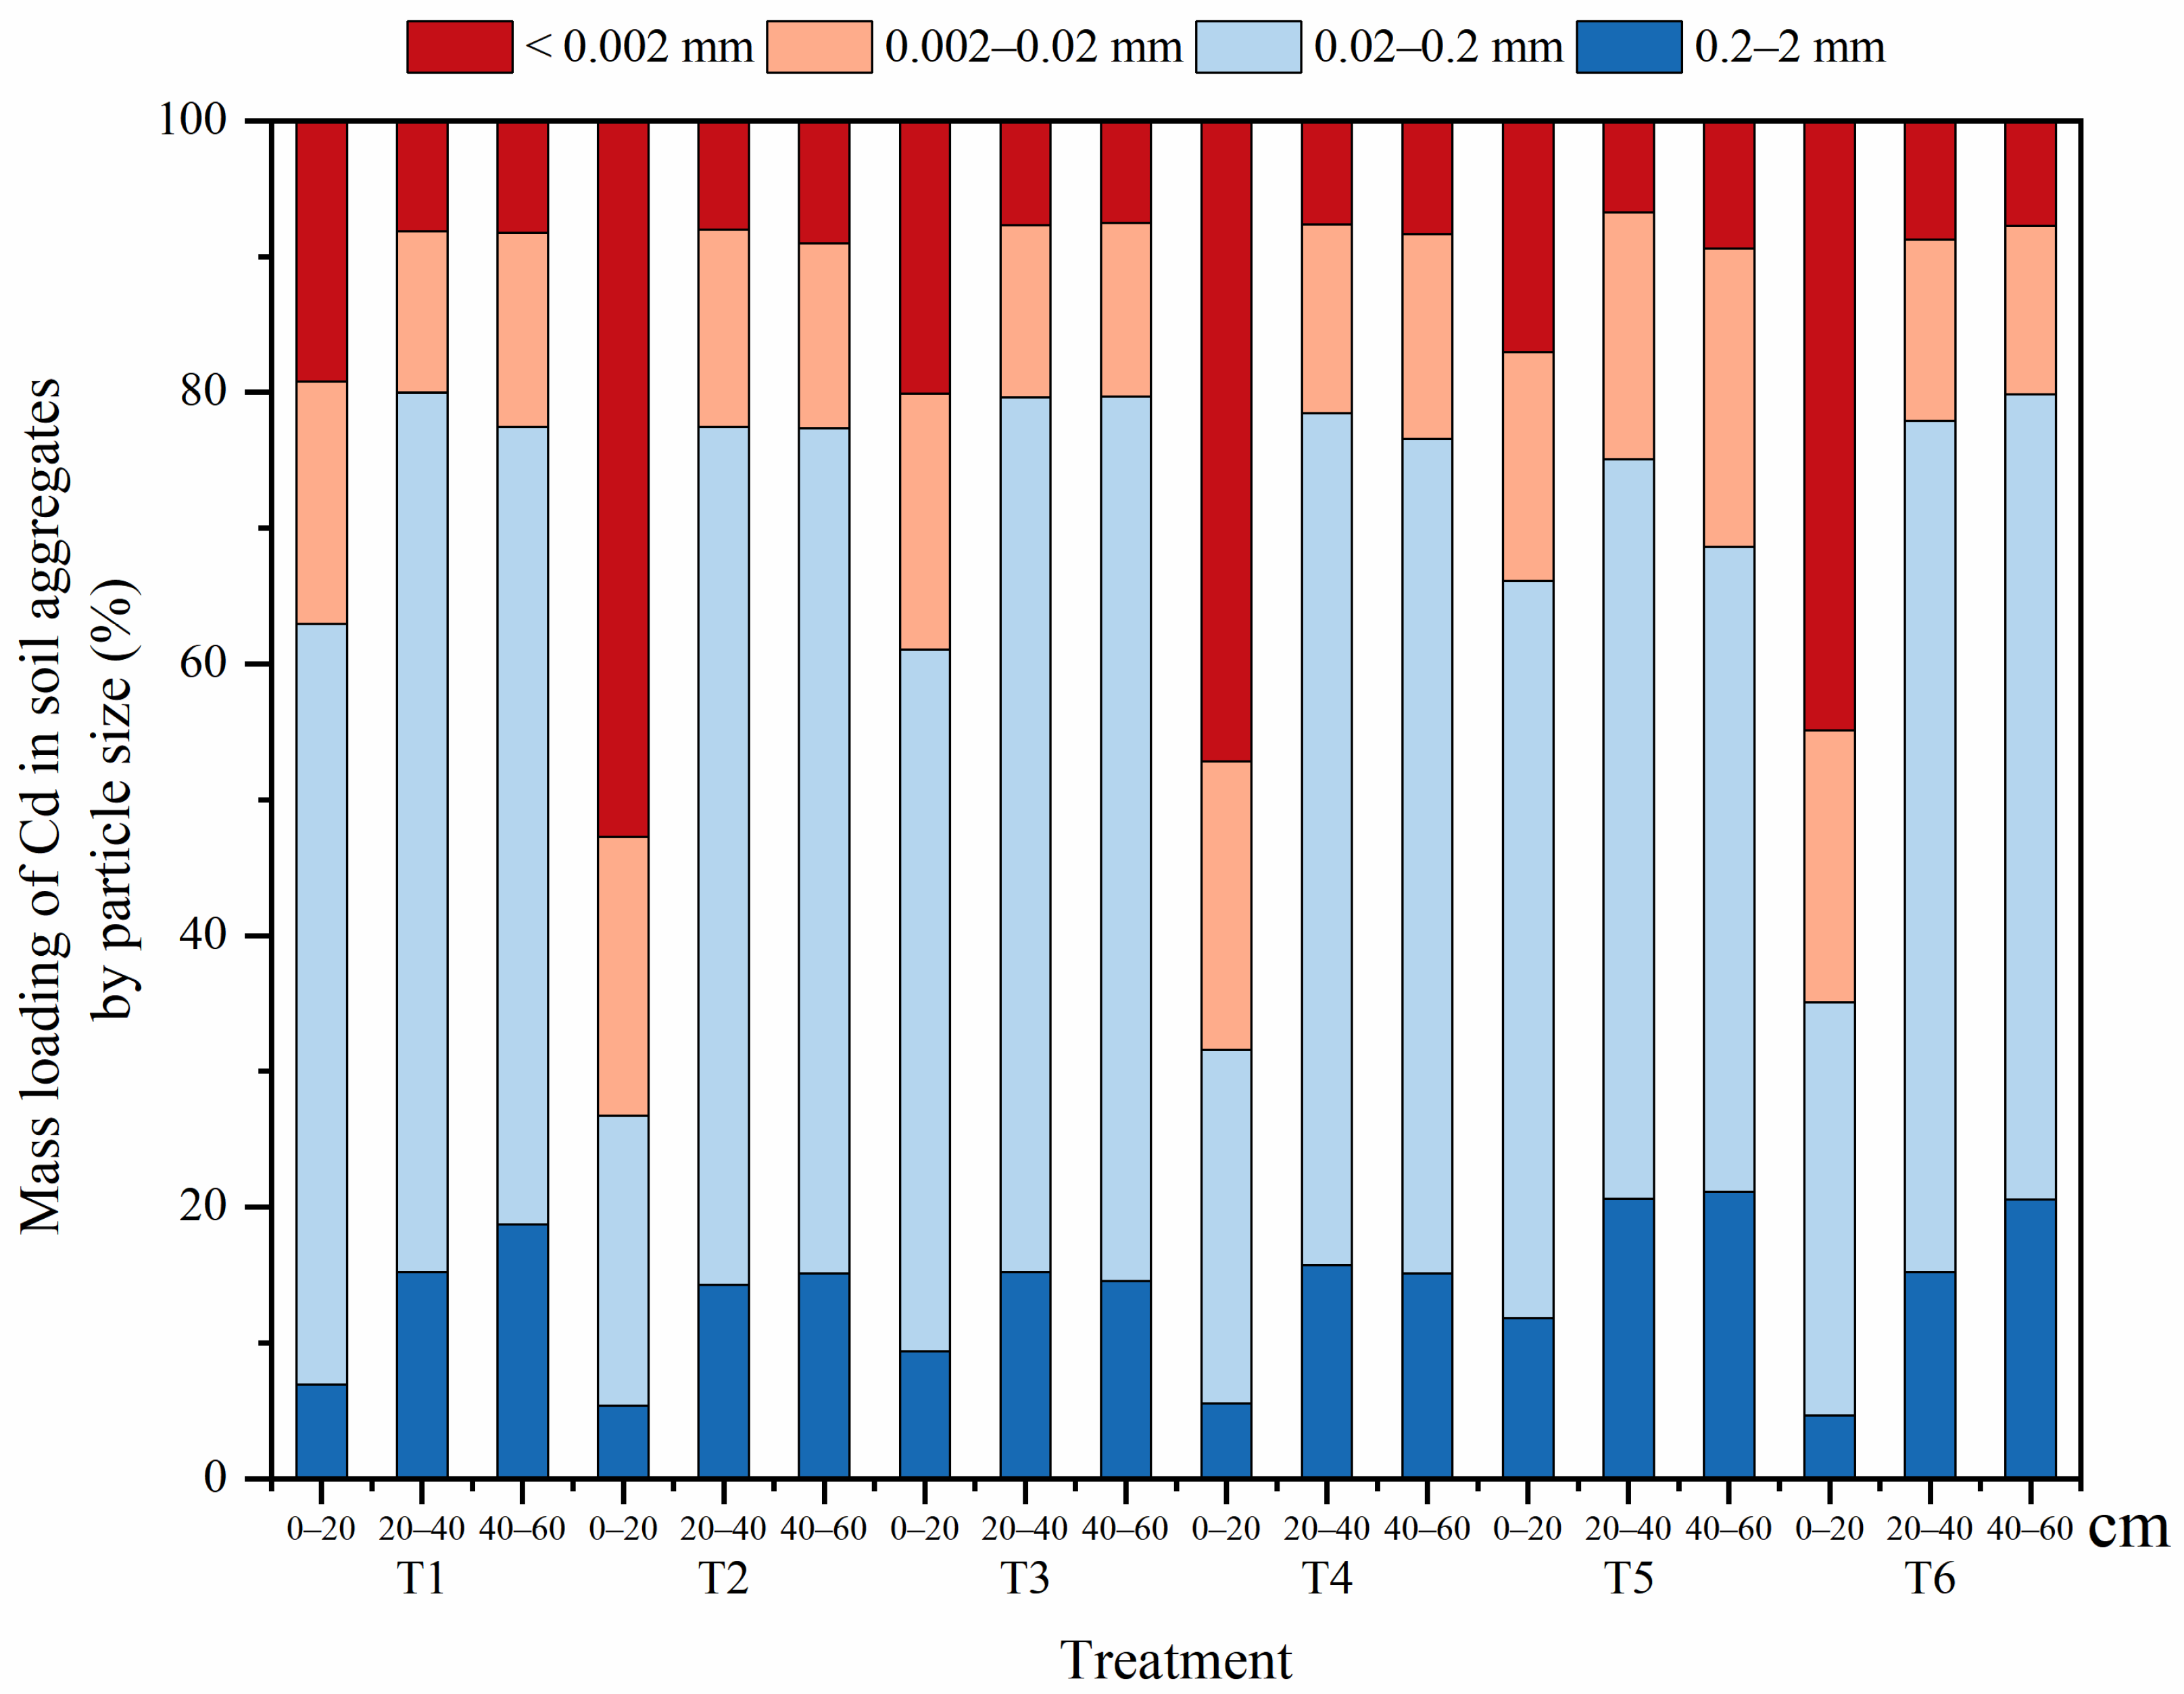
3.2.3. Mass Loading of Cd in Soil Aggregates of Different Grain Sizes

The GSF method was employed to assess the proportion of heavy metals in the overall heavy metal load of the soil samples, thereby facilitating the estimation of the proportion of soil aggregates in each particle size and their Cd concentration, as well as their contribution to the total Cd content in the soil. Figure 7 illustrates the GSF of Cd in soil aggregates of varying grain sizes under distinct treatments.
In the 0–20 cm soil layer, the highest mass loading of 51.63–56.02% was observed in the 0.02–0.2 mm agglomerates under the untreated T1 group, the maize-only planting treatment (T3), and the GA3-fortified maize-only treatment (T5). This was followed by the <0.002 mm and 0.002–0.02 mm grain-sized agglomerates. The lowest mass loading was observed in the 0.2–2 mm agglomerates, with a value of 6.93–11.81%. The maximum mass loading of agglomerates with a grain size of less than 0.002 mm was observed in the AES-only treatment (T2), AES-enhanced maize-only (T4) and AES combined with GA3-enhanced maize (T6), with the highest mass loading reaching 52.76% in the T2 group, 47.20% and 44.91% in the T4 and T6 groups, followed by 0.02–0.2 mm and 0.002–0.02 mm agglomerates. The smallest mass loading was still in the 0.2–2 mm agglomerates with 4.65–5.56%. In the 20–40 cm and 40–60 cm soil layers, no significant difference in the mass loading of Cd was observed among treatments. The trends were largely consistent, with the highest mass loading occurring in the 0.002–0.02 mm particle-sized agglomerates (approximately 60%), followed by the 0.02–0.2 mm particle-sized agglomerates. Conversely, the lowest mass loading was observed in the <0.002 mm particle-sized agglomerates (6.73–9.00%). The lowest mass loading was observed in agglomerates of less than 0.002 mm in size, which accounted for only 6.73–9.00% of the total mass.

3.3. Morphology and Mineral Composition of Surface Soil Aggregates under Different Treatments in the Soil Column Experiment

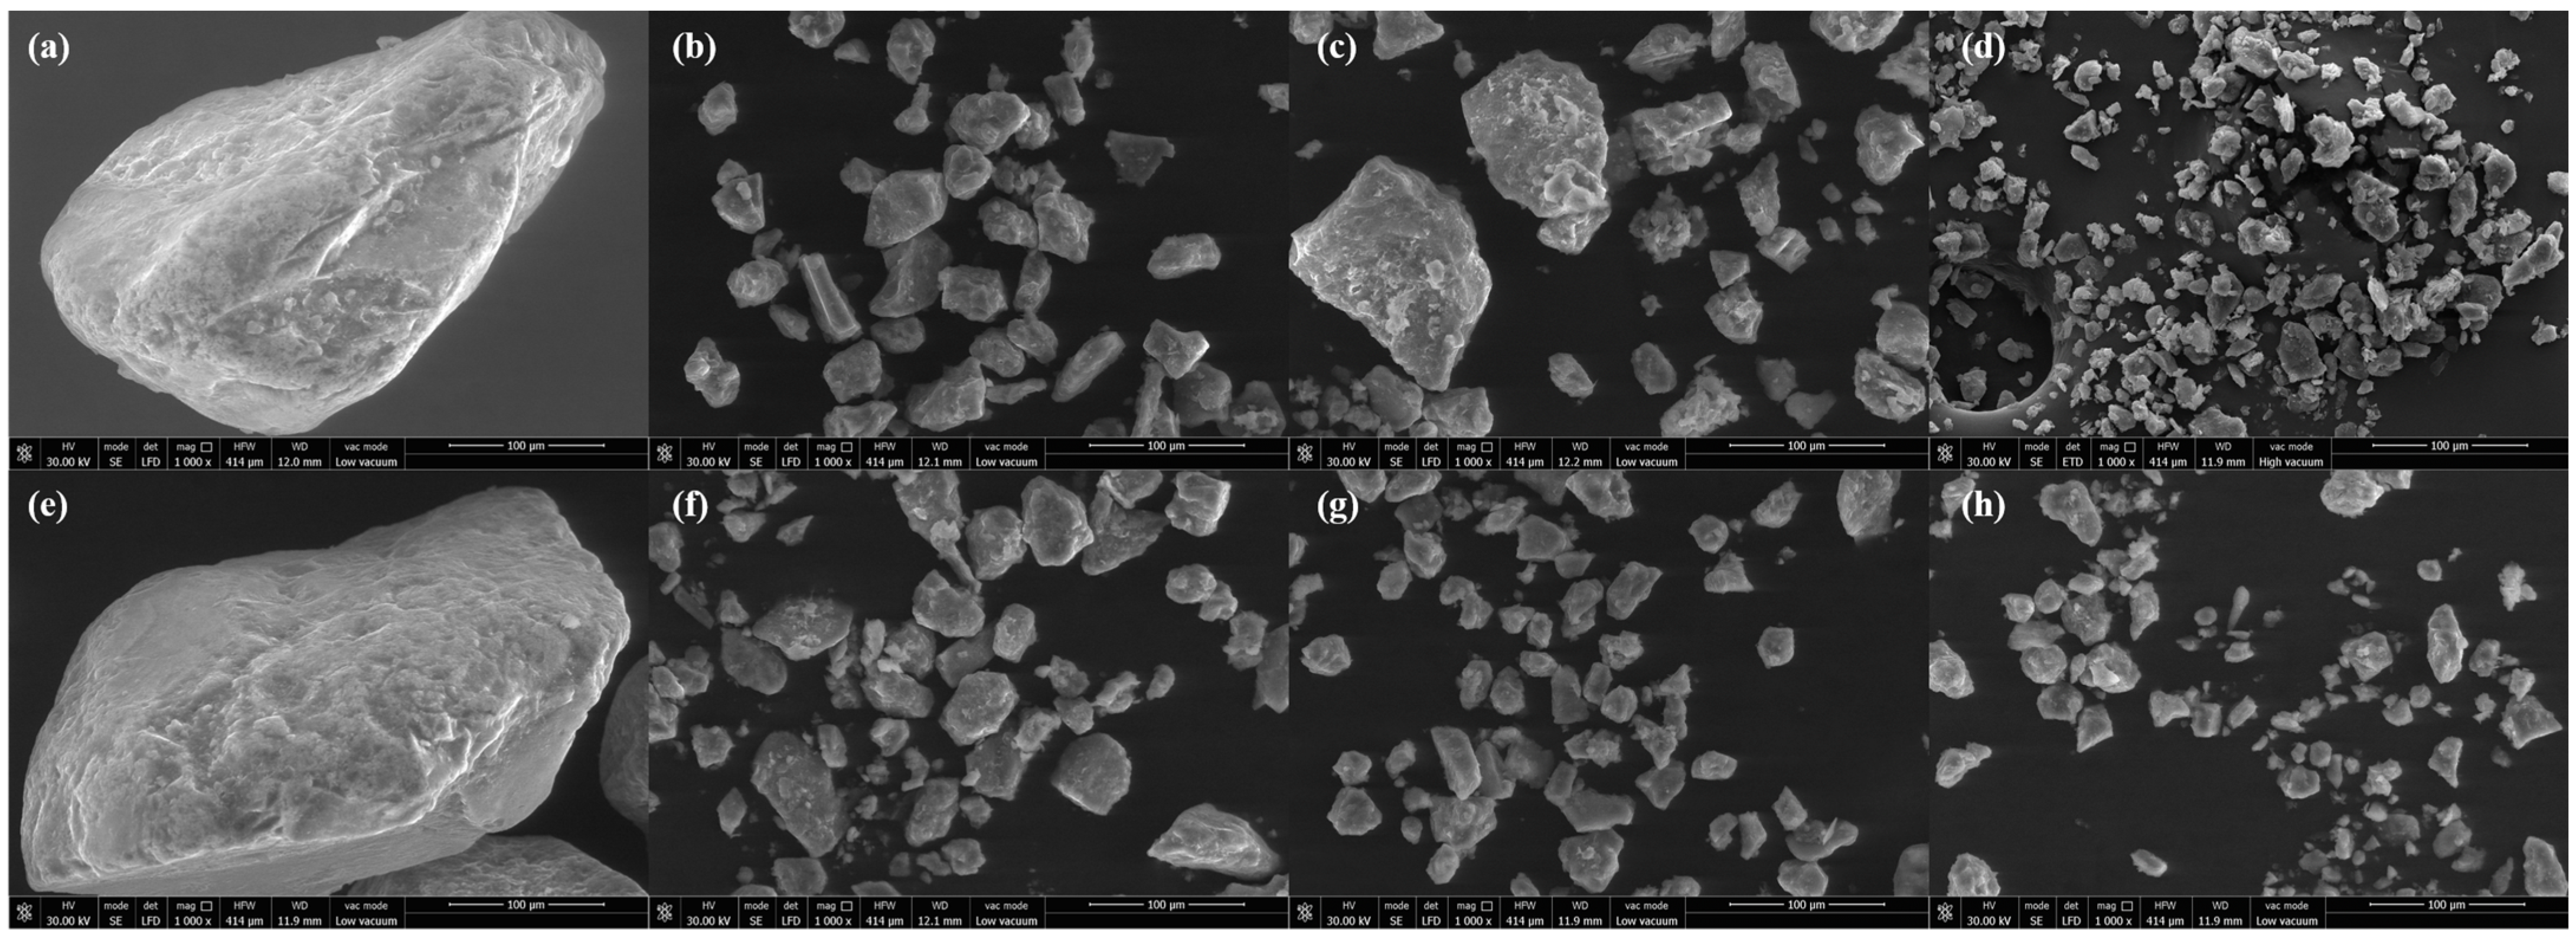
3.3.1. Surface Morphology of Soil Aggregates

The compositional characteristics of aggregates and the distribution of Cd in soil aggregates are analyzed in Section 3.2. In order to gain a deeper understanding of the migration and transformation process of Cd in soil aggregates and the functioning mechanism of this enhanced phytoremediation technology, the morphology and elemental composition of aggregates with different grain sizes in the 0–20 cm soil layer under the treatments of Groups T1 and T6 were further analyzed. The alterations in the surface morphology and structure of the soil prior to and following remediation were examined through the use of scanning electron microscopy (SEM), which allowed for the inference of the binding and adsorption behaviors of heavy metal pollutants with soil colloids [30].
The morphology and structure of soil aggregates with a diameter of 0.2–2 mm in the top 20 cm of soil can be observed in Figure 8. The aggregates were observed under different treatments. In the untreated T1 group (Figure 8a) and the intensive phytoremediation treatment T6 group (Figure 8e), soil aggregates were observed to be irregularly granular, with a relatively smooth and rounded surface, devoid of any obvious angles, and constituted of larger particles. The surface of the agglomerates was observed to be attached to small granular material under both treatments, and the degree of roughness was found to be similar, indicating that the enhanced phytoremediation technique had a minimal impact on the agglomerates of this particle size.
For the 0.02–0.2 mm particle-sized agglomerates and 0.002–0.02 mm particle-sized agglomerates in the T1 group (Figure 8b,c), most of the agglomerates had an irregular structure, and the surface of the agglomerates undulated up and down and were uneven and rough with a large spacing between particles and more particles adhering to the surface. In the T6 group (Figure 8f,g), most of the agglomerates showed a spherical shape, with finer particles, smaller spacings, smoother surfaces and sharper edge angles, which may be related to the chelating agent via drenching.
The morphological and structural characteristics of agglomerates with a particle size of <0.002 mm (Figure 8d) revealed that the majority of agglomerates exhibited irregular shapes and a considerable number of small particles attached to their surface. These particles may have been iron and aluminum oxides adsorbed on the surface of the agglomerates. In group T6 (Figure 8h), the majority of the agglomerates exhibited columnar and spherical shapes, and the surface of the soil particles in group T6 was observed to be smoother in comparison with group T1.

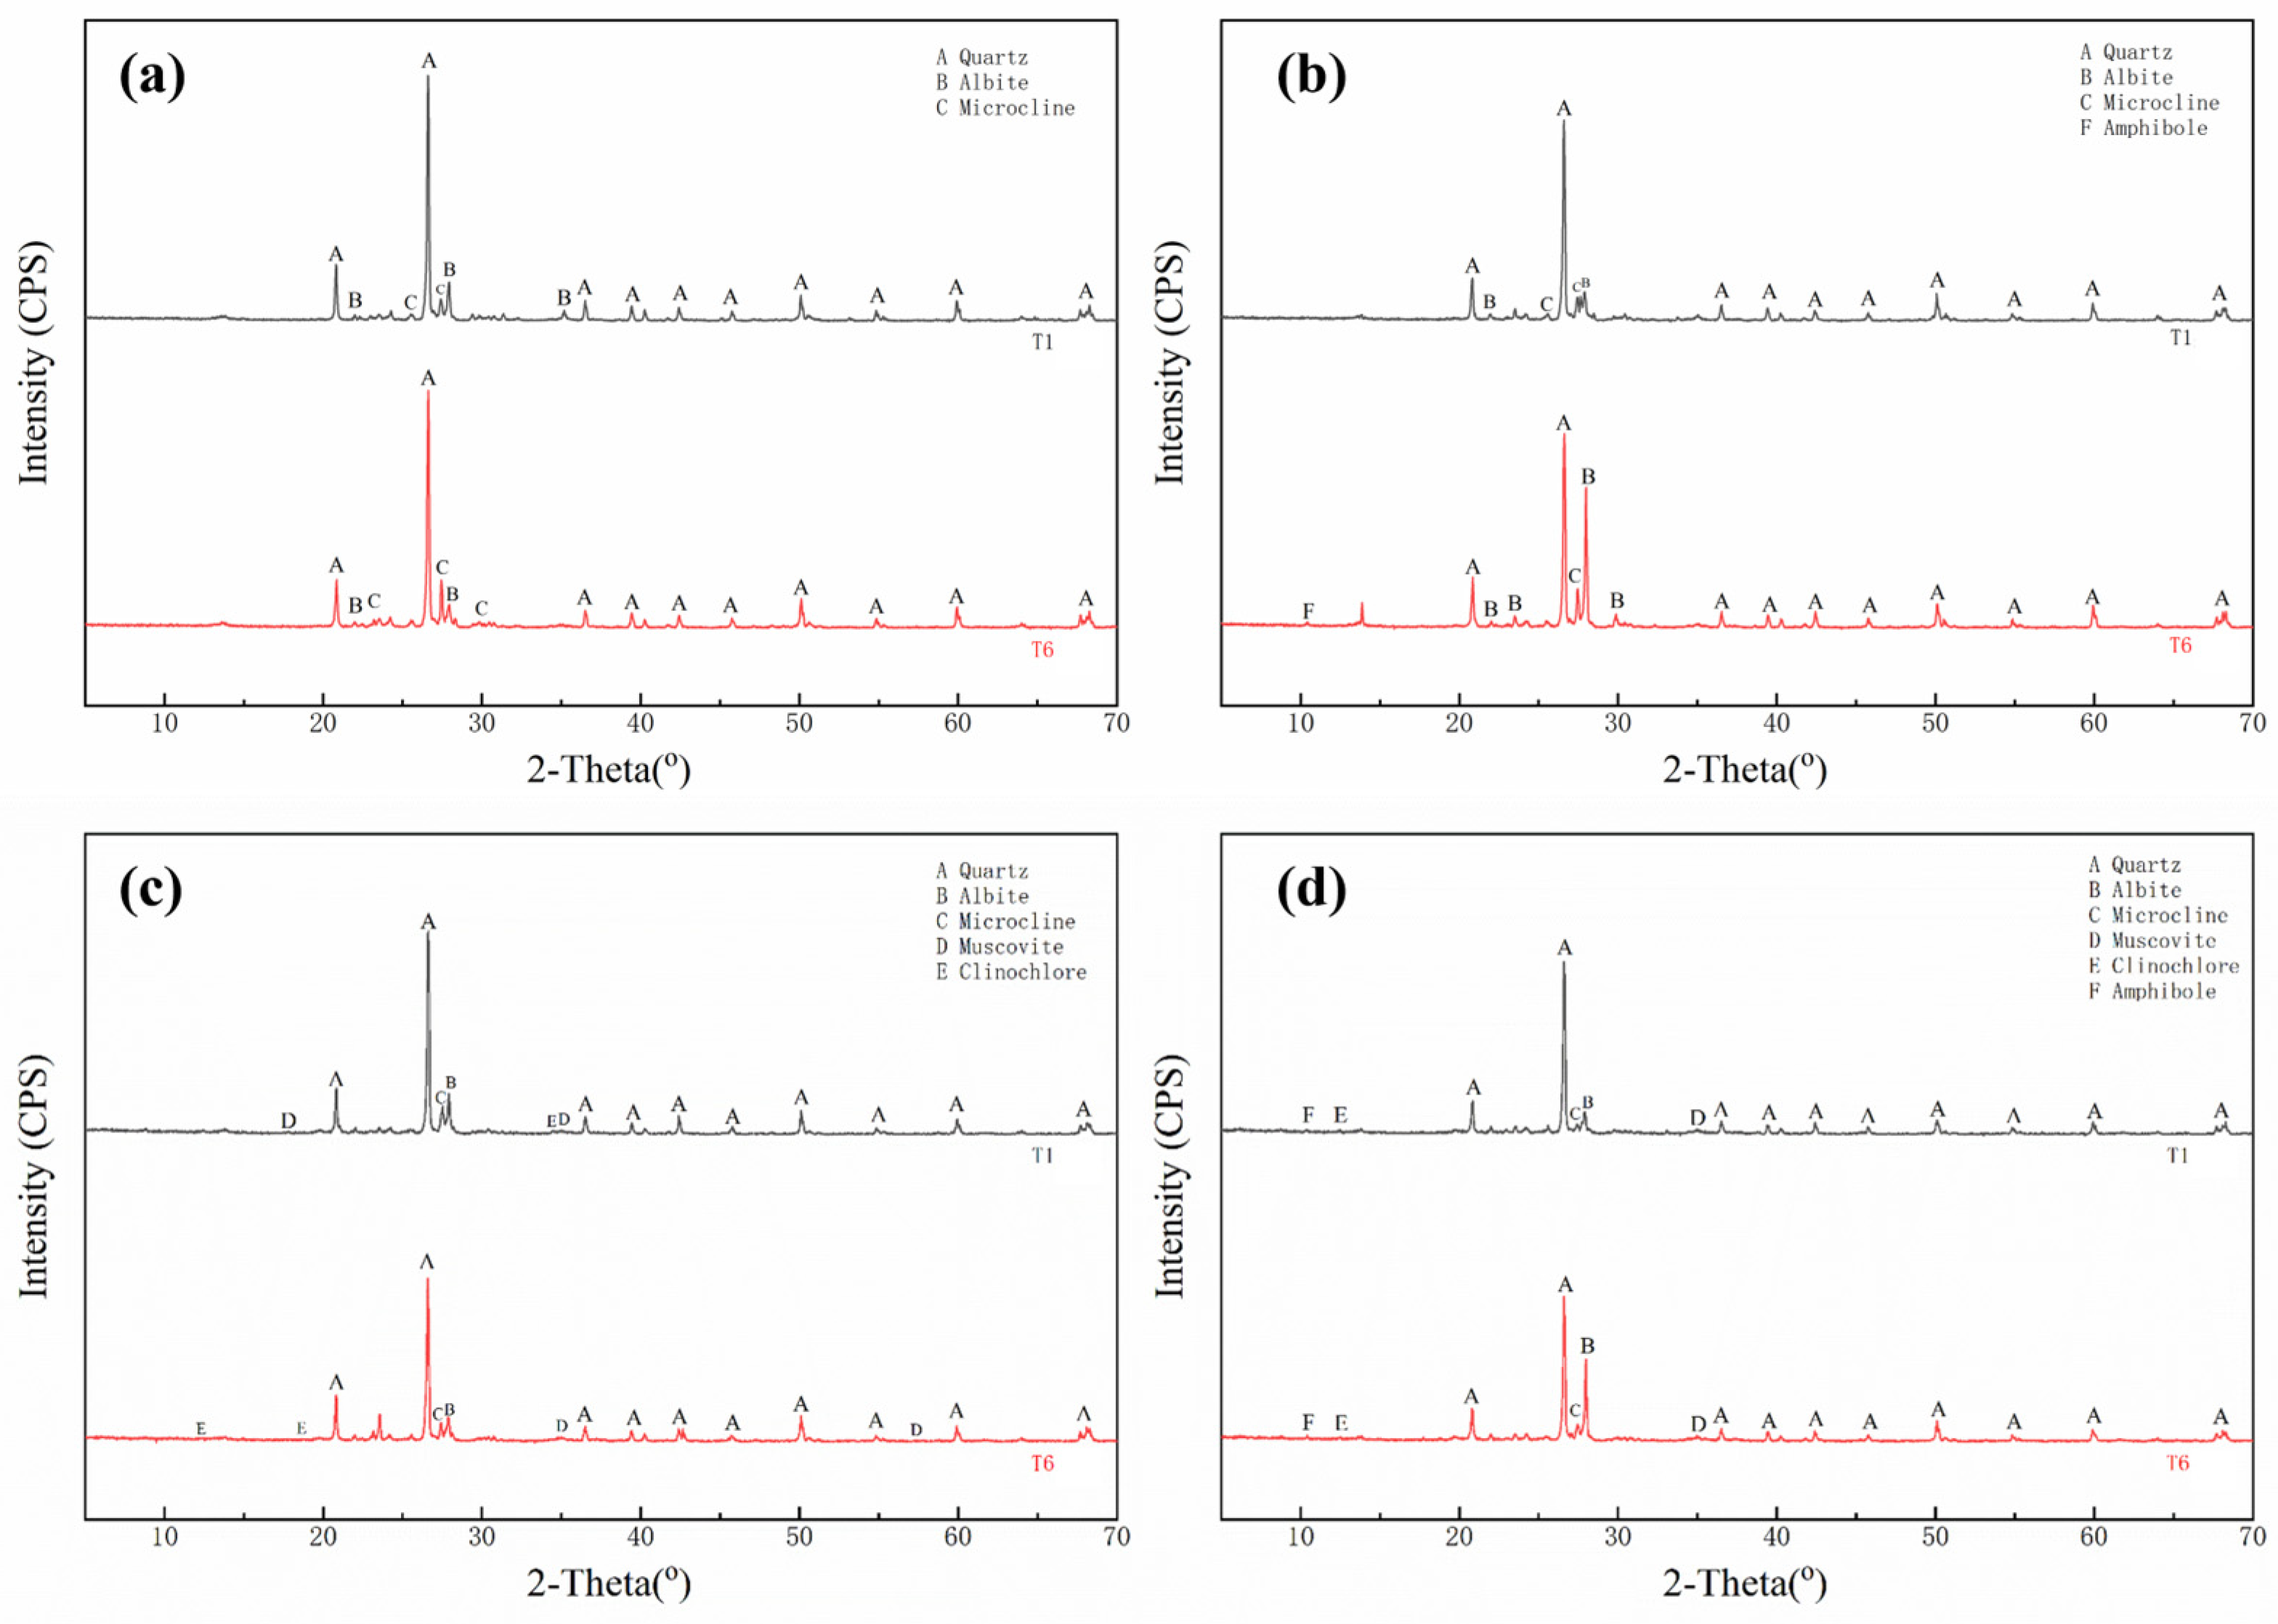
3.3.2. Mineral Composition of Soil Aggregates

X-ray diffraction (XRD) analysis can be employed to ascertain the composition of mineral types present in both pre- and post-remediation samples of heavy metal-contaminated soils [31]. X-ray diffractograms of scanning electron microscopy (SEM) images of particle-sized agglomerates ranging from 0.2 to 2 mm, 0.02 to 0.2 mm, 0.002 to 0.02 mm, and below 0.002 mm were obtained through X-ray diffraction (XRD) tests, as illustrated in Figure 9. The soil minerals corresponding to the peaks observed at different diffraction angles are identified in Figure 9. Each diffraction peak represents a mineral at a specific diffraction angle, thereby enabling the mineral composition of the soil aggregates to be determined. The peak area is the integral value of the peak height and retention time, which can represent the relative content with greater accuracy. In contrast, the peak area ratio can represent the relative percentage content of each substance, expressed in %.
Figure 9a,b illustrate that the soil mineral composition of the 0.02–0.2 mm-sized aggregates in the T1 group is essentially identical to that of the 0.2–2 mm-sized aggregates. The soil mineral composition is predominantly quartz (SiO2), followed by plagioclase ((Na,Ca)Al(Si,Al)3O8) and microplagioclase (K(AlSi3)O8). Additionally, the proportion of minerals in the two sizes exhibits considerable variation. The proportion of minerals between the two grain sizes is also not significantly disparate. In the T6 group of 0.02–0.2 mm grain-sized aggregates, the proportion of quartz and plagioclase feldspar is essentially identical to that observed in the T1 group. Additionally, a novel soil mineral, amphibole (Al3.2Ca3.4Fe4.02K0.6Mg6NaSi12.8O44(OH)4), emerged in the treatment, exhibiting a concentration of 4%. The diffraction peak intensities of the physical phases indicated that quartz was also affected to some extent, exhibiting reduced crystallinity.
Figure 9c illustrates the X-ray diffractograms of agglomerates with grain sizes ranging from 0.002 to 0.02 mm. The soil mineral composition of 0.002–0.02 mm grain-sized aggregates in Groups T1 and T6 includes two additional minerals, mica (KAl2(Si3Al)O10(OH)2) and chlorite ((Mg,Al,Fe)8(Si,Al)4O10(OH)8), in addition to quartz, plagioclase, and microplagioclase. From the proportion of each soil mineral, it was concluded that there was a significant decrease in the quartz content of the larger grain-sized soil aggregates in the T1 and T6 groups. The diffraction peaks of the physical phase for the three soil minerals (quartz, plagioclase and microplagioclase) in the T6 group were observed to be affected in varying degrees, with a notable decrease in intensity. Conversely, the diffraction peaks of the other minerals exhibited no significant changes in intensity.
From the diffraction pattern, it can be observed that the variation rules of diffraction peaks of different particle-sized aggregates in the same treatment are approximately the same, indicating that the soil minerals composing each particle-sized aggregate are essentially the same. A comparison of the standard cards of physical-phase XRD indicated that the primary soil minerals were quartz, plagioclase feldspar, and microplagioclase feldspar. The diversity of soil minerals present within the aggregates increased in proportion to the reduction in particle size. Furthermore, the soil minerals within aggregates with a particle size of less than 0.002 mm also included mica, chlorite, and amphibole. A decrease in the particle size of the soil aggregates was observed to be accompanied by a corresponding decrease in the intensities of the diffraction peaks. A quantitative analysis of the mineral content in soil aggregates of varying particle sizes revealed that quartz constitutes the predominant mineral in aggregates of all sizes, with a particularly high proportion (70%) observed in large aggregates. As the size of the agglomerate decreases, quartz remains the most abundant mineral due to the increase in the proportion of small-sized agglomerates. The composition of other soil minerals remains relatively constant, exhibiting no discernible pattern of change.

4. Discussion

4.1. Remediation Techniques Change the Distribution of Cd in Soil Aggregates

It is widely acknowledged that fine particles serve as the primary vectors for the transport of soil heavy metals [32,33]. Furthermore, the distribution of heavy metals in soil aggregates is observed to increase with decreasing aggregate size. This phenomenon may be attributed to the fact that small-sized soil aggregates possess a larger surface area and contain a higher content of clay minerals and organic matter [34,35]. The large adsorption force enables heavy metals to adhere to the surface of small particle-size agglomerates [36,37]. The results of the mass loading of Cd in soil aggregates demonstrated that in the 0–20 cm surface soil, in the maize-only treatment (T3) and in the GA3-fortified maize-only treatment (T5), which were not subjected to AES, the preferentially Cd-enriched small-sized aggregates continued to cement to form large-sized aggregates, thus resulting in a high proportion of large-sized aggregates under this treatment. In the treatments where AES was applied (T2, T4 and T6), the mass load of Cd in the small-sized soil aggregates was found to be greater under the AES treatment. The chelator would break down the cementing material and the bonding of organic matter in the large-sized aggregates, causing the large-sized aggregates to decompose into small-sized aggregates. Furthermore, the chelator could activate the Cd in the soil [38,39]. However, in the deeper soil layer (20–60 cm), there was less variation in the distribution and mass loading of Cd among the treatments. This is likely due to the biodegradable chelator AES used in the intensive phytoremediation. The half-life of AES is relatively short due to its biodegradable nature, and it caused fewer disturbances to the deeper, uncontaminated soil under the experimental conditions.

4.2. Effects of Remediation Techniques on Changes in Soil Aggregate Stability

In the remediation of Cd-contaminated agricultural land, it is essential to achieve not only the removal of pollutants but also to ensure that the original structure and stability of the soil are maintained. This is necessary to ensure the safety of Cd-contaminated agricultural land and the sustainable use of land resources. The stability of soil aggregates affects the structure, permeability, and growth of plants, thereby modifying the functions and properties of the soil [40,41]. An increase in the proportion of large-sized aggregates in the soil is associated with higher soil MWD values, which indicate that the soil aggregate structure is more stable and less affected.
The results of this study indicate that the phytoremediation treatment (T3) has the effect of increasing the mass percentage of large particle-sized aggregates in the surface soil. Furthermore, the MWD values for this treatment were found to be significantly higher than those for the other treatments, which suggests that phytoremediation has the beneficial effect of improving the stability of soil aggregates and maintaining a good soil structure. In examining the soil aggregates following the establishment of commercial crops, some researchers have observed an increase in the proportion of large aggregates while the proportion of small-sized aggregates has decreased. This suggests that the planting of commercial crops has altered the distribution of soil aggregates with different grain sizes [42,43]. The formation of these aggregates has been attributed to the introduction of organic matter, including humus, plant root secretions, and microbial action [44]. Accordingly, soil organic matter and clay particles are pivotal elements in the formation of soil aggregates.
The three treatments, AES-only (T2), AES-enhanced maize-only (T4) and AES combined with GA3-enhanced maize (T6), had a significant impact on the composition of aggregates in the surface soil. This was evidenced by a significant increase in the proportion of small grain-sized soil aggregates, a decrease in the MWD value, and a decrease in the stability of soil aggregates. The presence of heavy metal elements was found to have a significant grain-level effect, with concentrations increasing with decreasing soil grain sizes and accumulating more in smaller than in coarser grains [45,46,47]. It has been demonstrated that there is a positive correlation between the percentage of aggregates measuring less than 0.002 mm in size and the degree of soil contamination caused by the presence of heavy metals. This leads to a reduction in the cementation of small-sized aggregates [48]. However, the changes observed in the deep soil and the surface soil were not identical. Furthermore, the composition of soil aggregates in the other treatments did not exhibit a notable difference compared to the untreated T1 group, which may indicate that intensive phytoremediation has a relatively limited impact on the deep soil (20–60 cm) and that the soil structure is more robust. In conclusion, it can be stated that intensive phytoremediation technology has a more favorable impact on the soil environment.

4.3. Structural Changes in Soil Aggregates and Remediation Mechanisms of Cd

In comparison to the larger aggregates, the untreated T1 group exhibited clear evidence of small-sized aggregates (less than 0.002 mm) with surface attachments in the SEM images. This observation can be attributed to the presence of higher concentrations of iron and aluminum oxides on the surfaces of these aggregates. This phenomenon can be explained by the adsorption of iron oxides and other substances present in the soil onto the surfaces of the small-sized aggregates, leading to the formation of an oxide colloidal film. Consequently, the surfaces of the small-sized aggregates exhibited a higher content of iron and aluminum oxides. In the AES combined with GA3-enhanced maize treatment (T6), a significant decrease was observed in the content of Si, Al, Fe, and other constituent elements. Furthermore, the SEM characterization revealed that the surface of small-sized aggregates became smoother and flatter, indicating that the drenching effect of the chelating agent could remove Fe–Al oxides on the surface of aggregates, which in turn affected the surface morphology of aggregates. The adsorption and desorption of heavy metals by iron and aluminum oxides represent significant factors influencing the effectiveness and transport transformation of heavy metals in soil [49,50]. A biodegradable chelating agent can release Cd ions by dissolving the oxides of Si, Al, Fe, etc., which are strongly bound to Cd. This process weakens the adsorption of Cd by iron and aluminum oxides, increasing the likelihood of Cd being adsorbed on small-sized agglomerates. This, in turn, facilitates the uptake and enrichment of the plant root system.
The primary mineral types found in soil are predominantly silicates and silica-aluminates, with quartz, feldspar, mica, pyroxene, hornblende, and olivine minerals being particularly prevalent. The stability of these minerals is dependent on the quantity and type of primary minerals present in the soil [51,52]. Quartz has strong resistance to weathering and is an extremely stable mineral [53]. The percentage of quartz content was the highest in all particle-sized aggregates in this study. Furthermore, an increase in soil mineral species in small particle-sized aggregates (less than 0.002 mm) was observed in both the intensive phytoremediation treatment (T6) and the control treatment (T1). This suggests that the intensive phytoremediation technique employed in this study had a lesser impact on the mineral structure, while the mineral composition of aggregates affected the distribution of Cd. Combined with the analysis of soil aggregate composition in Section 3.2, the percentage of aggregates with a particle size of less than 0.002 mm in group T6 was significantly higher than in group T1. This was due to an increase in the number of minerals present in the aggregates, which resulted in more adsorption sites for heavy metals. This improved the distribution of Cd in small particle-sized aggregates and increased mass loading. This provided further evidence that Cd was mainly distributed in the small particle-sized aggregates from another point of view. It also demonstrated that in phytoremediation, heavy metals in small-sized aggregates are more easily absorbed by plant roots [28]. Furthermore, during the intensive phytoremediation process, although alterations in the surface morphology of the aggregates influenced the surface elemental composition of the aggregates, particularly in the 0.002 mm particle-sized aggregates, a distinct soil morphology could still be discerned in the electron microscope images. X-ray diffraction (XRD) analyses demonstrated that the peak positions of the primary characteristic peaks of the soil aggregates across all particle sizes remained essentially upshifted, and the soil mineral components exhibited no discernible alterations. It can therefore be concluded that the concentration of the chelating agent used in the intensive phytoremediation treatment was appropriate, and that the degradable nature of the agent played an important role in preventing damage to the soil mineral crystals. In conclusion, intensive phytoremediation represents a safe and viable remediation technique.
In addition, the soil used in our soil column experiments was artificially filled. In order to minimize the effects of this, the weight of the soil at different depths was weighed according to the density of the natural soil and filled to the corresponding depths of the soil columns. After a period of time, we then performed experimental treatments in the soil column device. The relevant treatments may have certain limitations. In the follow-up study, we will consider carrying out a field experiment to further verify the remediation effect of this study and the impact on soil aggregates, in order to promote the practical application and demonstration of enhanced phytoremediation technology for Cd-contaminated agricultural land.

5. Conclusions

This study aimed to analyze the distribution of Cd in soil aggregates by examining the characteristics and stability of soil aggregates in different soil layers using a soil column device. This was conducted to investigate the effects of intensive phytoremediation on the soil structure and the mechanism of this remediation technology, as well as to provide scientific data support for the remediation of soil pollution in agricultural land. The findings of the study indicate that: (1) Intensive phytoremediation was found to significantly increase the proportion of small-sized aggregates (less than 0.002 mm) in the surface layer (0–20 cm). Furthermore, the Cd was observed to be mainly distributed in these small-sized aggregates. In contrast, no significant difference was noted between the treatment groups in the deeper soil layer (20–60 cm). The stability of the surface soil aggregates exhibited a slight decline, while no notable alteration was observed in the deeper soil layers; (2) An increase in soil mineral composition in small-sized aggregates was observed under both intensive phytoremediation and no treatment. This resulted in the formation of additional Cd adsorption sites on the surface of aggregates, thereby enhancing the distribution of Cd in small-sized aggregates. This, in turn, facilitated the uptake and enrichment of Cd by plant roots; and (3) The surface morphology of the aggregates exhibited slight alterations following remediation, yet a distinct soil morphology was discernible in the electron microscope image, indicating that no damage was incurred to the soil mineral crystals. In conclusion, the enhanced phytoremediation technology has a negligible impact on the morphology and mineral composition of soil aggregates. Furthermore, it can facilitate the safe utilization of Cd-contaminated agricultural land following remediation.

Author Contributions

Conceptualization, Q.Y. and Z.Z.; methodology, Q.Y. and Z.Z.; software, Q.Y.; investigation, Z.Z.; resources, Z.Z.; writing—original draft preparation, Q.Y. and H.Y.; writing—review and editing, Q.Y. and H.Y.; visualization, Z.Z.; funding acquisition, Z.J. All authors have read and agreed to the published version of the manuscript.

Funding

This study was supported by The Third Xinjiang Scientific Expedition Program (2021xjkk0202), National Key Research and Development Program of China (2018YFD0800701) and Research Project on Soil Reconstruction Technology and Vegetation Rapid Construction Technology of Zahanaoer Coal Company (360010FW0420240045).

Data Availability Statement

All relevant datasets in this study are described in the manuscript.

Conflicts of Interest

The authors declare no conflicts of interest.

References

  1. Wang, G.; Zhang, S.; Zhong, Q.; Xu, X.; Li, T.; Jia, Y.; Zhang, Y.; Peijnenburg, W.J.G.M.; Vijver, M.G. Effect of soil washing with biodegradable chelators on the toxicity of residual metals and soil biological properties. Sci. Total Environ. 2018, 625, 1021–1029. [Google Scholar] [CrossRef] [PubMed]
  2. Huang, X.; Li, X.; Zheng, L.; Zhang, Y.; Sun, L.; Feng, Y.; Du, J.; Lu, X.; Wang, G. Comprehensive assessment of health and ecological risk of cadmium in agricultural soils across China: A tiered framework. J. Hazard. Mater. 2024, 465, 133111. [Google Scholar] [CrossRef] [PubMed]
  3. An, T.; Wu, Y.; Xu, B.; Zhang, S.; Deng, X.; Zhang, Y.; Siddique, K.H.; Chen, Y. Nitrogen supply improved plant growth and Cd translocation in maize at the silking and physiological maturity under moderate Cd stress. Ecotoxicol. Environ. Saf. 2022, 230, 113137. [Google Scholar] [CrossRef] [PubMed]
  4. Yang, Q.; Yang, C.; Yu, H.; Zhao, Z.; Bai, Z. The addition of degradable chelating agents enhances maize phytoremediation efficiency in Cd-contaminated soils. Chemosphere 2020, 269, 129373. [Google Scholar] [CrossRef]
  5. Yang, Q.; Yu, H.; Yang, C.; Zhao, Z.; Ju, Z.; Wang, J.; Bai, Z. Enhanced phytoremediation of cadmium contaminated soil using chelating agents and plant growth regulators: Effect and mechanism. R. Soc. Open Sci. 2024, 11, 240672. [Google Scholar] [CrossRef]
  6. Sarwar, N.; Imran, M.; Shaheen, M.; Ishaque, W.; Kamran, M.; Matloob, A.; Rehim, A.; Hussain, S. Phytoremediation strategies for soils contaminated with heavy metals: Modifications and future perspectives. Chemosphere 2017, 171, 710–721. [Google Scholar] [CrossRef]
  7. Mojiri, A. The Potential of Corn (Zea mays) for Phytoremediation of Soil Contaminated with Cadmium and Lead. J. Biol. Environ. Sci. 2011, 5, 17–22. [Google Scholar]
  8. Kosnar, Z.; Mercl, F.; Tlustos, P. Ability of natural attenuation and phytoremediation using maize (Zea mays L.) to decrease soil contents of polycyclic aromatic hydrocarbons (PAHs) derived from biomass fly ash in comparison with PAHs-spiked soil. Ecotoxicol. Environ. Saf. 2018, 153, 16–22. [Google Scholar] [CrossRef]
  9. Lu, Y.; Luo, D.; Lai, A.; Liu, G.; Liu, L.; Long, J.; Zhang, H.; Chen, Y. Leaching characteristics of EDTA-enhanced phytoextraction of Cd and Pb by Zea mays L. in different particle-size fractions of soil aggregates exposed to artificial rain. Environ. Sci. Pollut. Res. 2017, 24, 1845–1853. [Google Scholar] [CrossRef]
  10. Wang, Y.; Xu, Y.; Liang, X.; Sun, Y.; Huang, Q.; Qin, X.; Zhao, L. Effects of mercapto-palygorskite on Cd distribution in soil aggregates and Cd accumulation by wheat in Cd contaminated alkaline soil. Chemosphere 2021, 271, 129590. [Google Scholar] [CrossRef]
  11. Zhao, Z.; Mao, Y.; Gao, S.; Lu, C.; Pan, C.; Li, X. Organic carbon accumulation and aggregate formation in soils under organic and inorganic fertilizer management practices in a rice-wheat cropping system. Sci. Rep. 2023, 13, 3665. [Google Scholar] [CrossRef] [PubMed]
  12. Zhou, H.; Peng, X.; Perfect, E.; Xiao, T.; Peng, G. Effects of organic and inorganic fertilization on soil aggregation in an Ultisol as characterized by synchrotron based X-ray micro-computed tomography. Geoderma 2013, 195–196, 23–30. [Google Scholar] [CrossRef]
  13. Lv, C.; Bi, R.; Guo, X.; Chen, D.; Guo, Y.; Xu, Z. Erosion characteristics of different reclaimed substrates on iron tailings slopes under simulated rainfall. Sci. Rep. 2020, 10, 4275. [Google Scholar] [CrossRef] [PubMed]
  14. Zhu, M.; He, W.; Liu, Y.; Chen, Z.; Dong, Z.; Zhu, C.; Chen, Y.; Xiong, Y. Characteristics of soil erodibility in the Yinna mountainous area, eastern Guangdong Province, China. Int. J. Environ. Res. Public Health 2022, 19, 15703. [Google Scholar] [CrossRef] [PubMed]
  15. Shentu, J.; Li, X.; Han, R.; Chen, Q.; Shen, D.; Qi, S. Effect of site hydrological conditions and soil aggregate sizes on the stabilization of heavy metals (Cu, Ni, Pb, Zn) by biochar. Sci. Total Environ. 2022, 802, 149949. [Google Scholar] [CrossRef] [PubMed]
  16. Junyang, L.; Zhengzhao, Z.; Xuemeng, S. A review of the mechanism of plant root action on soil aggregate formation. J. Soil Water Conserv. 2020, 34, 8. [Google Scholar]
  17. Li, Y.; Zong, L.; Huang, Y. Application of chelators to phytoremediation of heavy metal polluted soils. Soil Environ. 2002, 11, 303–306. [Google Scholar] [CrossRef]
  18. Xu, W. Study on the Mechanism of Cadmium Tolerance and Enhanced Enrichment in Super Sweet 38 Maize. Master’s Thesis, South China University of Technology, Guangzhou, China, 2014. [Google Scholar]
  19. GB 15618-2018; Soil Environmental Quality Agricultural Land Soil Pollution Risk Control Standard. China Environment Publishing Group: Beijing, China, 2018.
  20. Zhou, W.; Leul, M. Uniconazole-induced tolerance of rape plants to heat stress in relation to changes in hormonal levels, enzyme activities and lipid peroxidation. Plant Growth Regul. 1999, 27, 99–104. [Google Scholar] [CrossRef]
  21. Yang, Q.; Zhao, Z.; Bai, Z.; Hou, H.; Yuan, Y.; Guo, A.; Li, Y. Effects of mycorrhizae and water conditions on perennial ryegrass growth in rare earth tailings. RSC Adv. 2019, 9, 10881–10888. [Google Scholar] [CrossRef]
  22. Lu, R. Soil Agrochemical Analysis Method; China Agricultural Science Technology Press: Beijing, China, 2000. [Google Scholar]
  23. Bao, S. Soil Agrochemical Analysis; China Agricultural Press: Beijing, China, 2001. [Google Scholar]
  24. Zhu, T.; Fu, D.; Yang, F. Effect of saponin on the phytoextraction of Pb, Cd and Zn from soil using Italian Ryegrass. Bull. Environ. Contam. Toxicol. 2015, 94, 129–133. [Google Scholar] [CrossRef]
  25. Widdup, E.E.; Chatfield-Reed, K.; Henry, D.; Chua, G.; Samuel, M.A.; Muench, D.G. Identification of detoxification pathways in plants that are regulated in response to treatment with organic compounds isolated from oil sands process-affected water. Chemosphere 2015, 139, 47–53. [Google Scholar] [CrossRef] [PubMed]
  26. Eltahawy, A.M.A.E.; Awad, E.-S.A.M.; Ibrahim, A.H.; Merwad, A.-R.M.A.; Desoky, E.-S.M. Integrative application of heavy metal–resistant bacteria, moringa extracts, and nano-silicon improves spinach yield and declines its contaminant contents on a heavy metal–contaminated soil. Front. Plant Sci. 2022, 13, 1019014. [Google Scholar] [CrossRef] [PubMed]
  27. Wei, H.; Zhang, W.; Zhuang, L.; Wang, S.; Tsang, D.C.W.; Qiu, R. Two-stage multi-fraction first-order kinetic modeling for soil Cd extraction by EDTA. Chemosphere 2018, 211, 1035–1042. [Google Scholar] [CrossRef] [PubMed]
  28. Liao, S. Effect of Chelating Agent EDDS and Growth Regulators on Cadmium Enrichment in Cowslip Chrysanthemum (Galinsoga parviflora). Master’s Thesis, Sichuan Agricultural University, Ya’an, China, 2016. [Google Scholar]
  29. Cheng, J. Effect of Chemical Drenching on the Structure of Soil Aggregates and the Desorption Characteristics of Heavy Metals. Master’s Thesis, Chongqing University, Chongqing, China, 2020. [Google Scholar]
  30. Asensio, V.; Covelo, E.F. Physical distribution of Ni, Pb and Zn in reclaimed mine soils observed by FE-SEM with an EDS detector. Environ. Sci. Pollut. Res. 2015, 22, 13372–13381. [Google Scholar] [CrossRef]
  31. Wei, M.; Chen, J.; Wang, Q. Remediation of sandy soil contaminated by heavy metals with Na2EDTA washing enhanced with organic reducing agents: Element distribution and spectroscopic analysis. Eur. J. Soil Sci. 2018, 69, 719–731. [Google Scholar] [CrossRef]
  32. Huang, B.; Li, Z.; Huang, J.; Guo, L.; Nie, X.; Wang, Y.; Zhang, Y.; Zeng, G. Adsorption characteristics of Cu and Zn onto various size fractions of aggregates from red paddy soil. J. Hazard. Mater. 2014, 264, 176–183. [Google Scholar] [CrossRef]
  33. Kim, H.; Cho, K.; Purev, O.; Choi, N.; Lee, J. Remediation of toxic heavy metal contaminated soil by combining a washing ejector based on hydrodynamic cavitation and soil washing process. Int. J. Environ. Res. Public Health 2022, 19, 786. [Google Scholar] [CrossRef]
  34. Huang, B.; Li, Z.; Li, D.; Yuan, Z.; Chen, Z.; Huang, J. Distribution characteristics of heavy metal(loid)s in aggregates of different size fractions along contaminated paddy soil profile. Environ. Sci. Pollut. Res. 2017, 24, 23939–23952. [Google Scholar] [CrossRef]
  35. Li, S.; Wang, M.; Zhao, Z.; Li, X.; Han, Y.; Chen, S. Alleviation of cadmium phytotoxicity to wheat is associated with Cd re-distribution in soil aggregates as affected by amendments. RSC Adv. 2018, 8, 17426–17434. [Google Scholar] [CrossRef]
  36. Gong, C.; Ma, L.; Cheng, H.; Liu, Y.; Xu, D.; Li, B.; Liu, F.; Ren, Y.; Liu, Z.; Zhao, C.; et al. Characterization of the particle size fraction associated heavy metals in tropical arable soils from Hainan Island, China. J. Geochem. Explor. 2014, 139, 109–114. [Google Scholar] [CrossRef]
  37. Hou, R.; Li, T.; Fu, Q.; Liu, D.; Li, M.; Zhou, Z.; Li, Q.; Zhao, H.; Yu, P.; Yan, J. The effect on soil nitrogen mineralization resulting from biochar and straw regulation in seasonally frozen agricultural ecosystem. J. Clean. Prod. 2020, 255, 120302. [Google Scholar] [CrossRef]
  38. Chen, Y.; Li, S.; Chen, X.; Li, Y.; Yan, C.; Wang, C.; Wang, Y.; Xu, H. Enhanced Cd activation by coprinus comatus endophyte bacillus thuringiensis and the molecular mechanism. Environ. Pollut. 2024, 342, 123052. [Google Scholar] [CrossRef] [PubMed]
  39. Huang, Y.; Li, B.; Chen, H.; Li, J.; Xu, J.; Li, X. Gamma-aminobutyric acid enhances cadmium phytoextraction by coreopsis grandiflora by remodeling the rhizospheric environment. Plants 2023, 12, 1484. [Google Scholar] [CrossRef] [PubMed]
  40. Guo, L.; Tóth, T.; Yang, F.; Wang, Z. Effects of different types of vegetation cover on soil microorganisms and humus characteristics of soda-saline land in the Songnen Plain. Front. Microbiol. 2023, 14, 1163444. [Google Scholar] [CrossRef] [PubMed]
  41. Alemu, E.; Selassie, Y.G.; Yitaferu, B. Effect of lime on selected soil chemical properties, maize (Zea mays L.) yield and determination of rate and method of its application in Northwestern Ethiopia. Heliyon 2022, 8, e08657. [Google Scholar] [CrossRef]
  42. Liu, C.; Lin, H.; Li, B.; Dong, Y.; Yin, T.; Chen, X. Endophyte inoculation redistributed bioavailable Cd and nutrient in soil aggregates and enhanced Cd accumulation in Phytolacca acinosa. J. Hazard. Mater. 2021, 416, 125952. [Google Scholar] [CrossRef]
  43. Mondal, S.; Mishra, J.S.; Poonia, S.P.; Kumar, R.; Dubey, R.; Kumar, S.; Verma, M.; Rao, K.K.; Ahmed, A.; Dwivedi, S.; et al. Can yield, soil C and aggregation be improved under long-term conservation agriculture in the eastern Indo-Gangetic plain of India? Eur. J. Soil Sci. 2021, 72, 1742–1761. [Google Scholar] [CrossRef]
  44. Nie, X.; Wang, D.; Ren, L.; Ma, K.; Chen, Y.; Yang, L.; Du, Y.; Zhou, G. Distribution characteristics and controlling factors of soil total nitrogen: Phosphorus ratio across the Northeast Tibetan Plateau Shrublands. Front. Plant Sci. 2022, 13, 825817. [Google Scholar] [CrossRef]
  45. Soinne, H.; Hyväluoma, J.; Ketoja, E.; Turtola, E. Relative importance of organic carbon, land use and moisture conditions for the aggregate stability of post-glacial clay soils. Soil Tillage Res. 2016, 158, 1–9. [Google Scholar] [CrossRef]
  46. Fliessbach, A.; Martens, R.; Reber, H.H. Soil microbial biomass and microbial activity in soils treated with heavy metal contaminated sewage sludge. Soil Biol. Biochem. 1994, 26, 1201–1205. [Google Scholar] [CrossRef]
  47. Bernasconi, D.; Caviglia, C.; Destefanis, E.; Agostino, A.; Boero, R.; Marinoni, N.; Bonadiman, C.; Pavese, A. Influence of speciation distribution and particle size on heavy metal leaching from MSWI fly ash. Waste Manag. 2022, 138, 318–327. [Google Scholar] [CrossRef] [PubMed]
  48. Zhang, Y.; Chen, M.; Zhang, X.; He, F.; Liu, X.; Bian, R.; Cheng, K.; Li, L.; Pan, G. Effects of different levels of heavy metal pollution on the composition of rice soil aggregates. SOIL 2017, 49, 337–344. [Google Scholar]
  49. Yu, H.; Li, C.; Yan, J.; Ma, Y.; Zhou, X.; Yu, W.; Kan, H.; Meng, Q.; Xie, R.; Dong, P. A review on adsorption characteristics and influencing mechanism of heavy metals in farmland soil. RSC Adv. 2023, 13, 3505–3519. [Google Scholar] [CrossRef] [PubMed]
  50. Zhou, Q.; Liu, Z.D.; Liu, Y.; Jiang, J.; Xu, R.K. Relative abundance of chemical forms of Cu(II) and Cd(II) on soybean roots as influenced by pH, cations and organic acids. Sci. Rep. 2016, 6, 36373. [Google Scholar] [CrossRef]
  51. Wu, X.; Wei, Y.; Cai, C.; Yuan, Z.; Li, D.; Liao, Y.; Deng, Y. Quantifying the contribution of phyllosilicate mineralogy to aggregate stability in the East Asian monsoon region. Geoderma 2021, 393, 115036. [Google Scholar] [CrossRef]
  52. Walia, S.S.; Dhaliwal, S.S.; Gill, R.S.; Kaur, T.; Kaur, K.; Randhawa, M.K.; Obročník, O.; Bárek, V.; Brestic, M.; Gaber, A.; et al. Improvement of soil health and nutrient transformations under balanced fertilization with integrated nutrient management in a rice-wheat system in Indo-Gangetic Plains—A 34-year Research outcomes. Heliyon 2024, 10, e25113. [Google Scholar] [CrossRef]
  53. Rajput, V.D.; Minkina, T.; Feizi, M.; Kumari, A.; Khan, M.; Mandzhieva, S.; Sushkova, S.; El-Ramady, H.; Verma, K.K.; Singh, A.; et al. Effects of silicon and silicon-based nanoparticles on rhizosphere microbiome, plant stress and growth. Biology 2021, 10, 791. [Google Scholar] [CrossRef]
Figure 1. Schematic diagram of soil column device.
Agriculture 14 01882 g001
Figure 2. Shoot and root biomass of maize under different treatments. Note: Different lowercase letters in the figure indicate significant differences between treatments (p < 0.05).
Agriculture 14 01882 g002
Figure 3. MDA content (a), SOD enzyme activity (b), CAT enzyme activity (c) and POD enzyme activity (d) in maize under different treatments in the soil column experiment. Note: Different lowercase letters in the figure indicate significant differences between treatments (p < 0.05).
Agriculture 14 01882 g003
Figure 4. Concentration of Cd in maize (a); and amount of Cd extracted and extraction efficiency (b) under different treatments in the soil column experiment. Note: Different lowercase letters in the figure indicate significant differences between treatments (p < 0.05).
Agriculture 14 01882 g004
Figure 5. Percentage of soil aggregates of different grain sizes in each soil layer under different treatments in the soil column experiment.
Agriculture 14 01882 g005
Figure 6. Distribution factors of Cd in soil aggregates of different grain sizes: (a) 0–20 cm soil layer; (b) 20–40 cm soil layer; and (c) 40–60 cm soil layer.
Agriculture 14 01882 g006
Figure 7. Mass loading of Cd in soil aggregates of various grain sizes under different treatments in the soil column experiment.
Agriculture 14 01882 g007
Figure 8. Scanning electron microscope images of soil aggregates at each grain level in the 0–20 soil layer under T1 and T6 treatments: (ad) SEM images of 0.2–2 mm particle-size agglomerates, 0.02–0.2 mm particle-size agglomerates, 0.002–0.02 mm particle-size agglomerates, and <0.002 mm particle-size agglomerates in group T1, respectively; and (eh) SEM images of 0.2–2 mm particle-sized agglomerates, 0.02–0.2 mm particle-sized agglomerates, 0.002–0.02 mm particle-sized agglomerates, and <0.002 mm particle-sized agglomerates of group T6, respectively. The scanning electron microscope images are all magnified 1000 times.
Agriculture 14 01882 g008
Figure 9. X-ray diffractograms of soil aggregates of various grain levels in the 0–20 soil layer under T1 and T6 treatments: (a) shows X-ray diffractograms of 0.2–2 mm grain-sized aggregates of soil under T1 and T6 treatments, (b) shows X-ray diffractograms of 0.02–0.2 mm grain-sized aggregates of soil under T1 and T6 treatments, (c) shows X-ray diffractograms of 0.002–0.02 mm grain-sized aggregates of soil under T1 and T6 treatments, (d) shows X-ray diffractograms of <0.002 mm grain-sized aggregates of soil under T1 and T6 treatments. X-ray diffractograms of agglomerates at the grain level under T1 and T6 treatments.
Agriculture 14 01882 g009
Table 1. Experimental treatments for soil columns.
TreatmentPlantChelating AgentGA3
T1
T26 mmol/kg AES
T3Maize
T4Maize6 mmol/kg AES
T5Maize10−6 mol/L GA3
T6Maize6 mmol/kg AES10−6 mol/L GA3
Note: In the table, “–” in the plant column indicates that no maize was planted. “–” in the chelating agent column indicates that AES was not applied. “–” in the GA3 column indicates that GA3 was not applied.
Table 2. Characteristics of heavy metal concentrations in maize under different treatments in soil column experiments.
RatioT3T4T5T6
BCF0.47 ± 0.02 c1.12 ± 0.01 a0.57 ± 0.01 b1.16 ± 0.02 a
TF0.52 ± 0.02 c0.88 ± 0.01 a0.65 ± 0.01 b0.93 ± 0.02 a
Note: Different lowercase letters in the table indicate significant differences between treatments (p < 0.05).
Table 3. MWD of soil in each soil layer under different treatments in the soil column experiment.
TreatmentMWD (mm)
0–20 cm20–40 cm40–60 cm
T10.15 ± 0.001 c0.24 ± 0.008 b0.24 ± 0.001 c
T20.15 ± 0.003 c0.23 ± 0.003 b0.24 ± 0.003 c
T30.17 ± 0.001 b0.24 ± 0.003 b0.24 ± 0.005 c
T40.13 ± 0.003 d0.25 ± 0.008 b0.25 ± 0.006 c
T50.20 ± 0.003 a0.27 ± 0.005 a0.27 ± 0.005 b
T60.14 ± 0.002 d0.24 ± 0.007 b0.30 ± 0.007 a
Note: Different lowercase letters in the table indicate significant differences between treatments (p < 0.05).
Table 4. Total Cd concentration in aggregates of different grain sizes in each soil layer under different treatments in the soil column experiment.
TreatmentSoil Depth /cmTotal Cd (mg/kg)
0.2–2 mm0.02–0.2 mm0.002–0.02 mm<0.002 mm
T10–206.12 ± 0.234.61 ± 0.207.50 ± 0.2410.50 ± 0.22
20–400.23 ± 0.010.22 ± 0.020.21 ± 0.020.32 ± 0.03
40–600.23 ± 0.020.16 ± 0.010.21 ± 0.040.28 ± 0.02
T20–203.95 ± 0.193.05 ± 0.168.14 ± 0.2112.09 ± 0.30
20–400.25 ± 0.020.24 ± 0.020.28 ± 0.020.29 ± 0.02
40–600.19 ± 0.020.18 ± 0.010.20 ± 0.040.24 ± 0.04
T30–206.02 ± 0.294.27 ± 0.326.94 ± 0.189.77 ± 0.28
20–400.25 ± 0.040.23 ± 0.010.27 ± 0.010.31 ± 0.01
40–600.19 ± 0.010.18 ± 0.010.22 ± 0.030.25 ± 0.02
T40–204.90 ± 0.073.29 ± 0.117.19 ± 0.0911.20 ± 0.13
20–400.25 ± 0.020.24 ± 0.010.28 ± 0.010.31 ± 0.02
40–600.18 ± 0.010.17 ± 0.0040.24 ± 0.010.25 ± 0.02
T50–206.17 ± 0.195.36 ± 0.106.99 ± 0.109.82 ± 0.20
20–400.25 ± 0.010.19 ± 0.010.28 ± 0.010.29 ± 0.02
40–600.21 ± 0.010.14 ± 0.010.28 ± 0.030.29 ± 0.01
T60–203.95 ± 0.093.80 ± 0.057.09 ± 0.1010.89 ± 0.08
20–400.24 ± 0.010.22 ± 0.010.28 ± 0.040.31 ± 0.02
40–600.19 ± 0.020.18 ± 0.010.20 ± 0.020.25 ± 0.02
Disclaimer/Publisher’s Note: The statements, opinions and data contained in all publications are solely those of the individual author(s) and contributor(s) and not of MDPI and/or the editor(s). MDPI and/or the editor(s) disclaim responsibility for any injury to people or property resulting from any ideas, methods, instructions or products referred to in the content.

