Article

Effects of Cover Measures on Soil Organic Nitrogen Fractions and Total Soluble Nitrogen Pools in Citrus Orchards of the Red Soil Hilly Region of Southern China

1
College of Resources and Environment, Fujian Agriculture and Forestry University, Fuzhou 350002, China
2
Minqing County Soil and Water Conservation Technology Center, Fuzhou 350800, China
*
Author to whom correspondence should be addressed.
Agriculture 2024, 14(11), 1879; https://doi.org/10.3390/agriculture14111879
Submission received: 30 September 2024 / Revised: 21 October 2024 / Accepted: 21 October 2024 / Published: 24 October 2024
(This article belongs to the Section Agricultural Soils)

Abstract

:
Soil organic nitrogen fractions and total soluble nitrogen (TSN) pools are crucial for assessing orchard soil fertility and tree nutrient requirements. Here, we studied the effects of grass cover (GC), plastic mulch (PM), and clean tillage (CK) on the physicochemical properties, organic nitrogen fractions, and TSN content of soil from a 0–60 cm depth in a 7-year-old orchard in the red soil hilly region of southern China. The results showed that GC and PM significantly increased the content of soil organic carbon (SOC), total nitrogen (TN), total phosphorus (TP), and total potassium (TK), as well as the C/N and N/P ratios. The mean total organic nitrogen (TON) content in the 0–60 cm soil profile was 1219.21 and 895.15 mg·kg−1 in the GC and PM treatments, and it was 67.36% and 22.88% higher in the GC and PM treatments than in the CK, respectively. In the 0–20 cm soil horizon, the active organic nitrogen (AN, AAN, ASN) content was 52.67% and 17.15% higher in the GC and PM treatments than in the CK, respectively. In the 20–60 cm soil horizon, the stable organic nitrogen (UN, NHN) content was 97.13% and 21.69% greater under the GC and PM treatments compared to the CK, respectively. Different ground cover methods increased the total soluble nitrogen (TSN) concentration in the 0–20 cm soil horizon while reducing it in the deeper 20–60 cm layer. Correlation analysis revealed significant positive correlations of SOC, TN, TP, TSN, and TON with acid-hydrolyzable nitrogen fractions (AN, AAN, ASN, UN) and significant negative correlations with bulk density (BD). Stepwise linear regression analysis, using the regression equation TSN = 0.372AN − 0.053NHN + 18.473 (p < 0.01, R2 = 0.925), identified AN as a critical indicator for TSN among the active organic nitrogen fractions.

1. Introduction

Nitrogen (N) is a vital element that serves as a key limiting factor in both plant growth and crop production [1]. Soil provides a crucial source of N for crops; thus, improvements in the soil N supply have major implications for crops [2]. Although more than 90% of soil nitrogen is found in organic forms, which are primarily derived from organic residues and humus [3], plants primarily absorb inorganic nitrogen, contributing to about 60% of the total nitrogen uptake. This is because inorganic N is absorbed more rapidly and efficiently. In contrast, organic N, due to its complex forms, is directly absorbed by plants in relatively low proportions; for example, the absorption of glycine N constitutes only approximately 20% of the total N uptake [4]. Additionally, the bioavailability of different soil organic N fractions varies. Active organic N can rapidly mineralize, providing N to plants in the short term and promoting growth, whereas stable organic N serves as a N reserve that slowly releases N when its supply is insufficient, thus enhancing N availability [5,6,7,8]. Therefore, a deep understanding of changes in organic N fractions is crucial for assessing the soil’s N supply capacity and developing effective N management strategies.
According to Bremner, JM [9], soil organic N fractions can be divided into amino sugar N (ASN), ammonium N (AN), amino acid N (AAN), unknown N (UN), and non-hydrolyzable N (NHN); these first four fractions are acid-hydrolyzable N (AHN). AN, ASN, and AAN together comprise active organic N, and UN and NHN comprise stable organic N [10]. AAN is a critical fraction of soil organic N synthesized by microorganisms during the assimilation of minerals and organic molecules [11]. AN primarily originates from the breakdown of acidic organic fractions and the release of ammonium bound to clay; it may also come from organic nitrogen fractions, including amino acids and amino sugars [12]. ASN is a crucial soil organic N fraction that is mainly located in microbial cell walls; it is more stable than AN and AAN [13,14]. UN represents N that has not been fully identified or classified by traditional methods, and NHN is typically N bound to aromatic rings or other large molecules [15]. Some of these organic N fractions are soluble, and soluble organic N (SON) and soil mineral N (SMN) together form the soil total soluble N pools (TSN) [16,17]. TSN directly reflects soil fertility and the N supply potential, and it is mainly influenced by soil organic N fractions.
The composition of soil organic nitrogen fractions and TSN is influenced by various soil factors, such as temperature, moisture levels, pH, organic matter content, elemental makeup, enzyme activity, and microbial communities [18,19,20,21,22]. Li et al. [3] reported that a decrease in the annual average temperature of paddy soils increases the proportions of NHN and AN and decreases AHN, ASN, and UN. Su et al. [10] reported that different maize residue management practices influence soil pH, organic matter levels, and nitrogen-cycling enzyme activities, which in turn alter the distribution and concentration of organic nitrogen fractions across various soil depths. In the red soil hilly region of southern China, the soil tends to be acidic, the organic matter content is low, and the availability of soil N is often insufficient due to high temperatures and abundant rainfall [23]. In pursuit of higher yields, fertilizers have often been applied indiscriminately, and this has had various deleterious effects on orchards, such as decreases in soil pH and soil compaction [24]. Research on nitrogen migration and transformation within the soil is essential to reduce the harmful environmental impacts of fertilizers. Earlier findings suggest that the buildup of significant soluble nitrogen levels in orchard soils supplies vital nutrients to fruit trees [25,26]. However, the distribution of and relationships between organic N fractions and TSN have not yet been clarified. This has impeded ongoing efforts to manage soil N levels in the red soil hilly region. Common orchard management practices in this region include grass cover, plastic mulch, and clean tillage [27]. Clean tillage promotes organic matter decomposition, disrupts the hardpan at the soil surface, increases soil looseness, improves soil aeration and permeability, and changes the soil microbial community [28]. The use of grass cover and plastic mulch has become more common to regulate soil moisture and temperature while improving the physical structure and organic matter levels of orchard topsoil. However, some herbaceous plants can release organic acids that modify soil pH [29]. However, the variation in organic N fractions under different cover measures in the red soil hilly region has not yet been characterized, and the factors affecting TSN under these cover measures remain unclear.
In this study, we assessed how various ground cover practices influence the soil organic nitrogen fractions in a citrus orchard located within the red soil hilly region of southern China. Our aim was to characterize changes in TSN under various cover measures and clarify the relationships between orchard soil TSN and soil physicochemical properties. Our findings have implications for preventing N loss in citrus orchards, optimizing the soil N supply, and advancing our understanding of N cycling. We hypothesized that (1) grass cover and plastic mulch would improve the soil physicochemical properties of citrus orchards in the red soil hilly region, which would lead to changes in soil organic N fractions; and (2) grass cover and plastic mulch would increase the active organic N fractions in citrus orchard soil, thereby enhancing TSN.

2. Materials and Methods

2.1. Overview of the Study Area

Our study was conducted in Fuzhou, Fujian Province, China (25°68′51.41″ N, 119°33′57.02″ E) (Figure 1). This area experiences a subtropical monsoon climate, characterized by an average yearly temperature between 19 and 21 °C. Temperature fluctuations are substantial throughout the year, with summer peaks of up to 35 °C and winter lows near 5 °C. Annual precipitation averages approximately 1350 mm and predominantly occurs between March and June. Fuzhou has a hilly and low mountainous landscape, with altitudes ranging from 600 to 1000 m. According to the World Reference Base for Soil Resources [30], the predominant soil type in Fuzhou is classified as Acrisol, which is common in humid subtropical regions and characterized by strong weathering and low fertility. The agricultural land in this area mainly consists of terraced hillside orchards, with an orchard area of 51,509.80 hectares, accounting for 76.88% of the total plantation area. Citrus reticulata Blanco, Dimocarpus longan, and Litchi chinensis are the main crops.

2.2. Experimental Design

This study was conducted in a citrus orchard with three different treatments: clean tillage (CK) (Figure 2a), grass cover (GC) (Figure 2b), and plastic mulch (PM) (Figure 2c). Each treatment was replicated three times (n = 3), and the plot size for each treatment was approximately 94.5 m2 (10.5 m × 9 m) to ensure sufficient tree representation. The experimental plots included 3 rows with 3 trees per row, providing a manageable and statistically valid layout. CK: weeds were manually cleared once a month. GC: herbaceous plants, mainly Portulaca oleracea L. and Nepeta cataria L., were allowed to grow naturally within the canopy. PM: the soil surface was cleaned, and the entire plot surface was covered with plastic mulch. A mixed fertilizer containing 15% total nutrients (N + P2O5 + K2O) by weight and 50% organic matter was applied at 1200 kg·ha−1 annually in December as a base fertilizer. Additionally, 960 kg·ha−1 of the same fertilizer was applied as a top dressing in March, May, and July. The sampling locations were terraced, featuring a planting density of about 925 citrus trees per hectare, with 3 m spacing between individual plants and 3.5 m between rows.

2.3. Soil Sampling and Measurement Methods

Soil samples were collected from the area beneath three representative trees, which were randomly selected from each treatment plot in the citrus orchard. Soil samples were taken approximately 35 cm inside and outside the vertical drip line of each tree canopy. Surface litter and debris were removed, and a soil auger was used to collect samples from four depth layers: 0–10 cm, 10–20 cm, 20–40 cm, and 40–60 cm. Six samples taken from the corresponding soil layers were merged into a single composite sample, secured in a sealed bag, and delivered to the laboratory. Each treatment plot had three replicates, resulting in a total of 36 composite samples. In the laboratory, stones and visible plant and animal residues were removed from the soil samples. A portion of the fresh samples was maintained at 4 °C to determine TSN. The remaining samples were air-dried, sieved through 2 mm and 0.15 mm mesh filters, and used for analysis of soil physicochemical properties, soil organic N fractions, and TN content.
TN and SOC were measured using an elemental analyzer (Elementar VARIO EL III, Elementar Analysensysteme GmbH, Langenselbold, Germany) [25]. Soil pH was determined in a 1:2.5 soil–water suspension. Bulk density (BD) was measured using the ring knife method; samples were oven-dried and weighed to calculate BD. TP was determined using the NaOH fusion-molybdenum antimony colorimetric method, and TK was measured using the NaOH fusion-flame photometry method. TON and AHN were determined using the Kjeldahl method after digestion with concentrated H2SO4. TSN was measured using potassium persulfate oxidation and ultraviolet spectrophotometry. Soil organic N fractions were determined using the Bremner method [9]: AHN was determined using the Kjeldahl method. AN was determined using the Kjeldahl distillation method with MgO addition. AN + ASN was determined using distillation in a phosphate-borax buffer at pH 11.2. AAN was determined using the Kjeldahl distillation method after ninhydrin oxidation in a phosphate-borax buffer. ASN was determined by subtracting AN from the AN + ASN value. UN was calculated by subtracting AAN, ASN, and AN from the AHN value. NHN was determined by subtracting AHN from the TN value.

2.4. Statistical Analysis

Data were processed using Excel 2010, and plots were created using Origin 2022. Stepwise regression analysis was conducted using SPSS 27.0. Our experiment was conducted using a randomized block design, and one-way analysis of variance (ANOVA) was applied to evaluate the effects of various cover measures on soil physicochemical properties, soil organic N fractions, and TSN. Multiple comparisons were made using Tukey’s Honest Significant Difference (HSD) tests at the p = 0.05 level to compare differences among treatments. The Pearson correlation analysis was employed to identify the relationships between soil organic N fractions and other soil properties. Subsequently, a stepwise regression analysis was performed using SPSS 27.0, with TSN as the dependent variable and various soil physicochemical properties and soil organic N fractions (e.g., AN, AAN, ASN) as independent variables, to identify the key factors affecting variation in TSN.

3. Results and Analysis

3.1. Basic Soil Physicochemical Properties
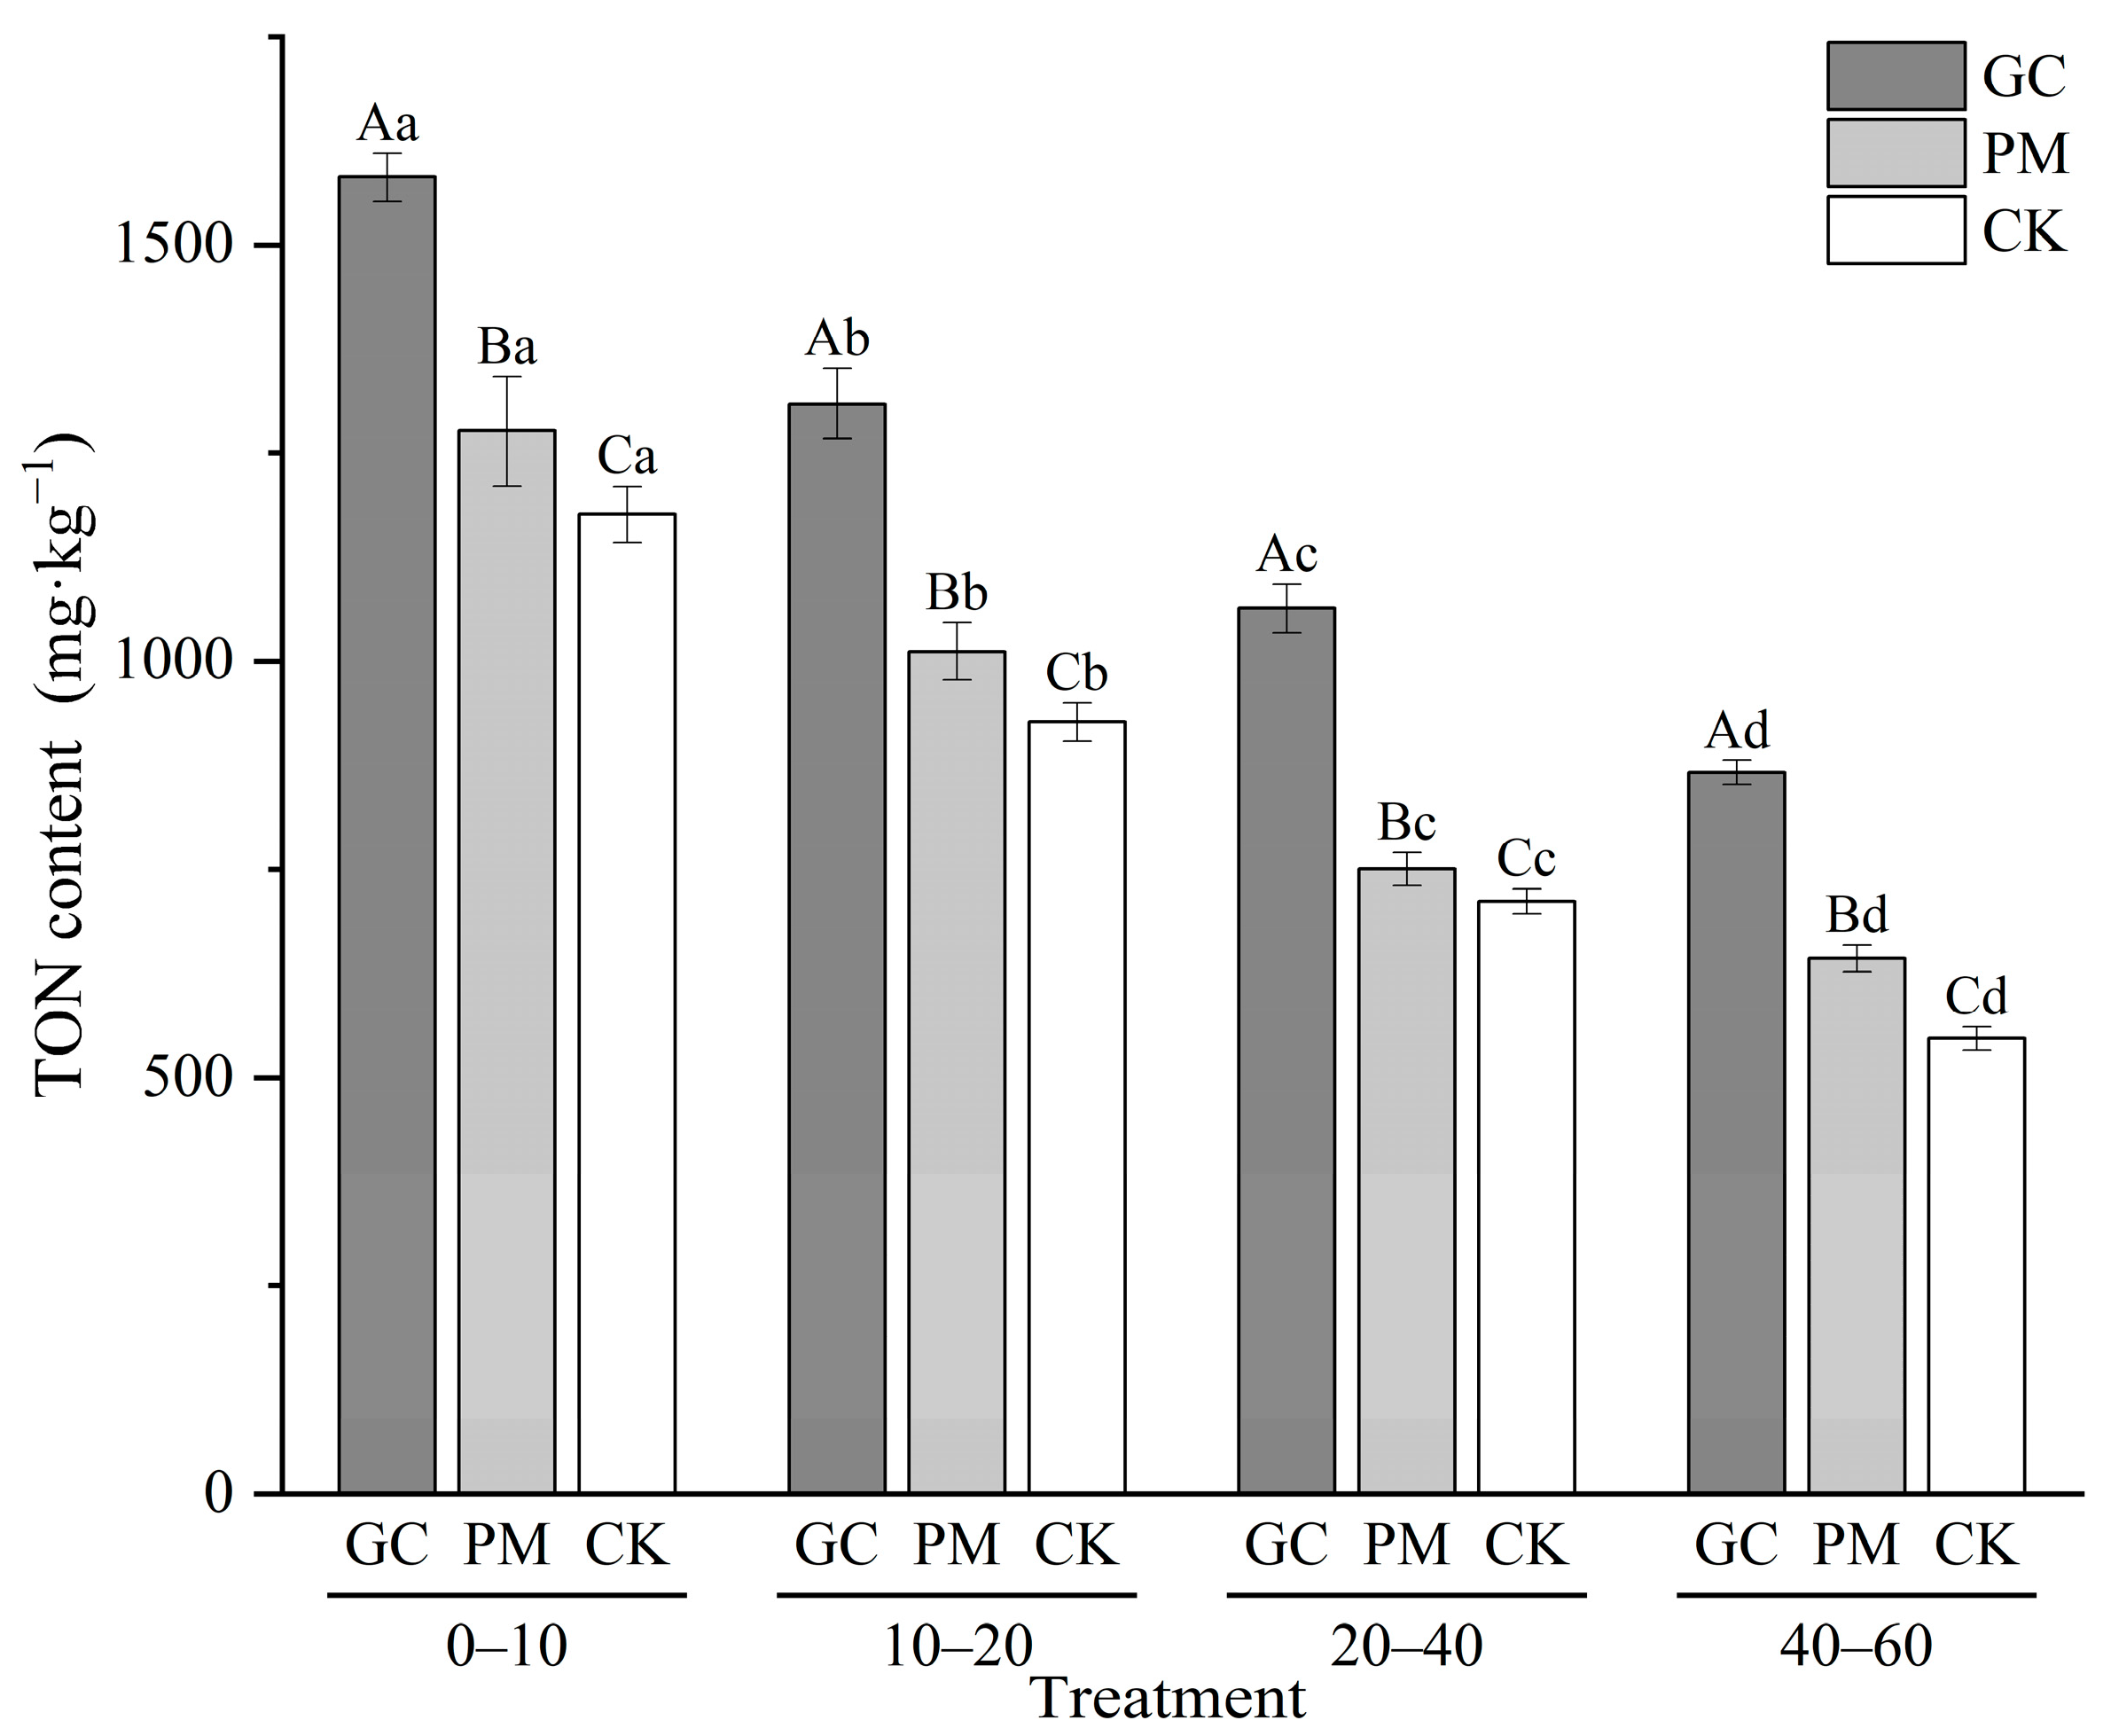
BD and the proportion of sand particles were significantly lower in the GC and PM treatments than in the CK (Table 1). Within the 0–60 cm soil profile, the average BD was 1180 and 1230 kg·m−3 in the GC and PM treatments, which was 7.81% and 3.71% lower than that in the CK, respectively. BD under the GC and PM treatments decreased by 25.00% and 20.57%, respectively, in the 0–10 cm soil horizon compared to the 40–60 cm horizon. Similarly, the sand particle proportion in the 0–10 cm horizon was reduced by 23.35% and 15.63% under the GC and PM treatments relative to the CK. Throughout the 0–60 cm soil profile, the average proportion of sand particles was 19.36% and 21.91% in the GC and PM treatments, which was 22.35% and 12.13% lower than that in the CK, respectively. In the 0–10 cm soil horizon, the silt and clay particle proportions under the GC treatment were 6.96% and 21.18% higher, respectively, compared to the CK. Similarly, the PM treatment increased silt and clay proportions by 2.73% and 19.54%, respectively, relative to the CK. Throughout the entire soil profile, the average proportions of silt and clay particles in the GC treatment were 68.99% and 11.66%, which were 5.47% and 20.62% higher, respectively, than in the CK. For the PM treatment, the silt and clay contents averaged 66.77% and 11.32%, representing increases of 2.08% and 17.18% over the CK.
Both GC and PM treatments significantly influenced selected soil properties (Table 2). The average SOC content in the 0–60 cm soil profile was 20.11 and 13.20 g·kg−1 in the GC and PM treatments, which were 76.40% and 15.80% higher than that in the CK, respectively. The SOC concentration declined with soil depth. Changes in the TN, TP, and TK content were similar to changes in the SOC content. In the GC treatment, the average TN, TP, and TK content in the 0–60 cm soil profile was 1.25 g·kg−1, 1.38 g·kg−1, and 21.97 g·kg−1, which was 34.94%, 29.82%, and 60.24% higher than that in the CK, respectively. In the PM treatment, the average TN, TP, and TK content was 0.98 g·kg−1, 1.36 g·kg−1, and 15.49 g·kg−1, which was 5.96%, 27.64%, and 12.89% higher than that in the CK. Soil pH was significantly elevated in the GC and PM treatments at the 0–10 cm depth, and the pH initially decreased and then increased with soil depth. Additionally, the C/N ratio within the 0–10 cm soil horizon was 26.06% and 4.49% higher in the GC and PM treatments, respectively, than in the CK. Similarly, the N/P ratio within the 0–10 cm soil horizon was 56.53% and 37.35% higher in the GC and PM treatments, respectively, than in the CK.

3.2. TON in Soil

The TON content across the 0–60 cm soil profile was markedly higher under the GC and PM treatments compared to the CK (Figure 3). On average, the TON levels in this profile reached 1219.21 and 895.15 mg·kg−1 for the GC and PM treatments, representing increases of 67.36% and 22.88%, respectively, over the CK. Moreover, the GC and PM treatments significantly boosted the TON content in the 0–20 cm soil horizon. The average TON concentration in this horizon was 1388.84 and 1175.92 mg·kg−1 for the GC and PM treatments, reflecting increases of 37.44% and 8.79% compared to the CK, respectively. In all treatments, TON levels declined with soil depth. Specifically, the TON content within the 0–10 cm soil horizon was 64.96% and 82.90% higher under the GC and PM treatments, respectively, than in the 40–60 cm soil layer.

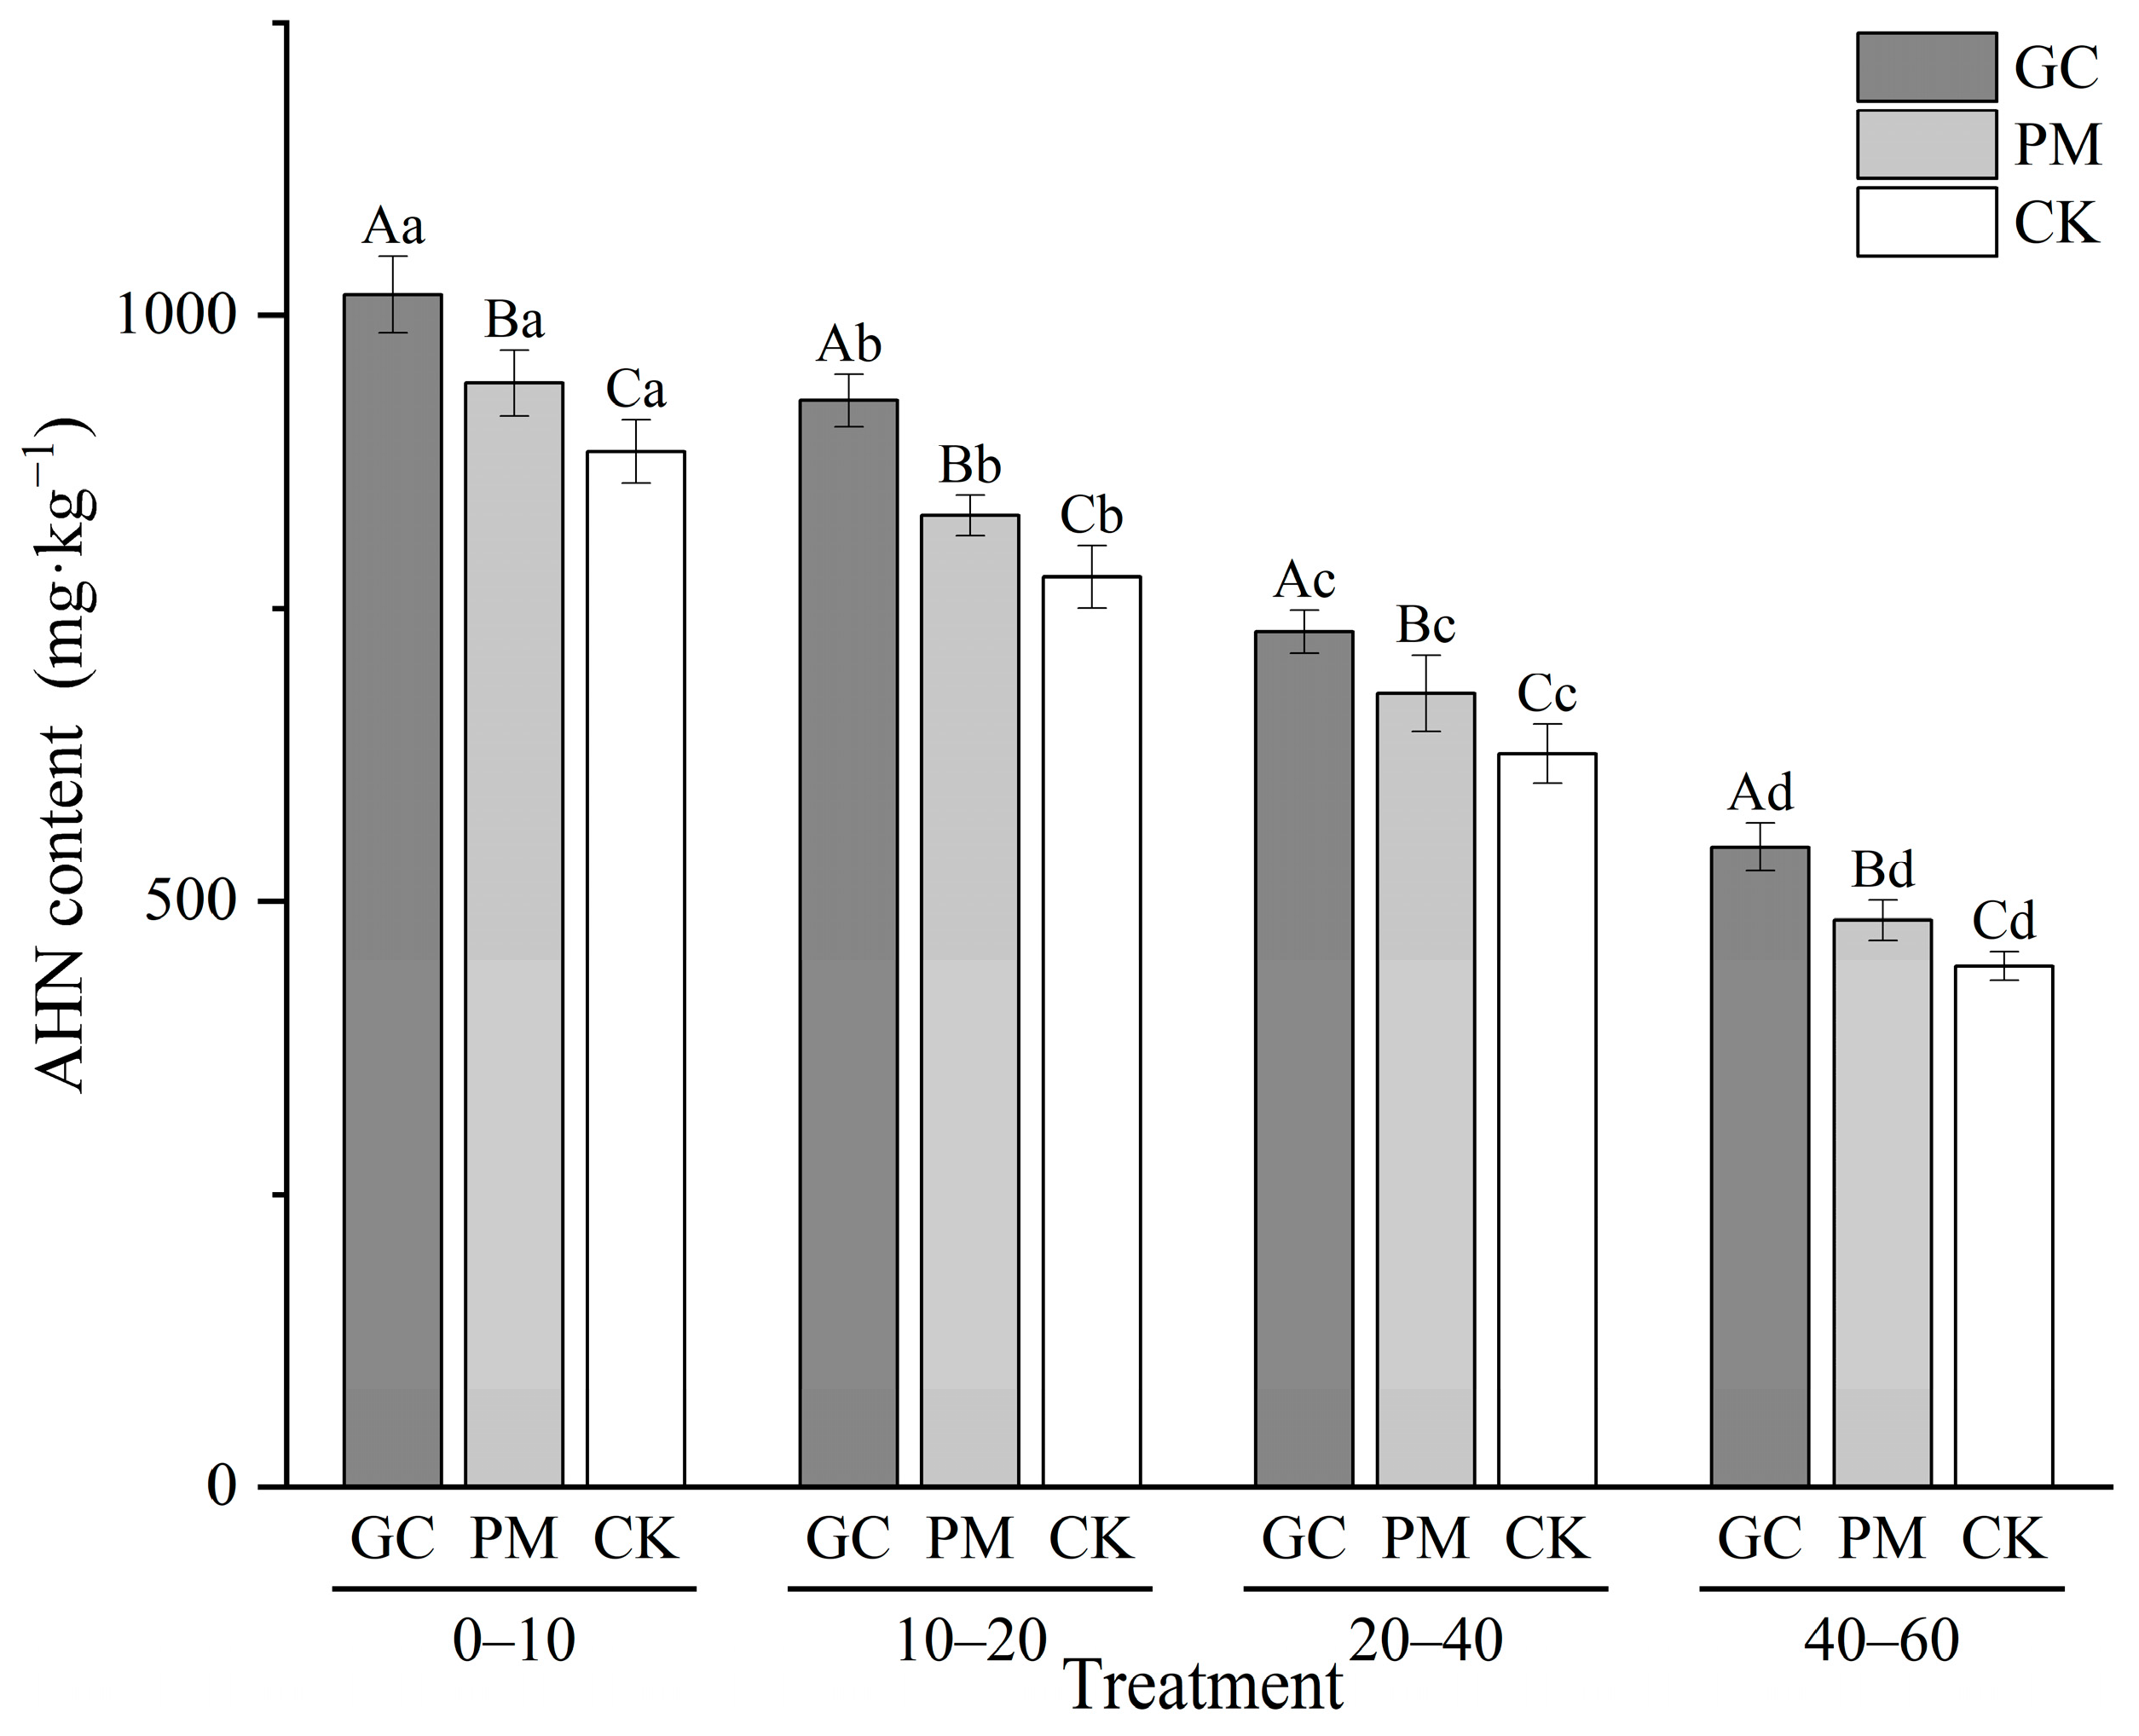
3.3. Acid-Hydrolyzable TN

GC and PM treatments significantly increased the content of AHN (Figure 4). The average AHN content in the 0–60 cm soil profile in the GC and PM treatments was 818.57 and 742.77 mg·kg−1, which was 19.84% and 8.76% higher than that in the CK, respectively. Within the 0–10 cm soil horizon, the AHN content in the GC and PM treatments was 1018.79 and 942.43 mg·kg−1, which was 15.20% and 6.57% higher than that in the CK, respectively. Additionally, the AHN content decreased with soil depth in all treatments. In the GC and PM treatments, AHN was 46.36% and 48.64% higher within the 0–10 cm soil horizon than within the 40–60 cm soil layer, respectively.

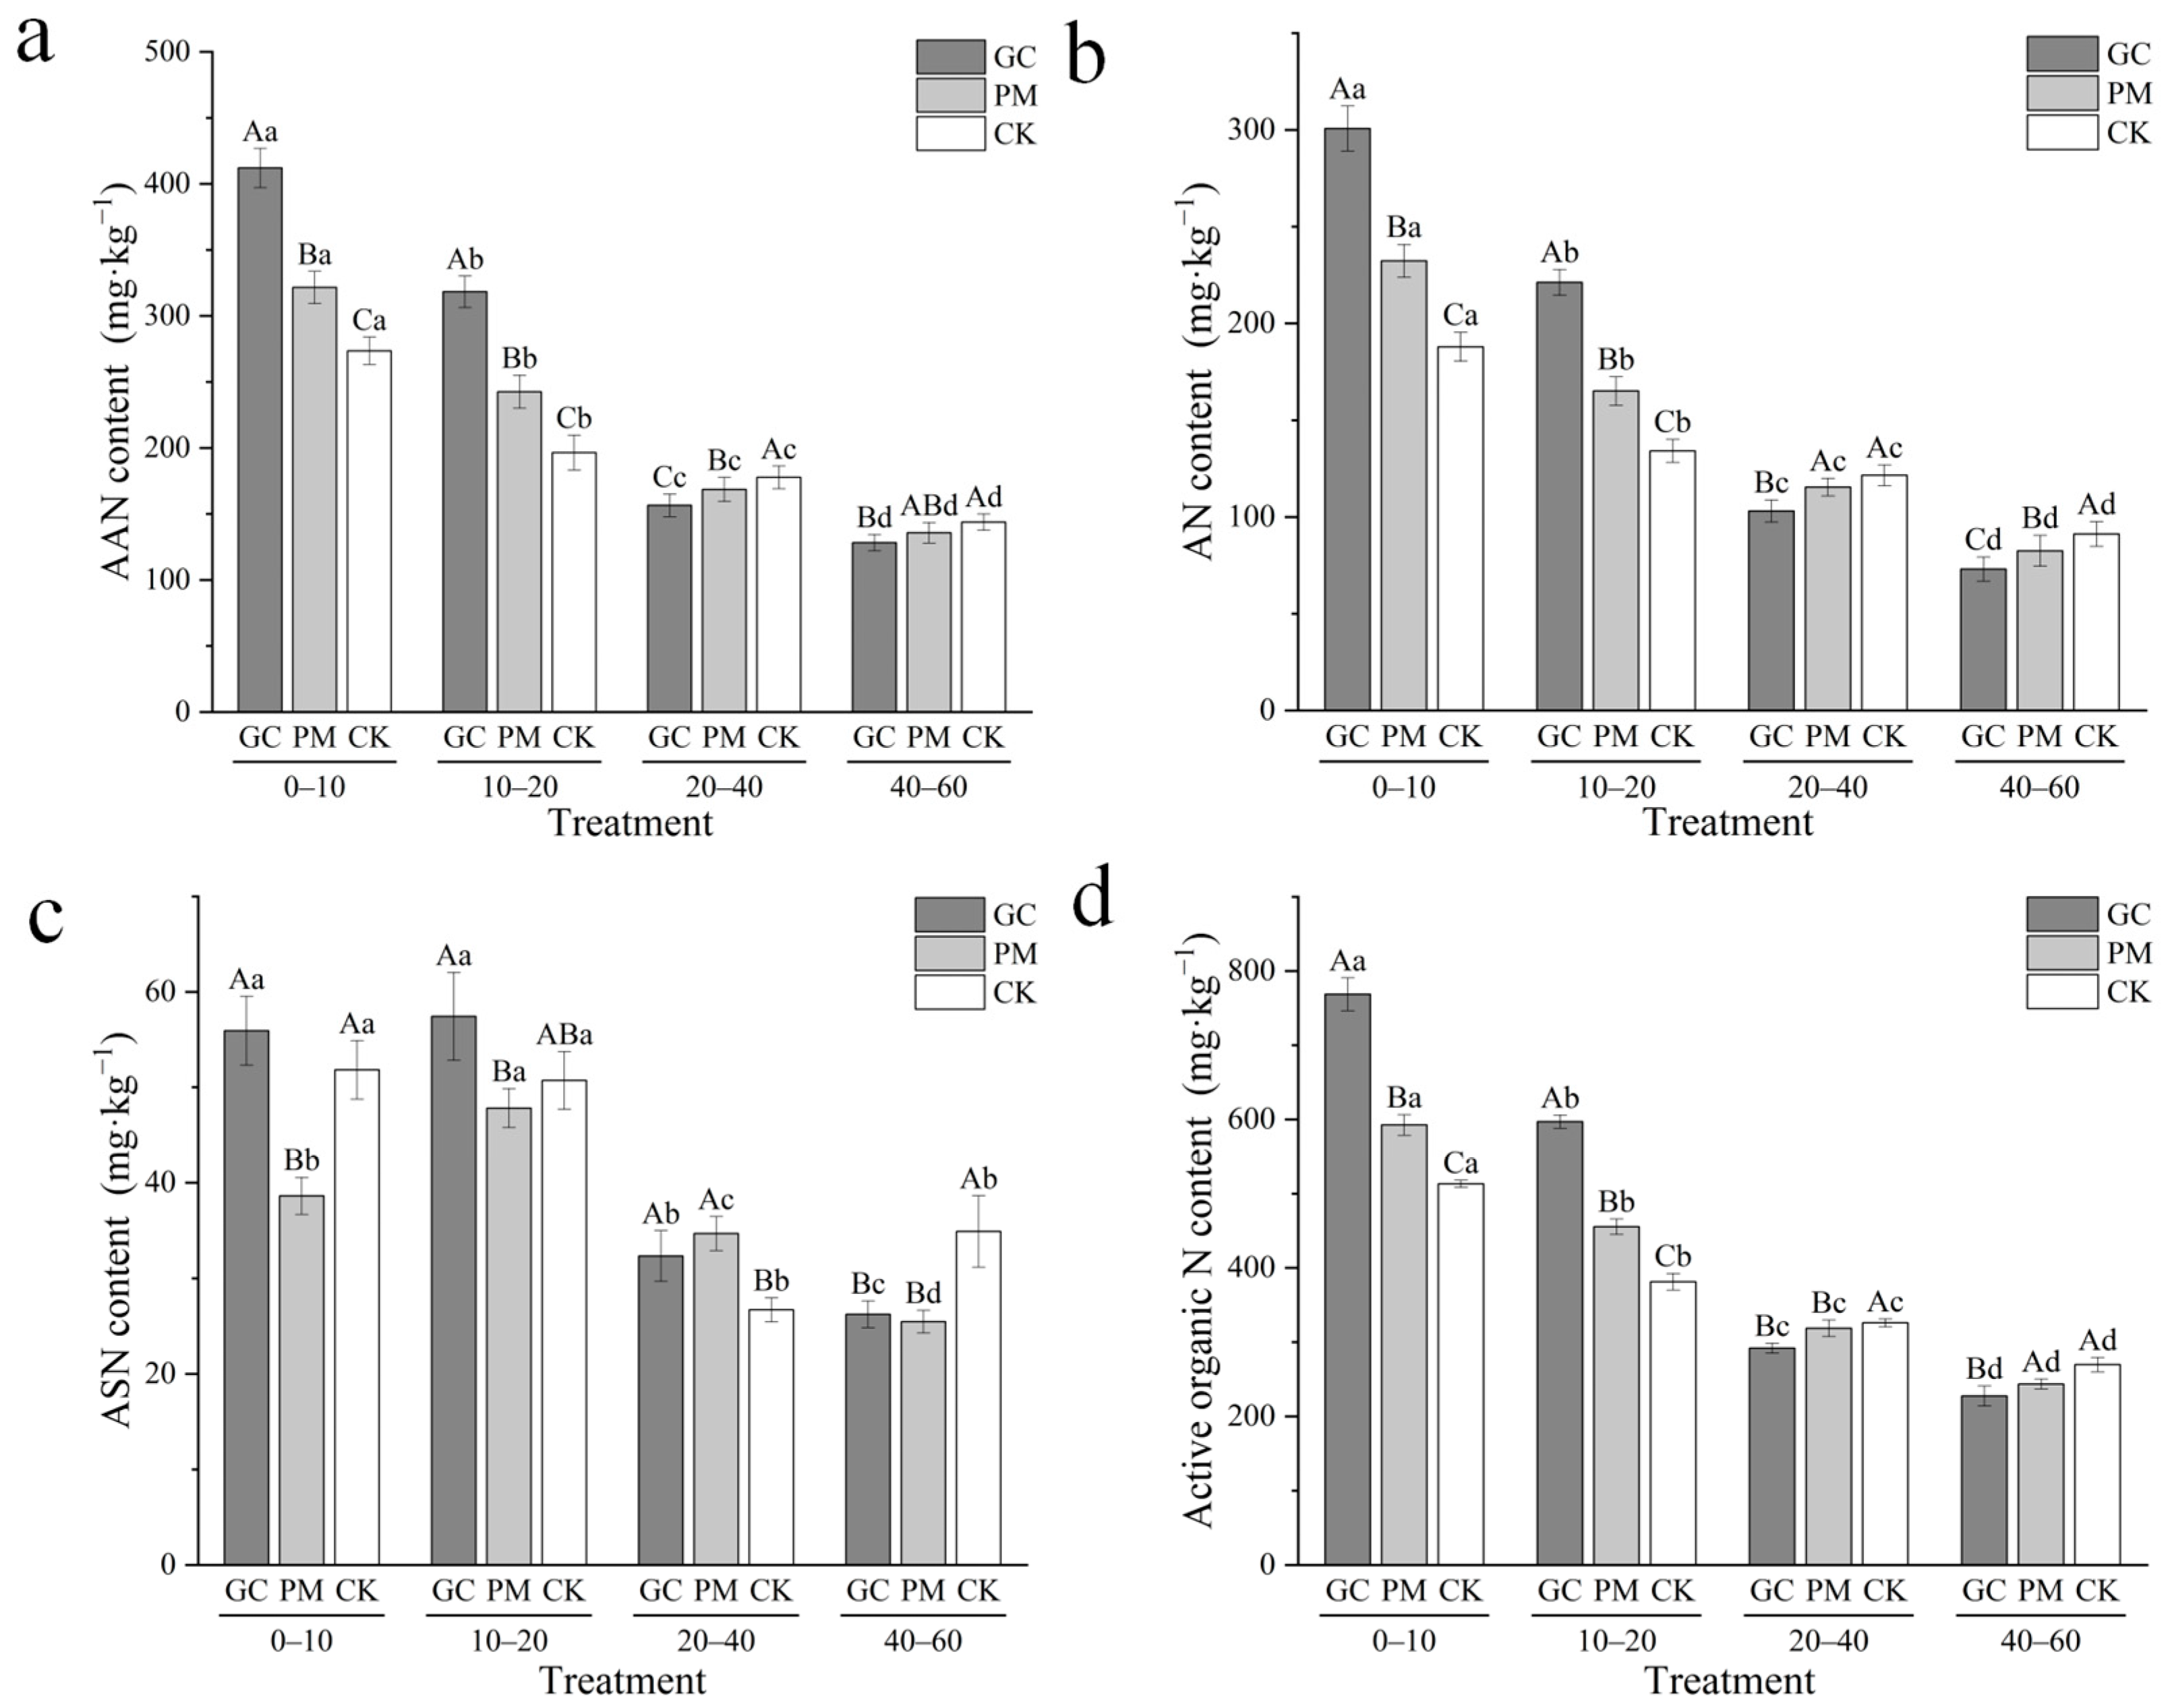
3.4. Active Organic N

GC and PM significantly increased the AAN content within the 0–20 cm soil horizon (Figure 5a). On average, AAN concentrations in this horizon were 365.15 and 282.30 mg·kg−1 under the GC and PM treatments, representing increases of 54.95% and 19.81%, respectively, compared to the CK. The most pronounced increase in AAN occurred within the 10–20 cm soil horizon, where AAN content was 103.38% and 41.76% higher under the GC and PM treatments, respectively, compared to the 20–40 cm horizon. AAN content decreased consistently with increasing soil depth in all treatments. In the 0–10 cm horizon, AAN levels were 64.05% and 57.28% higher under the GC and PM treatments, respectively, than in the 40–60 cm horizon.
The GC and PM treatments also significantly increased the AN content within the 0–20 cm soil horizon (Figure 5b). In the GC and PM treatments, the average AN content within the 0–20 cm soil horizon was 261.63 and 198.98 mg·kg−1, which was 62.91% and 23.90% higher than that in the CK, respectively. The AN content within the 0–60 cm soil horizon in the GC and PM treatments averaged 182.23 and 156.69 mg·kg−1, which was 30.08% and 11.85% higher than that in the CK, respectively. The AN concentration decreased with soil depth in all treatments, and it was 76.11% and 64.15% higher in the GC and PM treatments, respectively, within the 0–10 cm layer than within the 40–60 cm layer.
The GC treatment significantly increased the ASN content within the 0–20 cm soil horizon (Figure 5c). In the GC treatment, the average ASN content within the 0–20 cm soil horizon was 56.83 mg·kg−1, which was 10.12% higher than that in the CK. Conversely, the PM treatment significantly decreased the ASN content within the 0–60 cm soil horizon. The average ASN content within the 0–60 cm soil horizon in the PM treatment was 37.68 mg·kg−1, which was 9.35% lower than that in the CK. The ASN concentration decreased with soil depth across all treatments. The ASN content was 53.75% and 32.29% higher in the GC and PM treatments, respectively, within the 0–10 cm horizon than within the 40–60 cm layer.
The GC and PM treatments significantly increased the content of active organic N (AN, AAN, ASN) across the entire soil profile (Figure 5d). In the GC and PM treatments, the average content of active organic N within the 0–60 cm soil horizon was 471.25 and 402.53 mg·kg−1, which was 26.49% and 8.04% higher than that in the CK, respectively. Within the 0–20 cm soil horizon, the content of active organic N was significantly higher in the GC and PM treatments than in the CK. The average content of active organic N within the 0–20 cm soil horizon was 52.67% and 17.15% higher in the GC and PM treatments, respectively, than in the CK.

3.5. Stable Organic N

The GC and PM treatments significantly reduced the content of UN within the 0–20 cm soil horizon (Figure 6a). In the GC and PM treatments, the average UN content within the 0–20 cm soil horizon was 290.37 and 361.61 mg·kg−1, which was 24.26% and 5.68% lower than that in the CK, respectively. The UN content first increased and then decreased with soil depth in the GC and PM treatments. The average UN content was 339.36 and 361.16 mg·kg−1 in the GC and PM treatments, within the 0–40 cm soil horizon, which was 6.76% and 50.08% higher than that within the 40–60 cm horizon, respectively.
The GC treatment exhibited the strongest impact on NHN content throughout the soil profile (Figure 6b). Within the 0–60 cm horizon, the average NHN levels reached 432.04 and 246.09 mg·kg−1 under the GC and PM treatments, marking increases of 100.91% and 14.44%, respectively, over the CK. The highest NHN content was recorded in the 0–10 cm soil horizon for both the GC and PM treatments, where it was 86.45% and 15.70% higher, respectively, compared to the CK. In the GC treatment, the NHN content declined with increasing soil depth, with levels 42.25% higher in the 0–10 cm horizon than in the 40–60 cm horizon.
Both the GC and PM treatments significantly increased the stable organic N content (UN, NHN) within the 0–60 cm soil horizon (Figure 6c). The average stable organic N content within the 0–60 cm soil horizon was 770.92 and 558.33 mg·kg−1 in the GC and PM treatments, which was 52.61% and 10.52% higher than that in the CK, respectively. The most significant increase in the stable organic N content was observed within the 20–60 cm soil horizon in the GC treatment, and the average stable organic N content was 97.13% higher in this treatment than in the CK. The stable organic N content within the 20–60 cm soil horizon was 21.69% higher in the PM treatment than in the CK.

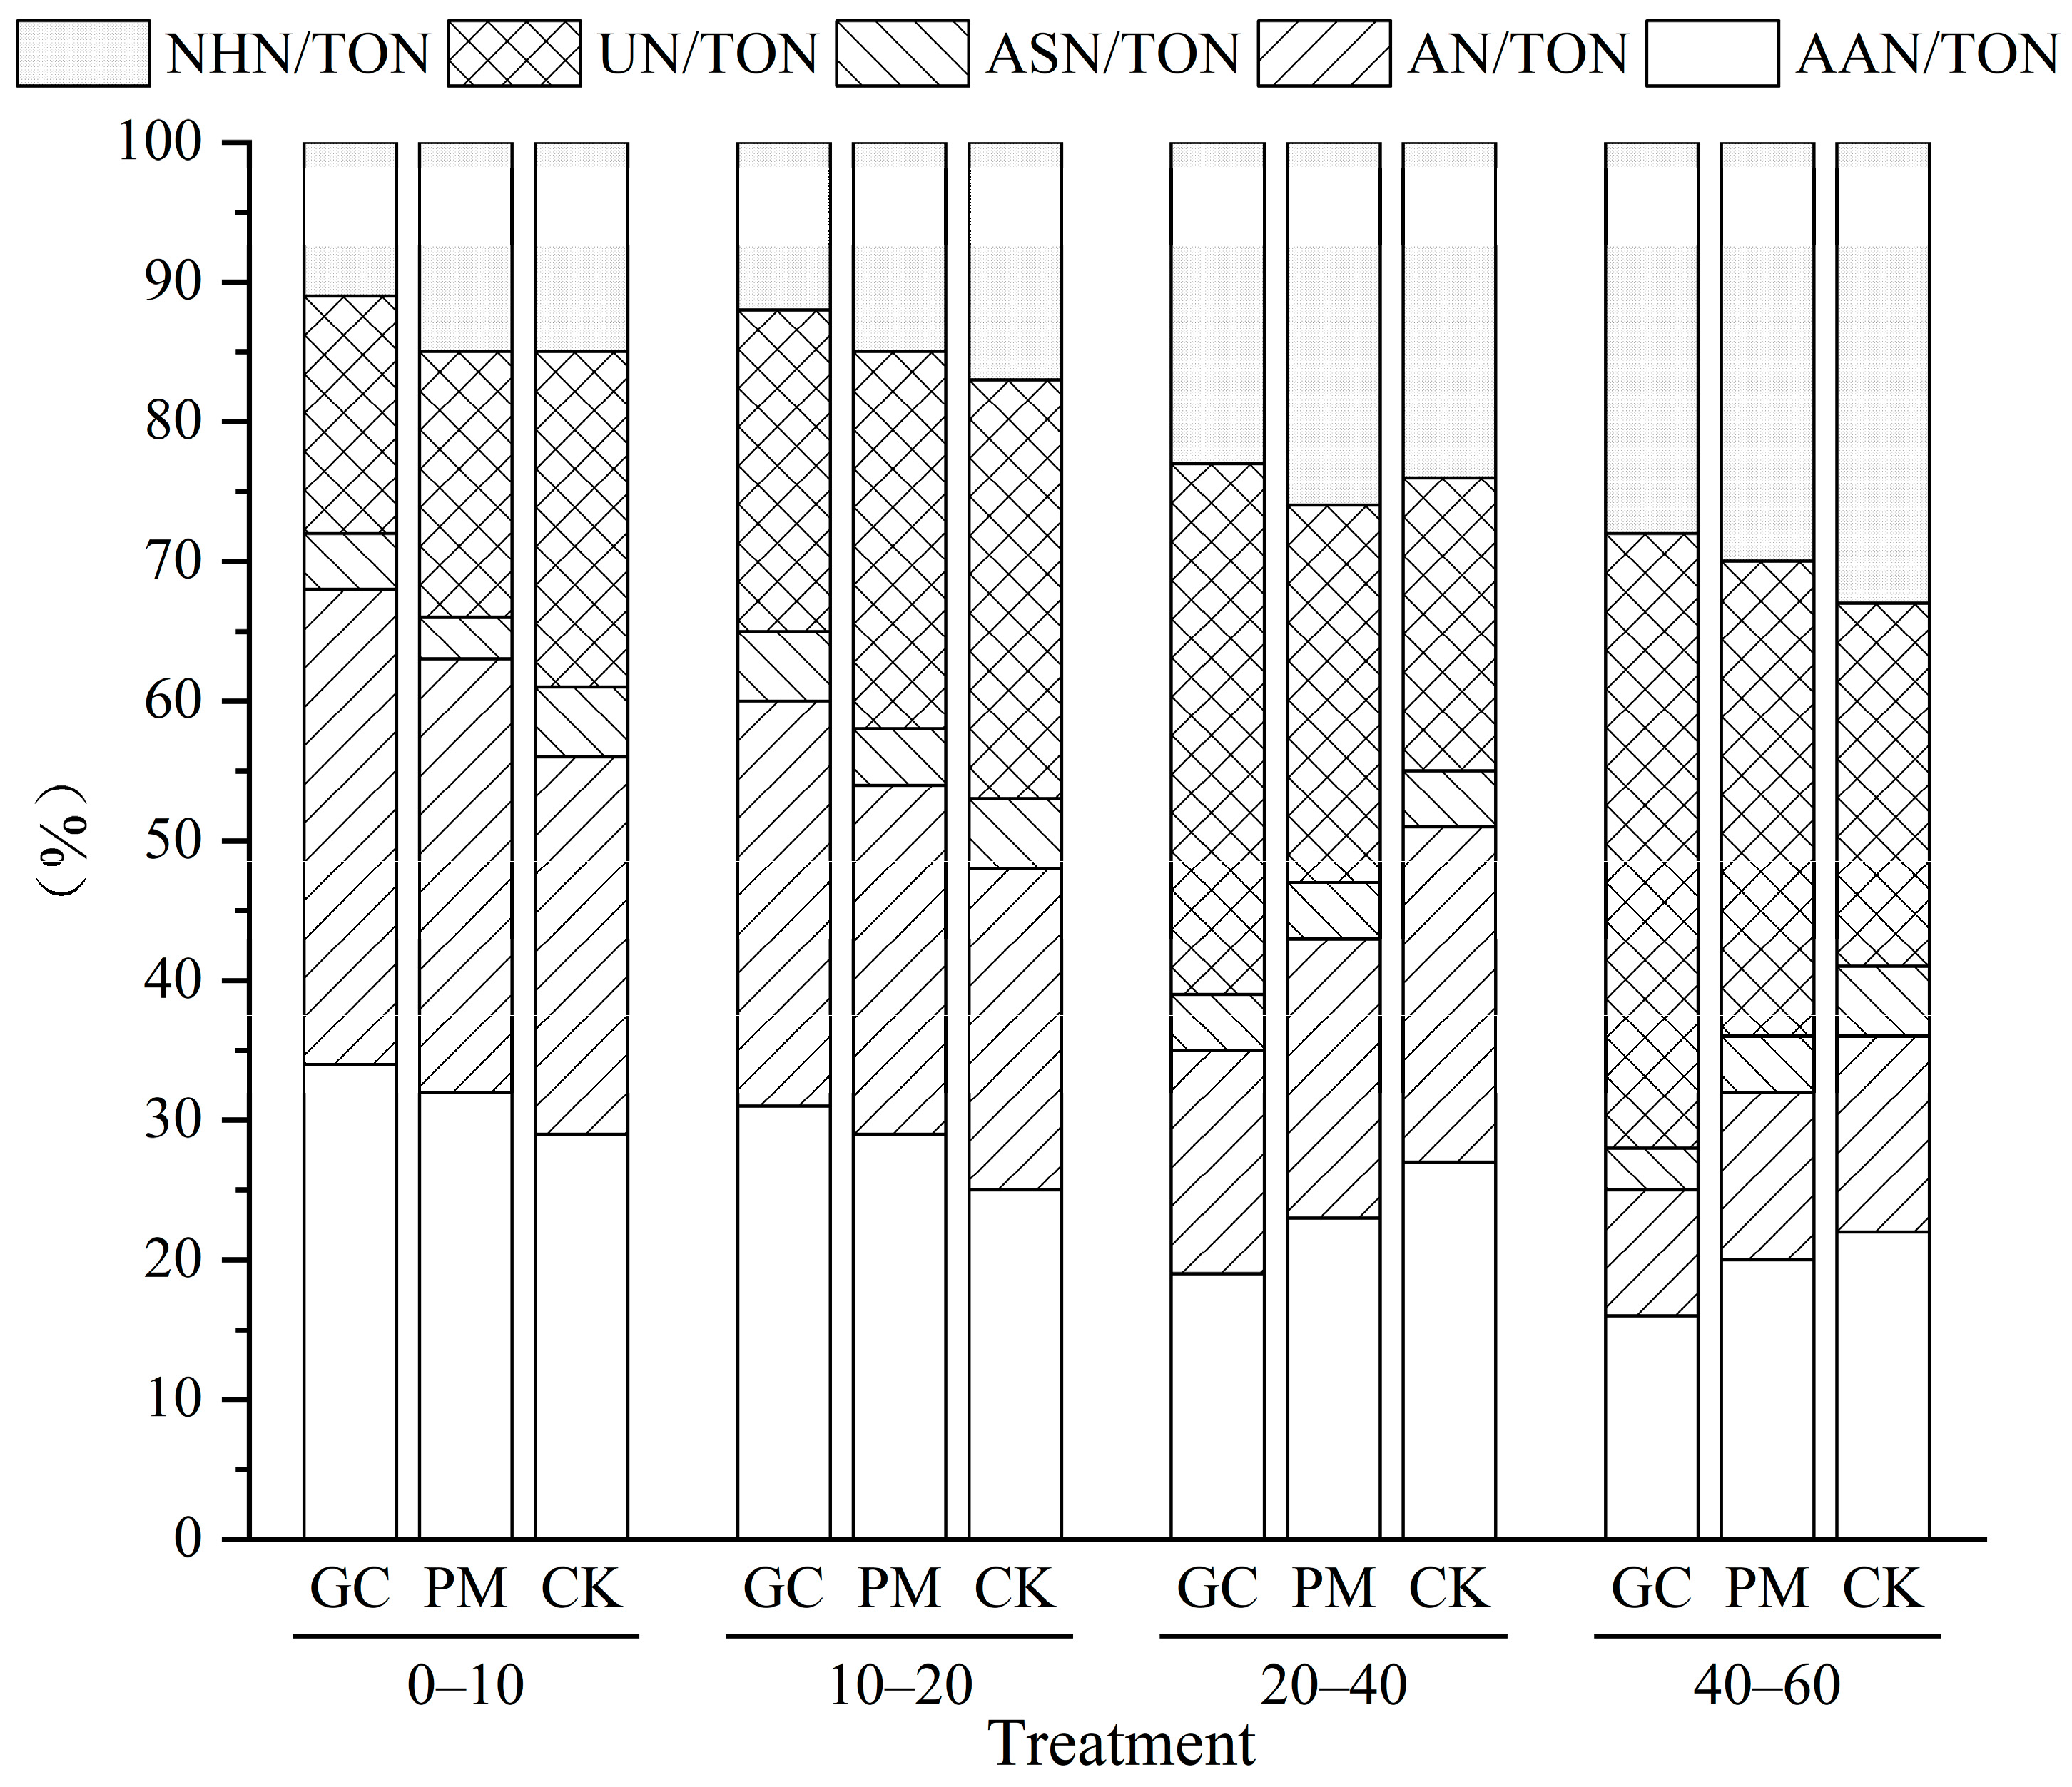
3.6. Proportion of Organic N Fractions

GC and PM treatments both contributed to the accumulation of active organic N within the 0–20 cm soil horizon (Figure 7). In the GC and PM treatments, the average proportion of active organic N within the 0–20 cm soil horizon was 48% and 47%, respectively. Both treatments significantly increased the proportion of stable organic N within the 20–60 cm soil horizon. The average proportion of stable organic N within the 20–60 cm soil horizon was 67% and 66% in the GC and PM treatments, respectively. The proportion of active organic N decreased with soil depth across all treatments. The proportion of active organic N within the 0–10 cm soil horizon was 50% and 48% in the GC and PM treatments, and it was 33% and 34% in the GC and PM treatments in the 40–60 cm soil layer, respectively.

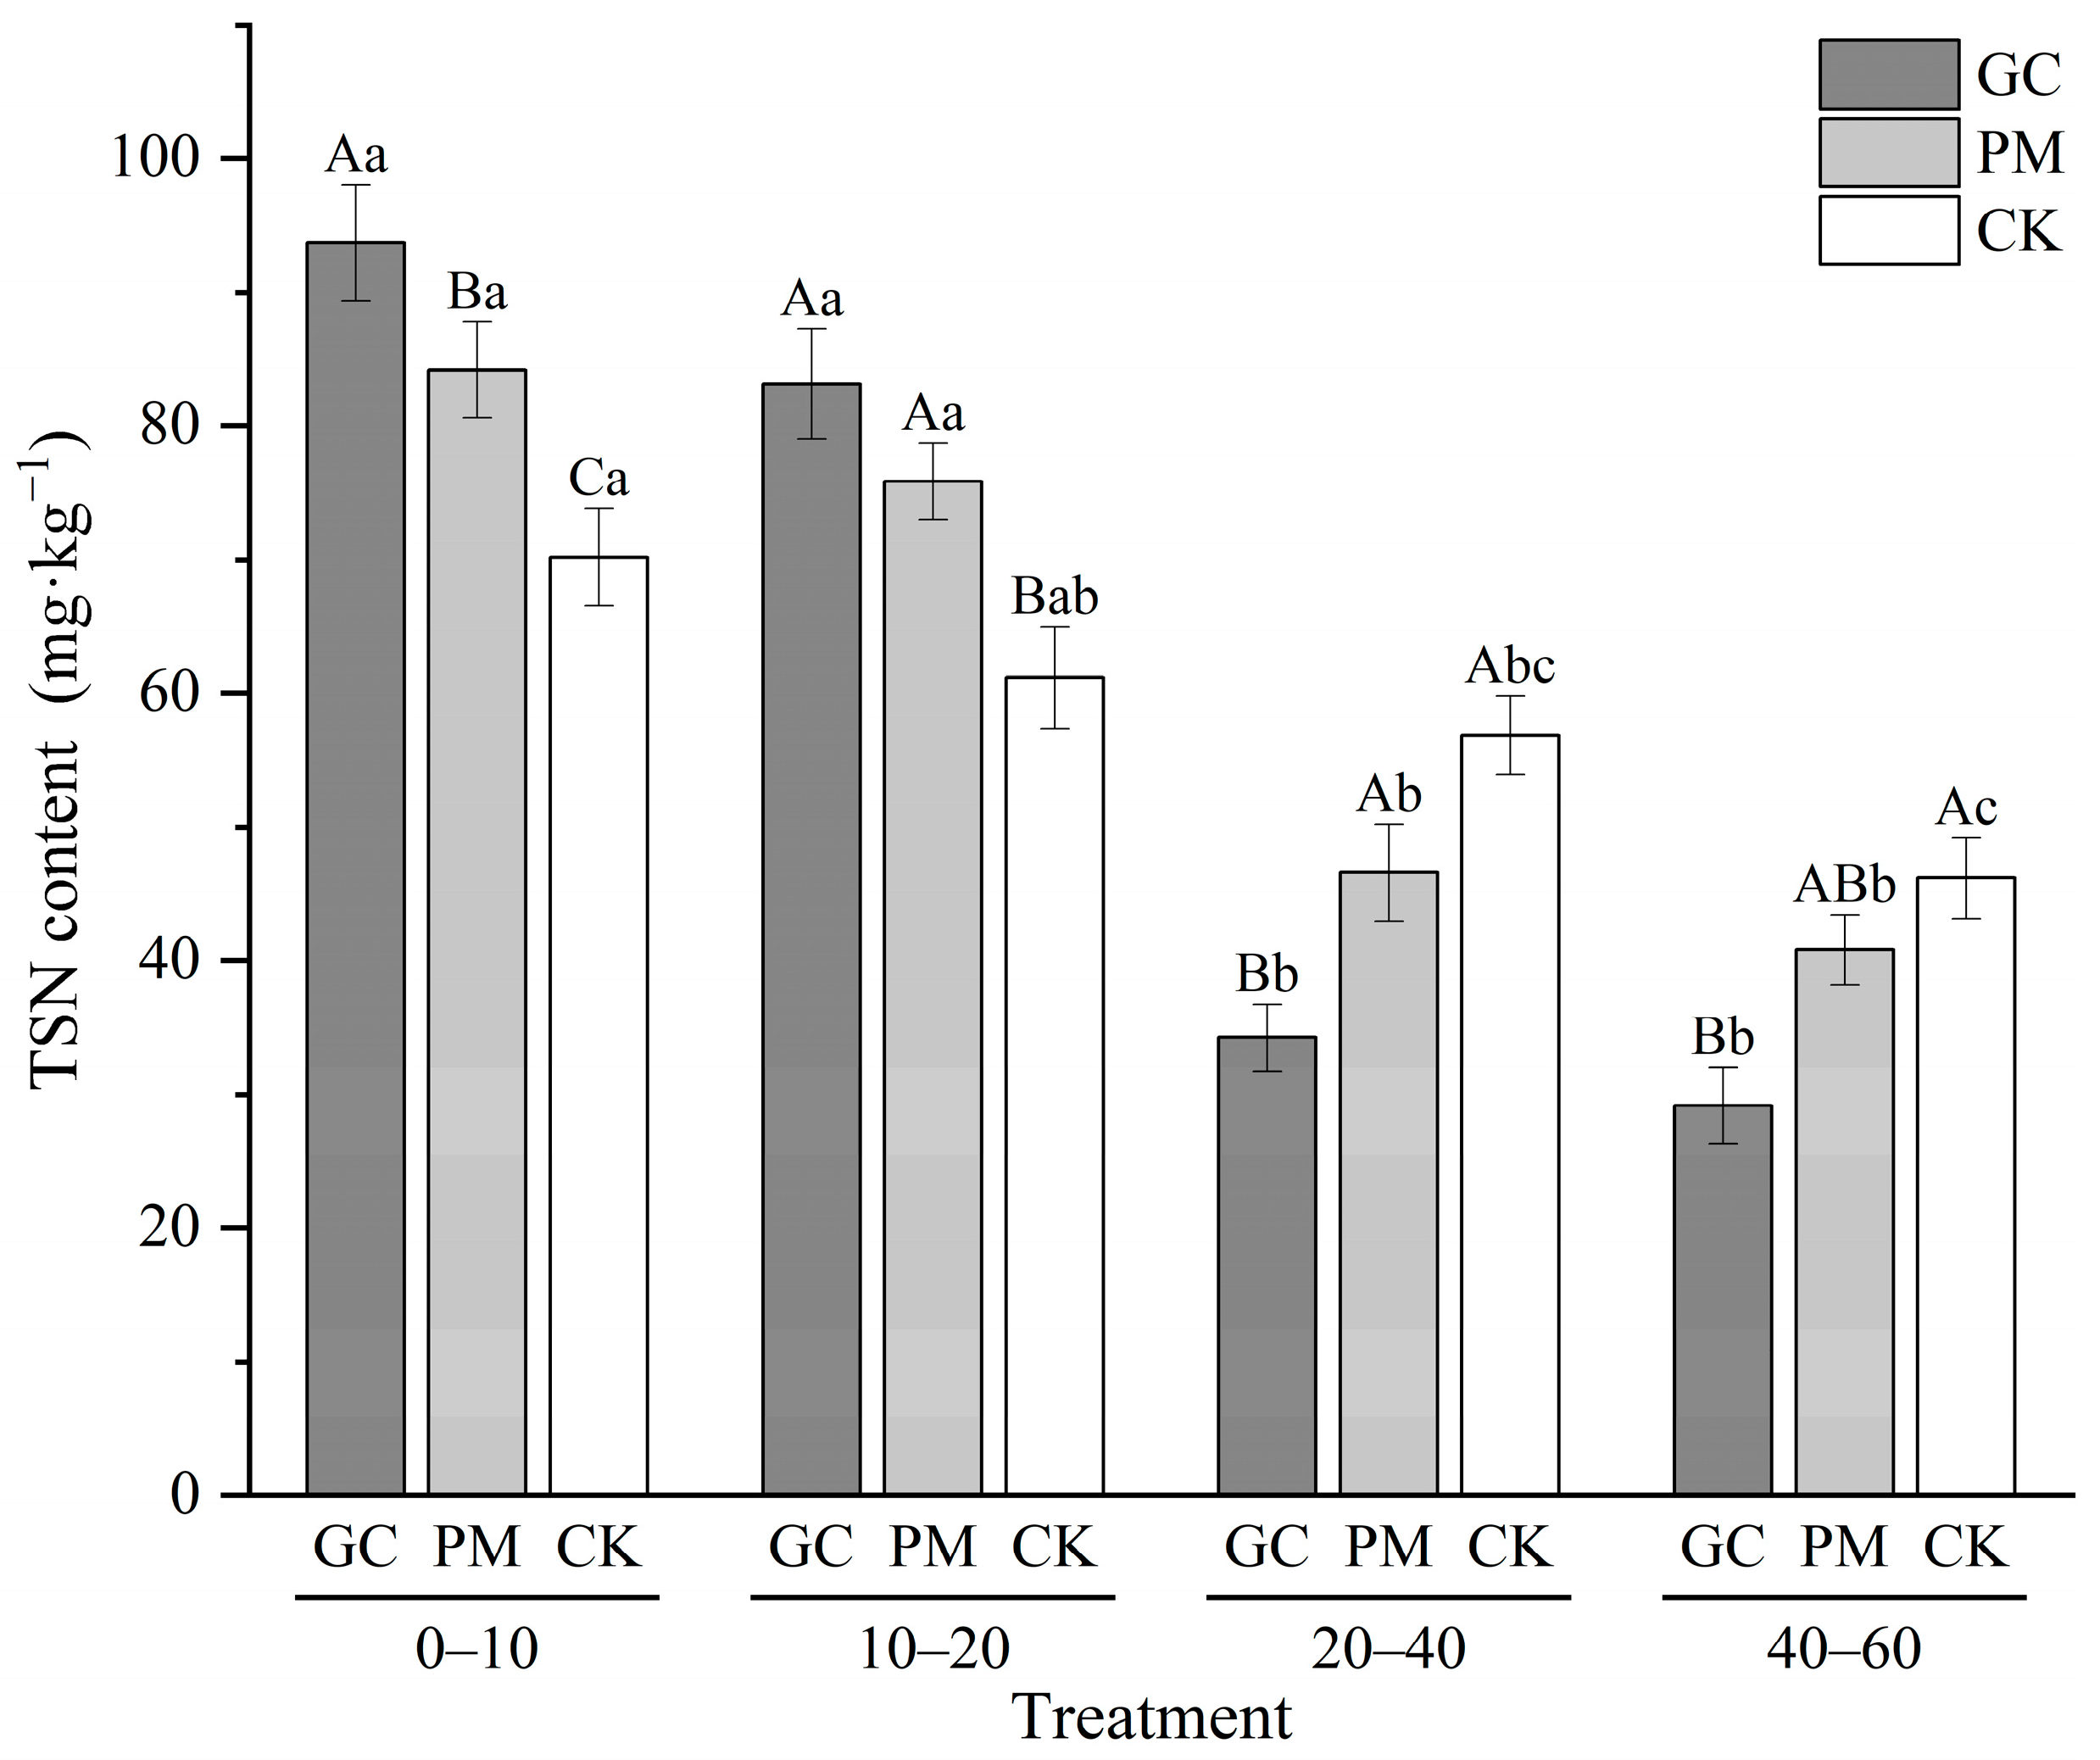
3.7. Total Soluble N

The TSN content in the 0–20 cm soil horizon was notably higher under the GC and PM treatments compared to the CK. In contrast, TSN levels in the 20–60 cm soil horizon were lower under the GC and PM treatments than in the CK (Figure 8). For the 0–20 cm horizon, average TSN levels reached 88.75 and 80.34 mg·kg−1 under the GC and PM treatments, representing increases of 33.80% and 21.13%, respectively, over the CK. Conversely, in the 20–60 cm horizon, the average TSN content was 37.70 and 41.11 mg·kg−1 in the GC and PM treatments, reflecting reductions of 29.13% and 22.73%, respectively, compared to the CK. The TSN concentration declined with increasing soil depth across both treatments. Specifically, TSN levels in the 0–10 cm horizon were 68.70% and 49.91% higher in the GC and PM treatments, respectively, than in the 40–60 cm horizon.

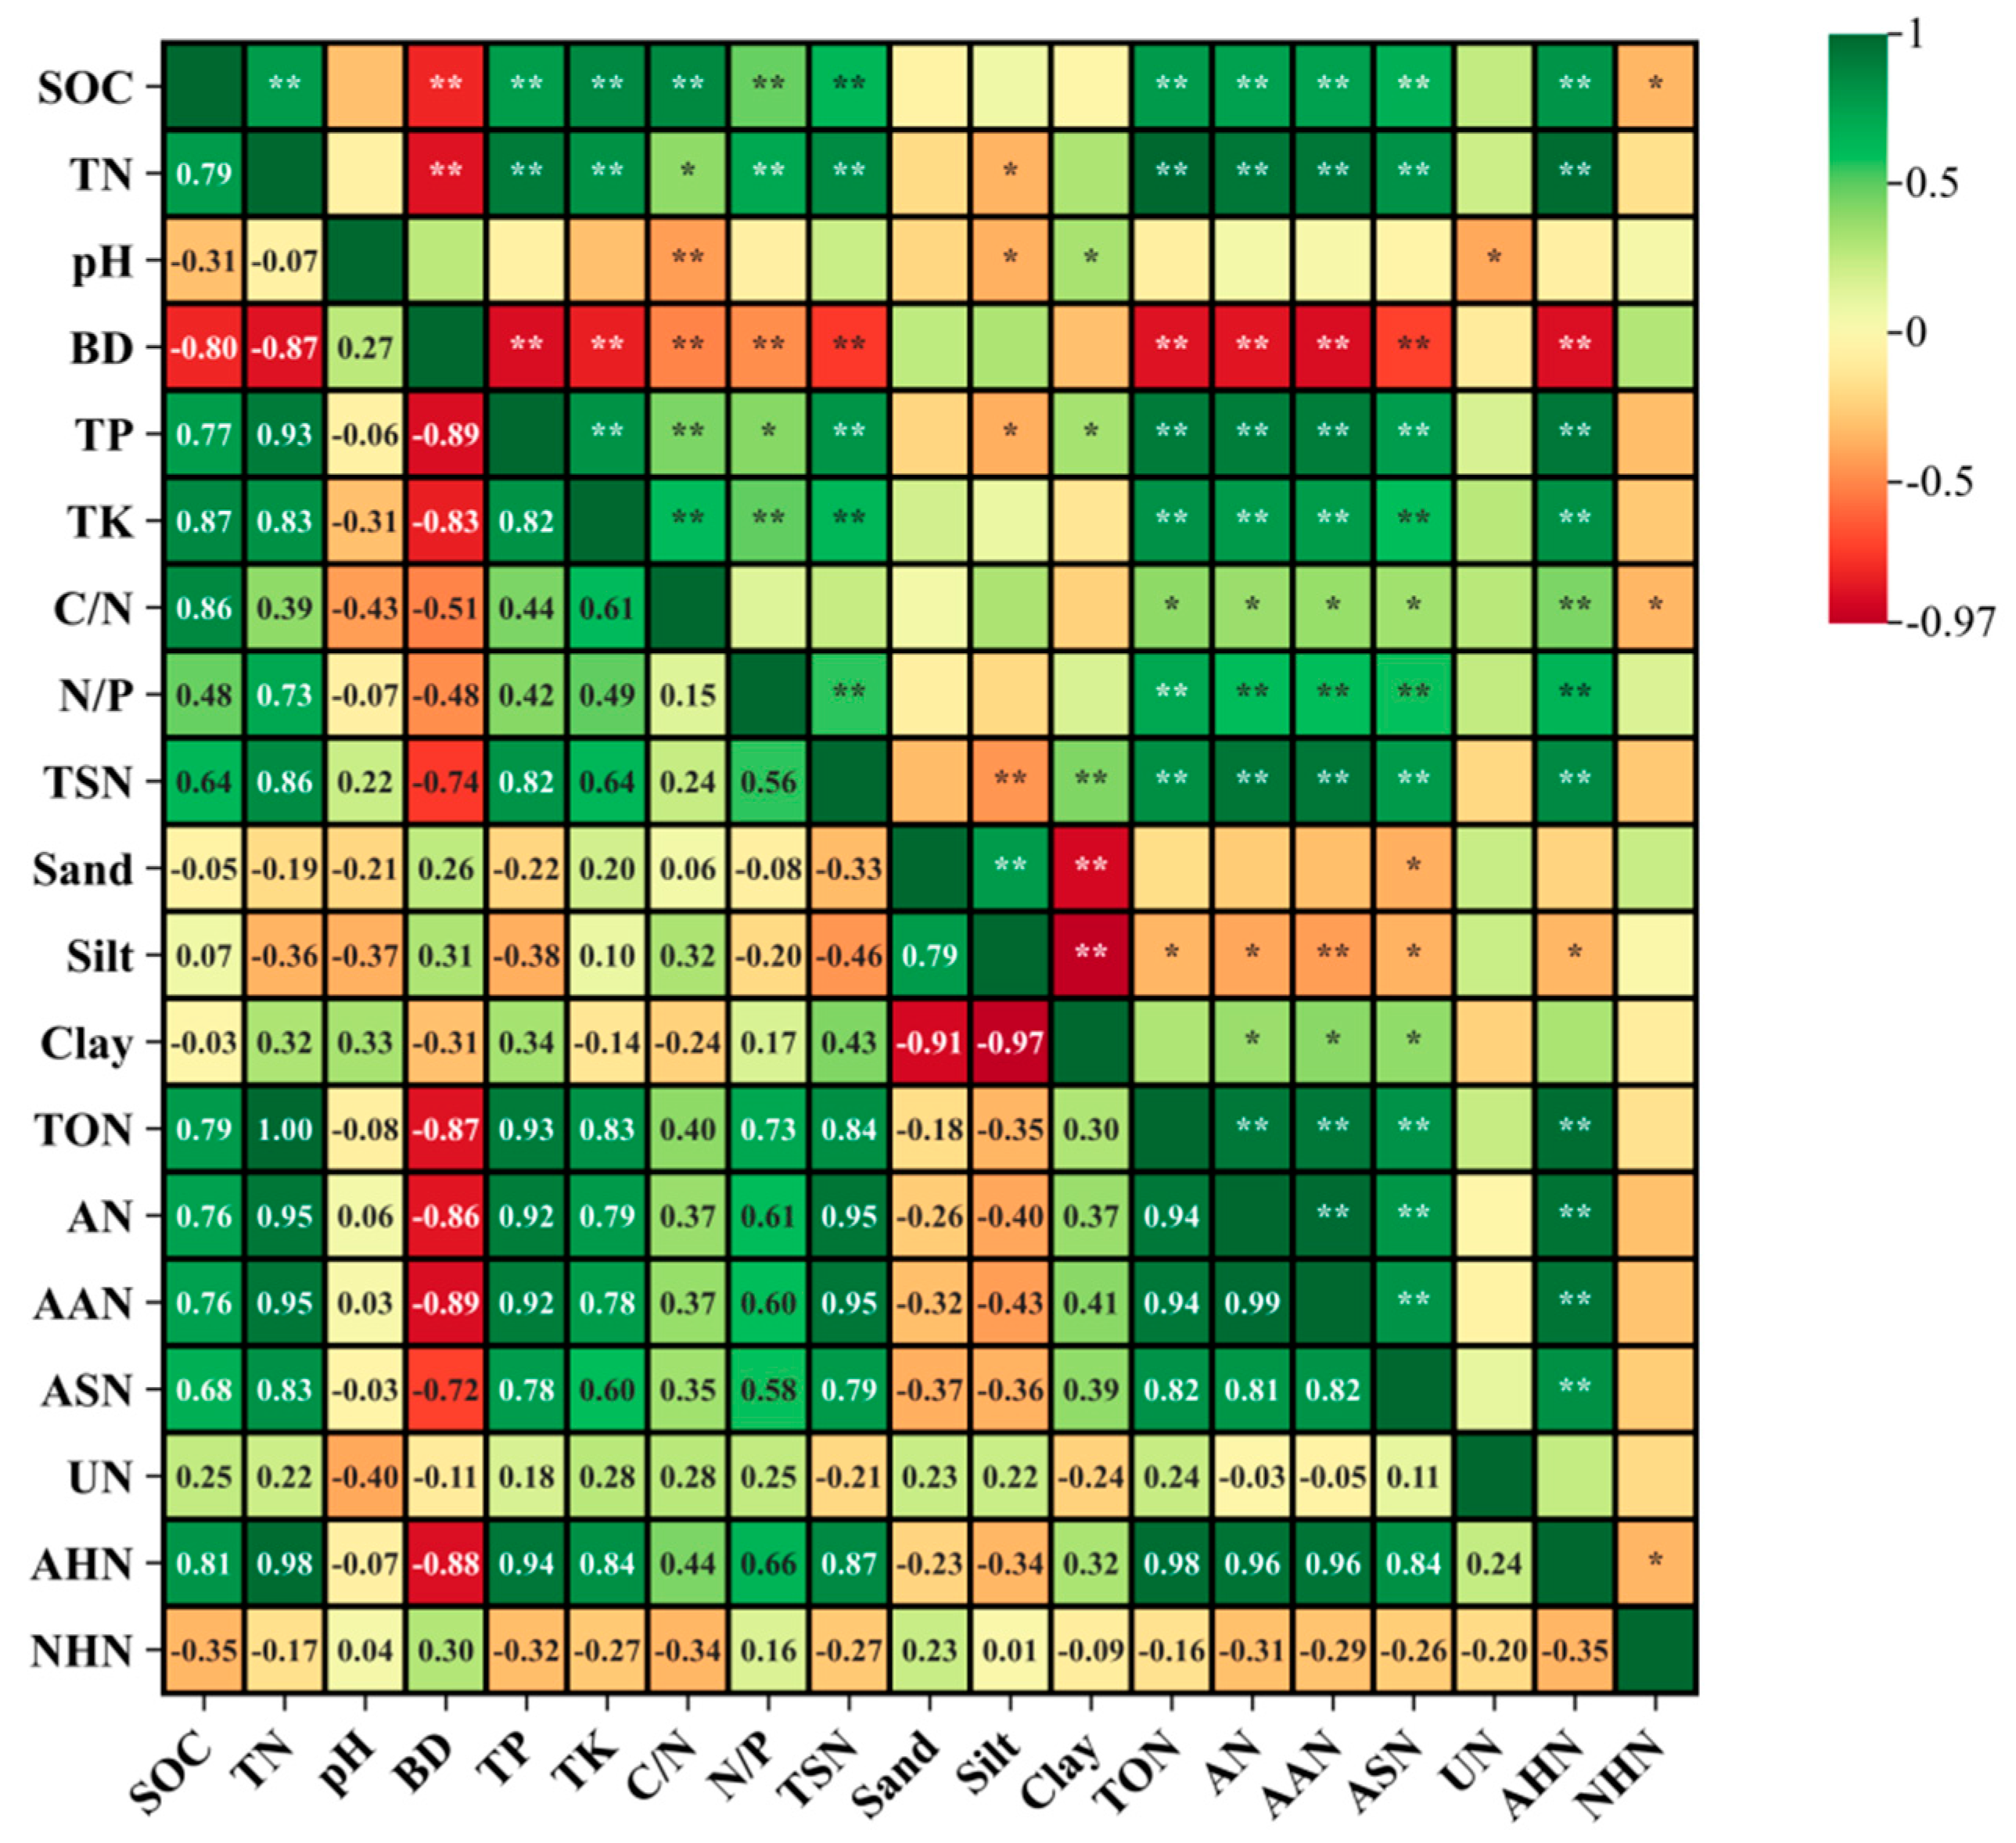
3.8. Relationships between Soil Physicochemical Properties, Soil Organic N Fractions, and Total Soluble N Pools

The soil organic N fractions were significantly correlated with soil physicochemical properties (Figure 9). AHN, AN, and AAN were all highly positively correlated with SOC, TN, TP, and TSN. ASN was significantly correlated with all soil physicochemical properties except pH. UN was highly negatively correlated with pH and BD and positively correlated with SOC, TN, and C/N. NHN was not significantly correlated with any soil physicochemical properties. Active organic N fractions (AN, AAN, ASN) and UN in stable organic N were highly negatively correlated with BD. TN was most strongly correlated with AN, AAN, and ASN.
Based on the results of the correlation analysis, a stepwise regression analysis was used to identify the significant predictors of TSN and construct the optimal regression model. The stepwise regression analysis was performed using organic N fractions (AN, AAN, ASN, UN, NHN) and soil physicochemical properties as the independent variables and TSN as the dependent variable. After eliminating irrelevant variables, the resulting regression equation for TSN was TSN = 0.372AN − 0.053NHN + 18.473 (p < 0.01, R2 = 0.925). This regression equation indicates that AN and NHN are significant factors affecting the TSN in orchard soils. AN positively influenced TSN, while NHN exhibited a negative impact on TSN. The coefficient for AN was much larger than that for NHN, indicating that AN was the most influential factor affecting TSN.

4. Discussion

4.1. Effect of Cover Measures on the Soil Physicochemical Properties in Orchards

In the red soil hilly region, GC and PM treatments significantly enhanced the content of SOC, TN, TP, and TK, as well as the C/N and N/P ratios; however, the effects of these treatments decreased with soil depth. In the GC treatment, plants generate organic matter through photosynthesis, and the root systems reduce soil nutrient loss by stabilizing the soil; when plants die, they are decomposed by microorganisms, which releases nutrients and increases levels of N, P, and K [31]. The nutrient content was higher in the PM treatment than in the CK as mulching treatments have been reported to improve soil structure and water retention, which can mitigate erosion under certain conditions [32]. However, the anaerobic environment created by plastic film mulching inhibited microbial activity, which suppressed aerobic microbial activity and organic matter decomposition and resulted in reduced nutrient release through denitrification [33]; this also explains the lower nutrient levels in the PM treatment compared with the GC treatment in this study. Research in semi-arid areas has shown that plastic film mulch improves soil moisture, thereby enhancing soil physicochemical properties more effectively than grass cover [34]. Since soil moisture is not a limiting factor in the red soil hilly region, soil physicochemical properties were enhanced in the GC treatment compared with the PM treatment in this study. Both GC and PM increased soil pH, but the increase was less pronounced in the GC treatment than in the PM treatment. This might stem from the fact that the PM treatment created an anaerobic environment, which enhanced denitrification. The process of converting nitrate to ammonium ions consumes more hydrogen ions, which results in a more noticeable increase in soil pH [35]. Both GC and PM significantly reduced soil BD, and GC had a more pronounced effect than PM. This might be because the organic acids and other substances secreted by the grass roots can promote the cementation of soil particles and the formation of aggregates, thereby increasing soil porosity and reducing soil BD [36]. In summary, in the red soil hilly region, both GC and PM can improve soil physicochemical properties in orchards, and GC had a more comprehensive effect than PM on soil fertility.

4.2. Effect of Cover Measures on Soil Organic N Fractions in Orchards

In the red soil hilly region, both GC and PM treatments significantly increased TON in the soil, and the increase in TON was more pronounced in the GC treatment than in the PM treatment. Similar findings in the Loess Plateau Region were obtained by [37]. They discovered that covering orchards with Siratro could increase the soil organic N content, and they attributed this to the enhanced relative abundance of bacteria, such as Mycobacterium and MND1, as well as enzymes such as catalase and β-N-acetylglucosaminidase. In this study, the organic N content gradually decreased with soil depth, which likely stemmed from the reduction in the relative abundance of bacteria and the activity of soil N enzymes. The levels of active organic N within the 0–20 cm soil horizon were significantly higher in the GC and PM treatments than in the CK; levels of active organic N within the 20–60 cm soil horizon were significantly lower in the GC and PM treatments than in the CK. Previous studies have found that plant roots are mainly distributed in the surface soil, which helps improve soil structure, reduce nutrient leaching in the root zone, and maintain the active organic N content in the surface layer [38,39]. In addition, grass cover can increase soil organic matter and soil β-glucosidase activity, which promotes the mineralization and transformation of organic N, thereby significantly increasing the content of active organic N [40]. Yin et al. [41] studied nutrient loss in Southwest China and found that cover treatments prevented the leaching and movement of organic N, thus reducing its content in the deeper soil layers. The ASN content was higher in the CK than in the PM treatment. Given the high efficiency of aerobic microorganisms in decomposing organic matter, frequent soil disturbances in the clean tillage treatment increase the abundance of aerobic microorganisms. These microorganisms use aerobic respiration to release a large amount of energy, which drives the degradation of complex organic molecules and results in the release and formation of more ASN [42]. The content of stable organic N in the surface layer was lower in the GC and PM treatments than in the CK. Wang et al. [43] found that stable organic N in the soil can be transformed into active organic N via microorganisms through the secretion of proteases and cellulases, which convert it into more easily utilizable forms. The main microbial species that mediate the conversion of active organic N are Pseudomonas and Bacillus, and the activity of Pseudomonas and Bacillus increases under cover conditions. We found that the content of stable organic N in the surface soil was reduced in the GC and PM treatments. Active organic N (AN, AAN, ASN) was significantly positively correlated with TN, TP, and SOC, and stable organic N (UN, NHN) was not significantly correlated with environmental factors. Active organic N, due to its ease of decomposition and high biological activity, is directly affected by microbial activity and enzymatic reactions, which are regulated by soil nutrient levels (TN, TP, SOC) [44,45]. In contrast, stable organic N, owing to its chemical and physical stability, is primarily affected by long-term soil formation processes and environmental conditions, and it does not show a significant response to short-term changes in environmental factors [46]. In conclusion, GC and PM significantly increased topsoil TON, and this increase was mainly derived from active organic N; the GC treatment had a more pronounced effect on active organic N than the PM treatment in the red soil hilly region.

4.3. Effect of Cover Measures on the Total Soluble N Pools in Orchard Soil

In the red soil hilly region, the TSN content was substantially elevated within the 0–20 cm soil horizon in the GC and PM treatments, and it was markedly reduced within the 20–60 cm soil horizon in the CK. The suitable soil environment created by the GC and PM treatments promoted the mineralization of organic N and N fixation by microorganisms; it also reduced the loss of TSN through runoff, erosion, volatilization, and leaching [47,48,49]. In addition, grass cover promoted the activity of proteases, which mediate the breakdown of complex proteins into small peptides and amino acids, thereby increasing TSN [50]. In comparison, PM stimulated ammonification enzyme activity, promoting the mineralization of organic nitrogen and raising TSN levels [51]. Our findings also revealed that TSN concentration in deeper soil layers was considerably lower under the GC treatment than in the PM treatment and CK. The GC treatment boosted active organic nitrogen levels in surface soil. Active organic nitrogen enhances soil aggregate stability, restricting TSN migration through water flow and limiting its buildup in lower soil layers [52]. PM treatment mitigates rainwater leaching, reducing TSN accumulation in deeper soil strata [53]. The Pearson correlation analysis showed that TSN was significantly positively correlated with the TN, TP, SOC, and clay content, but it was significantly negatively correlated with the sand and silt content. TN, TP, and SOC were positively correlated with the active organic N fractions (AN, AAN, ASN) in Figure 9. TSN was mainly derived from the mineralization of active organic N [54]; it thus increased with TN, TP, and SOC. Clay particles are the smallest particles in soil, with a large specific surface area and strong adsorption capacity, which help retain TSN. Soils with a high sand and silt content typically have large pore spaces and fast water infiltration rates, which makes N prone to leaching with water and leads to a decrease in TSN [52,53]. The regression equation indicated that AN and NHN were the two factors affecting the TSN in orchard soils: TSN = 0.372AN − 0.053NHN + 18.473 (p < 0.01, R2 = 0.925). The positive coefficient of AN (0.372) highlights its significant role in increasing TSN, while the negative coefficient of NHN (−0.053) reflects its stabilizing role, as it functions primarily as a long-term nitrogen reservoir with limited short-term availability. TSN in the soil mainly consists of active organic N, ammonium N, and nitrate N [10]. Proteins and amino acids in the soil can be rapidly mineralized into AN by soil microorganisms. AN is directly converted to NH4+ by microbial activity, which may be further converted to NO3 for plant uptake [55]. AAN is first broken down into amino acids and then deaminated to NH4+. ASN is decomposed into amino sugars and further into ammonium or other usable N forms. Although NHN has a complex structure and serves as a stable N reservoir in soil, NHN was negatively correlated with TSN. In conclusion, the differences in TSN among the treatments (GC > PM > CK) were largely driven by the availability of active nitrogen forms, particularly AN, which plays a critical role in enhancing TSN. NHN, while present in higher amounts under GC, serves as a stable nitrogen pool with limited short-term impact. Thus, the GC treatment was the most effective in enhancing the nitrogen supply capacity in the red soil hilly region, as demonstrated by both the regression model and the experimental results.
This study has several limitations: microbial community dynamics were not directly measured, which limits the understanding of the nitrogen cycling processes; short-term data were collected, preventing insights into seasonal variations; and site-specific findings from a single orchard may limit generalizability. Additionally, the economic feasibility of the cover treatments was not assessed, and spatial variability in soil properties could be further explored through finer-scale sampling or multi-site trials. Future research should address these aspects to enhance the robustness and practical relevance of the results. Our findings provide a foundation for improving soil fertility and nitrogen management in citrus orchards, with important implications for enhancing soil structure, nutrient cycling, and sustainable orchard management practices.

5. Conclusions

Our study demonstrates that grass cover (GC) and plastic mulch (PM) treatments improved the soil physicochemical properties in citrus orchards in the red soil hilly region, with GC showing more comprehensive benefits than PM. These improvements in soil properties led to increases in organic nitrogen fractions, especially active organic nitrogen (AN, AAN, ASN), which are essential for soil fertility and nitrogen availability. GC treatment was particularly effective in increasing AN, which plays a dominant role in boosting total soluble nitrogen (TSN), as indicated by the regression model. The regression equation for TSN (TSN = 0.372AN − 0.053NHN + 18.473 (p < 0.01, R2 = 0.925)) highlights AN as a major driver of TSN accumulation, while NHN plays a limited role due to its stability and slow release. These findings emphasize that active nitrogen forms are crucial for maintaining nitrogen supply, especially in surface soil. Both GC and PM improved soil structure and fertility, but the anaerobic conditions under PM limited microbial activity, resulting in lower AN levels compared to GC. The predictive power of the regression model is limited to the specific environmental factors studied here. Future research should incorporate multi-site trials and cross-validation techniques to enhance the robustness of the findings. Further exploration of the economic feasibility of these treatments and the microbial community dynamics involved in nitrogen cycling will provide deeper insights into sustainable nitrogen management strategies. In summary, this study highlights the importance of GC and PM treatments in enhancing nitrogen availability and soil fertility in citrus orchards, with GC providing the most consistent improvements.

Author Contributions

H.L. contributed to Data curation, Writing—original draft, and Writing—review and editing. B.Z. was responsible for Investigation and Formal analysis. Z.Z. conducted Formal analysis and Investigation. L.W. contributed to Investigation. Z.W. worked on Visualization. C.X. contributed to Resources. F.J. was involved in Methodology and Resources. J.L. contributed to Conceptualization and Software. Y.H. was responsible for Funding acquisition and Supervision. Y.Z. handled Conceptualization, Project administration, and Writing—review and editing. All authors have read and agreed to the published version of the manuscript.

Funding

This research was funded by the (1) Water Conservancy Science and Technology Project of Fujian Province (MSK202429 and KJG21009A) and (2) The Significant Science And Technology Projects of the Ministry of Water Resources (SKS-2022073).

Data Availability Statement

The dataset is available on request from the authors. The raw data supporting the conclusions of this article will be made available by the authors on request.

Acknowledgments

We thank the two programs that funded this study. We thank Yihao Lü for assistance with soil sampling and experiments. We thank the editors and reviewers for providing comments that helped improve the manuscript.

Conflicts of Interest

The authors declare that they have no known competing financial interests or personal relationships that could have appeared to influence the work reported in this paper.

References

  1. Dong, Y.; Yang, J.-L.; Zhao, X.-R.; Yang, S.-H.; Mulder, J.; Dörsch, P.; Zhang, G.-L. Seasonal dynamics of soil pH and N transformation as affected by N fertilization in subtropical China: An in situ 15N labeling study. Sci. Total Environ. 2022, 816, 151596. [Google Scholar] [CrossRef] [PubMed]
  2. Plett, D.C.; Ranathunge, K.; Melino, V.J.; Kuya, N.; Uga, Y.; Kronzucker, H.J.; Xu, G. The intersection of nitrogen nutrition and water use in plants: New paths toward improved crop productivity. J. Exp. Bot. 2020, 71, 4452–4468. [Google Scholar] [CrossRef] [PubMed]
  3. Li, Q.; Wang, J.; Yuan, H.; Chen, B.; Zhuang, S. Climatic effects on soil organic nitrogen fractions and amino acid chirality in paddy soils. Pedosphere 2023, 33, 579–588. [Google Scholar] [CrossRef]
  4. Miller, A.E.; Bowman, W.D.; Suding, K.N. Plant uptake of inorganic and organic nitrogen: Neighbor identity matters. Ecology 2007, 88, 1832–1840. [Google Scholar] [CrossRef]
  5. Dangi, S.; Gao, S.; Duan, Y.; Wang, D. Soil microbial community structure affected by biochar and fertilizer sources. Appl. Soil Ecol. 2020, 150, 103452. [Google Scholar] [CrossRef]
  6. Dimkpa, C.O.; Fugice, J.; Singh, U.; Lewis, T.D. Development of fertilizers for enhanced nitrogen use efficiency—Trends and perspectives. Sci. Total Environ. 2020, 731, 139113. [Google Scholar] [CrossRef]
  7. Farzadfar, S.; Knight, J.D.; Congreves, K.A. Soil organic nitrogen: An overlooked but potentially significant contribution to crop nutrition. Plant Soil 2021, 462, 7–23. [Google Scholar] [CrossRef]
  8. Zhu, Z.; Chen, D. Nitrogen fertilizer use in China–Contributions to food production, impacts on the environment and best management strategies. Nutr. Cycl. Agroecosyst. 2002, 63, 117–127. [Google Scholar] [CrossRef]
  9. Bremner, J.M. Organic Forms of Soil Nitrogen. In Methods of Soil Analysis; Black, C.A., Ed.; American Society of Agronomy: Madison, WI, USA, 1965; Volume 9, pp. 1238–1255. [Google Scholar]
  10. Su, H.; Zhang, Y.; Wu, G.; Chen, Z.; Jiang, N.; Qiu, W.; Chen, L. Effects of different maize residue managements on soil organic nitrogen cycling in different soil layers in northeast China. GCB Bioenergy 2024, 16, e13123. [Google Scholar] [CrossRef]
  11. Chen, M.; Xu, J.; Li, Z.; Li, D.; Wang, Q.; Zhou, Y.; Guo, W.; Ma, D.; Zhang, J.; Zhao, B. Long-term nitrogen fertilization-induced enhancements of acid hydrolyzable nitrogen are mainly regulated by the most vital microbial taxa of keystone species and enzyme activities. Sci. Total Environ. 2023, 874, 162463. [Google Scholar] [CrossRef]
  12. Sistla, S.A.; Schimel, J.P. Seasonal patterns of microbial extracellular enzyme activities in an arctic tundra soil: Identifying direct and indirect effects of long-term summer warming. Soil Biol. Biochem. 2013, 66, 119–129. [Google Scholar] [CrossRef]
  13. Hu, Y.; Zheng, Q.; Noll, L.; Zhang, S.; Wanek, W. Direct measurement of the in situ decomposition of microbial-derived soil organic matter. Soil Biol. Biochem. 2020, 141, 107660. [Google Scholar] [CrossRef]
  14. Xu, L.; Chen, H.; Zhou, Y.; Zhang, J.; Nadeem, M.Y.; Miao, C.; You, J.; Li, W.; Jiang, Y.; Ding, Y.; et al. Long-term straw returning improved soil nitrogen sequestration by accelerating the accumulation of amino acid nitrogen. Agric. Ecosyst. Environ. 2024, 362, 108846. [Google Scholar] [CrossRef]
  15. Stevenson, F.J. Organic Forms of Soil Nitrogen. Nitrogen Agric. Soils 1982, 22, 67–122. [Google Scholar] [CrossRef]
  16. Jones, D.L.; Shannon, D.; Murphy, D.V.; Farrar, J. Role of dissolved organic nitrogen (DON) in soil N cycling in grassland soils. Soil Biol. Biochem. 2004, 36, 749–756. [Google Scholar] [CrossRef]
  17. Murphy, D.V.; Macdonald, A.J.; Stockdale, E.A.; Goulding, K.W.T.; Fortune, S.; Gaunt, J.L.; Poulton, P.R.; Wakefield, J.A.; Webster, C.P.; Wilmer, W.S. Soluble organic nitrogen in agricultural soils. Biol. Fertil. Soils 2000, 30, 374–387. [Google Scholar] [CrossRef]
  18. Christou, M.; Avramides, E.J.; Jones, D.L. Dissolved organic nitrogen dynamics in a Mediterranean vineyard soil. Soil Biol. Biochem. 2006, 38, 2265–2277. [Google Scholar] [CrossRef]
  19. Ji, J.; Zhang, Y.; Zhang, Y.; Yu, N.; Zou, H.; Li, Y.; Liu, S.; Tong, Y. Soil nitrogen mineralisation dynamics under long-term different irrigation methods in greenhouses. Acta Agric. Scand. Sect. B—Soil Plant Sci. 2014, 63, 117–126. [Google Scholar] [CrossRef]
  20. Ros, G.H.; Hoffland, E.; van Kessel, C.; Temminghoff, E.J.M. Extractable and dissolved soil organic nitrogen—A quantitative assessment. Soil Biol. Biochem. 2009, 41, 1029–1039. [Google Scholar] [CrossRef]
  21. VanZomeren, C.M.; Bhomia, R.K.; Tfaily, M.M.; Inglett, K.S.; Cooper, W.T.; White, J.R.; Reddy, K.R. Influence of vegetation on soil organic nitrogen composition and mineralization in a subtropical wetland. Ecol. Eng. 2024, 200, 107186. [Google Scholar] [CrossRef]
  22. Yang, J.; Guo, W.; Wang, F.; Wang, F.; Zhang, L.; Zhou, B.; Xing, S.; Yang, W. Dynamics and influencing factors of soluble organic nitrogen in paddy soil under different long-term fertilization treatments. Soil Tillage Res. 2021, 212, 105077. [Google Scholar] [CrossRef]
  23. Han, Y.; Yi, D.; Ye, Y.; Guo, X.; Liu, S. Response of spatiotemporal variability in soil pH and associated influencing factors to land use change in a red soil hilly region in southern China. CATENA 2022, 212, 106074. [Google Scholar] [CrossRef]
  24. Cui, M.; Zeng, L.; Qin, W.; Feng, J. Measures for reducing nitrate leaching in orchards: A review. Environ. Pollut. 2020, 263, 114553. [Google Scholar] [CrossRef] [PubMed]
  25. Chen, C.R.; Xu, Z.H.; Zhang, S.L.; Keay, P. Soluble Organic Nitrogen Pools in Forest soils of Subtropical Australia. Plant Soil 2005, 277, 285–297. [Google Scholar] [CrossRef]
  26. Yang, S.; Dong, Y.; Wu, H.; Song, X.; Zhao, X.; Yang, J.; Zhang, G.-L. Deep accumulation of soluble organic nitrogen after land-use conversion from woodlands to orchards in a subtropical hilly region. Sci. Total Environ. 2023, 863, 160931. [Google Scholar] [CrossRef]
  27. Iqbal, R.; Raza, M.A.S.; Valipour, M.; Saleem, M.F.; Zaheer, M.S.; Ahmad, S.; Toleikiene, M.; Haider, I.; Aslam, M.U.; Nazar, M.A. Potential agricultural and environmental benefits of mulches—A review. Bull. Natl. Res. Cent. 2020, 44, 75. [Google Scholar] [CrossRef]
  28. Martínez-García, L.B.; Korthals, G.W.; Brussaard, L.; Mainardi, G.; De Deyn, G.B. Litter quality drives nitrogen release, and agricultural management (organic vs. conventional) drives carbon loss during litter decomposition in agro-ecosystems. Soil Biol. Biochem. 2021, 153, 108115. [Google Scholar] [CrossRef]
  29. Zheng, J.Y.; Zhao, J.S.; Shi, Z.H.; Wang, L. Soil aggregates are key factors that regulate erosion-related carbon loss in citrus orchards of southern China: Bare land vs. grass-covered land. Agric. Ecosyst. Environ. 2021, 309, 107254. [Google Scholar] [CrossRef]
  30. IUSS Working Group WRB. World Reference Base for Soil Resources 2014 (Update2015). International Soil Classification System for Naming Soils and Creating Legends for Soil Maps; World Soil Resources Reports; FAO: Rome, Italy, 2015. [Google Scholar]
  31. Yang, J.; Duan, Y.; Zhang, R.; Liu, C.; Wang, Y.; Li, M.; Ding, Y.; Awasthi, M.K.; Li, H. Connecting soil dissolved organic matter to soil bacterial community structure in a long-term grass-mulching apple orchard. Ind. Crops Prod. 2020, 149, 112344. [Google Scholar] [CrossRef]
  32. El-Beltagi, H.S.; Basit, A.; Mohamed, H.I.; Ali, I.; Ullah, S.; Kamel, E.A.R.; Shalaby, T.A.; Ramadan, K.M.A.; Alkhateeb, A.A.; Ghazzawy, H.S. Mulching as a Sustainable Water and Soil Saving Practice in Agriculture: A Review. Agronomy 2022, 12, 1881. [Google Scholar] [CrossRef]
  33. Dong, Q.; Dang, T.; Guo, S.; Hao, M. Effect of different mulching measures on nitrate nitrogen leaching in spring maize planting system in south of Loess Plateau. Agric. Water Manag. 2019, 213, 654–658. [Google Scholar] [CrossRef]
  34. Gu, Y.-J.; Han, C.-L.; Kong, M.; Shi, X.-Y.; Zdruli, P.; Li, F.-M. Plastic film mulch promotes high alfalfa production with phosphorus-saving and low risk of soil nitrogen loss. Field Crops Res. 2018, 229, 44–54. [Google Scholar] [CrossRef]
  35. Liu, Y.; Huang, Q.; Hu, W.; Qin, J.; Zheng, Y.; Wang, J.; Wang, Q.; Xu, Y.; Guo, G.; Hu, S.; et al. Effects of plastic mulch film residues on soil-microbe-plant systems under different soil pH conditions. Chemosphere 2021, 267, 128901. [Google Scholar] [CrossRef] [PubMed]
  36. Wang, J.; Zhuang, S.; Zhu, Z. Soil organic nitrogen composition and mineralization of paddy soils in a cultivation chronosequence in China. J. Soils Sediments 2017, 17, 1588–1598. [Google Scholar] [CrossRef]
  37. Xu, S.; Zhang, W.; Goodwin, P.H.; Wang, Y.; Zheng, S.-J.; Li, X. Effect of cover crop on soil fertility and bacterial diversity in a banana plantation in southwestern China. Soil Tillage Res. 2024, 240, 106092. [Google Scholar] [CrossRef]
  38. Rosolem, C.A.; Ritz, K.; Cantarella, H.; Galdos, M.V.; Hawkesford, M.J.; Whalley, W.R.; Mooney, S.J. Enhanced Plant Rooting and Crop System Management for Improved N Use Efficiency. Adv. Agron. 2017, 146, 205–239. [Google Scholar] [CrossRef]
  39. Qian, X.; Gu, J.; Pan, H.-j.; Zhang, K.-y.; Sun, W.; Wang, X.-j.; Gao, H. Effects of living mulches on the soil nutrient contents, enzyme activities, and bacterial community diversities of apple orchard soils. Eur. J. Soil Biol. 2015, 70, 23–30. [Google Scholar] [CrossRef]
  40. Nevins, C.J.; Lacey, C.; Armstrong, S. The synchrony of cover crop decomposition, enzyme activity, and nitrogen availability in a corn agroecosystem in the Midwest United States. Soil Tillage Res. 2020, 197, 104518. [Google Scholar] [CrossRef]
  41. Yin, X.; Zhao, L.; Fang, Q.; Zi, R.; Fang, F.; Fan, C.; Ding, G. Effects of biochar on runoff generation, soil and nutrient loss at the surface and underground on the soil-mantled karst slopes. Sci. Total Environ. 2023, 889, 164081. [Google Scholar] [CrossRef]
  42. Brangarí, A.C.; Lyonnard, B.; Rousk, J. Soil depth and tillage can characterize the soil microbial responses to drying-rewetting. Soil Biol. Biochem. 2022, 173, 108806. [Google Scholar] [CrossRef]
  43. Wang, L.; Wang, X.; Song, Y.; Sun, L.; Chen, X.; Wu, J.; Song, C.; Zhao, Y. Slowed down nitrogen mineralization under bacterial community-driven conditions by adding inhibitors during rice straw composting. Bioresour. Technol. 2022, 362, 127778. [Google Scholar] [CrossRef] [PubMed]
  44. Cao, Q.; Wang, Z.; Yang, X.; Shen, Y. The effects of cocksfoot cover crop on soil water balance, evapotranspiration partitioning, and system production in an apple orchard on the Loess Plateau of China. Soil Tillage Res. 2021, 205, 104788. [Google Scholar] [CrossRef]
  45. Tu, A.; Xie, S.; Zheng, H.; Li, H.; Li, Y.; Mo, M. Long-term effects of living grass mulching on soil and water conservation and fruit yield of citrus orchard in south China. Agric. Water Manag. 2021, 252, 106897. [Google Scholar] [CrossRef]
  46. Tian, M.; Jiang, N.; Yu, C.; Zhang, Y.; Qiu, W.; Chen, Z.; Wang, J.; Chen, L. Sensitivity of active and stable organic nitrogen to nitrogen and carbon additions: Insights from enzymatic hydrolyses in a semi-arid steppe. Plant Soil 2024, 1–13. [Google Scholar] [CrossRef]
  47. Li, H.; Wang, L.; Peng, Y.; Zhang, S.; Lv, S.; Li, J.; Abdo, A.I.; Zhou, C.; Wang, L. Film mulching, residue retention and N fertilization affect ammonia volatilization through soil labile N and C pools. Agric. Ecosyst. Environ. 2021, 308, 107272. [Google Scholar] [CrossRef]
  48. Rocha, K.F.; de Souza, M.; Almeida, D.S.; Chadwick, D.R.; Jones, D.L.; Mooney, S.J.; Rosolem, C.A. Cover crops affect the partial nitrogen balance in a maize-forage cropping system. Geoderma 2020, 360, 114000. [Google Scholar] [CrossRef]
  49. Zhou, G.; Gao, S.; Lu, Y.; Liao, Y.; Nie, J.; Cao, W. Co-incorporation of green manure and rice straw improves rice production, soil chemical, biochemical and microbiological properties in a typical paddy field in southern China. Soil Tillage Res. 2020, 197, 104499. [Google Scholar] [CrossRef]
  50. Wang, Y.; Liu, L.; Zhang, J.; Li, D.; Yu, J.; Gao, H.; Li, H.; Zhao, Z. Soil phytoremediation reveals alteration in soil microbial metabolic activities along time gradient of cover crop mulching. Environ. Res. 2022, 209, 112884. [Google Scholar] [CrossRef]
  51. Sun, X.; Tao, R.; Xu, D.; Qu, M.; Zheng, M.; Zhang, M.; Mei, Y. Role of polyamide microplastic in altering microbial consortium and carbon and nitrogen cycles in a simulated agricultural soil microcosm. Chemosphere 2023, 312, 137155. [Google Scholar] [CrossRef]
  52. Wu, H.; Du, S.; Zhang, Y.; An, J.; Zou, H.; Zhang, Y.; Yu, N. Effects of irrigation and nitrogen fertilization on greenhouse soil organic nitrogen fractions and soil-soluble nitrogen pools. Agric. Water Manag. 2019, 216, 415–424. [Google Scholar] [CrossRef]
  53. Zhang, X.; Wang, H.; Hou, H.; Yu, X.; Ma, Y.; Fang, Y.; Lei, K. Did plastic mulching constantly increase crop yield but decrease soil water in a semiarid rain-fed area? Agric. Water Manag. 2020, 241, 106380. [Google Scholar] [CrossRef]
  54. Ridgeway, J.R.; Morrissey, E.M.; Brzostek, E.R. Plant litter traits control microbial decomposition and drive soil carbon stabilization. Soil Biol. Biochem. 2022, 175, 108857. [Google Scholar] [CrossRef]
  55. Mengel, K.; Schneider, B.; Kosegarten, H. Nitrogen compounds extracted by electroultrafiltration (EUF) or CaCl2 solution and their relationships to nitrogen mineralization in soils. J. Plant Nutr. Soil Sci. 1999, 162, 139–148. [Google Scholar] [CrossRef]
Figure 1. Overview of the study area.
Agriculture 14 01879 g001
Figure 2. The different mulching treatments. (a) CK, clean tillage; (b) GC, grass cover; (c) PM, plastic mulch.
Agriculture 14 01879 g002
Figure 3. TON content in orchard soil. Uppercase letters indicate significant differences among treatments within the same soil layer; lowercase letters indicate significant differences among soil layers within the same treatment. CK, clean tillage; GC, grass cover; PM, plastic mulch.
Agriculture 14 01879 g003
Figure 4. Acid-hydrolyzable N content in orchard soil. Uppercase letters indicate significant differences among treatments within the same soil layer; lowercase letters indicate significant differences among soil layers within the same treatment. CK, clean tillage; GC, grass cover; PM, plastic mulch.
Agriculture 14 01879 g004
Figure 5. Active organic N fractions in orchard soil. Uppercase letters indicate significant differences among treatments within the same soil layer; lowercase letters indicate significant differences among soil layers within the same treatment. CK, clean tillage; GC, grass cover; PM, plastic mulch; (a) AAN, amino acid nitrogen; (b) AN, ammonium nitrogen; (c) ASN, amino sugar nitrogen; (d) Active organic nitrogen.
Agriculture 14 01879 g005
Figure 6. Stable organic N fractions in orchard soil. Uppercase letters indicate significant differences among treatments within the same soil layer; lowercase letters indicate significant differences among soil layers within the same treatment. CK, clean tillage; GC, grass cover; PM, plastic mulch; (a) UN, unknown nitrogen; (b) NHN, and non-hydrolyzable nitrogen; (c) Stable organic nitrogen.
Agriculture 14 01879 g006
Figure 7. Proportion of soil organic nitrogen fractions to total organic nitrogen. AAN, amino acid nitrogen; AN, ammonium nitrogen; ASN, amino sugar nitrogen; UN, unknown nitrogen; NHN, non-hydrolyzable nitrogen; TON, total organic nitrogen; GC, grass cover; PM, plastic mulch; CK, clean tillage.
Agriculture 14 01879 g007
Figure 8. Total soluble N content in orchard soil. Uppercase letters indicate significant differences among treatments within the same soil layer; lowercase letters indicate significant differences among soil layers within the same treatment. CK, clean tillage; GC, grass cover; PM, plastic mulch.
Agriculture 14 01879 g008
Figure 9. Correlation analysis of basic soil properties and soil organic N fractions. The symbol * indicates significant differences among treatments at p < 0.05, while ** indicates significance at p < 0.01. SOC stands for soil organic carbon; TN for total nitrogen; BD for bulk density; TP for total phosphorus; TSN for total soluble nitrogen; TON for total organic nitrogen; AHN for acid-hydrolyzable total nitrogen; AAN for amino acid nitrogen; AN for ammonium nitrogen; ASN for amino sugar nitrogen; UN for unknown nitrogen; and NHN for non-hydrolyzable nitrogen.
Agriculture 14 01879 g009
Table 1. Basic physical properties of orchard soil.
Depth
/(cm)
TreatmentBD
/(kg·m−3)
Soil Texture/%
Sand
0.05–2 mm
Silt
0.05–0.002 mm
Clay
<0.002 mm
0–10GC1050 ± 22 Cc21.15 ± 0.87 Aa67.75 ± 0.19 Ab11.1 ± 0.87 Ab
PM1120 ± 25 Bc23.99 ± 0.86 Ba65.07 ± 0.61 Bc10.95 ± 0.28 Ab
CK1170 ± 47 Ac27.51 ± 0.59 Ca63.34 ± 0.71 Cd9.16 ± 0.74 Bb
10–20GC1090 ± 3 Cc20.09 ± 1.02 Aa68.71 ± 1.09 Aab11.21 ± 0.07 Ab
PM1180 ± 4 Bb22.87 ± 0.20 Bab66.04 ± 0.57 Bbc11.09 ± 0.37 Aab
CK1240 ± 3 Ab25.79 ± 0.68 Cb64.98 ± 0.60 Bc9.23 ± 0.19 Bb
20–40GC1180 ± 10 Cb19.59 ± 0.72 Aa69.04 ± 0.57 Aab11.37 ± 0.19 Ab
PM1220 ± 20 Bb21.77 ± 0.58 Bb67.02 ± 0.47 Bb11.21 ± 0.13 Aab
CK1290 ± 30 Ab24.44 ± 0.4 Cc66.07 ± 0.21 Bb9.49 ± 0.19 Bb
40–60GC1400 ± 40 Aa16.59 ± 0.86 Ab70.47 ± 1.07 Aa12.94 ± 0.21 Aa
PM1410 ± 14 Aa18.99 ± 1.39 Bc68.96 ± 0.80 ABa12.04 ± 0.61 Ba
CK1420 ± 10 Aa21.97 ± 0.11 Cd67.26 ± 0.02 Ba10.77 ± 0.09 Ca
Mean ± SD. Uppercase letters indicate significant differences among treatments within the same soil layer; lowercase letters indicate significant differences among soil layers within the same treatment. GC, grass cover; PM, plastic mulch; CK, clean tillage; BD, bulk density.
Table 2. Basic chemical properties of orchard soil.
Depth
/(cm)
TreatmentSOC
/(g·kg−1)
TN
/(g·kg−1)
TP
/(g·kg−1)
TK
/(g·kg−1)
pHC/NN/P
0–10GC26.62 ± 3.87 Aa1.64 ± 0.037 Aa1.75 ± 0.60 Aa27.98 ± 0.98 Aa5.31 ± 0.024 Ba16.28 ± 2.41 Aa1 ± 0.31 Aa
PM16.88 ± 1.43 Ba1.33 ± 0.10 Ba1.69 ± 0.07 Ba21.54 ± 0.50 Ba5.49 ± 0.037 Ab12.73 ± 0.42 Bb0.79 ± 0.091 Ba
CK15.69 ± 0.19 Ba1.22 ± 0.038 Ba1.47 ± 0.097 Ca17.23 ± 1.23 Ca5.19 ± 0.041 Cc12.91 ± 0.54 Ba0.83 ± 0.030 Ba
10–20GC23.39 ± 0.43 Ab1.36 ± 0.17 Ab1.54 ± 0.20 Ab23.6 ± 0.57 Ab4.98 ± 0.004 Cb17.24 ± 0.51 Aa0.89 ± 0.11 Ab
PM15.84 ± 1.11 Bb1.06 ± 0.018 Bb1.49 ± 0.13 Bb18.6 ± 0.57 Bb5.38 ± 0.002 Bb15.01 ± 1.23 Ba0.71 ± 0.056 Ba
CK13.15 ± 0.43 Cb0.96 ± 0.023 Cb1.26 ± 0.002 Cb14.23 ± 0.62 Cb5.48 ± 0.002 Aa13.70 ± 0.64 Ca0.76 ± 0.032 Bb
20–40GC19.96 ± 3.77 Ac1.09 ± 0.015 Ac1.22 ± 0.092 Ac19.78 ± 1.11 Ac4.94 ± 0.02 Cb18.32 ± 3.27 Aa0.89 ± 0.054 Ab
PM10.35 ± 1.35 Bc0.79 ± 0.014 Bc1.19 ± 0.072 Bc12.96 ± 0.17 Bc5.07 ± 0.020 Bd13.12 ± 1.49 Bb0.67 ± 0.029 Bb
CK9.44 ± 0.66 Cc0.75 ± 0.016 Cc1.05 ± 0.011 Cc11.38 ± 0.39 Cc5.26 ± 0.021 Ab12.54 ± 0.85 Ba0.71 ± 0.0083 Bb
40–60GC10.47 ± 6.67 Ad0.89 ± 0.14 Ad1.02 ± 0.018 Bd16.47 ± 1.13 Ad5 ± 0.030 Cc11.72 ± 7.29 Ab0.87 ± 0.022 Ab
PM7.91 ± 2.33 Bd0.67 ± 0.011 Bd1.07 ± 0.010 Ad12.96 ± 0.98 Bd5.61 ± 0.010 Aa11.78 ± 3.65 Ac0.63 ± 0.064 Bb
CK7.3 ± 0.62 Cd0.58 ± 0.013 Cd0.88 ± 0.014 Cd10.76 ± 1.15 Cd5.47 ± 0.020 Ba12.57 ± 1.33 Aa0.66 ± 0.02 Bb
Mean ± SD. Uppercase letters indicate significant differences among treatments within the same soil layer; lowercase letters indicate significant differences among soil layers within the same treatment. GC, grass cover; PM, plastic mulch; CK, clean tillage; SOC, soil organic carbon; TN, total nitrogen; TP, total phosphorus; TK, total potassium.
Disclaimer/Publisher’s Note: The statements, opinions and data contained in all publications are solely those of the individual author(s) and contributor(s) and not of MDPI and/or the editor(s). MDPI and/or the editor(s) disclaim responsibility for any injury to people or property resulting from any ideas, methods, instructions or products referred to in the content.

