Article

Modeling and Optimization of Maize Yield and Water Use Efficiency under Biochar, Inorganic Fertilizer and Irrigation Using Principal Component Analysis

by
Oluwaseun Temitope Faloye
1,2,*,
Ayodele Ebenezer Ajayi
2,3,4,
Philip Gbenro Oguntunde
3,
Viroon Kamchoom
5,* and
Abayomi Fasina
6
1
Department of Water Resources Management and Agrometeorology, Federal University, PMB 373, Oye 371104, Ekiti State, Nigeria
2
Institute for Plant Nutrition and Soil Science, Christian Albrechts University zu Kiel, Hermann Rodewaldstr. 2, 24118 Kiel, Germany
3
Department of Agricultural and Environmental Engineering, Federal University of Technology, PMB 704, Akure 340252, Ondo State, Nigeria
4
Institute for Fourth Industrial Revolution, SE Bogoro Centre, Afe Babalola University, Ado Ekiti 360001, Ekiti State, Nigeria
5
Excellent Centre for Green and Sustainable Infrastructure, School of Engineering, King Mongkut’s Institute of Technology Ladkrabang, Bangkok 10520, Thailand
6
Department of Soil Science and Land Resources Management, Federal University, PMB 373, Oye 371104, Ekiti State, Nigeria
*
Authors to whom correspondence should be addressed.
Agriculture 2024, 14(10), 1813; https://doi.org/10.3390/agriculture14101813
Submission received: 17 June 2024 / Revised: 7 August 2024 / Accepted: 10 October 2024 / Published: 14 October 2024
(This article belongs to the Section Crop Production)

Abstract

:
This study was conducted to predict the grain yield of a maize crop from easy-to-measure growth parameters and select the best treatment combinations of biochar, inorganic fertilizer, and irrigation for the maize grain yield and water use efficiency (WUE) using the Principal Component Analysis (PCA) technique. Two rates of biochar (0 and 20 t ha−1) and fertilizer (0 and 300 kg ha−1) were applied to the soil, with maize crop planted, and subjected to deficit irrigation at 60, 80, and 100% of full irrigation amounts (FIA). Maize growth parameters (number of leaves—NL, leaf area—LA, leaf area index—LAI, and plant height—PH) were measured weekly. The results showed that the developed principal component regression (PCR) from the easy-to-measure growth parameters were strong and moderate in predicting the maize yield and WUE, with coefficient of determination; r2 values of 0.92 and 0.56, respectively. Using the PCA technique, the integration of irrigation with the least amount of water (60% FAI) with biochar (20 t ha−1) and fertilizer (300 kg ha−1) produced the highest ranking on grain yield and water use efficiency. This optimization technique showed that with the adoption of the integrative approach, 40% of irrigation water could be saved for other agricultural purposes

1. Introduction

The effective and efficient applications of fertilizers and water is an important factor affecting the growth, yield, and water use efficiency of crops [1,2]. Crop yield and growth are highly sensitive to both water and fertilizer applications due to their influence on the root of the crops, primarily enhancing the nutrient-absorbing capacity in the root zone of plants [3]. Prioritizing sustainable management of water and fertilizer in agriculture is critical, along with adopting the best field practices, in order to achieve maximum yields and improved fertilizer and water use efficiency (WUE).
In recent times, Afidchao et al. [4] and Erenstein et al. [5] reported that the maize crop is the second most globally grown crop after wheat, with this information revealing how important the economic part (grain) of the crop is to the populace. When maize is compared to other cereal crops like wheat and rice in terms of its usefulness, its multipurpose nature is versatile. In developing and developed countries, grain is processed and primarily used as livestock feed. In addition, it is widely consumed by the populace due to the high nutrients present in maize grain [6], thereby contributing to economic growth and development in the agricultural sector.
Despite the economic and nutritional advantages of cultivating maize, the availability of water has limited its growth in many parts of the world. Moreover, maize has been identified as a high-water and nutrient-demanding crop [7]. However, in areas across the globe that are susceptible to water scarcity, such as the southwestern part of Nigeria, particularly during the dry season, maximizing water use might be of prime importance to maximizing crop yield. The limited water available in these aforementioned areas could result in low water use efficiency—WUE (yield per unit water supplied to the crop) and water productivity (WP) (yield per unit water used by the crop) [8]. To improve water use efficiency, appropriate irrigation technology and strategies must be adopted, while proper soil management is essential.
The application of biochar together with mineral and inorganic fertilizer has been reported as a sustainable soil amendment technique for improving the water use efficiency of crops under irrigation, particularly drip irrigation, which maximizes water and nutrient use efficiencies [9,10]. Biochar additions to soil often improve the water-holding capacity [11,12,13], implying that biochar-amended soils could retain more water from rainfall. This retention could lead to increased crop production in arid and semi-arid regions [11,14], resulting in reduced irrigation water needs in irrigated regions. Novak et al. [12] found that the addition of switch-grass biochar (made at 500 °C) to a sandy Ultasol increased soil water retention by 15.9% compared to no-biochar controls. The authors stated that biochar has the potential to increase soil moisture retention capacity and consequently increase crop yields, especially during water-stressed periods (critical periods of the growing season). In addition, Agbna et al. [10] observed an increase in measured water content under treatment plots differentially applied with water under a drip irrigation system. The positive effects of biochar on soil retention are mostly observed in coarse-textured soils, attributed to its tendency to fill large pores [15,16]. In addition to the water retention benefits of adding biochar to soils, it also helps retain soil nutrients when applied alone or combined with inorganic fertilizer [17,18]. It has liming effects on the soil by increasing the pH of strongly acidic soil and enhances other soil chemical properties such as soil nitrogen, potassium, phosphorus, and cation exchange capacity (CEC), thus resulting in improved soil fertility [19,20]. The tendency of biochar to enhance both soil nutrients and water-holding capacity has been well-proven to increase crop yield and water use efficiency [10,21].
Another approach that has been commonly practiced to enhance WUE and WP is deficit irrigation strategies, which help farmers optimize their costs. In regions where water is purchased to irrigate agricultural land, an effective and efficient way of practicing deficit irrigation could be a solution to increase farmers’ incomes while improving WUE. Several studies have investigated the interactive effects between irrigation, biochar, and inorganic fertilizer on the yield and WUE of crops [21,22,23]. However, the aspect of precision agriculture regarding the levels of water needed to be applied together with biochar and inorganic fertilizer has not been explored, which is important for water management. There is a dearth of information available concerning the best-integrated management practices related to the precise irrigation regime, biochar, and inorganic fertilizer dosages needed to achieve an optimum yield, WUE, and WP of maize. Additionally, very few studies have considered the use of Principal Component Analysis (PCA) for precise management (optimization) of agricultural water, which this study seeks to explore. Wang and Xing [8] applied PCA for the optimization of agricultural input (irrigation water and fertilizer). However, studies that apply the PCA technique when biochar and inorganic fertilizer are applied under different irrigation regimes using easy-to-measure growth parameters are scarce. Furthermore, the majority of studies on the application of PCA for crop yield prediction are based on soil properties [24,25,26]. Studies that explore the use of easy-to-measure growth parameters some days before harvest to predict/forecast maize yield at harvest are very scanty. The forecast of the grain yield before harvest is important for budgeting and adequate planning
The main concept of PCA is to reduce the dimensionality of a data set with a large number of interrelated variables while maintaining as much variation in the data set as possible [27]. This reduction in dimensionality is achieved by transforming the data into a new set of variables, known as principal components. The objectives of this study are to (i) establish a relationship between the growth parameters and grain yield of maize using PCA and PCR; (ii) identify the growth parameter that most affects the yield of maize; and (iii) determine the best combinations of irrigation, biochar, and inorganic fertilizer at different rates for maximizing the grain yield, WUE, and WP of the maize crop.

2. Materials and Methods

2.1. Experimental Site Description

Maize crop (Suwan-1-Sr), which is characterized by high-yielding potential, was cultivated in the open field of the Teaching and Research Farm of the Department of Agricultural Engineering, Federal University of Technology, Akure, in the dry seasons of the years 2017 and 2018. The site is located at latitude 7°16′ N and longitude 5°13′ E grown at 350 m above the mean sea level [28]. The rainfall amounts during the experiment were recorded with the aid of field-installed rain gauges. The field experimental soil had a sandy clay loam texture between the depth of 0 and 60 cm and was classified as Alfisol. The soil textural classification was based on the USDA system. The daily minimum and maximum air temperature from which the average air temperature was computed were obtained from a meteorological station near the experimental site. The weather data of average daily air temperature and rainfall during the growing seasons are illustrated in Figure 1A below. The total sum of rainfall values recorded for the growing seasons was 304.3 mm and 3.13 mm in 2017 and 2018, respectively. The average rainfall for a period of 10 years with respect to days after planting (exemplifying the period of planting in the 2017 and 2018 growing seasons) is illustrated in Figure 1B below. The average sum total for the 10-year data, exemplifying the 2017 and 2018 growing seasons, produced a value of 265.3 and 50.2 mm, respectively. These historical rainfall values followed the same pattern as the actual period of planting the maize crop in the years 2017 and 2018. The differences observed in the rainfall pattern were due to the fact that in 2017, the maize crop was planted in February and harvested in May (wetter), while for the second growing season, the maize crop was planted in November 2017 and harvested in February 2018 (drier).

2.2. Test Materials and Maize Cultivation Approach

Before planting the maize, the experimental soil had already been pulverized, and raised flat seed beds were made, with heights of 0–20 cm. The seed beds were created to prevent treatment interference and aid in the early germination of the maize crop. Drip lines were installed with emitter spaced at 0.6 m intervals. In each growing season, the field pulverized soil was dug out and thoroughly mixed with biochar at an application rate of 20 t ha−1. The soil–biochar mixture was then transferred back to the dug holes with the center aligning with the positioning of the emitter. Two maize seeds were planted per stand in both growing seasons. The size of each plot was 2.2 by 2.5 m with the plots spaced at 0.5 m distance apart. The plants were spaced at 0.6 m (intra-spacing) by 0.9 m (inter-spacing) to maintain a three-line layout in each plot, producing 24 plants in each experimental plot. This spacing results in a plant population of 43,636 plants/ha, which is close to the recommended spacing of 53,333 plants/ha indicated by IITA [29]. To properly schedule irrigation water, the moisture content at field capacity (FC) of the field soil was determined at different depths; 0–20, 20–40, and 40–60 cm, with values of 0.23, 0.24, and 0.27 cm3 cm−3, respectively. The bulk densities at the same soil depths were 1.35, 1.44, and 1.50 g cm−3, respectively.
The biochar used in this study was produced from the residues of maize crop (maize cob), which were pyrolyzed at 500 °C in a furnace. The characterization of the produced biochar followed the International Biochar Initiative [30] approach. The physico-chemical properties of the biochar are presented in Table 1. Additionally, a summary of the soil laboratory analysis adopted in this study is presented in Table 2 for all the parameters used to evaluate the impact of the biochar and fertilizer on the soil. At harvest, soil samples were taken from each plot in the 2017 and 2018 growing seasons to determine the differential effects of standalone applications of biochar, inorganic fertilizer, and their co-applications on the soil physico-chemical properties.

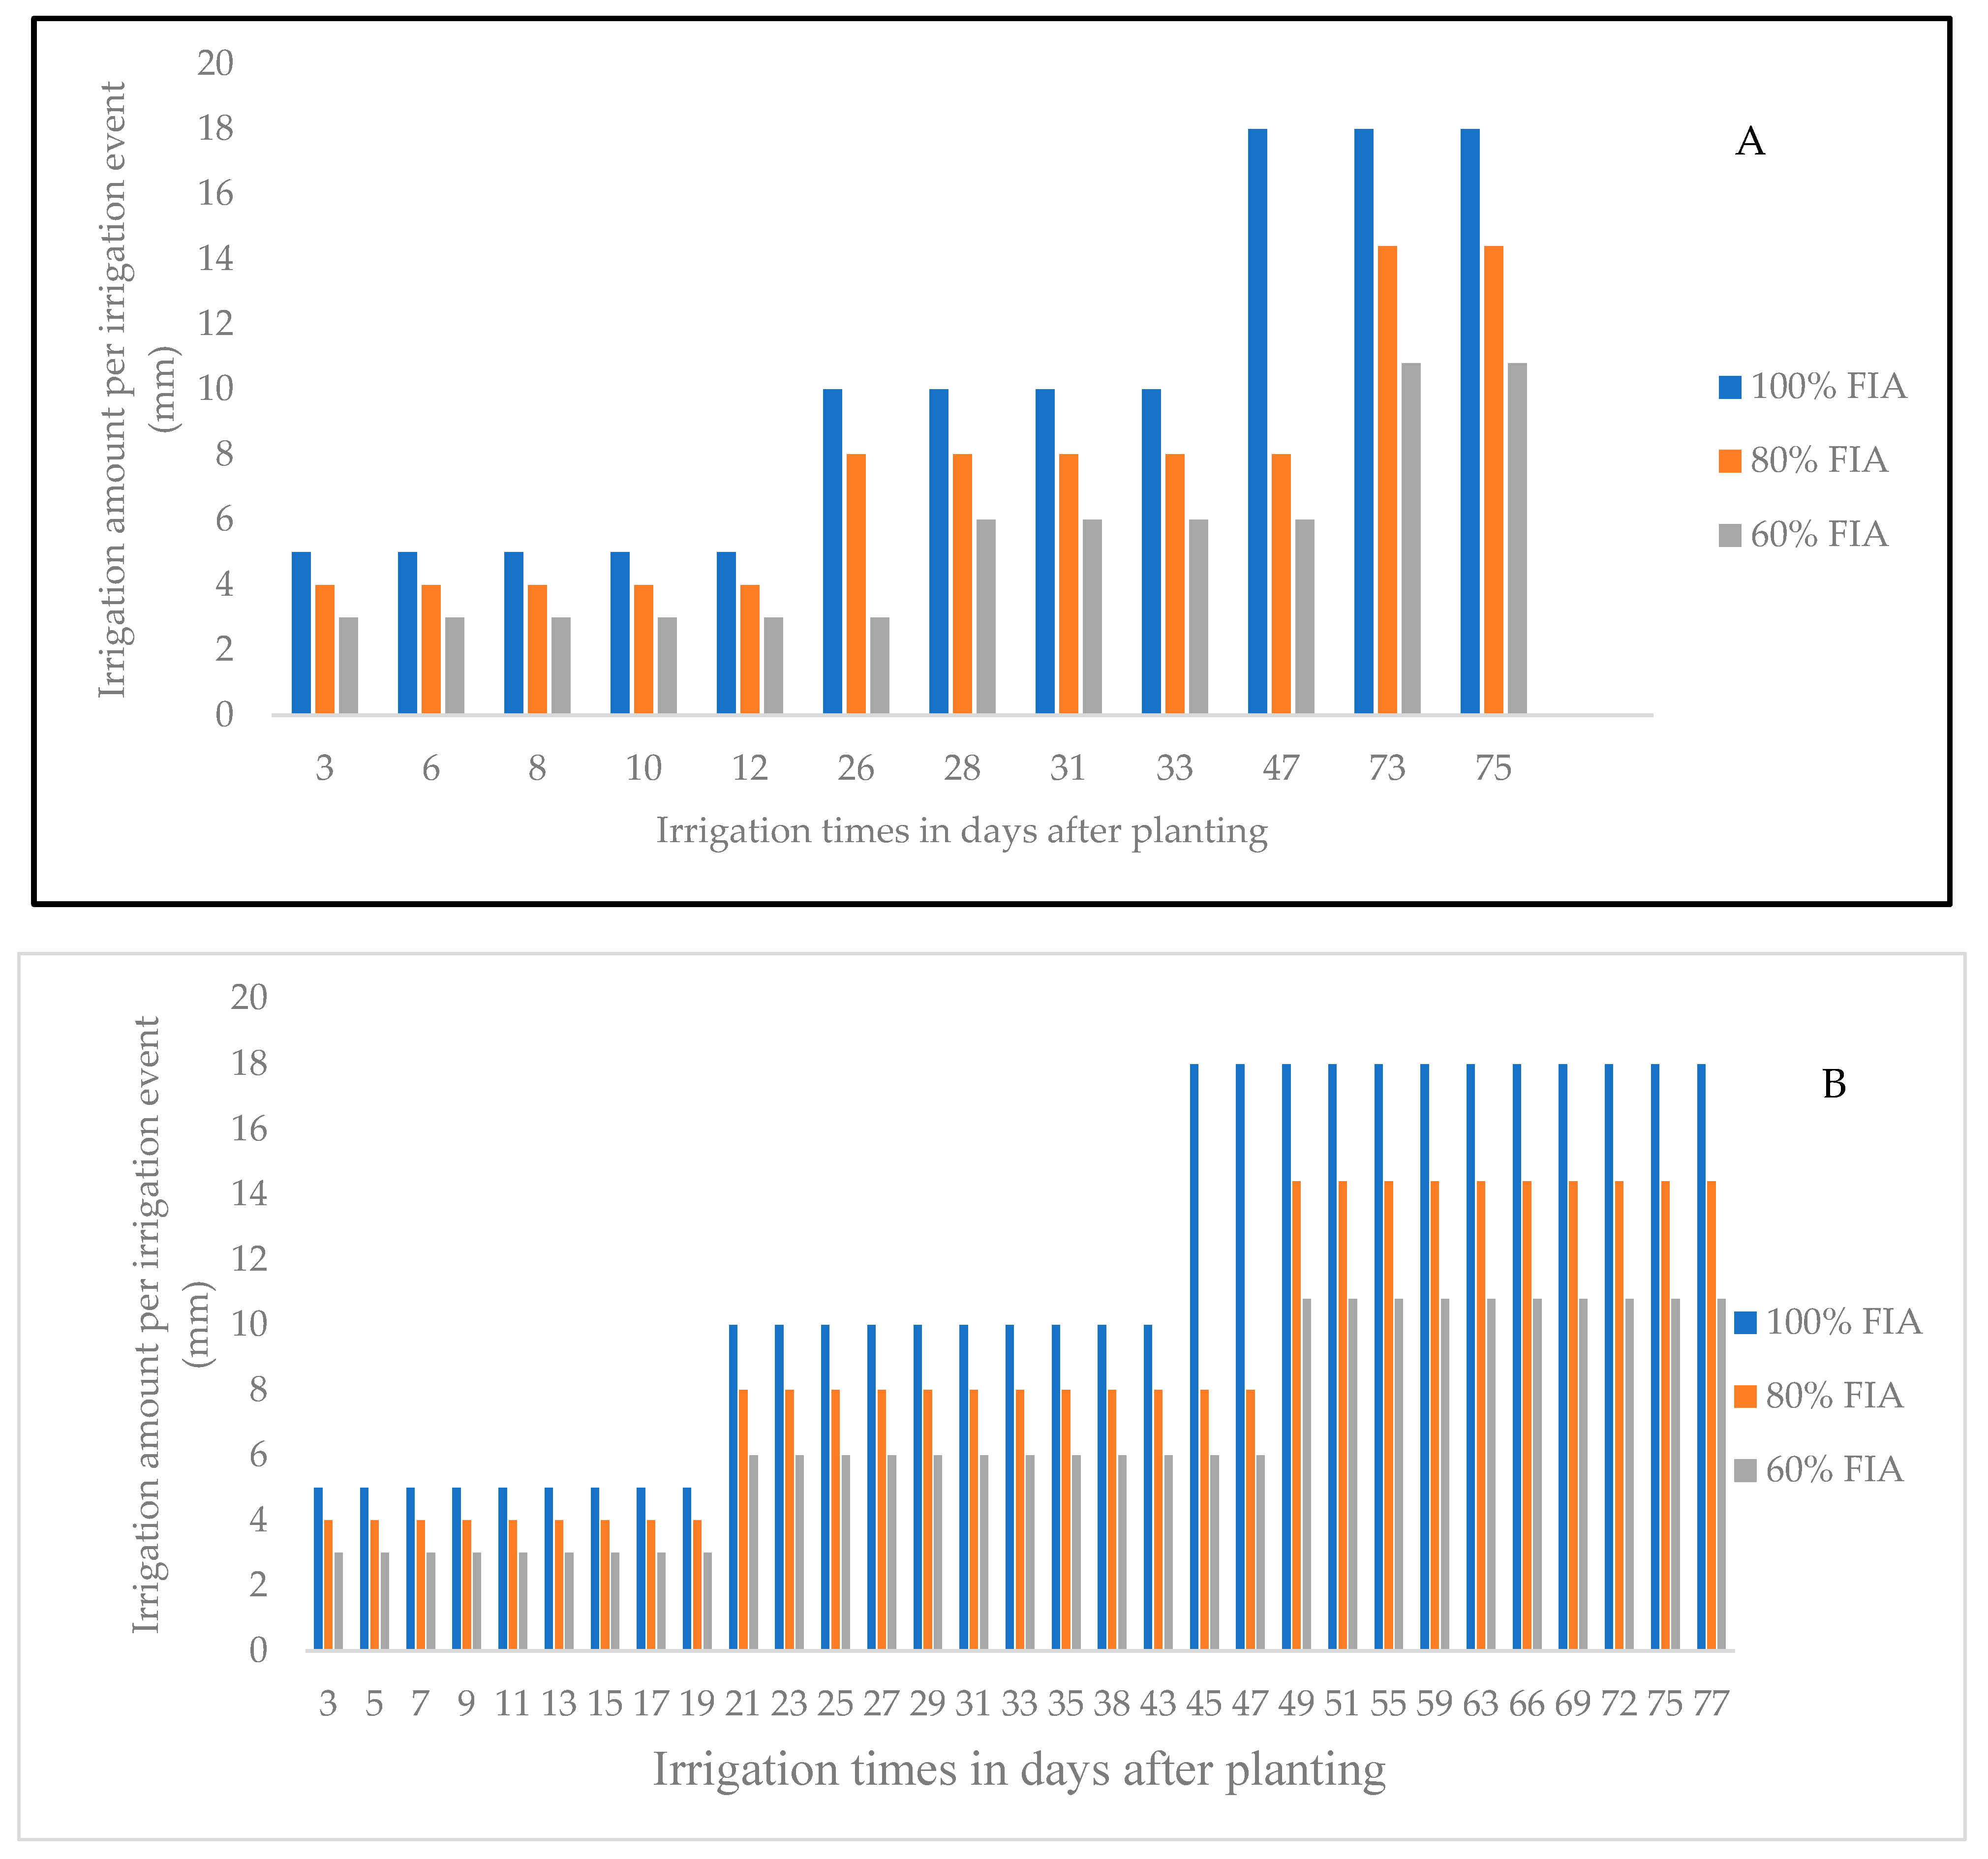
2.3. Experimental Design of the Study and Drip Irrigation

In both growing season experiments, twelve treatments with three replicates were designed, which encompass three different irrigation regimes (100% full irrigation amount (FIA), 80% FIA, and 60% FAI), fertilizer at two different rates (F0—without fertilizer and F300 with fertilizer at 300 kg ha−1), and biochar at two different rates (B0—without biochar and B20 with biochar at 20 t ha−1). The application of N P K inorganic fertilizer (15:15:15) to the maize plants was performed 2 weeks after planting in a ring form. The three irrigation regimes were factorially combined with the biochar and inorganic fertilizer at two rates each, totaling 12 treatments. When replicated thrice, this produced thirty-six plots in total. The summary of the treatments with their descriptions based on the factorial design is given in Table 3.
The irrigation system, which is characterized by an emitter discharge rate of 0.7 L/h, was used in this study at an operating pressure of 200 hPa. The overhead tank, to which the main, sub-main pipe, and the drip lateral are connected, was positioned at a height of 2 m above the soil surface. Three tensiometer probes were installed at the control plot and its replicate (F0B0FIA100) at soil depths of 20, 40, and 60 cm, respectively. The total number of tensiometers installed was 9, and the average values were used for irrigation scheduling. When close to 50% of FC has been depleted from the soil water, 100% of irrigation was applied to level the soil water back to the field capacity in treatment FIA100, while 60 and 80% of irrigation water required to bring the soil water to field capacity were applied in treatments FIA60 and FIA80. The soil water tension from the tensiometer that coincides with the 50% FC was 62 kPa. This value served as the threshold before irrigation water was applied. The field capacity of the soil at the different soil depths had already been established at 10 kPa [33]. The gross irrigation amount was determined by dividing the net irrigation amount (amount needed to bring the soil water to field capacity) by the application efficiency of 0.8 [34]. The irrigation time was estimated by dividing the gross irrigation amount by the average discharge rate from the emitter. At the initial stages (1–20 DAP), an irrigation depth of 5 mm was applied to bring soil water depletion at the 20 cm depth to field capacity, while 10 and 18 mm of irrigation water were applied to bring the soil water at 40 and 60 cm depth to field capacity from vegetative to mid-season (21–45 DAP) and mid-season to maturity (>45 DAP) at the FIA100, while 60 and 80% of the above-stated amounts were applied at FIA60 and FIA80, respectively. This approach, according to Gheysari et al. [35] and Kuscu et al. [36], was applied in the study since the rooting depth of crops increases down the soil depth with respect to DAP. The graphical illustration of the irrigation amount and irrigation times is illustrated in Figure 2 below.

2.4. Estimation of Crop Evapotranspiration Using the Soil–Water Balance Method

The crop evapotranspiration (ETc) of the maize crop under the twelve treatments was calculated using the water balance approach, which was achieved by monitoring the dynamic change in the soil water content every 14 days. The ETc was estimated using Equation (1), as follows:
ETc = I + P + C ± ΔS − Dp − R
where ETc is the crop evapotranspiration (mm) and I is the net amount of irrigation applied (mm). The net irrigation amount in volume was converted to depth by dividing with the drip wetted area; ΔS is the change in soil water storage (mm) between two successive soil water content measurements, which was gravimetrically measured in each plot at every 14 days intervals was used; R represents run off (mm); and D is the deep percolation (mm), the latter were both assumed negligible since there was scanty and few rainfall events during the growing periods. Moreso, the drip irrigation system used does not produce run off due to the gentle release of water to the root of plant, and deep percolation was strictly avoided due to the regulation/control of water applied with the aid of valve connected to the drip system. Therefore, R and Dp were zero. There was no capillary rise at the experimental site due to deeper depth of water table; hence, the rise of water to the soil surface is very much impossible, especially during the dry season period.

2.5. Measurement of the Maize Growth Parameters

All agronomic data like the leave length and breadth were measured weekly with a size-measuring device (meter rule), and the leave area was calculated according to Stewart and Dwyer [37], which was achieved by multiplying the leave length by the breadth and by a multiplying/correction factor of 0.743. The calculation was based on the average of selected plants. The leave area index was computed based on the ratio of the total area of the plants to the area of each plot. At harvest, all plants part (stem, maize cob residues, and leaves) were weighed and recorded for each plot. Also, the number of leave count were manually conducted and recorded in each experimental plot.

2.6. Measurement of Maize Grain Yield, WP, and WUE

At harvest, all maize plant in each plot was harvested and the grain was allowed to dry to the moisture content of 13.5% before weight measurement was carried out. Using an electronic weighing balance of good precision (0.01 g). The WP (in kg ha−1.mm−1) and WUE (in kg ha−1.mm−1) were determined according to Qin et al. [2] and Wang et al. [38] using Equations (2) and (3).
W P = G r a i n   y i e l d   ( k g / h a ) C r o p   e v a p o t r a n s p i r a t i o n   ( m m )
W U E = G r a i n   y i e l d   ( k g / h a ) t o t a l   w a t e r   s u p p l i e d   ( m m )

2.7. Statistical Analysis

The linear relationship between maize growth, yield, and efficiency parameters (average data from the 2017 and 2018 growing seasons) was determined through correlation analysis using the Pearson correlation technique, with the use of Minitab software, version, 2019. This analysis aimed to identify the growth parameter most closely related to maize grain yield. This hypothesis was further tested using PCA, and the growth parameter with the highest loading was identified. Mean values of the growth, yield, and efficiency parameters were compared using Tukey’s test at 5% significance level after analyzing the field data. A three-way analysis was conducted to examine the main interaction of biochar, inorganic fertilizer and irrigation on growth parameters. A regression equation was established to assess the impact of soil amendments and irrigation on the key growth index influencing maize grain yield. Pareto analysis was then used to evaluate the sensitivity and percentage contribution of biochar, inorganic fertilizer, and irrigation to the predictions of the important growth parameter (LAI). The percentage contribution was determined based on the ranking values of each input component; as shown on the Pareto charts.
The varimax (orthogonal) rotation technique was used on the growth, yield, and efficiency terms of the maize, to carry out the PCA. Interpretable PCs were obtained by ranking the loading factors from the extracted PCAs. The PCA was based on the linear correlation between independent variables (growth parameters) using average values, obtained from 14 DAP until 77 DAP to predict the maize grain yield at harvest. For the optimization, only the yield parameters (maize grain yield) and the efficiency terms (WP and WUE) were considered to select the best irrigation treatment combinations. The eigen factors of the principal components (PCs) were generated using Minitab, version 2019 software. The relationship between the principal component (PC) obtained using the growth parameters of the maize crop was related with the crop yield to generate the principal component regression (PCR).

Optimization Technique Based on the Use of the Principal Component Analysis (PCA)

For the optimization of treatment combinations, Equation (4) was used to rank the performance of the maize crop under the considered treatments in this study [39]
QI = i = 1 N W i × S i
where QI characterizes the ranking index, Wi represents the relative weight of each of the crop growth indicators with values within 0 and 1, and Si represents the value of each of the growth indicators. The Wi was expressed as the component score coefficient (CSC), which is directly derived from the PCA. The standardization of the growth parameters was achieved by dividing the subtraction of the mean value of each growth parameter from the measured value by their standard deviation. The comprehensive ranking index (CQI) for the maize crop was determined using the output of the loadings, component coefficient score, Z-score, and percentage variance according to Wang and Xing [8] (Equation (5)).
CQI = i = 1 N v a r i a b i l i t y   o f   e a c h   P C   ×   Q I   ×   Z
where CQI is the comprehensive quality index (CQI) for the maize crop, while the PC and QI have been previously defined. The symbol Z also represents the Z-score.

3. Results and Discussion

3.1. Crop Growth and Yield as Affected by the Maize Cob’s Residue Biochar, Inorganic Fertilizer, and Irrigation

Based on the irrigation schedule in this study, during the 2017 growing season, supplementary irrigation amounts of 72.3, 96.5, and 120.6 mm were applied in treatments with 60, 80, and 100% FAI, respectively. In the 2018 growing season, the total irrigation amounts were 217.1, 289.44, and 361.8 mm for the same FAI levels. Plant height, number of leaves, leaf area, and leaf area index are important indicators reflecting maize plants’ response to different water applications and fertilization levels in both the 2017 and 2018 growing seasons (Tables S1 and S2; Supplementary Data). Maize plants positively responded to the addition of both biochar and fertilizer, showing increased plant height, number of leaves, leaf area, and leaf area index.
The average data for changes in maize height, number of leaves, leaf area, and leaf area index under different irrigation, fertilizer, and biochar treatments for the 2017 and 2018 growing seasons are presented in Table 4. Growth parameters significantly (p < 0.05) increased with higher irrigation, biochar, and fertilizer application, but the interactions between these factors were not significant. The interactions between irrigation × biochar, biochar × fertilizer as well as the three factors interaction did not have a significant (p > 0.05) effect on the NL, LA, and LAI. However, there was a significant interaction between irrigation and fertilizer on the plant height but an insignificant interaction on other factor combinations. This showed that inorganic fertilizer depends on irrigation for the increase in plant height. The tallest plants with the greatest number of leaves, leaf area, and leaf area index were obtained at the F300B20FIA100 treatment plot, while the lowest was obtained at the F0B0FIA60 (treatment with least irrigation with no biochar and fertilizer application). A similar pattern, which was observed for the growth parameters, was similarly observed for the maize grain with the highest value obtained at the F300B20FIA100 treatment, while the lowest grain yield was obtained at the F0B0FIA60 treatment plot.
These results, as obtained for the maize yield (Figure 3A,B), are similar to the findings of Amanullah et al. [40] who reported the positive response of maize to mineral fertilization. Christopher et al. [41] also reported a positive response of maize and peanut plants to biochar application, while Mete et al. [42] further confirmed the synergistic increase in the yield of soybean due to the combination of biochar and fertilizer applications. The result further confirms the fact that maize requires nutrient elements for adequate growth, particularly in low-nutrient and low-organic matter soils [7]. This low nutrient could be the reason for the low yield obtained in the unamended treatment plot (Figure S1: Supplementary Data). The significant positive effect of biochar on the maize growth parameters may be due to the nutrients contained in the soil as influenced by biochar and fertilizer application. In addition, it may also be attributed to the nutrient-transforming property of biochars in the soil system [43,44]. This finding was further confirmed by the report of Christopher et al. [41], who considered maize cob biochar as an effective soil amendment, due to its ability to cause changes in soil pH, CEC, and exchangeable acidity. This result is similar to the finding of Amanullah et al. [40] on the positive response of maize to mineral fertilization. Christopher et al. [41] also reported a positive response of maize and peanut plants to biochar application. The significant positive effect of biochar on the maize growth parameters may be due to the nutrients contained in the soil as influenced by biochar and fertilizer applications. In addition, it may also be attributed to the nutrient-transforming property of biochars in the soil system.

3.2. Crop and Field Water Use Efficiency as Affected by the Maize Cob’s Residue Biochar and Inorganic Fertilizer

In the 2017 growing season, the WUE and WP increased with biochar and fertilizer applications (p < 0.05; Table S3—Supplementary Data) across all the irrigation treatments. Insignificant interactive effects (p > 0.05) were observed for biochar × fertilizer, fertilizer × irrigation, and the three-factor interaction of biochar × fertilizer × irrigation on WUE and WP. The highest WUE and WP were recorded when biochar and fertilizer were applied together in all the irrigation treatments (100, 80, and 60% FIA) and the lowest was recorded in the unamended plot of each irrigation treatment (Table 5). Compared to the control, the application of biochar with NPK fertilizers increased WUE and WP by 63% and 59% in 100% FIA, 60 and 54% in 80% FIA, and 107 and 103% in 60% FIA. The increments were 28 and 26% in 100% FIA, 19% and 17% in 80% FIA, and 38% and 36% for biochar application alone, while they were 41 and 38%, 45% and 13%, and 89% and 84% for NPK fertilizer alone in 100% FIA, 80% FIA, and 60% FIA, respectively.
In the 2018 growing season, the WUE and WP increased with irrigation, biochar, and fertilizer applications (p < 0.05; Table S4—Supplementary Data). Insignificant interactive effects (p > 0.05) were observed for biochar × fertilizer, fertilizer × irrigation, and the three-factor interaction of biochar × fertilizer × irrigation on WUE and WP. The highest WUE and WP were recorded when biochar and fertilizer were applied together in all the irrigation treatments (100, 80, and 60% FIA) and the lowest was recorded in the unamended plot of each irrigation treatment. Compared to the control, the application of biochar with NPK fertilizer increased WUE and WP by 35% and 30% in 100% FIA, 33 and 28.7% in 80% FIA, and 71.8 and 62% in 60% FIA. The increments were 14.1 and 11.9% in 100% FIA, 6.3% and 4.7% in 80% FIA, and 12.5% and 10.5% for biochar application alone, while they were 23 and 19.2%, 20.7% and 17.4%, and 48.6% and 42.8% for NPK fertilizer alone in 100% FIA, 80% FIA, and 60% FIA, respectively. The average data of the maize yield, WUE, and WP, which also confirmed these results and were further used for the optimization result of the treatment combinations of biochar, inorganic fertilizer, and irrigation amounts, are presented in Table 5.
The results obtained in this study showed that, in the two consecutive short-term field experiments, biochar, fertilizer, and irrigation played major roles in increasing the yield, WUE, and WP of maize under irrigation. The insignificant interactive effects (p > 0.05) observed for biochar × fertilizer, fertilizer × irrigation, and the three-way interaction of biochar × fertilizer × irrigation on WUE and WP showed that using biochar under deficit irrigation conditions resulted in similar WP and WUE compared to those obtained under full irrigation (100%FIA) without biochar. This result showed that approximately 60% of irrigation water was needed when biochar was applied to the soil to achieve similar WUE and WP compared to those achieved through conventional irrigation and fertilizer management techniques. The increase in efficiency terms in this study can be attributed to the increase in water use (crop evapotranspiration; Tables S5 and S6—Supplementary Data) by the maize crop. The increase in water use in treatment treated with biochar can be attributed to an increase in water holding capacity and moisture content (Figures S2 and S3—Supplementary Data). A similar result was observed by Agbna et al. [10] who reported an increase in water use efficiency upon biochar addition to soil.

3.3. Relationship between the Growth, Yield, and Efficiency Terms of Maize

In general, in this study, the crop growth parameters had significant (p < 0.05) inter-relationships with each other (Table 6). Among the growth parameters, LAI had the strongest correlation with maize yield, followed by leaf area, while plant height and number of leaves had the least correlation. The correlations (r > 0.7) were good and significant for maize yield and efficiency terms (WUE and WP). The strong correlation with an r-value of 0.93 obtained between LAI and maize grain yield in this study is similar to r > 0.5 reported by Ren et al. [45] who similarly investigated the relationship between maize yield and LAI at different growth stages. Specifically, as presented in Table 6, all crop growth parameters, number of leaves, leaf area, plant height, and leaf area index had good correlations with maize yield, and they were significant (p < 0.05). This is indicative given that such information provides crucial data that would enhance the prediction of maize grain yield, an important and economically significant crop. Moreover, in this study, all the growth parameters significantly (p < 0.05) correlate with the efficiency terms (WUE and WP) of the maize crop. Among the growth parameters, the average value of LAI from 14 days after planting till 77 days after planting (DAP) mostly and significantly (p < 0.05) correlate with WUE with an r-value of 0.887. The number of leaves mostly and significantly (p < 0.05) correlates with WP with an r-value of 0.778, followed by an r-value of 0.732 for the LAI relationship with WP. Additionally, the efficiency terms relate well (r > 0.7) and significantly with maize grain yield. Therefore, the significant (p < 0.05) inter-relationships between the growth parameters and the maize grain yield confirm that the growth parameters could participate and be used in the prediction of maize grain yield.

3.3.1. Principal Component Analysis (PCA) for Analyzing the Growth Parameters

The values of the eigen factor obtained from the PCA in this study are shown in Figure 4 below. An eigen value greater than 1 has been retained, which explains 96.7% of the total variance (Figure 3). Since the first PC explained 96.7% of the total variance, its loading factors were analyzed. From Table 7, it was shown that in PC1, the leaf area index had the highest loading, with a value of 0.992, followed by the leaf area with a value of 0.991, hence justifying the importance of relating the maize leaf area index to the grain yield of maize. Most importantly, all the growth parameters had very high loadings, further confirming their suitability in predicting the yield of maize. Moreover, the suitability of using PCA for analyzing maize growth has been confirmed by conducting the Kaiser–Meyer–Olkin (KMO) and Bartlett tests. The KMO gave a value of 0.72, while the Bartlett test gave a value of less than 0.0001. Since the value of the KMO is >0.5 and the Bartlett test is <0.0001, the data are suitable for the PCA test [45]. The factor loadings were grouped into different classes; “strong” when the loading factor was >0.75, “moderate” when between 0.5 and 0.75, and “weak” when between 0.3 and 0.5 [46]. In this study, PC1 was retained since it all produced positive values, while the PC2 values were discarded since they all displayed negative values.

3.3.2. Principal Component Analysis Regression (PCR) for the Maize Yield, WUE, and WP Predictions

The result of the multiple regression equation for the Principal Component Analysis for the prediction of the maize yield, WUE, and WP after retaining the component of PC1 are reported in Equations (6)–(8) below.
Grain yield = 4.3925 + 0.2305 PC1  r2 = 0.9182; p < 0.0001
WUE = 12.933 + 0.467 PC1  r2 = 0.5605; p = 0.005
WP = 12.995 + 0.471 PC1  r2 = 0.5558; p = 0.005
The regression equations all showed that PC1 had a positive effect on the grain yield, WUE, and WP of the maize crop. This is confirmed by the positive slope in each of the equations. The coefficient of determination (r2) revealing the relationships between the PC and the grain yield, WUE, and WP showed that the relationship between PC1 and the maize grain yield was strong with an r2 value of 0.9182. This explained that 91.82% of the yield variability is explained by PC1. Also, the PC had moderate effects in predicting the WUE and WP of the maize crop with r2 of 0.5605 and 0.5558, respectively. The PC was strong (p < 0.005) in predicting the maize grain yield, field, and crop water use efficiencies.
The strong relationship between the PC1 and the maize grain yield could be attributed to the contribution of the LAI, which is confirmed by the high correlation. The observed relationship between the two parameters in this study is further confirmed by the findings of Gomez-del-Compo and Lisserague [47], who also reported a good relationship between LAI and crop yield. The high soil nutrients, N, significantly (p < 0.05) observed in the fertilized plots might have impacted the LAI and consequently, the maize grain yield. Effects of nutrient limitations on plant growth are mainly noticed in the leaf area index and to a lesser extent, in its effects on photosynthesis [48]. A higher amount of nitrogen (N) availability in soil could result in high-shoot dry matter production when soils are fertilized [49]. The mix of biochar with the soil might have provided a good environment for the leaf area development, thus resulting in increased maize grain yield. The improvement in the leaf area index could also be linked to the loosening of the soil (reduced bulk density upon biochar addition), which promoted the penetration of plant roots, consequently resulting in improved growth (LAI) and grain yield of the maize crop.
Innovatively, the multivariate approach used in this study revealed that growth parameters of a maize crop monitored from 14 to 77 days after planting (DAP) are evidently good enough for predicting maize yield at harvest using PCA. This technique is advantageous since easy-to-measure growth parameters enable the precise prediction of maize grain yield at harvest, which could aid proper budgeting. The r2 value of 0.9182 obtained in this study is much higher than the r2 values ranging between 0.19 and 0.67 reported by some researchers [24,25,26] who used soil physico-chemical properties for the prediction of crop yield by applying the PCR technique.

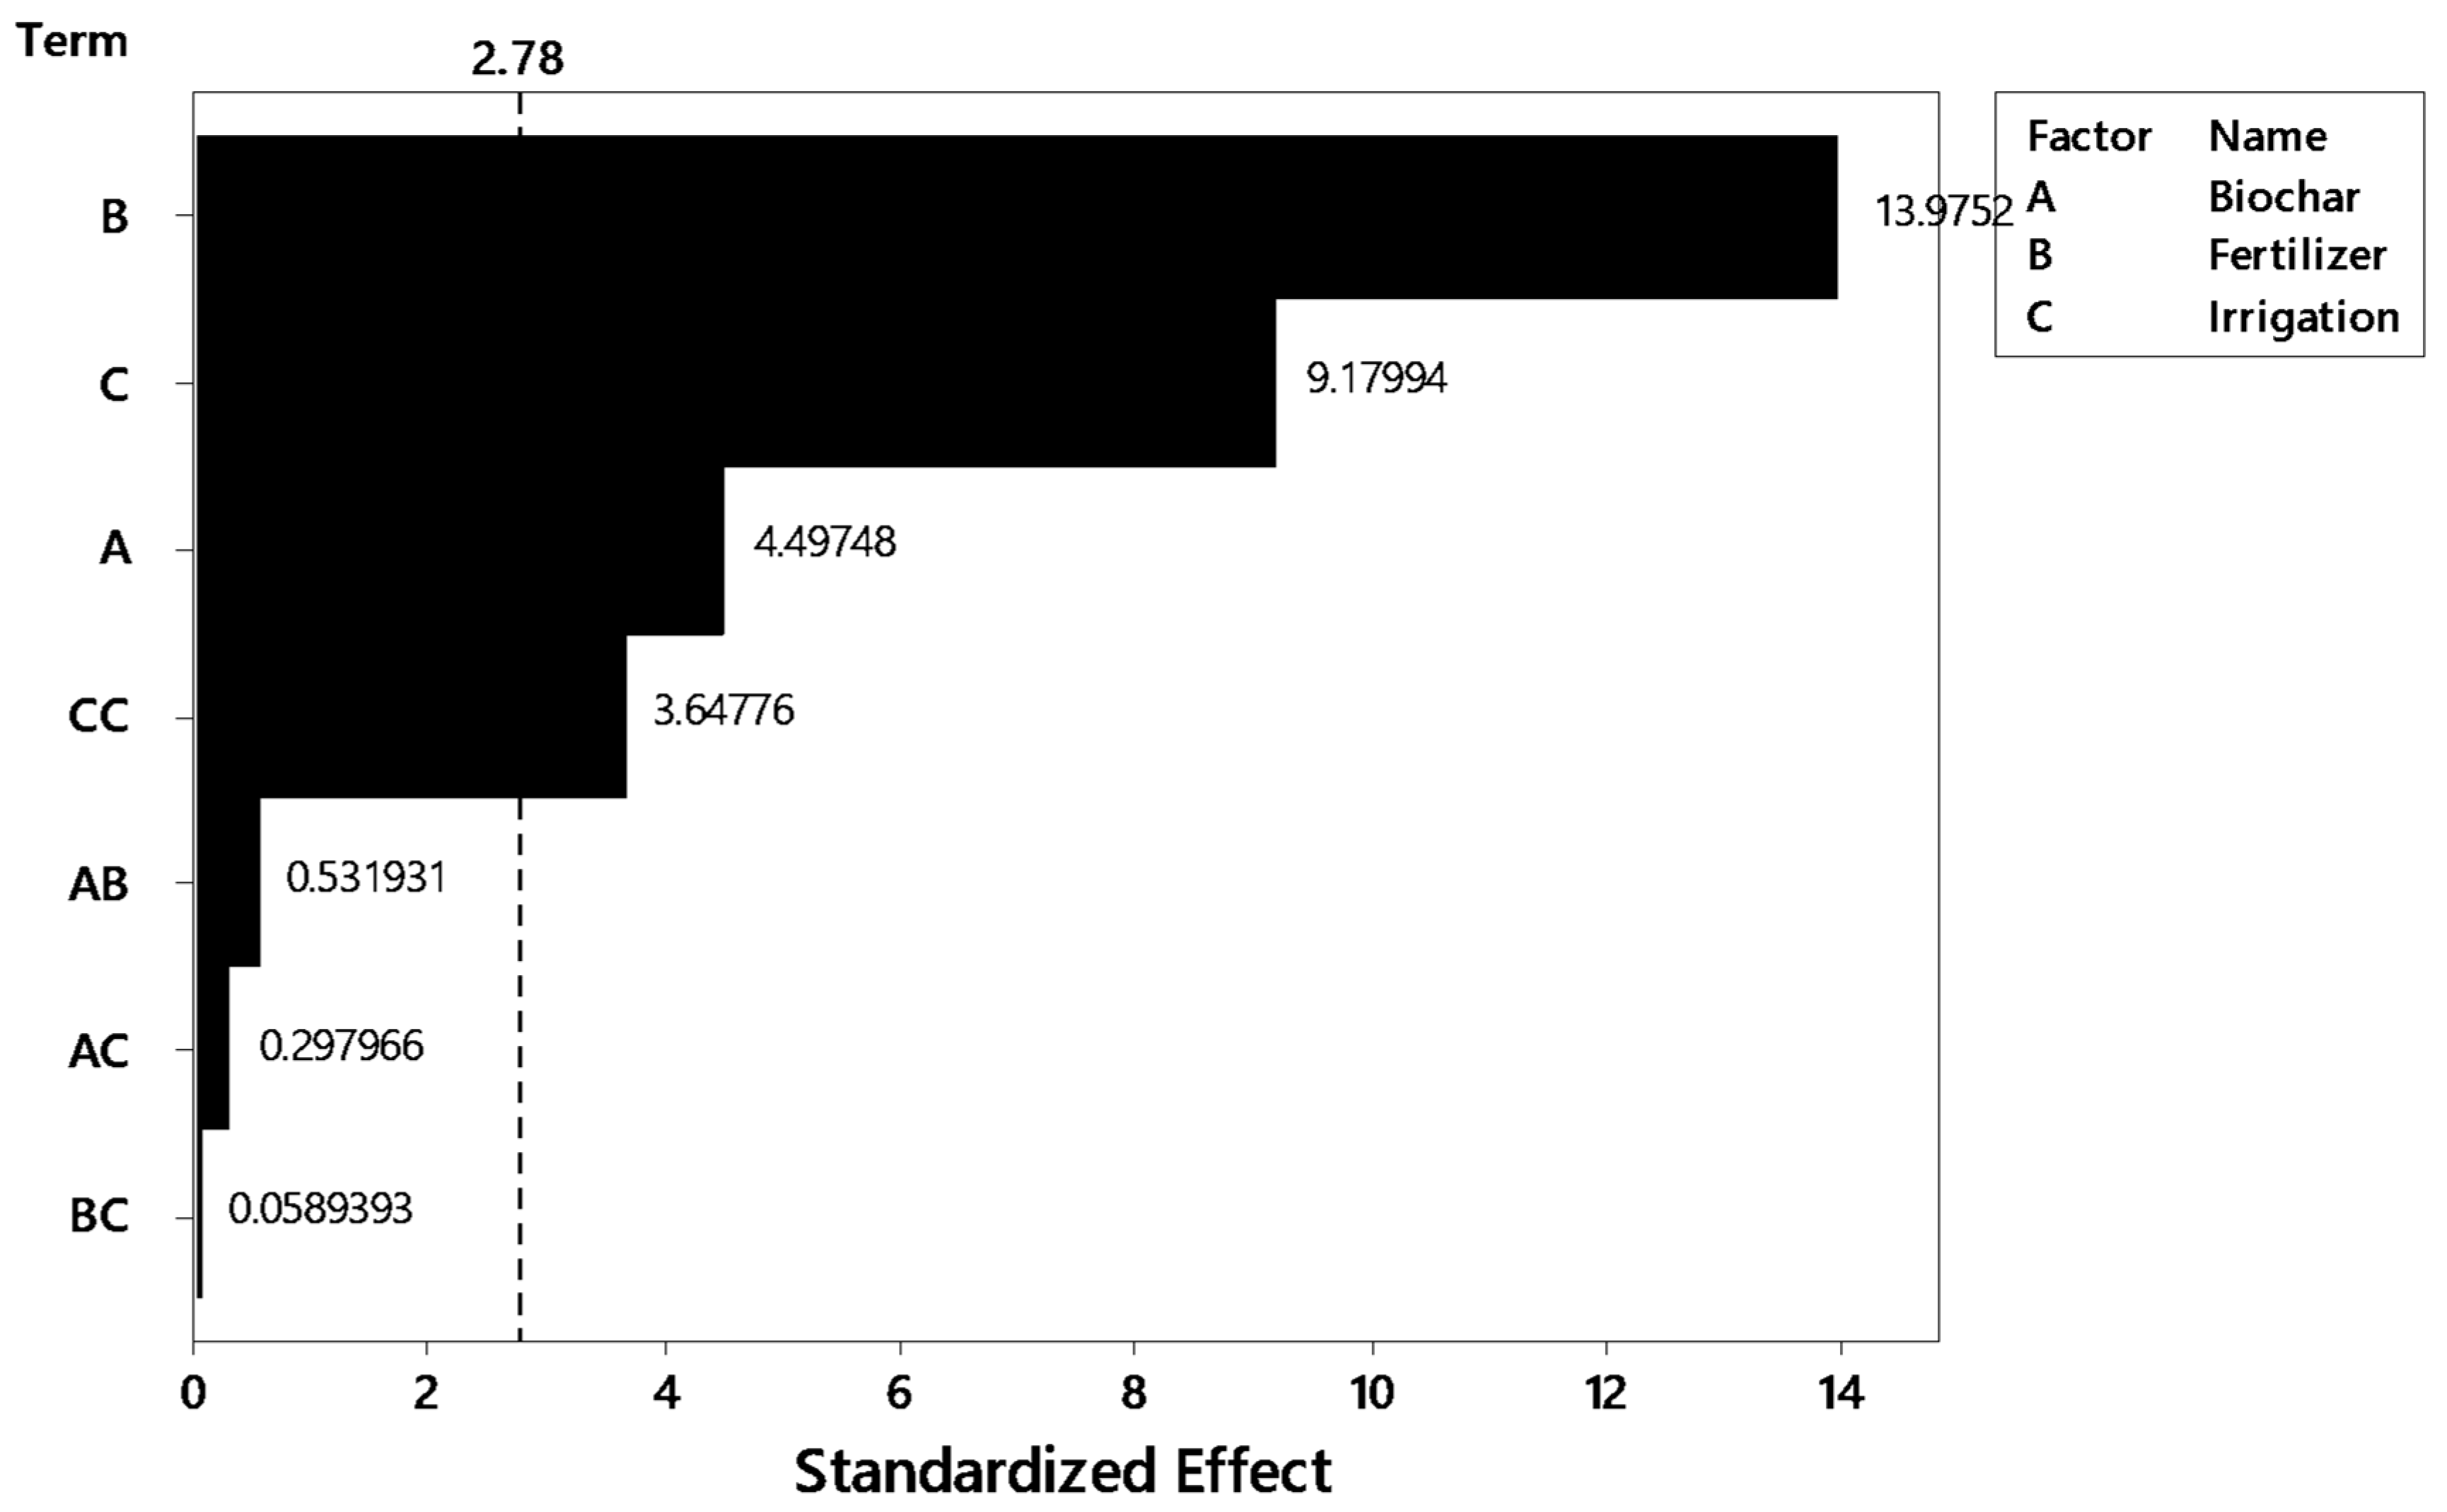
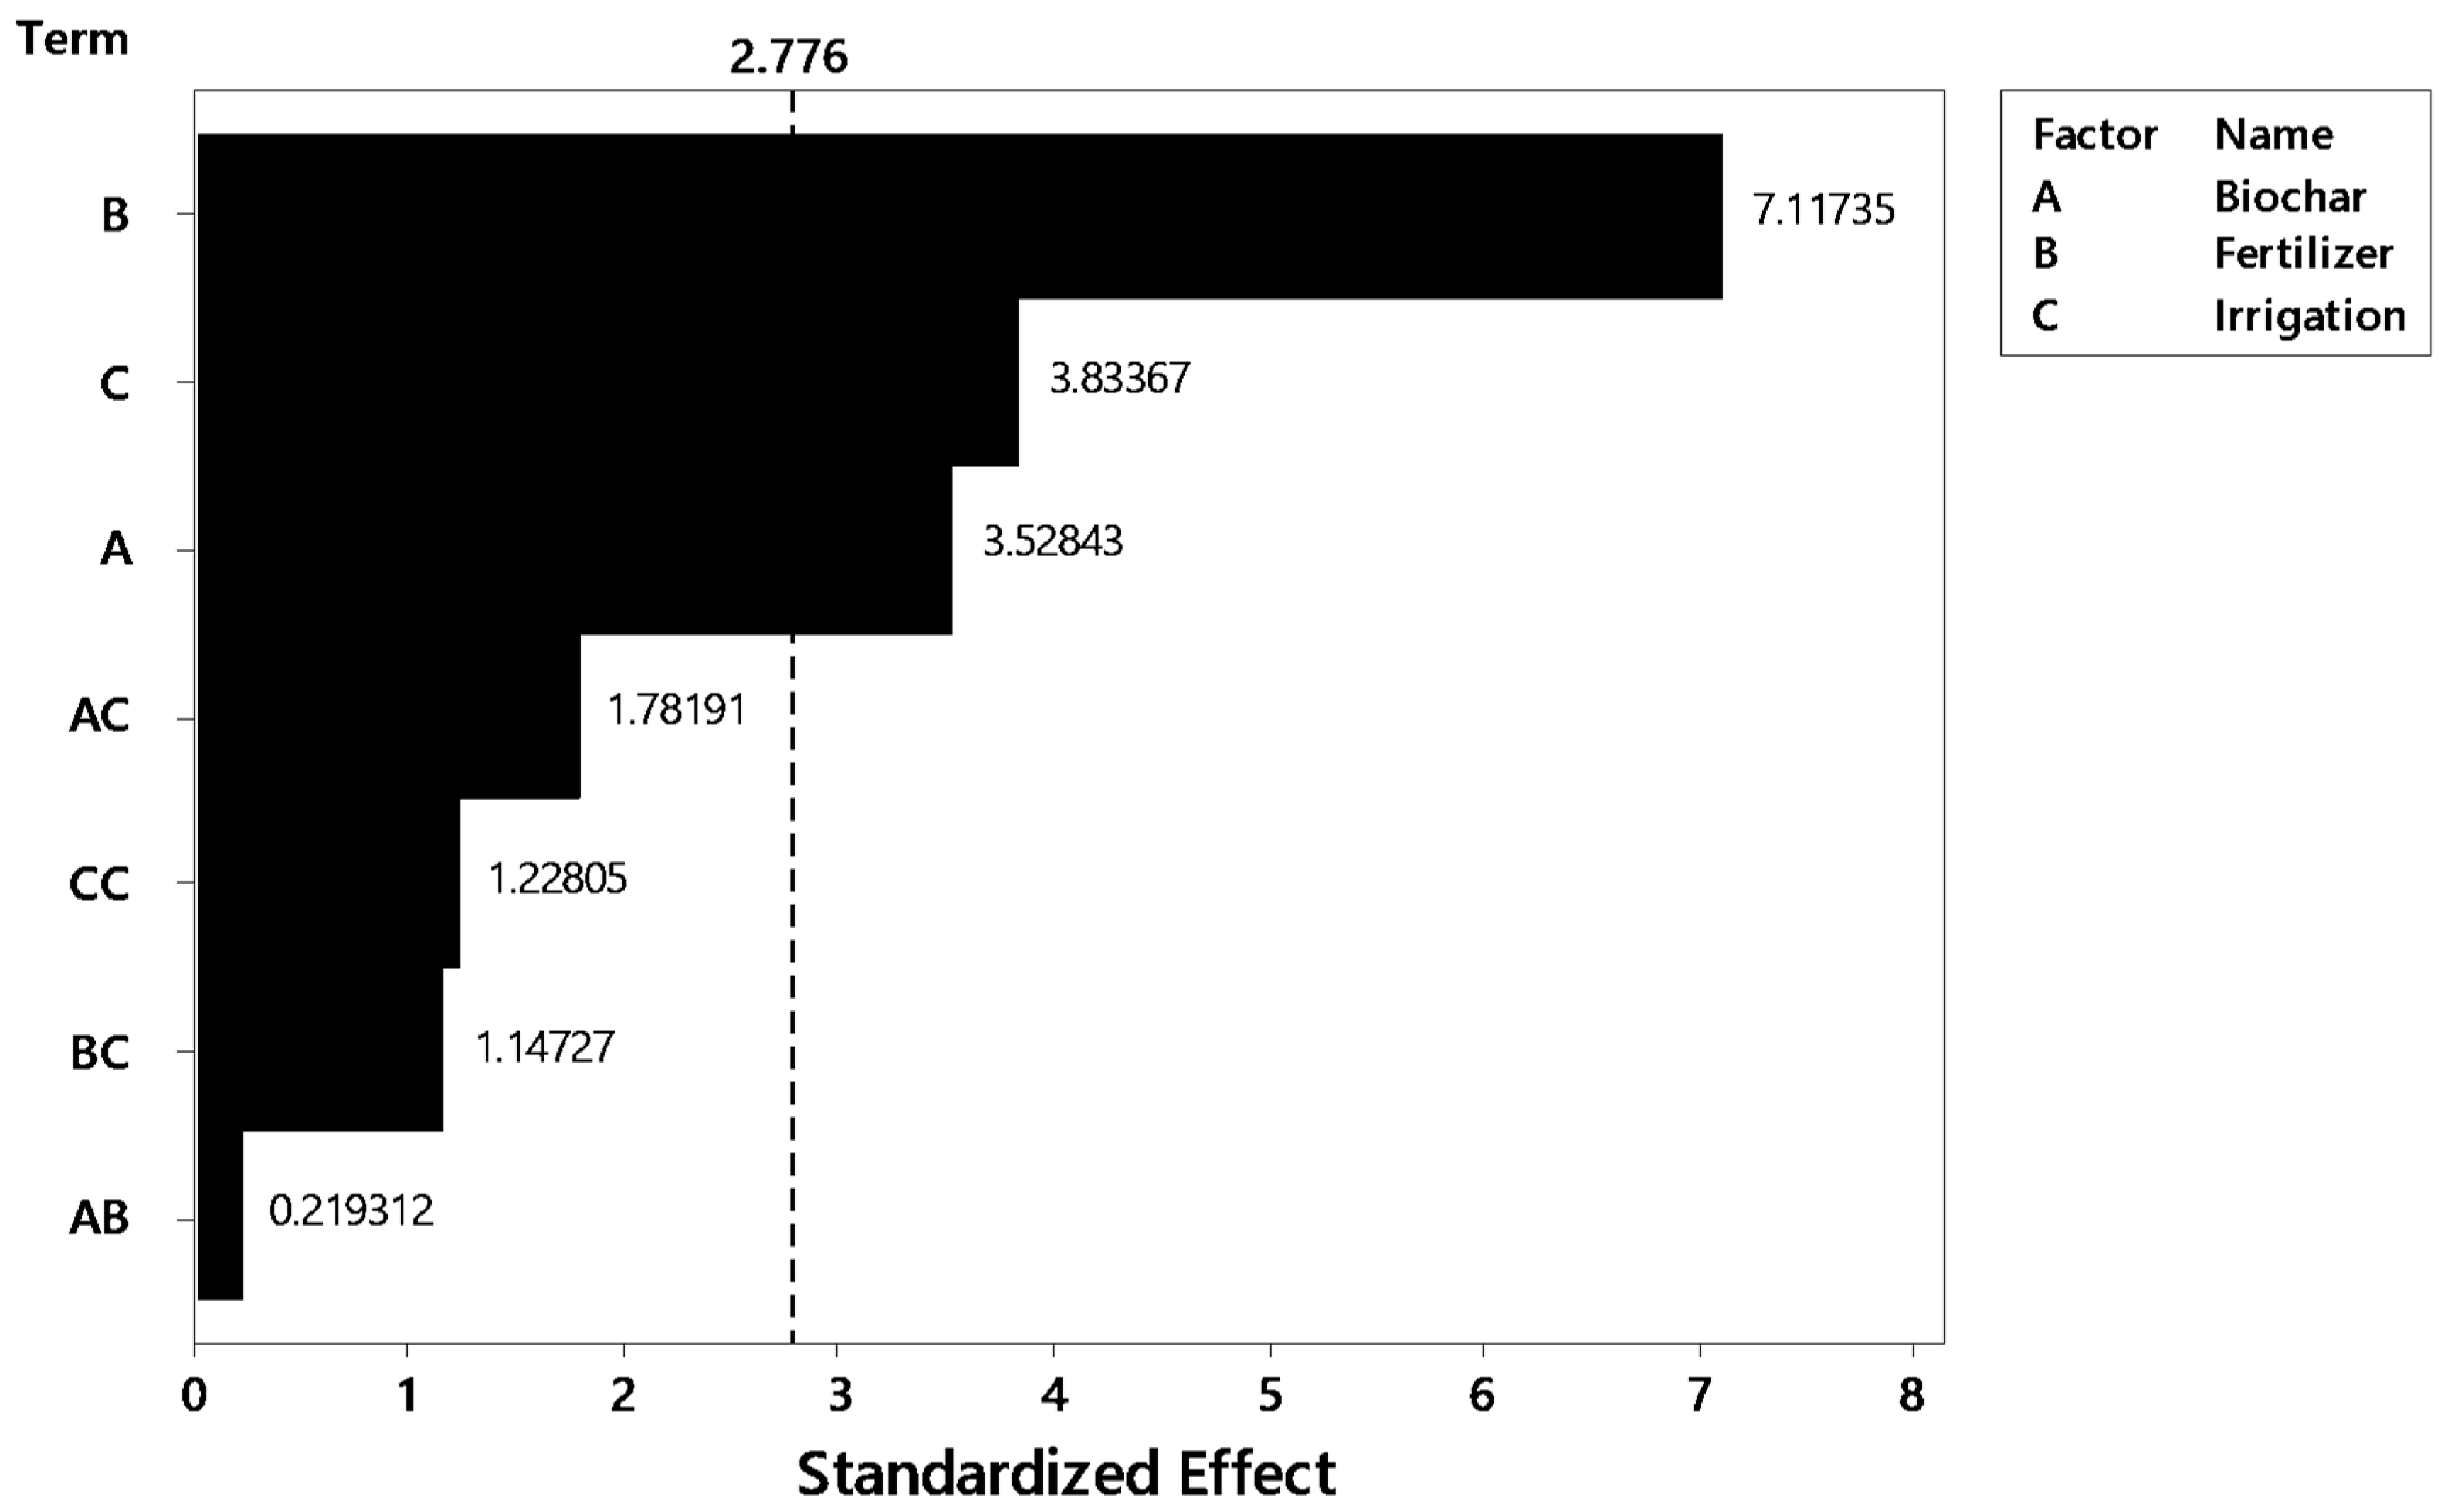
3.4. Response of Biochar and Inorganic Fertilizer Applications

Based on the importance of the LAI index in determining maize yield, a direct method of predicting maize LAI was derived by developing a full quadratic equation that shows the relationship between biochar, inorganic fertilizer, irrigation, and LAI using response surface analysis embedded in Minitab. The relationships between the leaf area index and the soil amendments and irrigation for the 2017 and 2018 growing seasons are illustrated in Equations (9) and (10). Both growing seasons show high values for the coefficient of determination with values of 0.955 and 0.987. This shows that approximately 95.5 and 98.7% of the LAI variability could be explained by the independent parameters. For both growing seasons, all the dependent variables (biochar, inorganic fertilizer, and irrigation) had a positive influence on the LAI.
LAI = −33.3 + 0.163 I + 0.1670 B + 0.00854 F − 0.000186 I × I − 0.000378 I × B − 0.000016 I × F − 0.000006 B × F r2 = 0.955
LAI = −1.389 + 0.01770 I + 0.01119 B + 0.001633 F − 0.000026 I × I − 0.000009 I × B + 0.000000 I × F − 0.000006 B × F r2 = 0.987
The significance of the input parameters and their interactions on the LAI was assessed using the Pareto chart at a 5% level of probability. The independent variable corresponding to the chart that crosses the vertical line is significant at a 5% level of probability. Also, the Pareto chart enabled the evaluation of their percentage contribution to the yield variability. The Pareto chart of the standardized effects also showed that all the input parameters (irrigation, biochar, and inorganic fertilizer) contributed significantly to the yield prediction (Figure 5). The magnitude of their contribution was 28.5, 13.98, and 43.4% for irrigation, biochar, and inorganic fertilizer, respectively, in the 2017 growing season. The combined effects of irrigation, biochar, and inorganic fertilizer were in the increasing order of Biochar + Fertilizer (BF) < Biochar + Irrigation (BI) < Irrigation + Fertilizer (BI). Similarly, the 2018 growing season showed that the main effects on irrigation(I), inorganic fertilizer (F), and biochar (B) on the leaf area index (LAI) were in the increasing order of F < I < B and were all significant (p < 0.05) (Figure 6). The main effects of the biochar, inorganic fertilizer, and irrigation were significant on the LAI in both growing seasons. The combined effect affected the LAI in the increasing order of Biochar + Irrigation (BI) < Fertilizer + Irrigation (FI) < Biochar + Fertilizer (BF). The higher combined effect of BF compared to BI in the 2017 and 2018 growing seasons could be attributed to the differential influence of irrigation amounts on the LAI. For example, in the 2017 growing season, the rainfall recorded over the growing season period was 304.3 mm, while only 3.13 mm was recorded in the 2018 growing season.
Biochar application rate, irrigation, and inorganic fertilizer at different levels showed a marked impact on the leaf area index. This might be due to immediate nutrient availability for plant uptake for the maize crop, especially at the studied early growth stages of the crop. This explanation is possible since the measurements were taken from 14 days after planting (DAP) until 77 DAP. The findings from this study suggest that at early stages of crop growth, there is a response in the formation of canopy structure upon biochar addition, consequently resulting in increased vegetative development [50]. The significant (p < 0.05) main effects of biochar inorganic fertilizer and irrigation on the leaf area index might be related to the differences in nutrient composition of the soils and other properties of the studied soils [51]. The findings of this study indicated that amended soil, which has high nutrient composition and moisture content, better-enhanced leaf area index compared with the unamended soil. This observation is in corroboration with the findings of Gutierrez-Boem and Thomas [52] who emphasized the importance of soil nutrients in leaf area development. Therefore, the findings of this study show that biochar and inorganic fertilizers with good chemical properties may have an increasing effect on the leaf area index, which is similar to the findings of Magdi et al. [53]. Due to the improvements in the soil and consequent positive impact on the leaf area index of maize, the inter-relationship between these soil and LAI parameters has been investigated. This is important and necessary in designing plans to improve crop productivity in the face of the growing population and climate change.

3.5. Optimization of the Biochar, Inorganic Fertilizer, and Irrigation Optimization

Based on all the collected data for the yield, WUE, and WP in the two successive growing seasons (Supplementary data: Table S7), it was possible to present the standardized values for the above-stated parameters. The optimization results for the determination of the best irrigation, biochar, and inorganic fertilizer treatment combination were achieved by applying the PCA technique. The factor loading from the PCA based on the input parameters in this study is indicated in Table 8 below. The principal components 1 and 2 were retained since they both produced variance greater than 1. The percentage of variability in PC1 and PC2 were 59.8 and 39.4%, respectively.
The comprehensive optimization rankings based on the PCA are shown in Table 9 with B20F300IA60 ranked first, followed by B20F300IA80, and clearly, treatment B0F300IA60 was ranked the third best.
In this study, we applied a PCA approach to evaluate a comprehensive index of maize water productivity (grain yield, WUE, and WP) and identified the optimal combination of irrigation biochar and inorganic fertilization rates. This is important as it can aid in precise and accurate decision making in the proper management of agricultural water, soil, and production. The treatment that received the least amount of irrigation water (60% FIA) with 20 t ha−1 and 300 kg ha−1 of biochar and inorganic fertilizer applications resulted in the highest comprehensive quality index (ranking) compared to the other treatments. This approach justifies the need to practice deficit irrigation in combination with other soil amendments. Previous studies have also suggested deficit irrigation as a means of optimizing the amount of water available for irrigation to obtain satisfactory yields [54,55]. The results obtained from the present study using PCA also support the adoption of deficit irrigation practice. The results showed that by combining inorganic fertilizer and biochar under irrigation, 40% of irrigation water could be saved in sandy clay loam soil in the southwestern part of Nigeria, where water is limited during the dry season.

4. Conclusions

This study examined the relationships between growth parameters, yield, and efficiency terms of a maize crop, as influenced by soil amendments (biochar and inorganic fertilizer) under drip irrigation. The inter-relationship between the growth parameters were all significant (p < 0.05) on the maize grain yield and the efficiency terms, with a correlation coefficient mostly > 0.70. The Pearson correlation analysis showed that the leaf area index (LAI) was the growth parameter that is mostly related to the maize grain yield, while the Principal Component Analysis (PCA) also showed that the LAI displayed the highest loading values. The developed principal component regression (PCR) revealed that the growth parameters were reliable and efficient in precisely predicting the grain yield of maize in soil treated with biochar and inorganic fertilizer, with an r2 value of 0.92. However, the use of the growth parameters with the application of PCR was moderate in predicting the WUE and WP, with r2 values of 0.56 and 0.56, respectively. The advantage of this technique, as revealed in this study, was that it is possible to forecast the grain yield of a maize crop before harvest since only the average growth data of maize from 14–77 days after planting (DAP) was used in this study, while the harvest was carried out at 91 DAP.
Also, a comprehensive technique of optimizing the application of irrigation water was achieved in this study using PCA. The optimum biochar and inorganic fertilizer application rates of 20 t ha−1 and 300 kg ha−1 were obtained, in combination with irrigation water at 60% of the full irrigation amount (FIA). This implies that with the proper application of soil amendments at the above-stated rates, 40% of irrigation water could be saved. The outcome of this study is very important in areas where water scarcity is a serious issue, in which the cost of irrigation water could also be a significant concern.

Supplementary Materials

The following supporting information can be downloaded at https://www.mdpi.com/article/10.3390/agriculture14101813/s1, Table S1. Main and interaction effects of inorganic fertiliser (F) and maize cob-residue biochar (B) on the average of maize plant parameters (14–77 DAP) in 2017 growing season. Table S2. Main and interaction effects of inorganic fertiliser (F) and maize cob-residue biochar (B) on the average of maize plant parameters (14 DAP–77 DAP) measured in 2018 growing season. Table S3. Effects of biochar (B) and fertiliser (F) and Irrigation (I) applications on WUE and WP component in 2017. Table S4. Effects of biochar (B) and fertiliser (F) and Irrigation (I) applications on WUE and WP component in 2018 growing season. Table S5. Water balance equation components and ET data for maize during the growing season of 2017. Table S6. Water balance equation components and ET data for maize during the growing season of 2018. Table S7: Z-score for the optimization parameter. Figure S1: Soil hydro-physical and chemical properties of the soil as affected by biochar and inorganic fertilizer application in (A) 2017 growing season and (B) 2018 growing season. Figure S2: Changes in soil water content as influenced by soil amendments (biochar and fertiliser) under different irrigation treatments (2017 growing season). Figure S3: Changes in soil water content as influenced by soil amendments (biochar and fertiliser) under different irrigation treatments (2018 growing season).

Author Contributions

Methodology, O.T.F.; Software, O.T.F.; Validation, O.T.F.; Writing—original draft, O.T.F.; Writing—review & editing, A.E.A., V.K. and A.F.; Visualization, V.K.; Supervision, A.E.A. and P.G.O.; Funding acquisition, V.K. All authors have read and agreed to the published version of the manuscript.

Funding

The fourth author (VK) would like to acknowledge the grant (RE-KRIS/FF68/56) from King Mongkut’s Institute of Technology Ladkrabang (KMITL) and National Science, Research and Innovation Fund (NSRF).

Data Availability Statement

Data are contained within the article and Supplementary Materials.

Conflicts of Interest

The authors declare no conflicts of interest.

References

  1. Bernacchi, C.J.; VanLoocke, A. Terrestrial ecosystems in a changing environment: A dominant role for water. Annu. Rev. Plant Biol. 2015, 66, 599–622. [Google Scholar] [CrossRef] [PubMed]
  2. Qin, W.; Wang, D.; Guo, X.; Yang, T.; Oenema, O. Productivity and sustainability of rainfed wheat-soybean system in the North China Plain: Results from a long-term experiment and crop modelling. Sci. Rep. 2015, 5, 17514. [Google Scholar] [CrossRef]
  3. He, Y.; Hou, L.; Wang, H.; Hu, K.; McConkey, B.A. Modelling approach to evaluate the long-term effect of soil texture on spring wheat productivity under a rain-fed condition. Sci. Rep. 2014, 4, 5736. [Google Scholar] [CrossRef]
  4. Afidchao, M.M.; Musters, C.J.M.; Wossink, A.; Balderama, O.F.; De Snoo, G.R. Analysing the farm level economic impact of GM corn in the Philippines. NJAS-Wagening. J. Life Sci. 2014, 70, 113–121. [Google Scholar] [CrossRef]
  5. Erenstein, O.; Jaleta, M.; Sonder, K.; Mottaleb, K.; Prasanna, B.M. Global maize production, consumption and trade: Trends and R&D implications. Food Secur. 2022, 14, 1295–1319. [Google Scholar]
  6. Erenstein, O. The evolving maize sector in Asia: Challenges and opportunities. J. New Seeds 2010, 11, 1–15. [Google Scholar] [CrossRef]
  7. Carsky, R.J.; Iwuafor, E.N.O. Contribution of soil fertility research and maintenance to improved maize production in sub-saharan. In Proceedings of the Regional Maize Workshop, Ibadan, Nigeria, 29 May–2 June 1995; International Institute of Tropical Agriculture (IITA): Cotonou, Benin, 1995. [Google Scholar]
  8. Wang, X.; Xing, Y. Evaluation of the effects of irrigation and fertilization on tomato yield and quality: A principal component analysis. Sci. Rep. 2017, 7, 50. [Google Scholar] [CrossRef]
  9. Singh, R.; Singh, P.; Singh, H.; Raghubanshi, A.S. Impact of sole and combined application of biochar, organic fertiliser and chemical fertiliser on wheat crop yield and water 631 productivity in a dry tropical agro-ecosystem. Biochar 2019, 2, 229–235. [Google Scholar] [CrossRef]
  10. Agbna, G.H.D.; Dongli, S.; Zhipeng, L.; Elshaikh, N.A.; Guangcheng, S.; Timm, L.C. Effects of deficit irrigation and biochar addition on the growth, yield, and quality of tomato. Sci. Hortic. 2017, 222, 90–101. [Google Scholar] [CrossRef]
  11. Jeffery, S.; Verheijen, F.G.; van der Velde, M.; Bastos, C.A. Quantitative review of the effects of biochar application to soils on crop productivity using meta-analysis. Agric. Ecosyst. Environ. 2011, 144, 175–187. [Google Scholar] [CrossRef]
  12. Novak, J.; MBusscher, W.J.; Laird, D.L.; Ahmedna, M.; Watts, D.W.; Niandou, M.A.S. Impact of Biochar Amendment on Fertility of a Southeastern Coastal Plain Soil. Soil Sci. 2009, 174, 105–112. [Google Scholar] [CrossRef]
  13. Chen, Z.; Kamchoom, V.; Leung, A.K.; Xue, J.; Chen, R. Influence of biochar on the water permeability of compacted clay subjected to freezing–thawing cycles. Acta Geophys. 2023, 72, 2071–2081. [Google Scholar] [CrossRef]
  14. Chen, Z.; Kamchoom, V.; Chen, R.; Prasittisopin, L. Investigating the Impacts of Biochar Amendment and Soil Compaction on Unsaturated Hydraulic Properties of Silty Sand. Agronomy 2023, 13, 1845. [Google Scholar] [CrossRef]
  15. Glaser, B.; Lehmann, J.; Zech, W. Ameliorating physical and chemical properties highly weathered coils in the tropics with Charcoal—A review. Biol. Fertil. Soils 2002, 35, 219–230. [Google Scholar] [CrossRef]
  16. Chen, Z.; Kamchoom, V.; Apriyono, A.; Chen, R.; Chen, C. Laboratory study of water infiltration and evaporation in biochar-amended landfill covers under extreme climate. Waste Manag. 2022, 153, 323–334. [Google Scholar] [CrossRef]
  17. Laird, D.A.; Fleming, P.; Davis, D.D.; Horton, R.; Wang, B.; Karlen, D.L. Impact of biochar amendments on the quality of a typical Midwestern agricultural soil. Geoderma 2010, 158, 443–449. [Google Scholar] [CrossRef]
  18. Van, Z.L.; Kimber, S.; Morris, K.Y.; Chan, A.; Downie, J.; Rust, S.; Joseph, A.C. Effects of biochar from slow pyrolysis of papermill waste on agronomic performance and soil fertility. Plant Soil 2010, 327, 235–246. [Google Scholar]
  19. Chan, K.Y.; Van Zwieten, L.; Meszaros, I.; Downie, A.; Joseph, S. Agronomic values of greenwaste biochar as a soil amendment. Aust. J. Soil Res. 2007, 45, 629–634. [Google Scholar] [CrossRef]
  20. Zheng, X.; Xu, W.; Dong, J.; Yang, T.; Shangguan, Z.; Qu, J. The effects of biochar and its applications in the microbial remediation of contaminated soil: A review. J. Hazard. Mater. 2022, 438, 129557. [Google Scholar] [CrossRef]
  21. Baiamonte, G.; Crescimanno, G.; Parrino, F.; De Pasquale, C. Effect of biochar on the physical and structural properties of a desert sandy soil. Catena 2019, 175, 294–303. [Google Scholar] [CrossRef]
  22. Wang, L.; Leghari, S.J.; Wu, J.; Wang, N.; Pang, M.; Jin, L. Interactive effects of biochar and chemical fertilizer on water and nitrogen dynamics, soil properties and maize yield under different irrigation methods. Front. Plant Sci. 2023, 14, 1230023. [Google Scholar] [CrossRef] [PubMed]
  23. Qian, S.; Zhou, X.; Fu, Y.; Song, B.; Yan, H.; Chen, Z.; Sun, Q.; Ye, H.; Qin, L.; Lai, C. Biochar-compost as a new option for soil improvement: Application in various problem soils. Sci. Total Environ. 2023, 870, 162024. [Google Scholar] [CrossRef] [PubMed]
  24. Juhos, K.; Szabó, S.; Ladányi, M. Influence of soil properties on crop yield: A multivariate statistical approach. Int. Agrophys. 2015, 29, 433–440. [Google Scholar] [CrossRef]
  25. Mallarino, A.P.; Oyarzabal, E.S.; Hinz, P.N. Interpreting within-field relationships between crop yields and soil and plant variables using factor analysis. Precis. Agric. 1999, 1, 15. [Google Scholar] [CrossRef]
  26. Shukla, M.K.; Lal, R.; Ebinger, M. Principal component analysis for predicting corn biomass and grain yields. Soil Sci. 2004, 169, 215–224. [Google Scholar] [CrossRef]
  27. Swapnil, J.R.; Digvijay, S.; Mandal, S.S. Principal component analysis in maize (Zea mays L.) under normal sown condition of Bihar. Pharma Innov. J. 2021, 10, 641–644. [Google Scholar]
  28. Fasinmirin, J.T.; Olorunfemi, I.E.; Olakuleyin, F. Strength and hydraulics characteristics variations within a tropical Alfisol in Southwestern Nigeria under different land use management. Soil Tillage Res. 2018, 182, 45–56. [Google Scholar] [CrossRef]
  29. International Institute of Tropical Agriculture (IITA). Maize Seed Production Manual. 2014. Available online: www.iita.org (accessed on 6 October 2015).
  30. International Biochar Initiative (1BI). Standardized Product Definition and Product Testing Guidelines for Biochar That Is Used in Soil. 2011. Available online: http://www.biochar-international.org/characterizationstandard (accessed on 15 November 2015).
  31. Ndor, E.; Dauda, S.N.; Azagakui, E.D. Response of maize varieties (Zea mays) to biochar amended soil in Lafia, Nigeria. Am. J. Exp. Agric. 2015, 5, 525–531. [Google Scholar] [CrossRef]
  32. Blake, G.R.; Hartage, K.H. Bulk density. In Methods of Soil Analysis, Part 1. Physical and Mineralogical Methods, 2nd ed.; Klute, A., Ed.; Agronomy Monograph: Madison, WI, USA, 1986; Number 9; pp. 363–375. [Google Scholar]
  33. Marcos, B.C.; Sidney, R.V.; Adre, L.O.V.; Lenilson, D.S.M.; Lucia, H.C.D.A.; Daniel, F.D.C. Topography and spatial variability of soil physical properties. Sci. Agric. 2009, 66, 338–352. [Google Scholar]
  34. E.P. 458; Field Evaluation of Micro Irrigation Systems. American Society of Agricultural Engineers (ASAE): St. Joseph, MI, USA, 1996.
  35. Gheysari, M.; Loescher, H.W.; Sadeghi, S.H.; Mirlatifi, S.M.; Zareian, M.J.; Hoogenboom, G. Water-yield relations and Water use efficiency of maize under nitrogen fertigation for semiarid environments: Experiment and synthesis. In Advances in Agronomy; Sparks, D.L., Ed.; Elsevier: Amsterdam, The Netherlands, 2015; pp. 175–229. [Google Scholar]
  36. Kuscu, H.; Karasu, A.; Oz, M.; Demir, A.O.; Turgut, I. Effect of irrigation amounts applied with drip irrigation on maize evapotranspiration, yield, water use efficiency, and net return in a sub–humid climate. Turk. J. Field Crops 2013, 18, 13–19. [Google Scholar]
  37. Stewart, D.W.; Dwyer, L.M. Mathematical characterization of leaf shape and area of maize hybrids. Crop Sci. 1999, 39, 422–427. [Google Scholar] [CrossRef]
  38. Wang, F.; Kang, S.; Du, T.; Li, F.; Qiu, R. Determination of comprehensive quality index for tomato and its response to different irrigation treatments. Agric. Water Manag. 2011, 98, 1228–1238. [Google Scholar] [CrossRef]
  39. Abdel-Fattah, M.K.; Mohamed, E.S.; Wagdi, E.M.; Shahin, S.A.; Aldosari, A.A.; Lasaponara, R.; Alnaimy, M.A. Quantitative Evaluation of Soil Quality Using Principal Component Analysis: The Case Study of El-Fayoum Depression Egypt. Sustainability 2021, 13, 1824. [Google Scholar] [CrossRef]
  40. Amanullah, M.J.; Nawab, K.; Ali, A. Response of Specific Leaf Area (SLA), Leaf Area Index (LAI) and Leaf Area Ratio (LAR) of maize (Zea mays L.) to Plant Density, Rate and Timing of Nitrogen Application. World Appl. Sci. J. 2007, 2, 235–243. [Google Scholar]
  41. Christopher, D.; Catherine, E.B.; Robert, C.B.; Mackay, A.E.; Okure, A.A. Comparison of kiln-derived and gasifier-derived biochars as soil amendments in the humid tropics. Biomass Bioenergy 2012, 37, 161–168. [Google Scholar]
  42. Mete, F.Z.; Mia, S.; Dijkstra, F.A. Synergistic effects of biochar and NPK fertiliser on soybean yield in an alkaline soil. Pedosphere 2015, 25, 713–719. [Google Scholar] [CrossRef]
  43. Gundale, M.J.; DeLuca, T.H. Temperature and source material influence ecological attributes of Ponderosa pine and Douglas Fir charcoal. For. Ecol. Manag. 2006, 231, 86–93. [Google Scholar] [CrossRef]
  44. Liang, F.; Li, G.T.; Lin, Q.M.; Zhao, X.R. Crop yield and soil properties in the first 3 years after biochar application to a calcareous soil. J. Integr. Agric. 2014, 13, 525–532. [Google Scholar] [CrossRef]
  45. Ren, Y.; Li, Q.; Du, X.; Zhang, Y.; Wang, H.; Shi, G.; Wei, M. Analysis of Corn Yield Prediction Potential at Various Growth Phases Using a Process-Based Model and Deep Learning. Plants 2023, 12, 446. [Google Scholar] [CrossRef]
  46. Elemile, O.O.; Ibitogbe, E.M.; Folorunso, O.P.; Ejiboye, P.O.; Adewumi, J.R. Principal component analysis of groundwater sources pollution in Omu-Aran community, Nigeria. Environ. Sci. 2021, 80, 690. [Google Scholar] [CrossRef]
  47. Gómez-del-Campo, M.; Lisserague, J.R. Effect of water stress on leaf area development, photosynthesis and productivity. Am. J. Enol. Vitic. 2002, 53, 138–143. [Google Scholar] [CrossRef]
  48. Vos, J.; van der Putten, P.E.L.; Birch, C.J. Effect of nitrogen supply on leaf appearance, leaf growth, leaf nitrogen economy and photosynthetic capacity in maize (Zea mays L.). Field Crop. Res. 2005, 93, 64–73. [Google Scholar] [CrossRef]
  49. Cechin, I.; de Fatima, F.T. Effect of nitrogen supply on growth and photosynthesis of sunflower plant grown in the green house. J. Plant Sci. 2004, 166, 1379–1385. [Google Scholar] [CrossRef]
  50. Lebon, E.; Pellegrino, A.; Louarn, G.; Lecoeur, J. Branch development controls leaf area dynamics in grapevine (Vitis vinifera) growing in drying soil. Ann. Bot. 2006, 98, 175–185. [Google Scholar] [CrossRef]
  51. Singh, H.; Northup, B.K.; Rice, C.W.; Prasad, P.V.V. Biochar applications influence soil physical and chemical properties, microbial diversity, and crop productivity: A meta-analysis. Biochar 2022, 4, 8. [Google Scholar] [CrossRef]
  52. Gutierrez-Boem, F.T.; Thomas, G.W. Leaf area development in soybean affected by phosphorus nutrition and water deficit. J. Plant Nutr. 2001, 24, 1711–1729. [Google Scholar] [CrossRef]
  53. Magdi, T.; Abdehamid Takatsugu, H. Composting of rice straw with oilseed rape cake and poultry manure and its effects on faba bean (Vicia faba L.) growth and soil properties. Bioresour. Technol. 2004, 93, 183–189. [Google Scholar]
  54. Patanè, C.; Saita, A. Biomass, fruit yield, water productivity and quality response of processing tomato to plant density and deficit irrigation under a semi-arid Mediterranean climate. Crop Pasture Sci. 2015, 66, 224–234. [Google Scholar] [CrossRef]
  55. Fernández, M.D.; Bonachela, S.; Orgaz, F.; Thompson, R.; López, J.C.; Granados, M.R.; Gallardo, M.; Fereres, E. Measurement and estimation of plastic greenhouse reference evapotranspiration in a Mediterranean climate. Irrig. Sci. 2010, 28, 497–509. [Google Scholar] [CrossRef]
Figure 1. Weather data for the experimental site during the growing period (A) and historical 10 years of climatic data of the experimental site coincide with the periods of planting and harvesting (B).
Agriculture 14 01813 g001
Figure 2. The graphs of irrigation times against the irrigation amounts in 2017 (A) and 2018 (B).
Agriculture 14 01813 g002
Figure 3. Influence of the individual and co-applications of the amendments on maize yield in the growing seasons of year 2017 (A) and year 2018 (B). Note: Means of the maize yield with different letters are significant at a 5% level of significance.
Agriculture 14 01813 g003
Figure 4. Relationship between the eigen value of the growth parameters and factor number.
Agriculture 14 01813 g004
Figure 5. Pareto chart of the relationship between biochar and fertilizer on maize LAI under drip irrigation for the 2017 growing season.
Agriculture 14 01813 g005
Figure 6. Pareto chart of the relationship between biochar and fertilizer on maize LAI under drip irrigation for the 2018 growing season.
Agriculture 14 01813 g006
Table 1. Initial soil and maize cob-residue biochar properties were used for the 2 year experiment.
PropertiesSoil 1Soil 2Biochar Used in This Study
Mg (g kg−1)0.330.290.30
Ca(g kg−1)0.830.730.56
Na(g kg−1)0.160.180.40
K(g kg−1)0.210.223.92
P(mg kg−1)7.215.348.24
Total Nitrogen (g kg−1)46.018.0100.9
CEC (cmol kg−1)8.267.2616.26
pH(H20) 1:105.124.999.42
Total Organic carbon (%)0.941.1869
Bulk density (g cm−3)1.35 ± 0.041.35 ± 0.040.4 ± 0.01
Soil 1 and Soil 2 are soil properties prior to experiments of the 2017 and 2018 growing seasons.
Table 2. Summary of the methods used for the analysis of the soil and soil–biochar mixture.
Soil PropertyMethod
pHpH electrometer in the soil–water mixture
CECAmmonium acetate method
Total NitrogenKjeldahl method
Available KFlame atomic absorption spectrometry after the concentration of the leachates have been obtained from ammonium acetate extraction [31]
Available POlsen method by extracting from the solution of sodium bicarbonate
Organic carbonWalkley–Black chromic acid titration method
Bulk densityRatio of soil mass to the core volume in g cm−3 [32]
Table 3. Experimental treatments for both growing seasons (2017 and 2018).
S/NAmendment TreatmentsDescription of Treatments
1F0B0FIA100Without fertilizer and without biochar at 100% full irrigation amount
2F0B20FIA100Without fertilizer and with biochar at 100% full irrigation amount
3F300B0FIA100With fertilizer and without biochar at 100% full irrigation amount
4F300B20FIA100With fertilizer and biochar at 100% full irrigation amount
5F0B0FIA80Without fertilizer and without biochar at 80% full irrigation amount
6F0B20FIA80Without fertilizer and with biochar at 80% full irrigation amount
7F300B0FIA80With fertilizer and without biochar at 80% full irrigation amount
8F300B20FIA80With fertilizer and biochar at 80% full irrigation amount
9F0B0FIA60Without fertilizer and without biochar at 60% full irrigation amount
10F0B20FIA60Without fertilizer and with biochar at 60% full irrigation amount
11F300B0FIA60With fertilizer and without biochar at 60% full irrigation amount
12F300B20FIA60With fertilizer and biochar at 60% full irrigation amount
Table 4. Main and interaction effects of inorganic fertilizer (F) and maize cob-residue biochar (B) on the average of maize plant parameters measured (average of 2017 and 2018 growing season data).
Irrigation TreatmentAmendmentsNLLA (cm2)LAIPH (cm)
F300B2021 ± 2.83 a592.80 ± 24.03 a2.73 ± 0.55 a154.40 ± 8.61 a
100% FIAF300B020 ± 3.54 a564.60 ± 24.16 a2.51 ± 0.53 ab151.53 ± 8.63 ab
F0B2019 ± 3.54 a509.10 ± 24.22 a2.19 ± 0.52 b145.06 ± 6.0 ab
F0B018 ± 4.24 a487.00 ± 23.63 a2.03 ± 0.50 b139.91 ± 5.9 b
80% FIAF300B2020 ± 3.33 a569.50 ± 23.02 a2.58 ± 0.54 a153.02 ± 8.1 a
F300B020 ± 3.54 a547.60 ± 23.79 a2.44 ± 0.49 a147.90 ± 8.3 a
F0B2019 ± 3.14 b495.90 ± 23.52 a2.09 ± 0.50 a143.63 ± 8.5 a
F0B019 ± 4.12 b483.80 ± 24.13 a2.01 ± 0.51 a137.45 ± 8.7 a
60% FIAF300B2020 ± 4.22 a529.40 ± 23.41 a2.30 ± 0.74 a145.62 ± 8.61 a
F300B019 ± 3.17 a502.30 ± 23.34 ab2.14 ± 0.51 a144.25 ± 8.02 a
F0B2018 ± 4.14 ab473.70 ± 27.88 ab1.90 ± 0.57 ab128.88 ± 8.60 a
F0B016 ± 3.13 b394.30 ± 26.9 b1.42 ± 0.28 b104.21 ± 8.61 b
ANOVA
I ***************
B ******
F ****************
B × F nsnsnsns
B × I nsnsnsns
F × I nsnsns***
F × I × B nsnsnsns
Data are the means of three replicates; ns, not significant; *, significant at p ≤ 0.05; ***, significant at p ≤ 0.001; ****, significant at p ≤ 0.0001 for both main effects of biochar, fertilizer and irrigation, and their interaction effects on Number of Leaves (NL), Leaf Area (LA), Leaf Area Index (LAI), and Plant Height (PH). Note: Means of the maize growth with different letters are significant at a 5% level of significance.
Table 5. Average data of the effects of biochar (B), fertilizer (F), and irrigation (I) applications on WUE and WP components.
Irrigation TreatmentsAmendmentsWUE (kg ha−1.mm−1)WP (kg ha−1.mm−1)
F300B2014.64 ± 0.071 a14.38 ± 0.81 a
100% FIAF300B012.98 ± 0.13 ab13.05 ± 0.30 ab
F0B2010.63 ± 0.29 bc11.98 ± 0.01 bc
F0B011.13 ± 1.04 c9.93 ± 0.74 c
80% FIAF300B2015.89 ± 1.31 a15.99 ± 0.77 a
F300B014.41 ± 1.20 ab14.50 ± 0.69 ab
F0B2012.30 ± 1.61 b12.38 ± 1.09 b
F0B011.00 ± 2.42 b11.07 ± 1.87 b
60% FIAF300B2016.91 ± 1.95 a17.07 ± 1.94 a
F300B014.97 ± 1.92 b15.11 ± 1.28 b
F0B2011.17 ± 1.51 c11.27 ± 1.06 c
F0B09.15 ± 1.22 c9.23 ± 1.95 c
ANOVA
I ********
B ********
F ********
B*F nsns
B*I nsns
F*I ns****
F*I*B nsns
Data are means of three replicates; ns, not significant; ****, significant at p ≤ 0.0001 for both main effects of biochar, fertilizer, and irrigation, and their interaction effects on WUE and WP. Note: Means of the maize efficiency terms with different letters are significant at a 5% level of significance.
Table 6. Inter-relationships between the growth, yield parameters, and efficiency terms of a maize crop.
YieldWUEWPNLLALAI
WUE0.977
0.0001
WP0.7410.844
0.0060.001
NL0.8740.8540.778
0.00010.00010.003
LAI0.9330.8870.7320.964
0.00010.00010.0070.0001
PH0.8750.8350.6940.935 0.939
0.00010.0010.0120.0001 0.0001
Note: the value above in Table 6 is the correlation coefficient, and the below value is the significance level. WUE is water use efficiency; WP is water productivity; NL is the number of leaves; LAI is the leaf area index; PH is plant height.
Table 7. Factor loading of maize growth parameters.
VariableFactor 1Factor 2Factor 3Factor 4Communality
NL0.982−0.038−0.185−0.0001.000
LA0.991−0.1080.077−0.0231.000
LAI0.992−0.0970.0740.0241.000
PH0.9680.2480.034−0.0011.000
Note: NL is the number of leaves, LA is the leaf area, LAI is the leaf area index, PH is the plant height.
Table 8. Factor loadings for the optimization parameters using PCA.
VariableFactor 1Factor 2Factor 3Communality
Yield0.408−0.913−0.011
WUE0.885−0.445−0.1331
WP0.919−0.3860.0841
Variance1.7941.18110.02493
% Var0.5980.3940.0081
Table 9. Ranking of the best-performing treatment combination for biochar, inorganic fertilizer, and irrigation.
TreatmentsCQI1CQI2CQI
B20F300IA1001.059071−0.745530.313538
B0F300IA1000.215687−0.2872−0.07151
B20F0IA100−0.797940.318962−0.47898
B0F0IA100−1.081110.309515−0.77159
B20F300IA801.606139−0.805450.800689
B0F300IA800.809073−0.411670.3974
B20F0IA80−0.328070.155346−0.17272
B0F0IA80−1.036770.513523−0.52325
B20F300IA601.909407−0.704511.204896
B0F300IA600.903079−0.243530.659549
B20F0IA60−1.09270.691569−0.40113
B0F0IA60−2.165871.208978−0.9569
Note: The bolded treatments indicated the first three optimal treatments for the grain yield and water use efficiency.
Disclaimer/Publisher’s Note: The statements, opinions and data contained in all publications are solely those of the individual author(s) and contributor(s) and not of MDPI and/or the editor(s). MDPI and/or the editor(s) disclaim responsibility for any injury to people or property resulting from any ideas, methods, instructions or products referred to in the content.

