Article

Camellia oleifera Tree Detection and Counting Based on UAV RGB Image and YOLOv8

1
College of Geoscience and Surveying Engineering, China University of Mining and Technology, Beijing 100083, China
2
Inner Mongolia Research Institute of China University of Mining and Technology-Beijing, Ordos 010300, China
*
Author to whom correspondence should be addressed.
Agriculture 2024, 14(10), 1789; https://doi.org/10.3390/agriculture14101789
Submission received: 9 September 2024 / Revised: 29 September 2024 / Accepted: 1 October 2024 / Published: 12 October 2024
(This article belongs to the Section Digital Agriculture)

Abstract

:
The detection and counting of Camellia oleifera trees are important parts of the yield estimation of Camellia oleifera. The ability to identify and count Camellia oleifera trees quickly has always been important in the context of research on the yield estimation of Camellia oleifera. Because of their specific growing environment, it is a difficult task to identify and count Camellia oleifera trees with high efficiency. In this paper, based on a UAV RGB image, three different types of datasets, i.e., a DOM dataset, an original image dataset, and a cropped original image dataset, were designed. Combined with the YOLOv8 model, the detection and counting of Camellia oleifera trees were carried out. By comparing YOLOv9 and YOLOv10 in four evaluation indexes, including precision, recall, mAP, and F1 score, Camellia oleifera trees in two areas were selected for prediction and compared with the real values. The experimental results show that the cropped original image dataset was better for the recognition and counting of Camellia oleifera, and the mAP values were 8% and 11% higher than those of the DOM dataset and the original image dataset, respectively. Compared to YOLOv5, YOLOv7, YOLOv9, and YOLOv10, YOLOv8 performed better in terms of the accuracy and recall rate, and the mAP improved by 3–8%, reaching 0.82. Regression analysis was performed on the predicted and measured values, and the average R2 reached 0.94. This research shows that a UAV RGB image combined with YOLOv8 provides an effective solution for the detection and counting of Camellia oleifera trees, which is of great significance for Camellia oleifera yield estimation and orchard management.

1. Introduction

Camellia oleifera is an important woody oil tree species in hilly and mountainous areas in southern China [1,2]. It is rich in unsaturated fatty acids, proteins, and various vitamins and has high edible value [3]. In addition, Camellia oleifera is also widely used in medicine and makeup [4,5] and has high economic value [6,7]. By 2022, the total planted area of China’s Camellia oleifera industry exceeded 11 million acres, and the output of Camellia oleifera reached 1 million tons. At present, China’s high-yield Camellia oleifera gardens can produce more than 40 kg of Camellia oleifera per acre, and their comprehensive utilization benefits can reach thousands of yuan. Due to China’s serious lack of self-sufficiency in edible vegetable oils, it is important to develop the Camellia oleifera industry by using the hilly and mountain resources in suitable areas in the south, transforming and upgrading old Camellia oleifera gardens and building new Camellia oleifera gardens with high standards. The most urgent and top priorities are to improve the comprehensive benefits of mountainous areas, increase the employment and incomes of foresters and farmers, ensure grain and oil security, promote ecological construction, consolidate poverty alleviation achievements, and promote rural revitalization [8,9]. Therefore, the detection and counting of Camellia oleifera trees is of great significance.
Tree counting is an important part of forest resource investigation, ecological research, and environmental management [10]. Especially in economic forests, the rapid identification and counting of trees has always been important in the context of research on fruit yield estimation. Traditional tree counting methods include visual counting methods, sampling methods, etc. Although these methods are simple and intuitive, they also have the disadvantages of high investigation cost, time, and effort [11,12]. At the same time, they are inefficient and easily produce errors in large areas or dense forest areas, and they are also affected by climatic conditions and time constraints. With the development of new technologies, such as remote sensing technology and artificial intelligence, traditional tree counting methods have been gradually replaced by modern technologies, while the detection of individual fruit trees based on remote sensing technology [13,14] and artificial intelligence [15,16,17] has gradually received more attention, and there are many related research results.
In recent years, domestic and foreign scholars have carried out a large number of studies on tree counting using data from different sources, mainly including satellite image data, laser point cloud data, UAV images, and other data forms. These data have their own advantages and disadvantages, and suitable data sources can be selected according to the research object, scope, and accuracy requirements. Abd Mubin, Nurulain et al. [18] used deep learning methods to predict and count oil palms in satellite images by using two different convolutional neural networks to detect young and mature oil palms. They exported the prediction results to Geographic Information System (GIS) software to create oil palm prediction maps for mature and young oil palms. Zhang et al. [19] used the Gaofen-6 remote sensing satellite as a data source to classify forest tree species by using a feature optimization spatial algorithm and the maximum likelihood method. Grabska et al. [20] used the random forest-based variable importance selection algorithm (VSURF) and recursive feature elimination method (RFE) to create nine different variable subsets from multi-temporal Sentinel-2 data and environmental terrain data and used random forest, support vector machine (SVM), and XGBoost algorithms to classify tree species. Their results showed that the SVM classifier was superior to the other two classifiers, and the highest accuracy was 86.9%. Although satellite remote sensing images can obtain data from a large area in a short time, their spatial resolution is low, and it is difficult to classify tree species. LiDAR [21] has a strong penetrating ability, which can penetrate vegetation through canopy gaps and obtain information on the understory vegetation. The three-dimensional structure information of trees can be used to achieve more accurate tree classification [22,23]. For example, Lin et al. [24] extracted structural features of trees from LiDAR data and used SVM classifiers to classify tree species. Zhang et al. [25] used the laser point cloud of a UAV to extract vegetation points, determine the regional scope of vegetation, and segment vegetation images to achieve counting. Yrttimaa et al. [26] extracted the tree parameters of a larch plantation based on ground laser point cloud data. Although LiDAR technology provides the possibility of collecting forest structure data more accurately, its equipment is more expensive, and the massive amount of point cloud data will require large data storage, the post-processing of which is difficult [27]. Using a UAV equipped with a variety of sensors (visible light sensors, multi-spectral sensors, hyperspectral sensors, etc.) as a platform, remote sensing images with high spatial resolution can be obtained [28,29], and detailed information of trees can be directly observed from these images, such as the shape and color of leaves and branches [30,31]. Xu et al. [32] used a small UAV to acquire high-resolution images in the demonstration area and then established a random forest model according to the extracted tree crown information to complete the classification of the tree species, with a classification accuracy of 79.51%. Park et al. [33] combined high-resolution RGB images acquired by drones with machine learning algorithms to monitor trees in a tropical forest in Panama. Onishi et al. [34] studied the practicability and robustness of tree species identification in Japan’s temperate forests based on UAV RGB images and deep learning. Nguyen et al. [35] identified individual diseased fir trees from UAV images using deep learning methods in insect-infested forests.
Table 1 summarizes the above literature based on four aspects: the research object, survey region, data type, and accuracy. Satellite remote sensing data tend to cover a large survey region for tree recognition in forest areas, with limited accuracy because of the coarse spatial resolution. LiDAR data are usually collected through airborne LiDAR or ground-based LiDAR platforms. Both airborne and ground-based LiDAR can usually be applied to diverse scenarios at different spatial coverage rates, with an accuracy of around 85%. In summary, satellite remote sensing images and airborne LiDAR data are more suitable for large-scale tree recognition, ground-based LiDAR is more suitable for small-scale tree recognition, and drone imagery has a wider range of applications. The tree recognition accuracy of the three data formats is generally around 80–85%.
Our research object was the Camellia oleifera tree, a shrub-like tree used in economic forests. The study area was selected in a Camellia oleifera demonstration area to identify the number of Camellia oleifera trees for further estimation of their yield. Since the study area was small and the Camellia oleifera trees were densely distributed, it was more suitable to choose drone imagery data for this research. Therefore, we chose to obtain RGB imagery from drones as the data source and used deep learning methods to count the Camellia oleifera trees. In this paper, we first built three types of Camellia oleifera tree datasets: a DOM dataset, an original image dataset, and a cropped original image dataset. We trained the YOLOv8 target detection model on the three datasets and compared and analyzed the results. Then, we selected the best-trained dataset from the three, trained the YOLOv5, YOLOv7, YOLOv8, YOLOv9, and YOLOv10 models separately, and compared and analyzed the training effects. Finally, we selected two areas of imagery, predicted the number of Camellia oleifera trees using the model with the best training performance, and compared the predicted values with the ground-truth values.
The main contents of this article are as follows:
(1)
Research object selection: For this paper, we selected Camellia oleifera trees as the research object. Previous researchers have paid more attention to Camellia oleifera fruits but research on Camellia oleifera trees is lacking. By studying Camellia oleifera trees, we can create a new yield estimation model based on the number of Camellia oleifera trees and the number of Camellia oleifera fruits per tree.
(2)
Dataset construction: For this paper, we first designed two datasets based on previous experience (a DOM dataset and an original image dataset). In order to obtain better experimental results, a new dataset (a cropped original image dataset) was explored and created. The experiment showed that the new dataset led to a significant improvement in the results.
The remaining sections of the article are organized as follows. In Section 2, we introduce the data acquisition method, the dataset preparation method, and the YOLOv8 detection model applied to the research area. Section 3 presents the research results and comparative experiments. The Section 4 addresses related issues, while the Section 5 provides the conclusion.

2. Materials and Methods
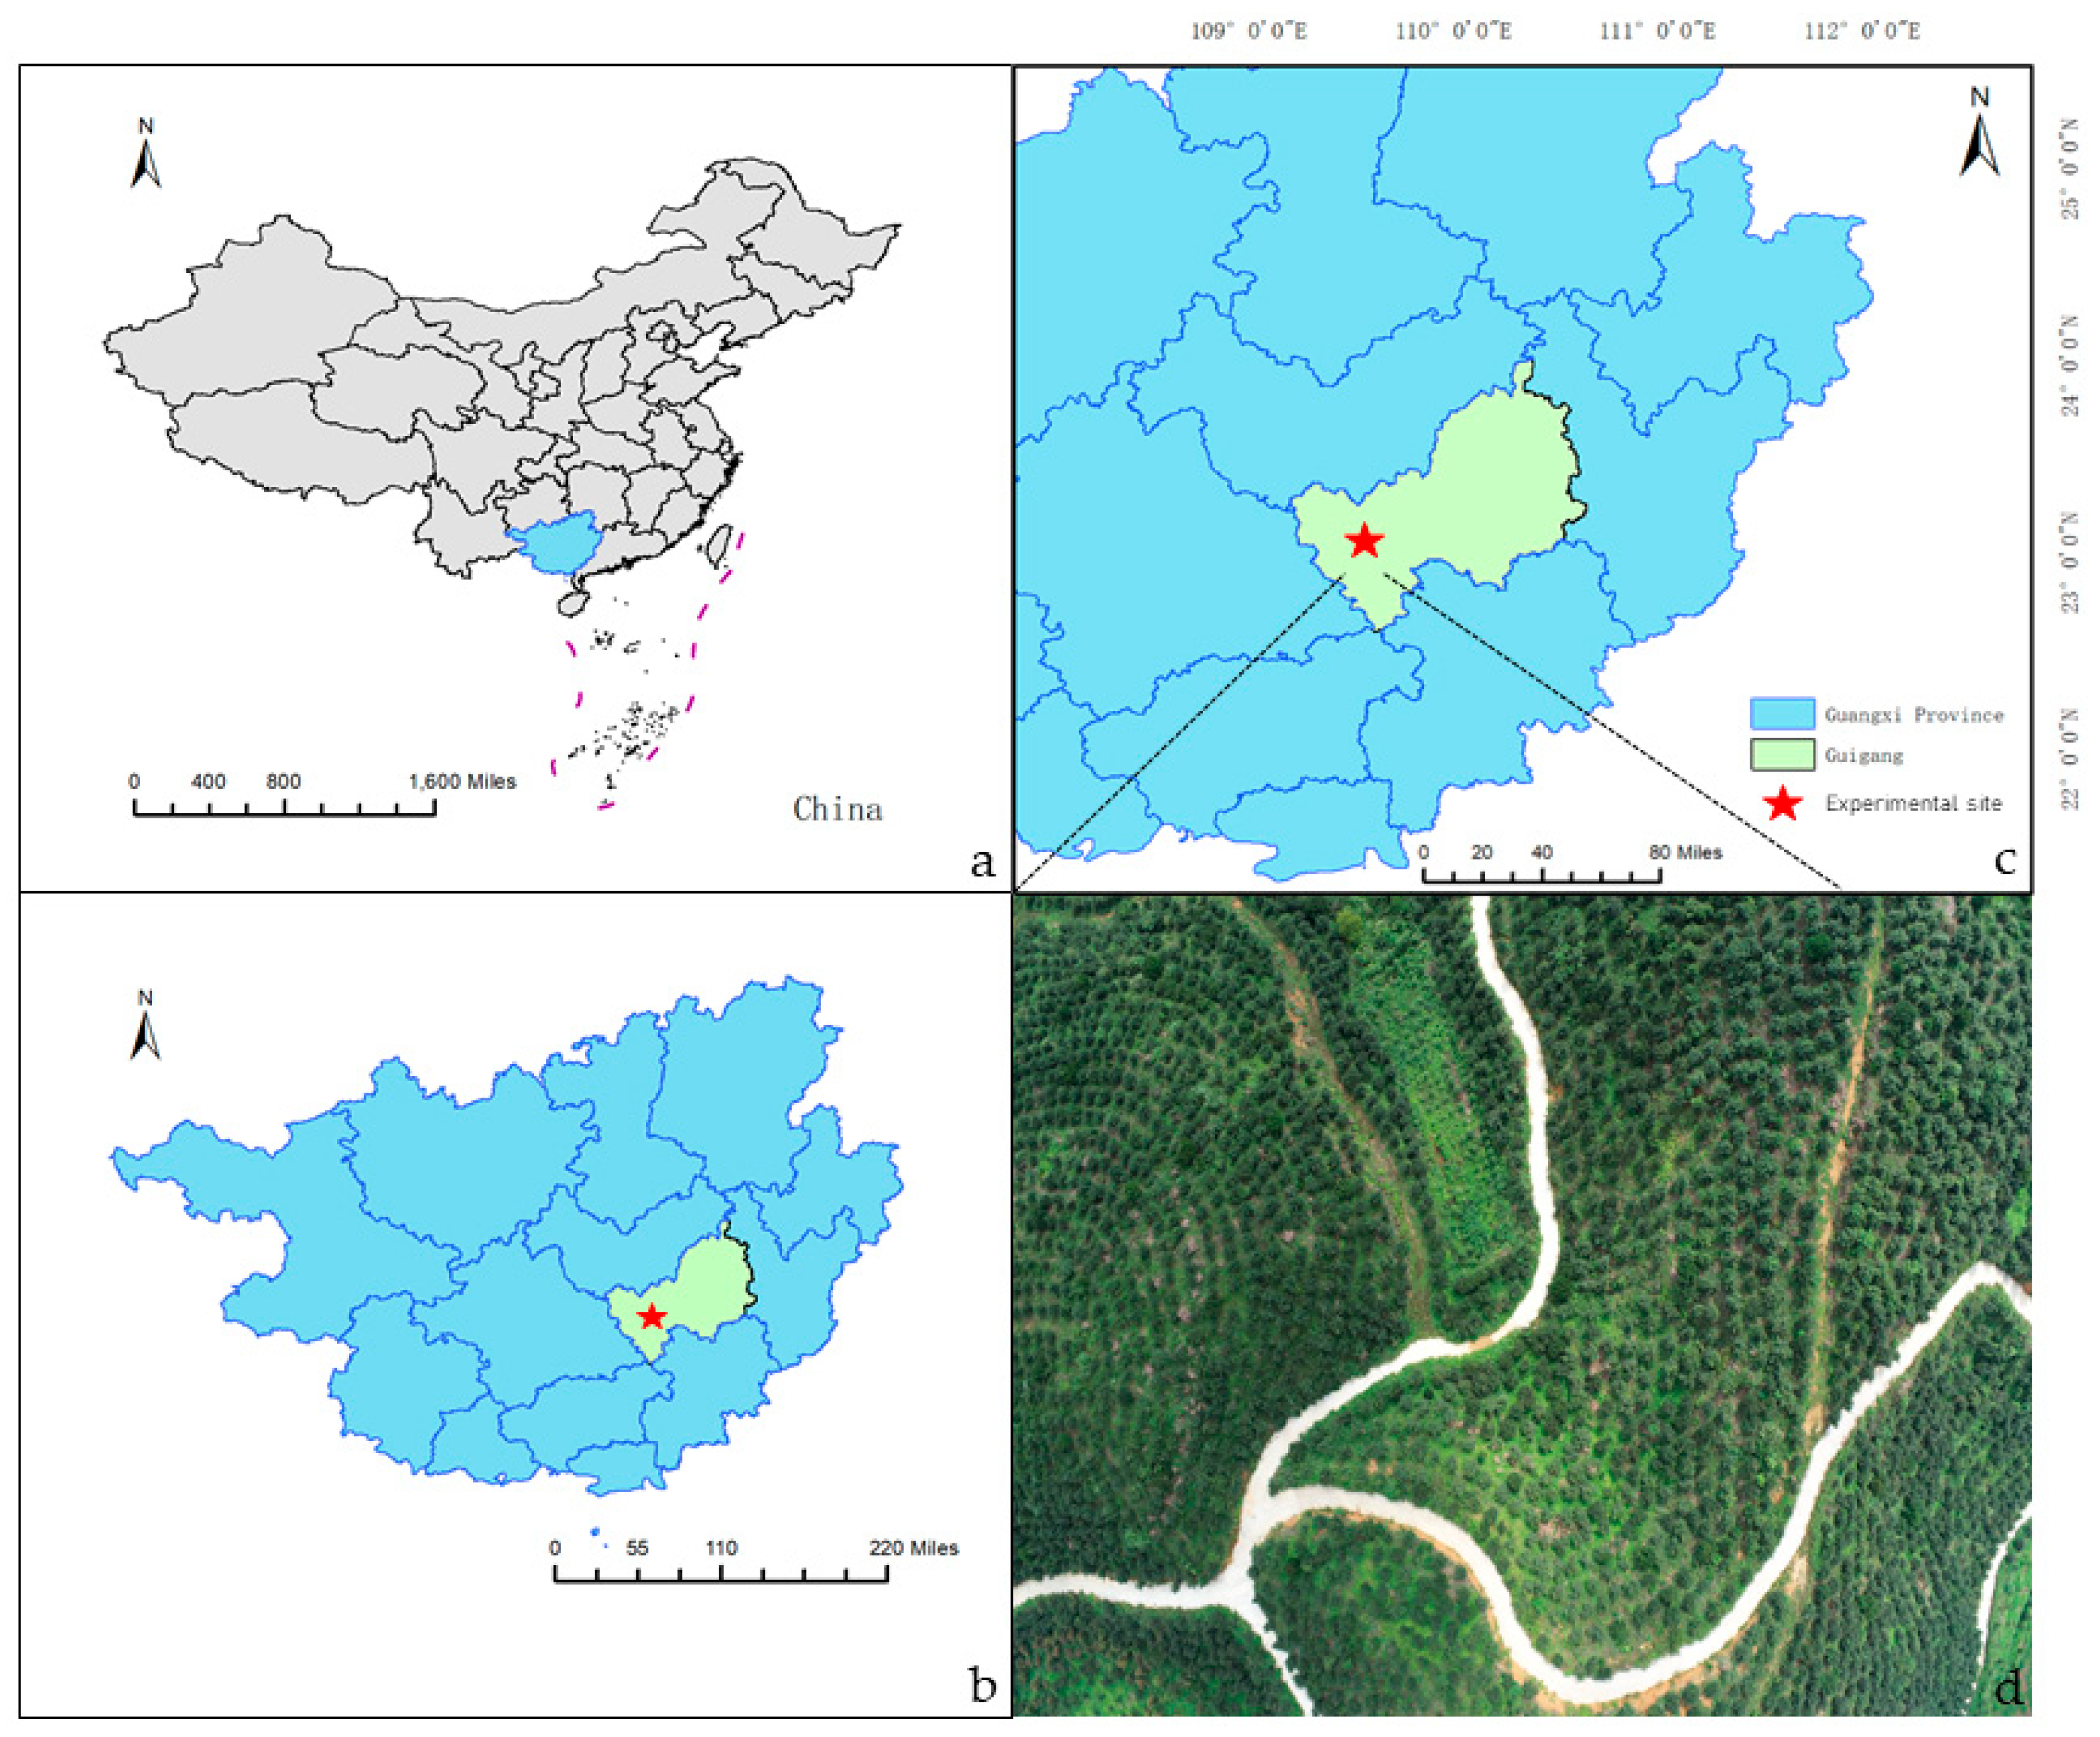
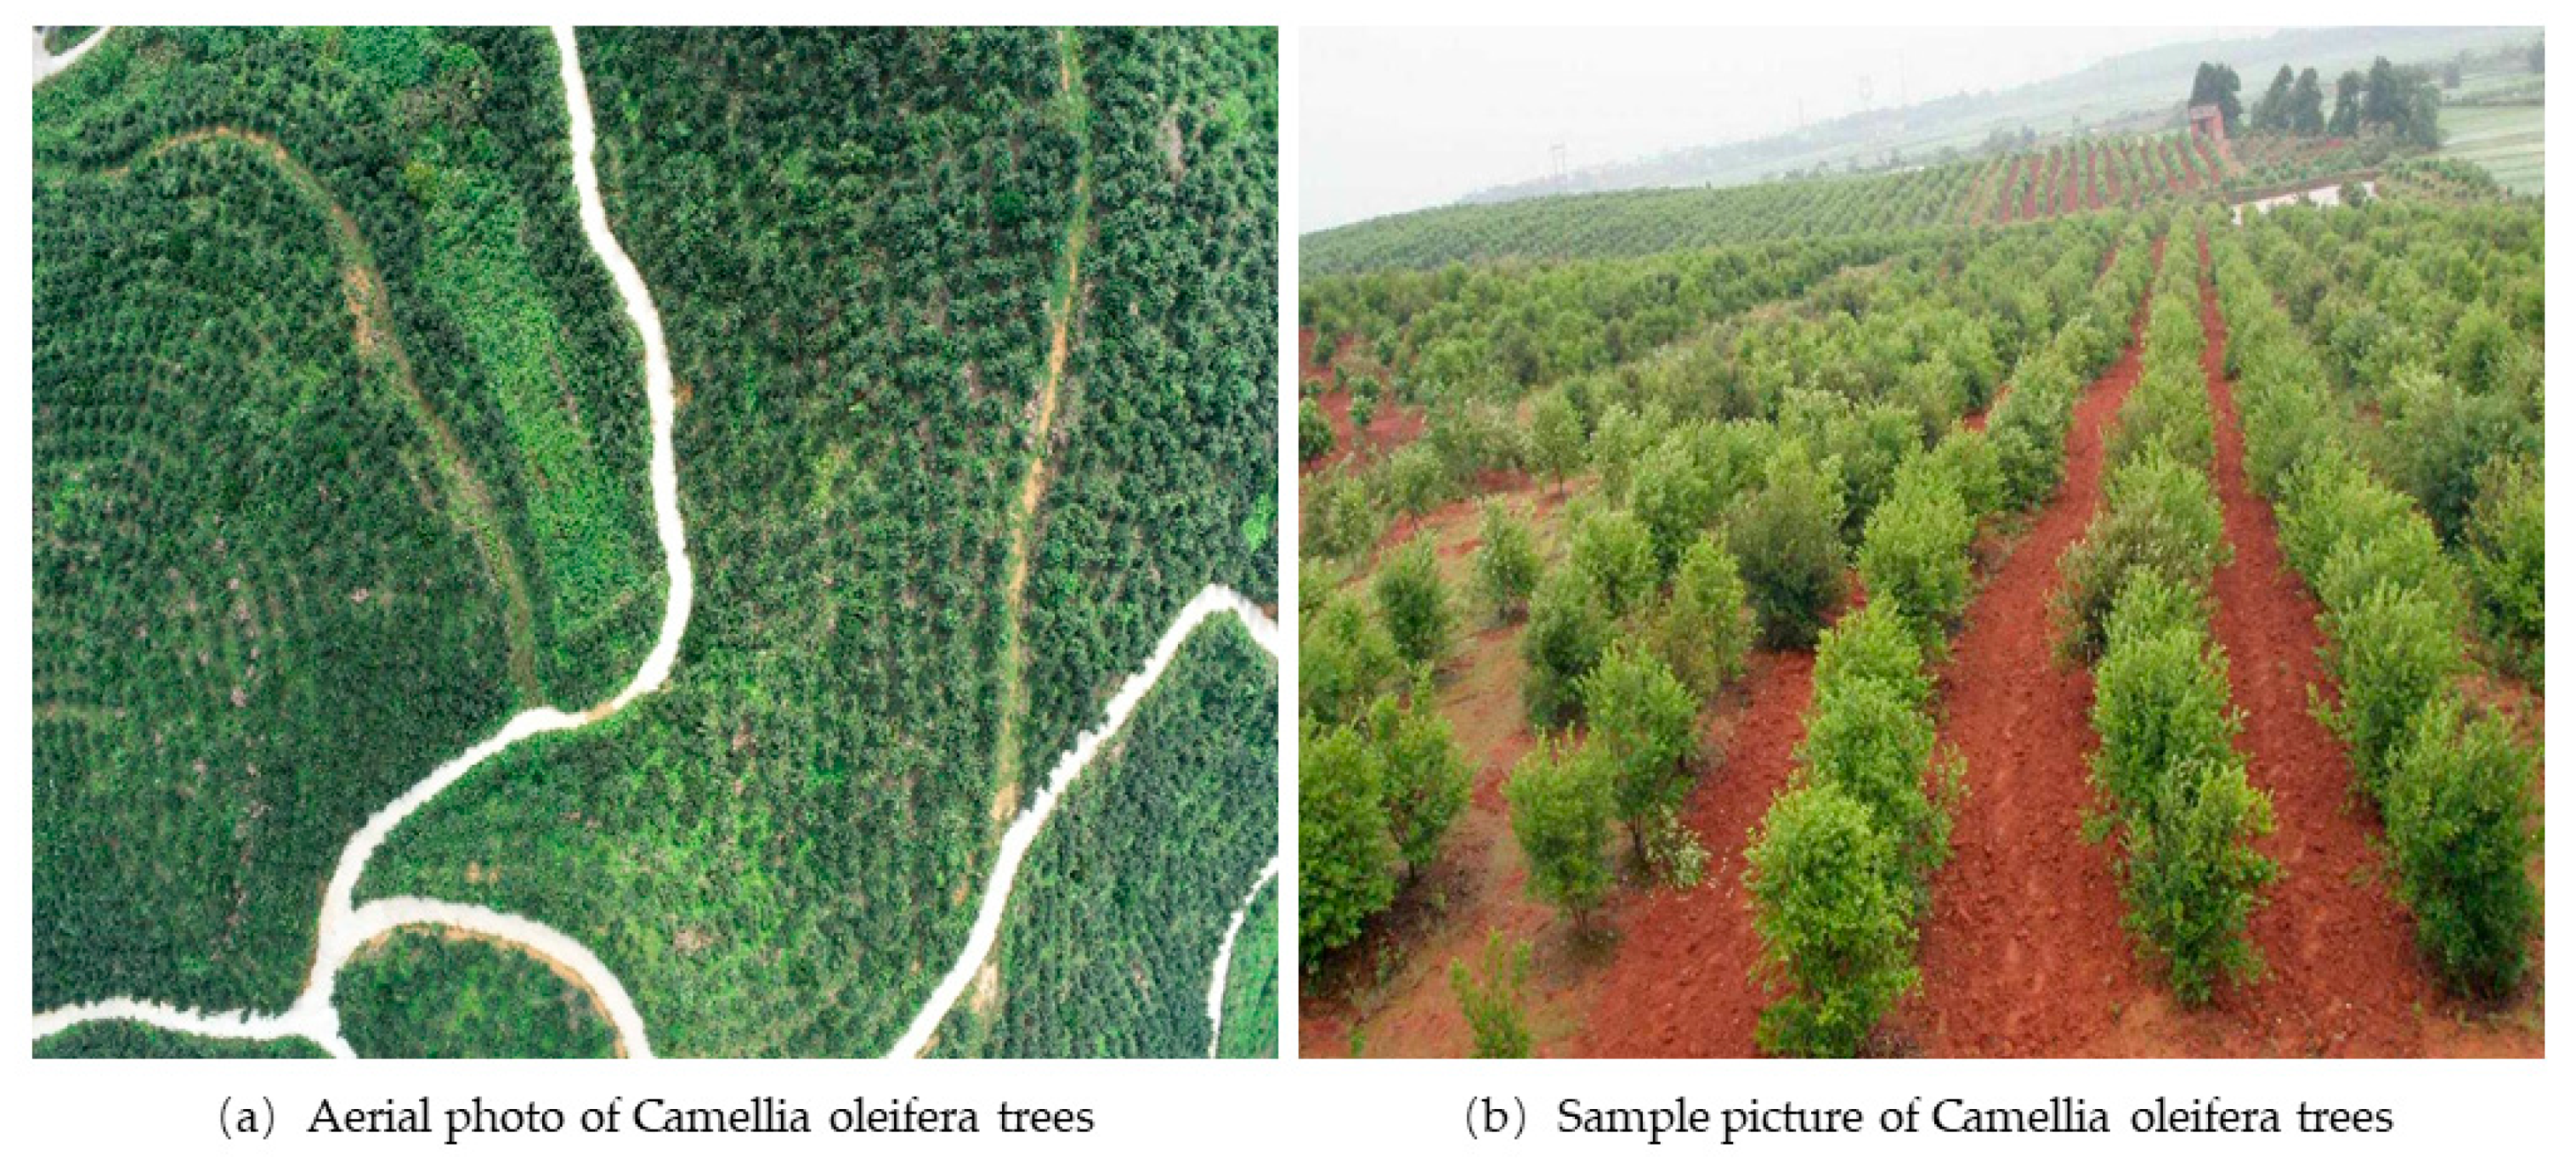
2.1. Survey Region

The research area was located in Liutai Village, Guigang City, Guangxi Zhuang Autonomous Region, which is a Camellia oleifera planting demonstration area. The central geographical location is 109°37′ east longitude and 23°14′ north latitude. The terrain is mostly mountainous with large relief. The vegetation planted is mainly Camellia oleifera, with a small amount of eucalyptus, corn, etc. The research area is shown in Figure 1. According to statistics from 2023, the Camellia oleifera planting area in Guangxi reached more than 1.6 million acres, with an annual output of 550,000 tons of tea seeds and an annual comprehensive output value of more than CNY 45 billion. The Camellia oleifera industry is key to supporting the development of Guigang City and plays an extremely important role in the city’s economic development. Therefore, the detection and counting of Camellia oleifera trees is particularly important, especially for their yield estimation.

2.2. Data Collection

The experimental data were obtained by a DJI Genie 4 RTK drone with a CMOS sensor and an FC6310R camera model, DJI, Shenzhen, China. The structure diagram is shown in Figure 2.
The images selected were obtained under clear weather conditions. For the aerial photography, the focal length was set to 9 mm, the aperture value was between f/4.5 and f/5, and the photo format was JPG. The other specific parameters of the UAV are shown in Table 2.
The data were collected on 13 and 14 October 2023, with the camera shooting from a height of 100 m, at a speed of 5 m/s, a heading overlap rate of 70%, and a lateral overlap rate of 80%, with the camera lens pointed straight down. The image resolution was 5472 × 3648, and the blurry and unclear parts were excluded, resulting in the acquisition of 400 image data. Figure 3 shows a diagram of Camellia oleifera trees.

2.3. Data Preprocessing and Enhancement

Firstly, the acquired images were preprocessed, and a digital orthophoto map (DOM) was made using Agisoft Metashape software 2.10. The specific workflow was aligning the photos, building a dense point cloud, generating a grid, and then creating a DOM.
Data enhancement is a technique for artificially increasing the size of an experimental dataset to increase its diversity and robustness. In this study, image inversion, crop and noise injection were used to enhance the data, and 1600 images were obtained after image enhancement.

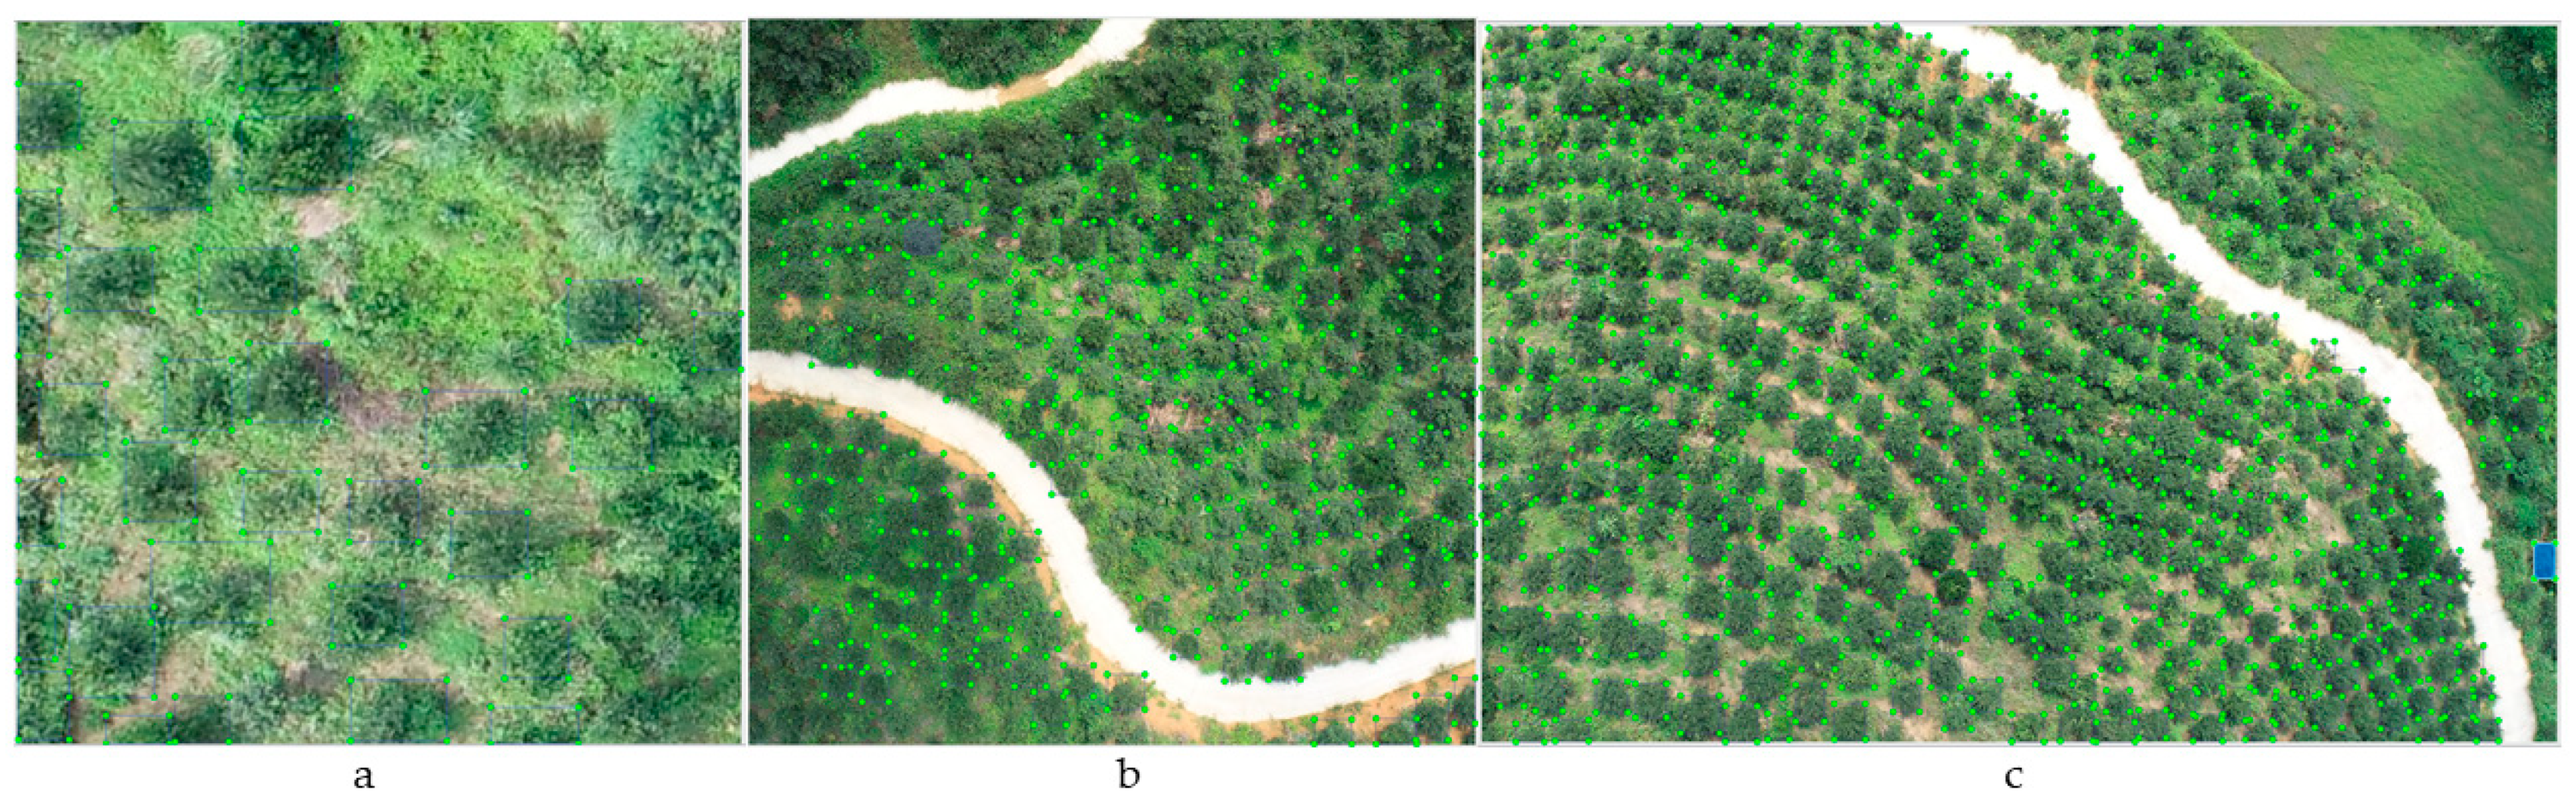
2.4. Dataset Construction and Annotation

Because the terrain in the test area is relatively undulating, the positions of Camellia oleifera trees are relatively close, and there are many connections among branches and leaves, three kinds of datasets were constructed in different ways to explore which data size would achieve better training results.
(1)
DOM dataset: The DOM generated by Agisoft Metashape was cropped into 512 × 512 images, and a total of 1200 images were cropped.
(2)
Original image dataset: A total of 2400 images with an original image size of 5472 × 3648 were cut to a size of 1824 × 1824.
(3)
Cropped original image dataset: The top, bottom, and left and right parts of the original images were cropped to 1/4 of their original size, and a total of 1600 images with a size of 2736 × 1824 were obtained.
Figure 4 shows the labeling schematics of the three kinds of datasets. We chose to label the data using LabelImg. LabelImg is an open-source image annotation tool that supports the formats of common object detection datasets. Here is how it is performed: (1) In the terminal or command prompt, enter the LabelImg command to open the LabelImg tool. (2) In the LabelImg interface, select the directory where the dataset is located, which contains the image files to be annotated. Then select the YOLO-type data annotation format. (3) Select the image you want to annotate and click the “Create RectBox” button. At this point, you can draw rectangles on the image to annotate objects, and input the label name “tree” after that. Click the “Save” button to complete the annotation. (4) After the annotation is completed, click the “Save All” button. LabelImg will save all the annotation information as a txt file, which will be saved in the specified dataset directory.
After the dataset was built, it was divided into a training set, a test set, and a validation set at a ratio of 8:1:1. After that, the LabelImg tool was used to annotate the dataset to train and test the detection model.

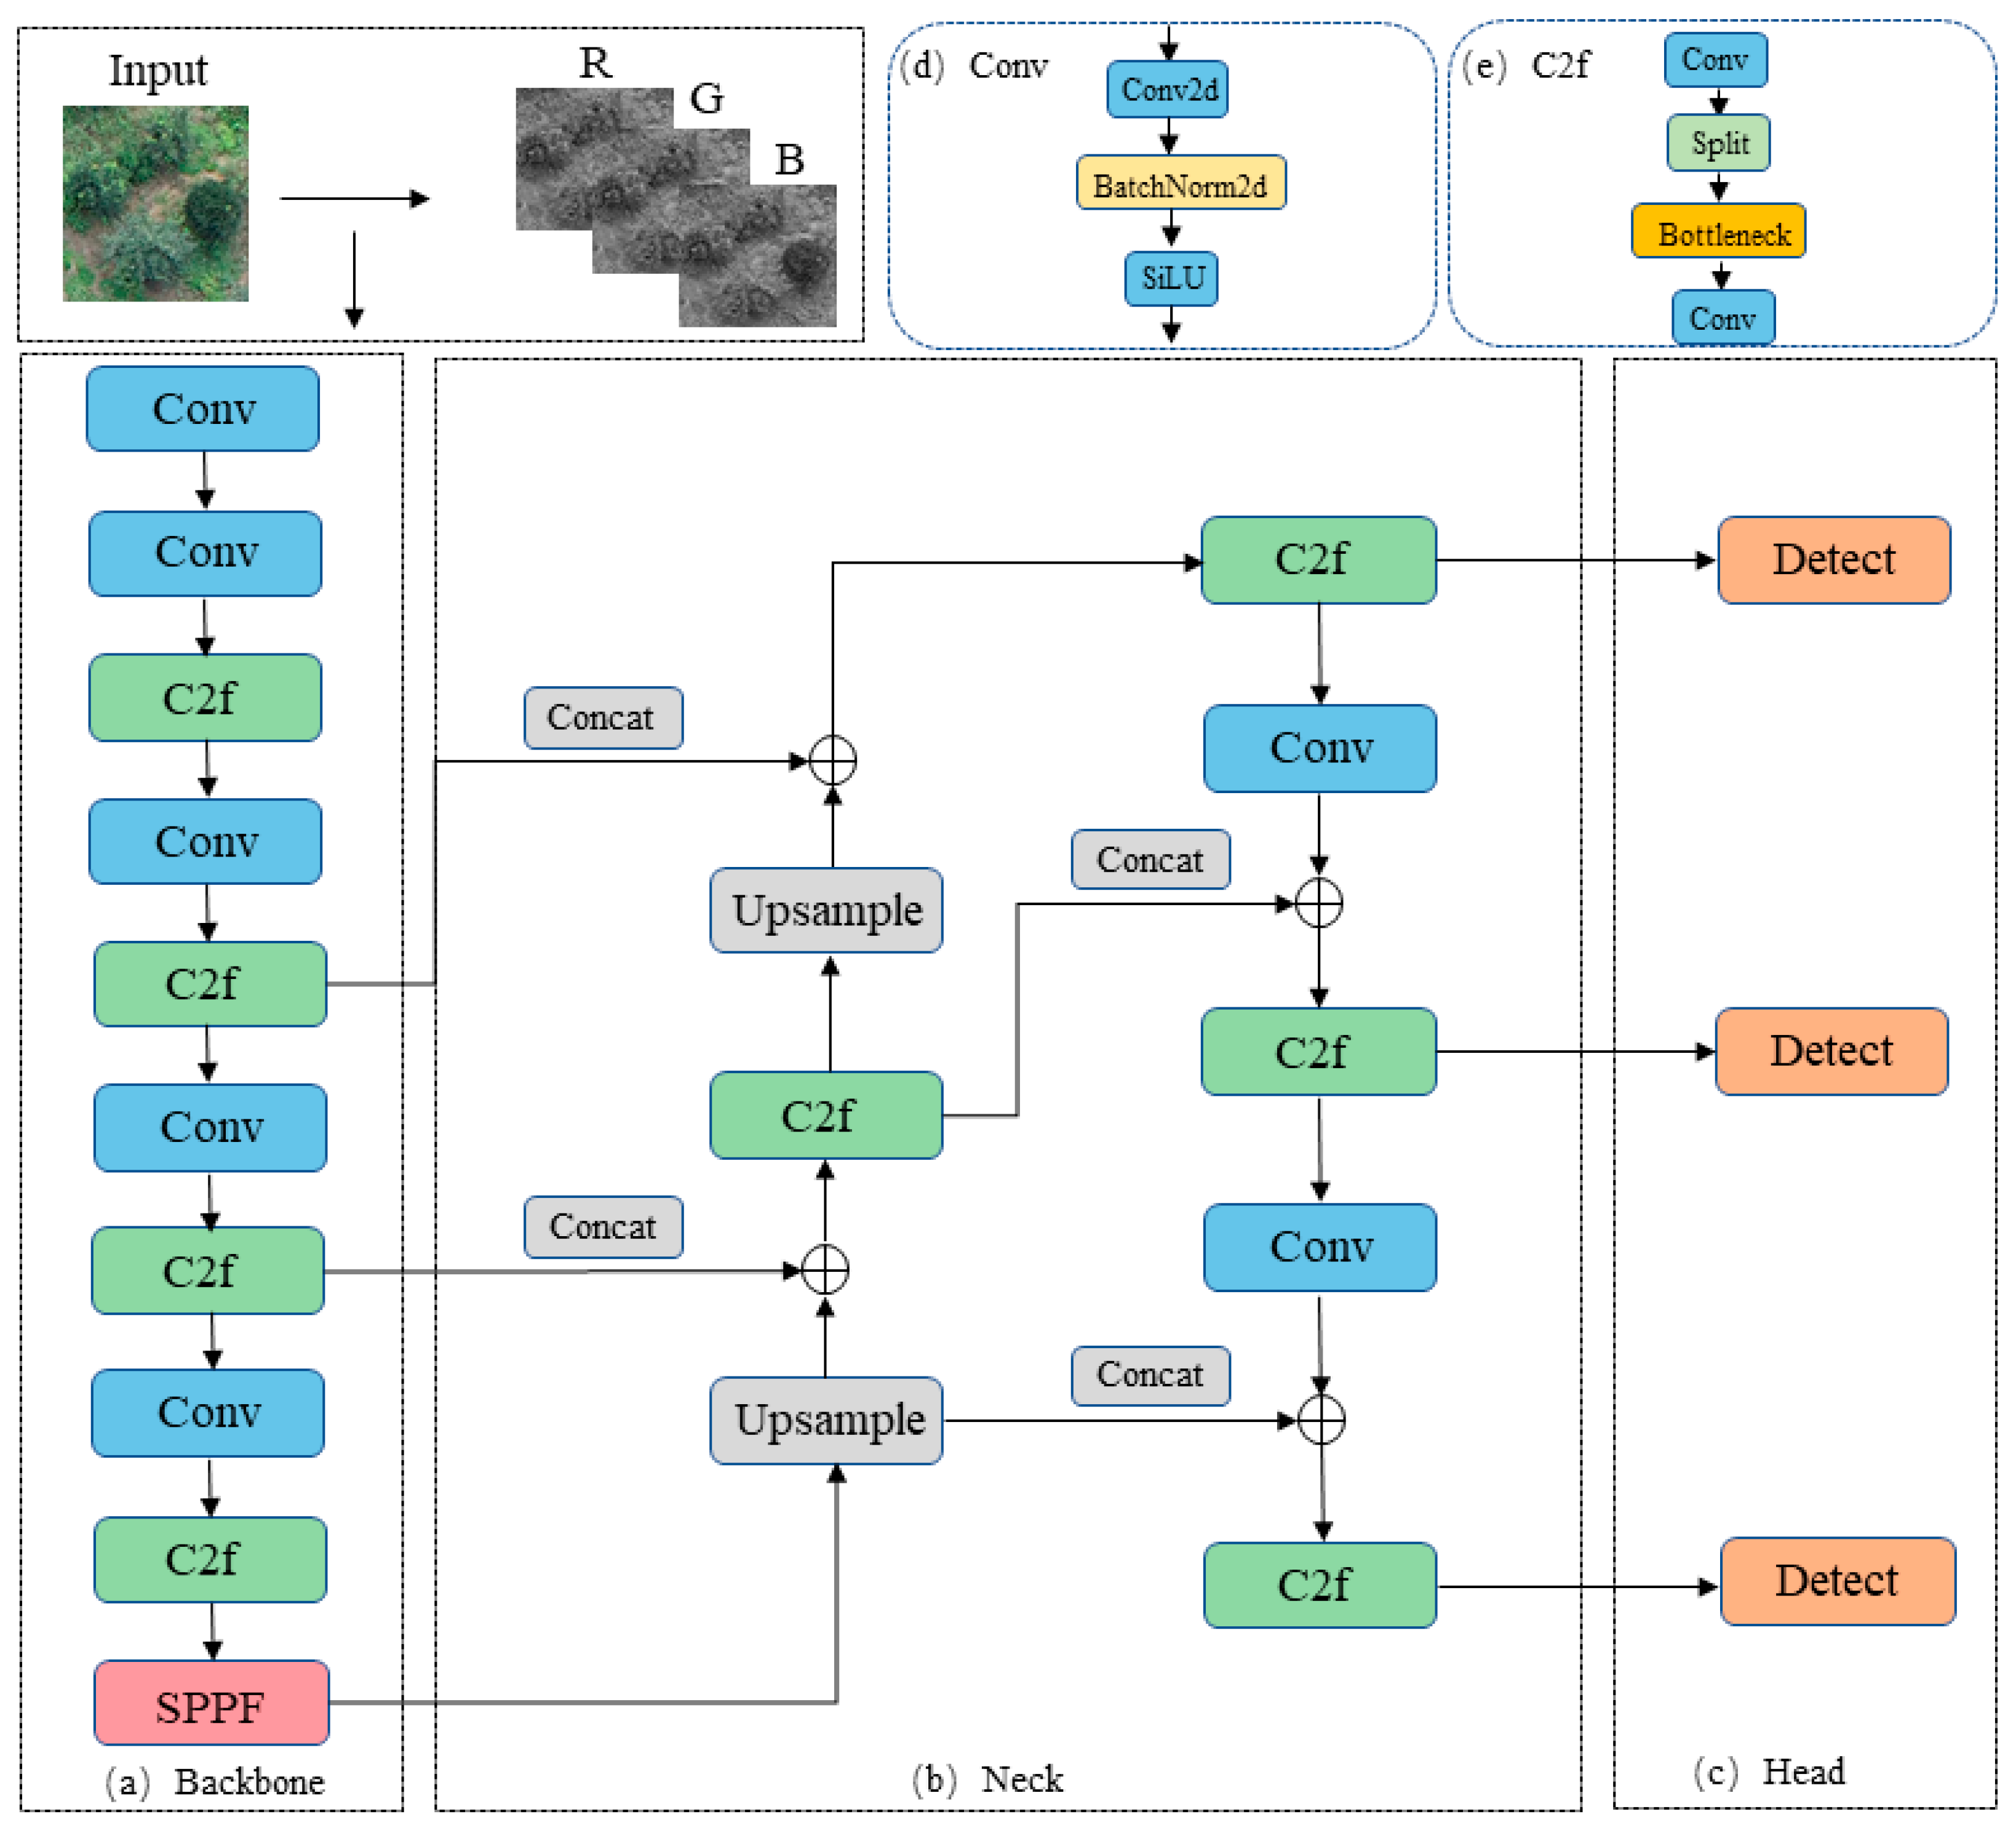
2.5. YOLOv8 Object Detection Model

YOLOv8 [36] is a single-stage target detection algorithm proposed by the Ultralytics company, Frederick, MD, USA in 2023. As the eighth generation of the You Only Look Once (YOLO) algorithm series [37], YOLOv8 has been optimized in many aspects, and its accuracy and efficiency in detection have been greatly improved. With the successive proposal of YOLOv9 [38] and YOLOv10 [39] in 2024, the algorithm model of the YOLO series has been developed to the tenth generation.
The YOLOv8 architecture is shown in Figure 5. The network architecture of YOLOv8 is mainly composed of three parts: the backbone, neck, and head. The backbone is based on CSPDarknet53, and features are extracted through convolutional layers and cross-stage parts (CSPS). The neck uses the path aggregation network (PANet) to fuse the features of different scales to improve the detection capability. The head is responsible for the final prediction, including bounding boxes and class probabilities. YOLOv8 integrates the C2f module to optimize feature fusion and computational efficiency, as well as the Spatial Pyramid Pooling-Fast (SPPF) layer to handle objects of different sizes, thus striking a balance between accuracy and computational efficiency.

3. Results

3.1. Experimental Environment

The experiments for this study were conducted on a desktop computer equipped with an NVIDIA GTX 1060 5GB GPU and an Intel Core (TM)i5-12490F CPU, Santa Clara, CA, USA. The PyTorch framework was used to build the YOLOv8 model, and Python3.10 was used to write and debug the program code. The batch size of the model training was set to 4, and each BN layer was regularized to update the weight of the model. The number of training epochs was set to 150. After the training was completed, the weight file of the detection model was exported and saved, and then the performance of the model was evaluated using the test set. Some parameters of the model training were as follows: epochs = 150, batches = 16, dropout = 0.0, imgsz = 640, lr0 = 0.01, lr1 = 0.01, box = 7.5, and cls = 0.5.

3.2. Evaluation Index

In order to effectively evaluate the recognition accuracy and performance of the experimental model, the following four evaluation indexes were adopted in this paper: precision (P), recall (R), mean average precision (mAP), and F1 score. Precision measures the accuracy of the model in predicting the number of Camellia oleifera trees, indicating that the correct prediction is the proportion of Camellia oleifera trees in all predictions. The higher the accuracy, the lower the false positive rate of the model in the positive category of predictions. The ability of the model measured by the recall rate to identify all Camellia oleifera trees represents the proportion of Camellia oleifera trees identified by the model to all true Camellia oleifera trees. The higher the recall rate, the lower the false negative case rate of the model in the prediction of positive category. The accuracy rate and recall rate are usually not compared separately, and it is not advisable to lose a larger recall rate for a higher accuracy rate or a larger loss accuracy rate for a higher recall rate. The mAP and F1 score can be used to evaluate the performance of the model as a whole, and both emphasize the accurate coverage of the target area. The specific calculation formulas for these four types of evaluation indicators are as follows:
P = T P T P + F P
R = T P T P + F N
m A P = 1 N i = 1 N A P i
F 1 = 2 × P × R P + R
where TP represents a real example (a real Camellia oleifera tree predicted by the model); FP represents a false positive example (not a real Camellia oleifera tree but predicted by the model); FN represents a false negative example (a real Camellia oleifera tree not predicted by the model).

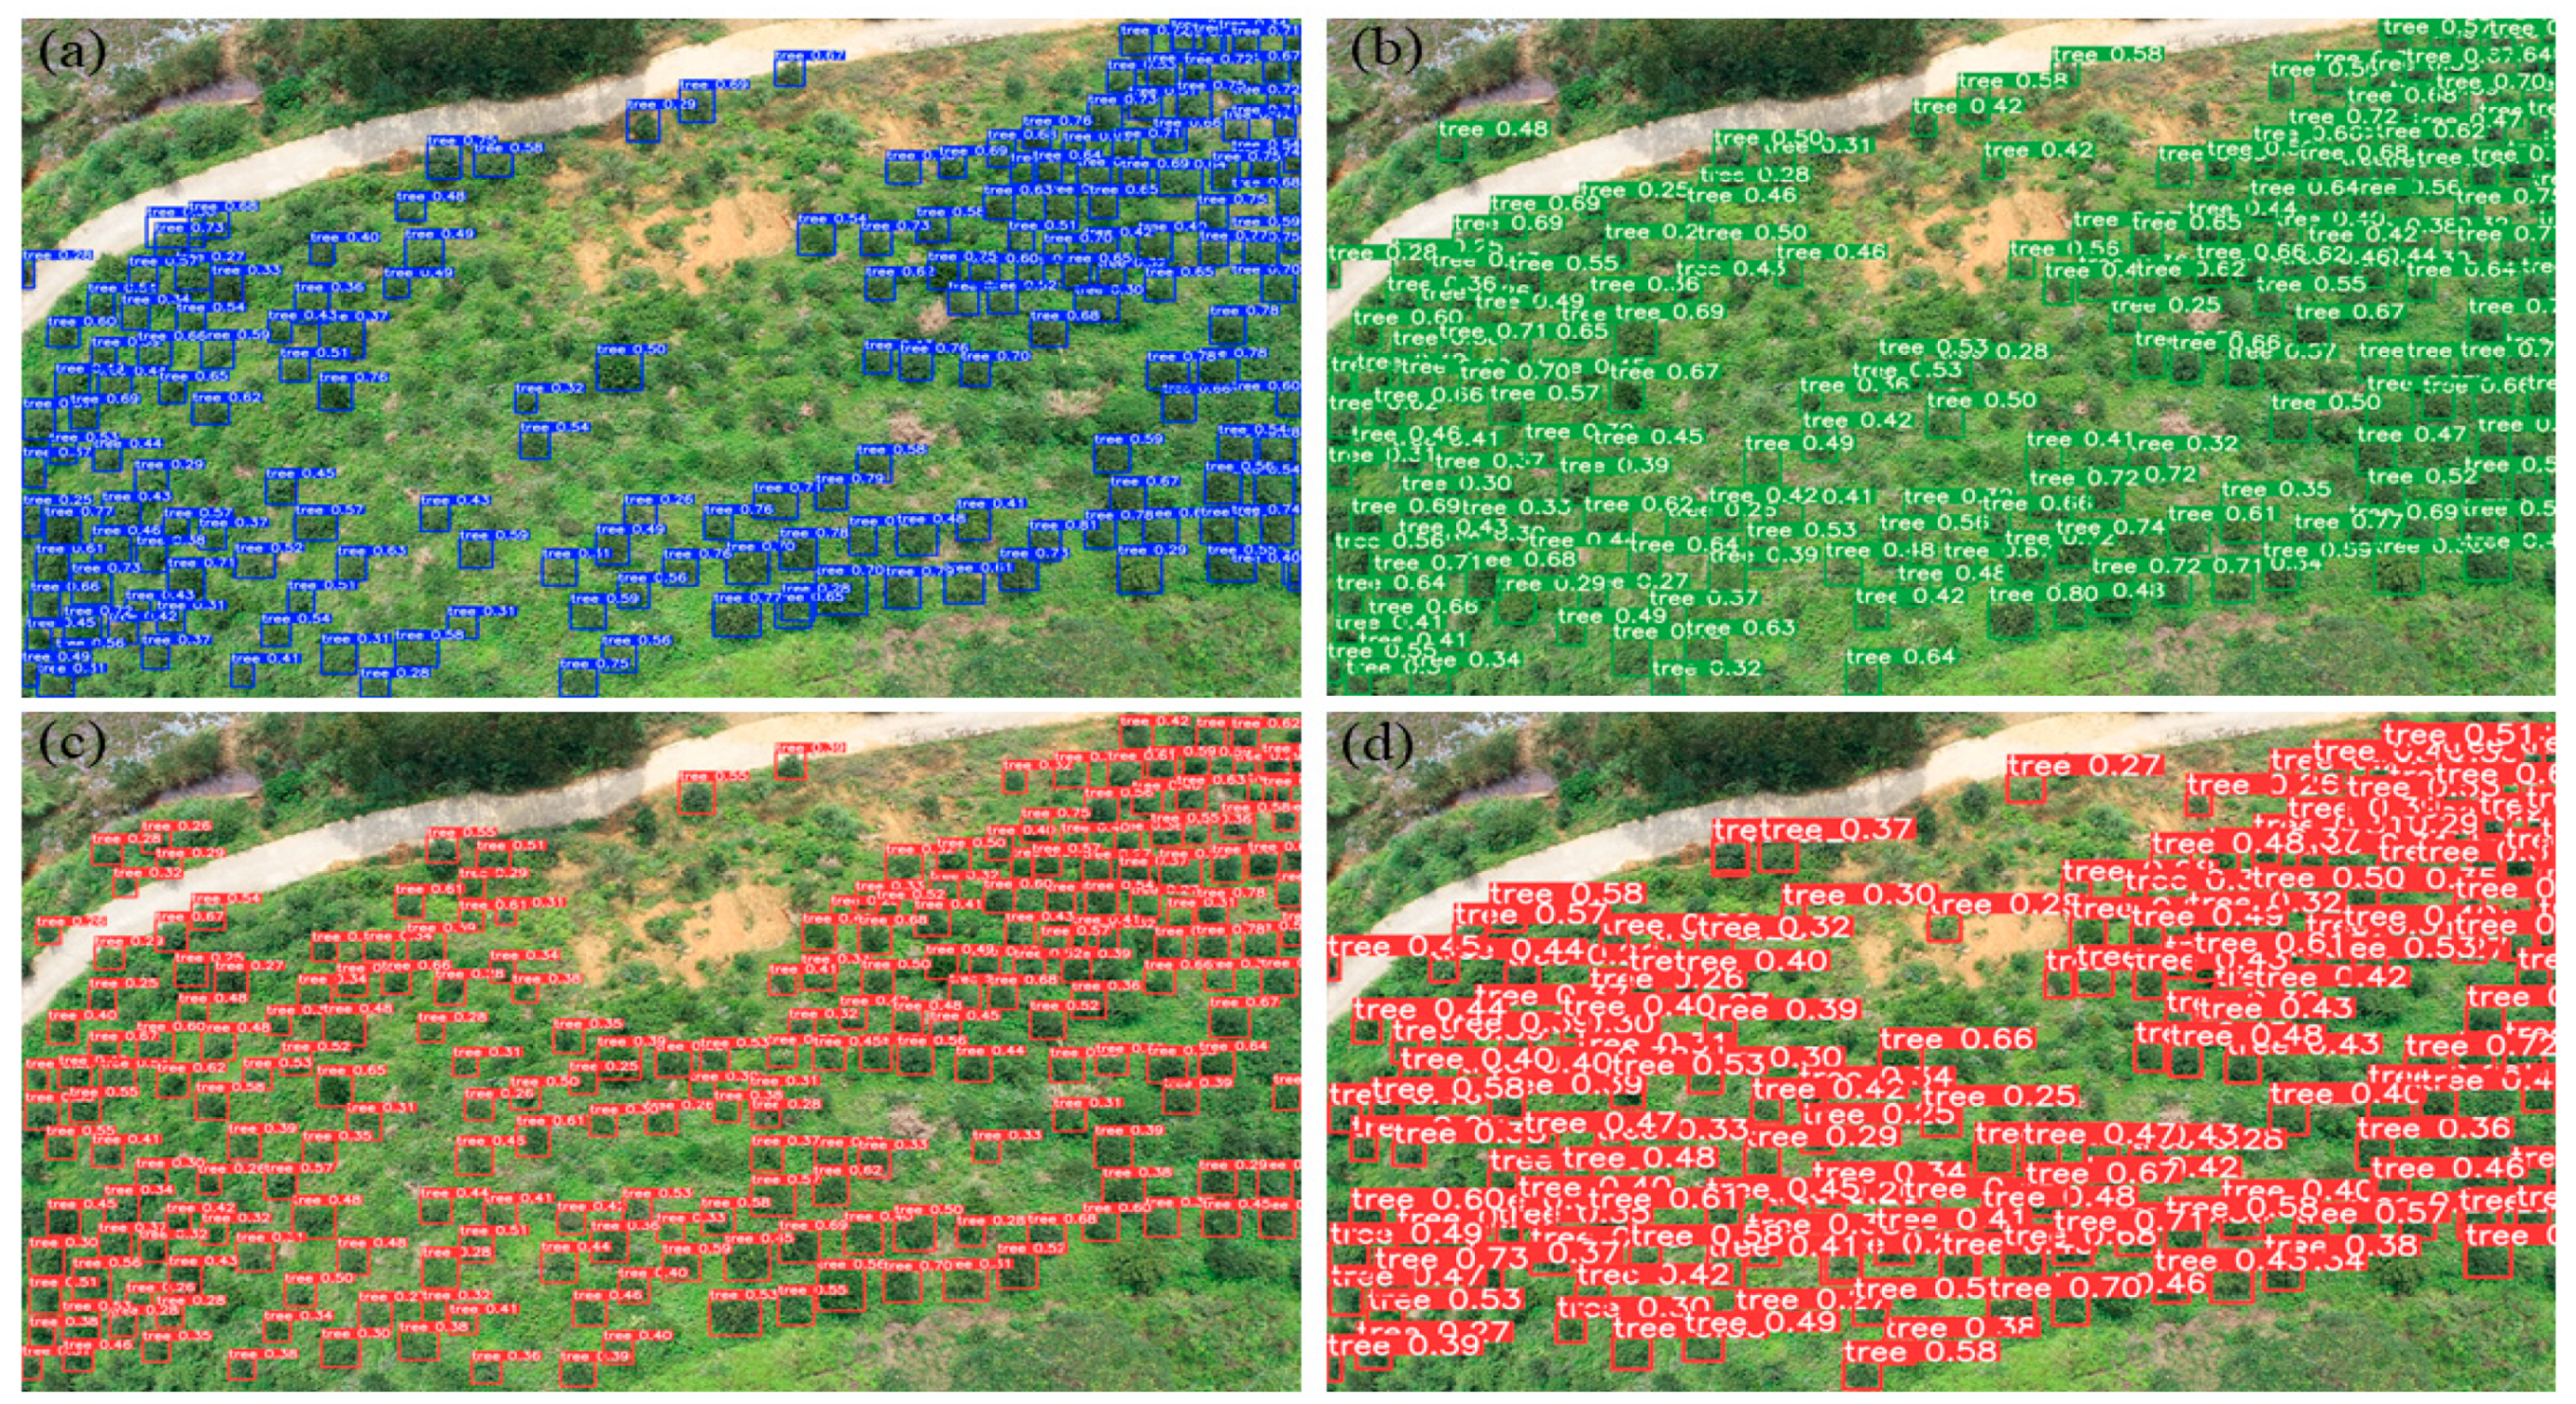
3.3. Experimental Results

The three different datasets constructed in this paper were trained on the YOLOv8 model, and the results are shown in Table 3. We found that the training effect of the cropped original image dataset was the best; the accuracy and recall rate were both above 0.77, the average accuracy reached 0.82, and the F1 score was 0.78. The average accuracy was 11% higher than that of the original image dataset and 8% higher than that of the DOM dataset. The F1 score was 12% higher than the original image dataset and 8% higher than the DOM dataset. Compared to the original image dataset, the DOM dataset only had a slightly lower recall rate, but was superior in the other aspects.
Our analysis indicates that this situation was due to the following reasons:
(1)
The resolution of the image was reduced after DOM generation, which led to the poor recognition effect of Camellia oleifera trees under the DOM dataset;
(2)
The ortho-projection images collected by the UAV had the problem of edge distortion, especially with the mountain terrain in the study area, which made the problem of distortion more serious, so the original image dataset had the worst performance of the three datasets;
(3)
While retaining high resolution of the data, the operation of clipping the upper, lower, left, and right parts of the original images to a quarter of their size minimized the image distortion, so the final effect was the best.
As can be seen in Table 3, the cropped original image dataset was more suitable for the detection and counting of Camellia oleifera trees. Therefore, this study conducted training on YOLOv5, YOLOv7, YOLOv9, and YOLOv10 based on the cropped original image dataset and carried out comparative analysis with the detection results of YOLOv8. As shown in Figure 6, the performance of five models in four evaluation indicators is shown with the changes in the training epoch. In terms of precision, YOLOv7 and YOLOv8 had similar results and the best performance, but YOLOv8 had a faster convergence rate than YOLOv7. The precision scores of YOLOv5 and YOLOv9 were close, and the detection precision of YOLOv10 was the worst. Regarding recall, YOLOv5, YOLOv7, and YOLOv8 performed better, followed by YOLOv10, and YOLOv9 performed the worst. In terms of the F1 score, the performances of YOLOv9 and YOLOv10 were similar, followed by YOLOv5, YOLOv7, and YOLOv8, but the F1 score of YOLOv5 fluctuated greatly. In terms of mAP, the performance of YOLOv8 was the best, followed by YOLOv5 and YOLOv7, and YOLOv9 and YOLOv10 performed the worst.
Based on the above results, we found that YOLOv8 performed better in detection accuracy than the other four models.
The specific results of the training of the five models are shown in Table 4. YOLOv8 scored 2–7 and 3–8 percentage points higher in the F1 score and mAP than the other four models, respectively. YOLOv9 and YOLOv10 had poor precision effects, not reaching 0.75. For recall, YOLOv5, YOLOv7, and YOLOv8 had similar effects, with accuracy above 0.77.
Figure 7 shows the visualized comparison results of YOLOv5, YOLOv7, YOLOv9, and YOLOv10 in recognizing Camellia oleifera trees, and Figure 8 shows the prediction results of YOLOv8. We believe that the above experimental results are due to the characteristics of our dataset, which had small dense targets, and that YOLOv8’s network design is more suitable for detecting datasets of this type. YOLOv8 is an upgraded and modified version of YOLOv5 and YOLOv7, and it uses anchor-free detection, which eliminates the need to design a large number of anchor boxes, making it more suitable for detecting small targets. Although YOLOv9 and YOLOv10 are updated versions of YOLOv8, the changes in their network structure were not suitable for our dataset, and they performed worse than YOLOv8 in detecting small dense targets. Compared to YOLOv8, the main change in YOLOv9 is the introduction of programmable gradient information (PGI) and the design of a lightweight network architecture based on gradient path planning, the Generalized ELAN (GELAN). Although this change makes the model able to maintain high precision detection with faster speed, it performs poorly on dense target datasets. Similarly, YOLOv10 removed the non-maximum suppression (NMS) part, which significantly improved the processing speed, but it also resulted in a loss of precision in detecting small targets. Ma et al. [40] also showed similar results in detecting chili peppers, and Chen et al. [41] showed similar results in autonomous crack detection on mountain roads.
Based on the above two experiments, we believe that the best method to detect and count Camellia oleifera is selecting a cropped original image dataset and training it on the YOLOv8 model. According to the results of the experiment, the best weight files trained by YOLOv8 were selected for prediction. The prediction area consisted of two regions with 60 images in Area 1 and 50 images in Area 2.
The predicted results are shown in Figure 9. First, scatter plots were made according to the predicted values and true values of Area 1 and Area 2. Linear regression was performed on the results, and the results were compared with the 1:1 line. Finally, the predicted values and true values of the whole region were compared and analyzed by line charts. It is obvious that the regression line of the two regions was very close to the 1:1 line, and the prediction effect of Area 2 was better than that of Area 1. In the line chart, the predicted value and the true value almost coincide. The R2 of Area 1’s linear regression was 0.93, the R2 of Area 2’s linear regression was 0.95, and the average R2 of the two regions was 0.94, indicating that the difference between the predicted value and the real value was small and the prediction effect was good. From the line chart, we can see that, although the two curves are very close, most of the curves of the predicted value are above the real value, that is, the predicted value is larger than the real value. Our analysis indicates that this is because there were other types of crops in the image, resulting in the wrong judgment in the process of model recognition, and other crops were identified as Camellia oleifera trees.

4. Discussion

The identification and counting of Camellia oleifera trees helps prepare for the further measurements of Camellia oleifera yield. As an important economic forest, the estimation of Camellia oleifera yield is extremely important, so it is of great significance to improve the identification effect and counting accuracy of Camellia oleifera trees. The detection and counting of Camellia oleifera trees are closely related to the recognition of Camellia oleifera fruit, and are the two most important research directions in the field of Camellia oleifera yield estimation. At present, there have been many studies on Camellia oleifera fruit recognition, and the detection accuracy is high, meaning that the fruit yield of a single Camellia oleifera tree can be accurately estimated. Based on this, and combined with the research on Camellia oleifera tree recognition and counting in this paper, a yield estimation model based on the number of Camellia oleifera trees and the yield of a single Camellia oleifera tree can be built, and it is expected to be applied to Camellia oleifera yield measurements in a large area. Therefore, for the study of Camellia oleifera yield, the main challenge at present is to improve the accuracy of Camellia oleifera tree counting. We believe that the accuracy can be improved mainly from the two aspects of dataset production and model improvement. As is known, data determine the upper limit of deep learning, and models and algorithms are only approaching that limit. Based on the deep learning research on Camellia oleifera trees, a more difficult problem is the production of Camellia oleifera tree datasets; there are no public datasets of Camellia oleifera trees. Although three types of Camellia oleifera trees datasets are designed in this paper, the sample size was too small, and the camellia forest involved is limited, so it is necessary to continuously expand the dataset based on the specific background of camellia orchards, including not only Camellia oleifera trees, but also images of Camellia oleifera fruit. In addition to expanding the dataset by increasing the number of image data, we can also study the methods and means of data enhancement to increase the diversity of image types.
In addition, although the model used in this paper had a good training effect, we can make further improvements to optimize the training network structure and improve the recognition effect of the model. We are going to start from two aspects. One is to experiment with more appropriate attention mechanisms, so that the model is more focused on the important part of Camellia oleifera trees, ignoring some background and other information. The other is to choose a loss function that is more suitable for Camellia oleifera tree scenes, minimizes the loss function, reduces the gap between the prediction and the actual data, and improves the recognition effect of Camellia oleifera trees.

5. Conclusions

Aiming at the problem of the recognition and counting of Camellia oleifera trees growing under natural conditions, we conducted research based on UAV RGB images combined with a deep learning method, and drew the following main conclusions:
(1)
Three different Camellia oleifera trees datasets were designed and trained on the YOLOv8 model. Through analysis and comparison, the training effect of the cropped original image dataset was the best; the training effect of the mAP was 8% and 11% higher than that of the DOM dataset and original image dataset respectively.
(2)
The cropped original image dataset was trained on the YOLOv5, YOLOv7, YOLOv8, YOLOv9, and YOLOv10 models, and YOLOv8 had the best effect. The precision, recall, mAP50, and F1 score were all higher than those of the other four models, and the mAP reached 0.82, which was 3–8% higher than those of YOLOv5, YOLOv7, YOLOv9, and YOLOv10.
(3)
Camellia oleifera tree prediction was carried out in two regions, and regression analysis was performed on the predicted value and the measured value. The difference between the predicted value and the actual value was very small; the R2 of Area 1 was 0.93, the R2 of Area 2 was 0.95, and the average R2 was 0.94.

Author Contributions

R.Y.: methodology, software, formal analysis, writing—original draft, and visualization; D.Y.: methodology, writing—original draft, and visualization; M.Z.: data curation, writing—review and editing, supervision, and project administration; Z.Z. and L.Z.: writing—review and editing and data curation; Y.F., G.L. and Y.Z.: project administration, investigation, and data curation. All authors have read and agreed to the published version of the manuscript.

Funding

This study was funded by the National Natural Science Foundation of China (52174160), and priority projects for the “Science and Technology for the Development of Mongolia” initiative in 2023 (ZD20232304).

Institutional Review Board Statement

Not applicable.

Data Availability Statement

The data used to support the findings of this study are available from the corresponding authors upon request.

Conflicts of Interest

The authors declare no conflicts of interest.

References

  1. Tang, N.; Tan, X.; Cai, Y.; He, M.Y.; Xiang, Z.Y.; Ye, H.; Ma, J.L. Characterizations and application potentials of the hemicel-luloses in waste oil-tea camellia fruit shells from Southern China. Ind. Crops Prod. 2022, 178, 114551. [Google Scholar] [CrossRef]
  2. Wu, D.L.; Fu, L.Q.; Cao, C.M.; Li, C.; Xu, Y.P.; Ding, D. Design and Experiment of Shaking-branch Fruit Picking Machine for Camellia Fruit. Trans. Chin. Soc. Agric. Mach. 2020, 51, 176–182. [Google Scholar] [CrossRef]
  3. Jiang, H.; Hu, Y.; Jiang, X.; Zhou, H. Maturity Stage Discrimination of Camellia oleifera Fruit Using Visible and Near-Infrared Hyperspectral Imaging. Molecules 2022, 27, 6318. [Google Scholar] [CrossRef]
  4. Ebneyamin, E.; Mansouri, P.; Rajabi, M.; Qomi, M.; Asgharian, R.; Azizian, Z. The Efficacy and Safety of Permethrin 2.5% with Tea Tree Oil Gel on Rosacea Treatment: A Double-Blind, Controlled Clinical Trial. J. Cosmet. Dermatol. 2020, 19, 1426–1431. [Google Scholar] [CrossRef]
  5. Deng, Q.; Li, J.; Gao, C.; Cheng, J.; Deng, X.; Jiang, D.; Li, L.; Yan, P. New perspective for evaluating the main Camellia oleifera cultivars in China. Sci. Rep. 2020, 10, 20676. [Google Scholar] [CrossRef]
  6. Chen, S.; Ji, L.; Yao, X.; Zhang, W.; Han, W.; Yin, L. Variation analysis on the main economic characters and nutrients of fruit from Camellia oleifera varieties. Non-Wood For. Res. 2022, 40, 1–9. [Google Scholar] [CrossRef]
  7. Chen, X.; Chen, B.; Wang, M.; Li, J.; Zou, Y.; Rong, J.; Deng, Z. Comparative Nutrient Composition of Seed Oils of Wild Camellia oleifera with Different Single Kernel Masses Grown in Ten Regions. Food Sci. 2019, 40, 227–234. [Google Scholar] [CrossRef]
  8. Wu, D.; Ding, D.; Cui, B.; Jiang, S.; Zhao, E.; Liu, Y.; Cao, C. Design and experiment of vibration plate type camellia fruit picking machine. Int. J. Agric. Biol. Eng. 2022, 15, 130–138. [Google Scholar] [CrossRef]
  9. Wu, D.L.; Zhao, E.L.; Jiang, S.; Wang, W.W.; Yuan, J.H.; Wang, K. Optimization and Experiment of Canopy Vibration Parameters of Camellia oleifera Based on Energy Transfer Characteristics. Trans. Chin. Soc. Agric. Mach. 2022, 53, 23–33. [Google Scholar] [CrossRef]
  10. Tran, H.T.; Balchanos, M.; Domerçant, J.C.; Mavris, D.N. A Framework for the Quantitative Assessment of Performance-Based System Resilience. Reliab. Eng. Syst. Saf. 2017, 158, 73–84. [Google Scholar] [CrossRef]
  11. Rao, H.H.; Wang, Y.L.; Li, Q.S.; Wang, B.Y.; Yang, J.L.; Liu, M.H. Design and Experiment of Camellia oleifera Fruit Layered Harvesting Device. Trans. Chin. Soc. Agric Mac. 2021, 52, 203–212. [Google Scholar] [CrossRef]
  12. Wu, D.L.; Zhao, E.L.; Fang, D.; Jiang, S.; Wu, C.; Wang, W.W.; Wang, R.Y. Determination of Vibration Picking Parameters of Camellia oleifera Fruit Based on Acceleration and Strain Response of Branches. Agriculture 2022, 12, 1222. [Google Scholar] [CrossRef]
  13. Wang, J.; Liu, R.; Zhang, Y.; Cheng, X.; Xu, J.; Liu, Y.; Chen, F. Analysis of Land-Use/Cover-Type Extraction Results of Tamarix Shrub Forest of China Based on Remote Sensing Technology. Forests 2024, 15, 1179. [Google Scholar] [CrossRef]
  14. Rogan, J.; Chen, D. Remote sensing technology for mapping and monitoring land-cover and land-use change. Prog. Plan. 2004, 61, 301–325. [Google Scholar] [CrossRef]
  15. Deng, L. The mnist database of handwritten digit images for machine learning research [best of the web]. IEEE Signal Process. Mag. 2012, 29, 141–142. [Google Scholar] [CrossRef]
  16. Brown, J.C.; Kastens, J.H.; Coutinho, A.C.; de Castro Victoria, D.; Bishop, C.R. Classifying multiyear agricultural land use datafrom Mato Grosso using time-series MODIS vegetation index data. Remote Sens. Environ. 2013, 130, 39–50. [Google Scholar] [CrossRef]
  17. Tyagi, A.C. Towards a Second Green Revolution. Irrig. Drain. 2016, 65, 388–389. [Google Scholar] [CrossRef]
  18. Mubin, N.A.; Nadarajoo, E.; Shafri, H.Z.M.; Hamedianfar, A. Young and Mature Oil Palm Tree Detection and Counting Using Convolutional Neural Network Deep Learning Method. Int. J. Remote Sens. 2019, 40, 7500–7515. [Google Scholar] [CrossRef]
  19. Zhang, Q.; Li, Z.; Xia, C.; Chen, J.; Peng, D. Tree Species Classification based on the New Bands of GF-6 Remote Sensing Satellite. J. Geo-Inf. Sci. 2019, 21, 1619–1628. [Google Scholar] [CrossRef]
  20. Grabska, E.; Frantz, D.; Ostapowicz, K. Evaluation of Machine Learning Algorithms for Forest Stand Species Mapping Using Sentinel-2 Imagery and Environmental Data in the Polish Carpathians. Remote Sens. Environ. 2020, 251, 112103. [Google Scholar] [CrossRef]
  21. Gené-Mola, J.; Gregorio, E.; Auat Cheein, F.; Guevara, J.; Llorens, J.; Sanz-Cortiella, R.; Escolà, A.; Rosell-Polo, J.R. Fruit Detection, Yield Prediction and Canopy Geometric Characterization Using LiDAR with Forced Air Flow. Comput. Electron. Agric. 2020, 168, 105121. [Google Scholar] [CrossRef]
  22. Kim, S.; McGaughey, R.J.; Andersen, H.-E.; Schreuder, G. Tree Species Differentiation Using Intensity Data Derived from Leaf-on and Leaf-off Airborne Laser Scanner Data. Remote Sens. Environ. 2009, 113, 1575–1586. [Google Scholar] [CrossRef]
  23. Kukkonen, M.; Maltamo, M.; Korhonen, L.; Packalen, P. Multispectral Airborne LiDAR Data in the Prediction of Boreal Tree Species Composition. IEEE Trans. Geosci. Remote Sens. 2019, 57, 3462–3471. [Google Scholar] [CrossRef]
  24. Lin, Y.; Hyyppä, J. A Comprehensive but Efficient Framework of Proposing and Validating Feature Parameters from Airborne LiDAR Data for Tree Species Classification. Int. J. Appl. Earth Obs. Geoinf. 2016, 46, 45–55. [Google Scholar] [CrossRef]
  25. Zhang, S.; Qi, L.; Han, W.; Zhu, X.; Xi, X.; Wang, C.; Wang, P.; Nie, S. Danger tree detection and tree number estimation based on UAV LiDAR data. J. Univ. Chin. Acad. Sci. 2020, 37, 760–766. [Google Scholar] [CrossRef]
  26. Yrttimaa, T.; Saarinen, N.; Kankare, V.; Liang, X.; Hyyppä, J.; Holopainen, M.; Vastaranta, M. Investigating the Feasibility of Multi-Scan Terrestrial Laser Scanning to Characterize Tree Communities in Southern Boreal Forests. Remote Sens. 2019, 11, 1423. [Google Scholar] [CrossRef]
  27. Guimarães, N.; Pádua, L.; Marques, P.; Silva, N.; Peres, E.; Sousa, J.J. Forestry Remote Sensing from Unmanned Aerial Vehicles: A Review Focusing on the Data, Processing and Potentialities. Remote Sens. 2020, 12, 1046. [Google Scholar] [CrossRef]
  28. Wu, C.; Jia, W.; Yang, J.; Zhang, T.; Dai, A.; Zhou, H. Economic Fruit Forest Classification Based on Improved U-Net Model in UAV Multispectral Imagery. Remote Sens. 2023, 15, 2500. [Google Scholar] [CrossRef]
  29. Li, D.; Sun, X.; Jia, Y.; Yao, Z.; Lin, P.; Chen, Y.; Zhou, H.; Zhou, Z.; Wu, K.; Shi, L.; et al. A Longan Yield Estimation Approach Based on UAV Images and Deep Learning. Front. Plant Sci. 2023, 14, 1132909. [Google Scholar] [CrossRef]
  30. Torres-Sánchez, J.; Souza, J.; di Gennaro, S.F.; Mesas-Carrascosa, F.J. Editorial: Fruit Detection and Yield Prediction on Woody Crops Using Data from Unmanned Aerial Vehicles. Front. Plant Sci. 2022, 13, 1112445. [Google Scholar] [CrossRef]
  31. Schiefer, F.; Kattenborn, T.; Frick, A.; Frey, J.; Schall, P.; Koch, B.; Schmidtlein, S. Mapping Forest Tree Species in High Resolution UAV-Based RGB-Imagery by Means of Convolutional Neural Networks. ISPRS J. Photogramm. Remote Sens. 2020, 170, 205–215. [Google Scholar] [CrossRef]
  32. Xu, D.; Yang, Y. Extracting Individual Tree Crown Width from UAV Remote Sensing Images. Cent. South For. Inventory Plan. 2024, 43, 36–40. [Google Scholar] [CrossRef]
  33. Park, J.Y.; Muller-Landau, H.C.; Lichstein, J.W.; Rifai, S.W.; Dandois, J.P.; Bohlman, S.A. Quantifying Leaf Phenology of Individual Trees and Species in a Tropical Forest Using Unmanned Aerial Vehicle (UAV) Images. Remote Sens. 2019, 11, 1534. [Google Scholar] [CrossRef]
  34. Onishi, M.; Watanabe, S.; Nakashima, T.; Ise, T. Practicality and Robustness of Tree Species Identification Using UAV RGB Image and Deep Learning in Temperate Forest in Japan. Remote Sens. 2022, 14, 1710. [Google Scholar] [CrossRef]
  35. Nguyen, H.T.; Caceres, M.L.L.; Moritake, K.; Kentsch, S.; Shu, H.; Diez, Y. Individual Sick Fir Tree (Abies mariesii) Identification in Insect Infested Forests by Means of UAV Images and Deep Learning. Remote Sens. 2021, 13, 260. [Google Scholar] [CrossRef]
  36. Wang, G.; Chen, Y.; An, P.; Hong, H.; Hu, J.; Huang, T. UAV-YOLOv8: A Small-Object-Detection Model Based on Improved YOLOv8 for UAV Aerial Photography Scenarios. Sensors 2023, 23, 7190. [Google Scholar] [CrossRef]
  37. Li, G.; Suo, R.; Zhao, G.A.; Gao, C.Q.; Fu, L.S.; Shi, F.X.; Dhupia, J.; Li, R.; Cui, Y.J. Real-time detection of kiwifruit flower and bud simultaneously in orchard using YOLOv4 for robotic pollination. Comput. Electron. Agric. 2022, 193, 106641. [Google Scholar] [CrossRef]
  38. Ye, R.; Shao, G.; Gao, Q.; Zhang, H.; Li, T. CR-YOLOv9: Improved YOLOv9 Multi-Stage Strawberry Fruit Maturity Detection Application Integrated with CRNET. Foods 2024, 13, 2571. [Google Scholar] [CrossRef]
  39. Qiu, X.; Chen, Y.; Cai, W.; Niu, M.; Li, J. LD-YOLOv10: A Lightweight Target Detection Algorithm for Drone Scenarios Based on YOLOv10. Electronics 2024, 13, 3269. [Google Scholar] [CrossRef]
  40. Ma, N.; Wu, Y.; Bo, Y.; Yan, H. Chili Pepper Object Detection Method Based on Improved YOLOv8n. Plants 2024, 13, 2402. [Google Scholar] [CrossRef]
  41. Chen, X.; Wang, C.; Liu, C.; Zhu, X.; Zhang, Y.; Luo, T.; Zhang, J. Autonomous Crack Detection for Mountainous Roads Using UAV Inspection System. Sensors 2024, 24, 4751. [Google Scholar] [CrossRef] [PubMed]
Figure 1. Study region diagram: (a) provincial zoning map of China; (b) zoning map of Guangxi Autonomous Region; (c) Guigang City zoning map and experimental site; (d) aerial photo of Camellia oleifera trees.
Agriculture 14 01789 g001
Figure 2. DJI Genie 4 RTK structure diagram.
Agriculture 14 01789 g002
Figure 3. Images of Camellia oleifera trees.
Agriculture 14 01789 g003
Figure 4. Label diagram of three kinds of datasets: (a) Label diagram of DOM dataset; (b) label diagram of original image dataset; (c) label diagram of cropped original image dataset.
Agriculture 14 01789 g004
Figure 5. YOLOv8 architecture.
Agriculture 14 01789 g005
Figure 6. The training accuracies of YOLOv5, YOLOv7,YOLOv8, YOLOv9, and YOLOv10 varied with the epoch.
Agriculture 14 01789 g006
Figure 7. Visual recognition and prediction of four models of Camellia oleifera trees: (a) YOLOv5; (b) YOLOv7; (c) YOLOv9; (d) YOLOv10.
Agriculture 14 01789 g007
Figure 8. Visual recognition and prediction of Camellia oleifera trees with YOLOv8 model.
Agriculture 14 01789 g008
Figure 9. Comparison of the predicted values with the actual values.
Agriculture 14 01789 g009
Table 1. Summary of the above literature review.
Research ObjectSurvey RegionData TypeAccuracy
ForestAlongshan Forestry BureauGF-6 WFV images68.74%
ForestPolish CarpathiansSentinel-2 images86.90%
ForestSeurasaari IslandAirborne LiDAR92.50%
ForestSouthern boreal zone in EvoGround-based LiDAR 82.33%
ForestForestry centerUAV images79.89%
Tropical forestsBarro Colorado Island UAV images85.50%
ForestTropical forests in JapanUAV images84.50%
Sick fir treeZao MountainUAV images85.70%
Table 2. DJI Genie 4 RTK drone parameters.
ParametersValue
Data typeOptical image
SensorCMOS; 20 million effective pixels
Photo resolution5472 × 3648
Maximum take-off altitude6000 m
Flight time30 min
Maximum working area1 km2
Maximum ascent speed6 m/s (automatic flight)
Table 3. Training results of three different datasets.
DatasetPrecisionRecallF1 ScoremAP
DOM0.720.680.700.74
Original Image0.640.690.660.71
Cropped Original Image0.770.780.780.82
Table 4. YOLOv5, YOLOv7,YOLOv8, YOLOv9, and YOLOv10 training results.
ModelPrecisionRecallF1 ScoremAP
YOLOv50.750.770.750.79
YOLOv70.760.770.760.77
YOLOv80.770.780.780.82
YOLOv90.740.720.730.76
YOLOv100.680.740.710.74
Disclaimer/Publisher’s Note: The statements, opinions and data contained in all publications are solely those of the individual author(s) and contributor(s) and not of MDPI and/or the editor(s). MDPI and/or the editor(s) disclaim responsibility for any injury to people or property resulting from any ideas, methods, instructions or products referred to in the content.

