


Abstract
Rational energy management in food production is one of the key actions in the context of reducing greenhouse gas emissions. Ongoing rapid climate change and global warming are making energy consumption an increasingly critical point in food production, throughout the “farm-to-table” manufacturing chain. The carbon footprint (CF) can be used to assess the amount of greenhouse gas (GHG) emissions in the area of food cultivation, production and distribution. The work purpose was to characterize the CF methodology on the basis of literature data, to analyze manufacturing processes in production plants to determine the shares of each type of emissions for selected products and to identify directions for optimizing technology (the scope of analysis—from raw material input to product output). A literature analysis of agriculturally important grain products was undertaken. Methods of carbon footprint analysis were analyzed. There is no standardized methodology for a given product group, with individual approaches designed for each product group existing in the literature. PAS 2050 is the most common standard focused on quantifying GHG emissions created during the life cycle of specific goods/services, without considering potential environmental, social and economic impacts.
1. Introduction
The development of sustainability indicators, based on benchmarking of actual data on products, companies and investments, and their consistent application is essential for reducing the negative impact of human activities on the environment [1,2]. The agri-food branch includes two inseparable sectors of the economy: the agriculture sector, which is the source of plant and animal raw materials, and the food processing sector, which is the main consumer of agricultural crops and is also responsible for directing the production of agricultural raw material. The term food industry refers to food production and to all activities related to the production, processing, distribution, preparation, and consumption of food, taking into account socio-economic and environmental aspects [3,4]. Food production is a major contributor to greenhouse gas emissions and biodiversity loss. Identifying emissions in agriculture and identifying directions for their reduction is a complex issue. Any action must be targeted so as not to jeopardize food security. This research should be conducted, as there is no one-size-fits-all solution, by applying universal instruments depending on regional or national conditions [5].
In Poland, the agri-food industry has been in a continuous phase of development for several decades. Of great importance in this regard was Poland’s accession to the European Union (EU), which resulted in the restructuring and modernization of agriculture, associated, among other things, with subsidies that allowed production enterprises to adapt to EU standards. As a result, the Polish agri-food sector has become competitive in both domestic and international markets [6].
One of the best-known indicators of human activity on the environment is the ecological footprint, which expresses in units of area the ecosystem services that are necessary to sustain the production and consumption that occur. The value of the ecological footprint takes into account the consumption of raw materials, energy, as well as waste emissions. This indicator represents human demand for raw materials and services [7,8]. Another indicator that determines the environmental impact of humans is the carbon footprint, characterized as the sum of the products of the amount of gases emitted and their GWP ratios, expressed in kg or Mg of carbon dioxide equivalent (CO2eq) and related to the functional unit of the product [9]. Environmental pollution and depletion of natural resources negatively affect climate security and the future of our planet. Among the most dangerous global threats are excessive CO2eq emissions. An indicator for estimating the emission of greenhouse gases into the atmosphere over the life cycle of a product, process or technology is called the carbon footprint (CF). Greenhouse gases (carbon dioxide, methane, nitrous oxide, hydrofluorocarbons, perfluorocarbons, sulfur hexafluoride) contribute differently to the greenhouse effect, which is measured on a per-particle CO2 basis. Global warming potential (GWP) is an indicator comparing the global warming potential of a given greenhouse gas to that of carbon dioxide. GWP is calculated based on the climate warming effects of one kilogram of a given gas over 100 years compared to the effects of one kilogram of CO2 [10,11].
The carbon footprint calculated using global warming potential (GWP) can be expressed in terms of organizational units, production process, performed services, product and consumer. In CF analysis, two types of emissions are considered [12,13]:
- direct greenhouse gas (GHG) emissions resulting from, i.e., fuel combustion, manufacturing and natural processes that generate these gases emissions;
- indirect GHG emissions resulting from the use of energy media (electricity, heat) and/or raw materials in the production of a product.
The primary objective of our research was to conduct a comprehensive literature review focusing on existing methodologies for calculating the carbon footprint. This involved examining scholarly articles, reports, and publications to gain insights into the various approaches and tools used in quantifying carbon emissions. As part of this study, an analysis of flour production was conducted as an example. The rationale behind this was to apply and adapt the reviewed methodologies in a real-world context, specifically with the aim of developing national standards for assessing the carbon footprint in the flour production industry.
2. Materials and Methods
The study was focused on the analysis of flour, with key information on the production process and logistics provided by the partnering production facility. The various stages of production, from the selection of raw materials, through the processing process, to the final product, were thoroughly analyzed. In addition, aspects of flour transportation were explored, including means of transport, storage conditions and any practices to safeguard product quality as it moved through the supply chain. Collaboration with the production facility provided a unique perspective on internal processes, as well as insight into the measures the company takes to maintain high quality standards. The data analysis also focused on identifying possible areas for optimization or implementation of improvements, with the goal of increasing the efficiency of the flour production and logistics process. Technological process analysis and the preparation of unit process diagrams in production cycle was the scope of work. The issue analysis approach was presented as a research method. After characterizing technological processes, CF measurement ranges, functional unit and boundary of measurement system were determined. The input–output analysis within a specified range and throughout the life cycle was carried out. A method was developed for counting the process’ CF and with an extension of the range to include the ingredients’ CF. The conception of process line metering feasible for CF calculation was planned. Relevant emissivity data were collected with production volumes and the recording of number of cycles. Based on this, a database was created for calculating CF, depending on production volume.
The carbon footprint (CF) value was given in equivalent quantity (CO2eq). The CF calculation of a product, process, and technology required adding up all emissions (direct and indirect) identified throughout the life cycle (LCA) of the product, process and technology. The carbon footprint was calculated from the formulas in Table 1.
Table 1.
Equations for calculating carbon footprint.
Detailed principles of CF analysis and directions on how to calculate CF values are described in relevant normative documents [14,15,16,17,18]. Life cycle analysis (LCA) is a tool used to determine the carbon footprint. It is an environmental management technique, which is an analytical study in a comprehensive assessment of the environmental impact of a product, service or process. The LCA analysis considers all inputs and raw materials throughout the production, pre-production and operational cycles of a product, service or process. The methodology for LCA analysis is given in ISO 14040, 14044: 2009 [14,15]. These standards define the structure of an LCA analysis, which includes the following steps: defining the purpose and scope of the analysis, analyzing the dataset, assessing the environmental impact [16,17,18].
The first step in the analysis is to determine the purpose and scope of the analysis and the type of potential environmental impact of the product, service or process. In determining the CF of agricultural products, potential sources of carbon dioxide, methane and nitrous oxide emissions (kg CO2eq) are assessed. The scope of the analysis is defined as the boundaries within which the resources realistically used in the production process and the energy inputs involved are considered. A mass and energy balance of the process has to be carried out based on unit processes, taking into account emissions and losses between these processes [11,19,20].
For certain production processes that result in several products, it is not possible to determine the environmental burden attributed to a specific product. In such situations, GHG emissions of the entire production process are determined by assigning their emissions proportionally to individual products. These proportions are determined based on the following criteria: mass balance, commercial value or energy value. It is particularly difficult to determine the allocation of the indicated GHG emissions to individual products, on farms with a wide spectrum of activities, including multigenerational crop production as well as animal production [21].
An important step in the LCA analysis is to determine how to obtain data on emissions of individual GHGs. In order to obtain emission values, measurements should be made in a given process to develop databases. The next element of this step is to determine the functional unit of the product, service or process. For agricultural production, this unit is usually a kilogram of product obtained with a standardized chemical composition. The next step is a harvest analysis, which is the quantification of greenhouse gas emissions associated with the total number of all raw materials entering the production cycle and energy inputs entering the production process. Harvest analysis in agricultural production most often includes emissions associated with the production of fertilizers, crop protection products, feedstuffs, animal husbandry and agrotechnical treatments. Determination of greenhouse gas emissions for a product was performed in an identical manner. Similarly, using all the steps described above, the entire supply chain including processing, distribution and packaging should be considered [18].
Methodology comparison for estimating the carbon footprint was performed. The demands of the market are forcing businesses around the world to take action to reduce greenhouse gas emissions. Entrepreneurs who work with international companies are required to calculate the carbon footprint for their operations and/or products. In order to properly determine the CF, it is important to choose the right methodology. To date, many different methods have been developed for counting the environmental impact of pollutants and greenhouse gases, the most popular ones are presented in Table 2.
Table 2.
Methodologies of carbon footprint analysis.
The most common method for calculating the CF is the PAS 2050 (“Publicly Available Specification 2050”) [23] which was developed by the BSI (British Standard Institute). The PAS 2050 specification defines requirements for assessing the life cycle greenhouse gas emissions of goods and services based on key life cycle assessment techniques and principles. It is used by the BSI to update the quantification of life cycle GHG emissions of any goods and services in accordance with the latest technical developments. It makes it possible to measure the environmental impact of the activities of a company’s products and services and to measure GHG emissions over their life cycle. The PAS 2050 specification is mainly based on ISO 14044 (Environmental Management; Life Cycle Assessment; Principles and Structure) and ISO 14044 (Environmental Management, Life Cycle Assessment; Requirements and Guidelines) [18].
Personalized approaches designed for specific product groups are encountered in the subject literature. They provide the opportunity to compare different production systems, regions and products, according to the requirements of the standardization approach. This methodology makes it possible to compare GHG emissions between products, identify GHG emissions from the field to the gate of the production facility, and identify those areas where there is potential to reduce GHG emissions if they are particularly high. The approach combines various aspects of existing standards and specifications (Table 1) and is called the attribution or outcome method for calculating the carbon footprint. The LCA method is directed at describing the actual flows to and from a product or process relating to environmental impacts. The method is also useful for planning strategies to reduce or mitigate GHG emissions at specific stages. The attribution method uses average data, for example, for electricity or other commodities traded, not specifically linked to their supplier. The approach was evaluated as both sufficient and practical to develop a common CF methodology. The development of a methodology for calculating the carbon footprint is directed at setting uniform standards for CF analysis and enabling the evaluation of dairy products using the developed bases. These efforts are aimed at supporting the development of sustainable food production that enables ongoing reductions in GHG emissions [16,17,21].
The food product groups analyzed are grain products. The carbon footprint analysis methodologies for the selected product group (i.e., bread) were analyzed (Table 3).
Table 3.
Carbon footprint estimation methodologies for agriculture and on-farm processing.
British researchers collected primary data of the bread supply chain according to the PAS 2050 methodology. Secondary data came from UK statistics, life cycle databases and other published sources. They estimated the bread CF produced and consumed in the UK. Sliced and wholemeal white bread were considered for these purposes, and the functional unit was defined as “one loaf of sliced bread (800 g)”. The effects on the carbon footprint of several parameters were analyzed, including the country of origin of the wheat (UK, Canada, France, Germany, Spain and the US), the type of flour (white, brown and wholemeal) and the type of packaging (plastic and paper bags). CF results ranged from 0.977 to 1.244 kg CO2eq per loaf of bread. Coarse-cut wholemeal bread packaged in plastic bags has the lowest carbon footprint, while medium-cut white bread in a paper bag has the highest. The main critical points are wheat cultivation and bread consumption (refrigerated storage and toasting), which contribute 35% and 25%, respectively. The CF can be reduced by an average of 25% by avoiding toasting and storing bread in the refrigerator. Further reductions (5–10%) can be achieved by reducing the amount of bread waste discarded by consumers. The contribution of transportation and packaging to the overall results is small. Similar trends in results were also found in a study based on secondary data and following ISO 14044 methodology. The main methodological differences between the two standards relate to the PAS 2050 specification [23], which defines requirements for assessing life cycle GHG emissions of goods and services based on key life cycle assessment techniques and principles. It distinguishes between “the cradle-to-gate” and “cradle-to-grave” boundaries of the scope of the study, while the scope of measurement included in ISO 14044 depends on the purpose of the study [25].
The CF of rye bread produced on an industrial scale in Denmark was determined by identifying the steps that significantly contribute to the generation of the carbon footprint. Using an attribution approach, the CF of 1 kg of rye bread was estimated at 0.731 kg CO2eq. The supply chain was considered in order to estimate the carbon footprint. The main source of carbon emissions was the raw material stage, especially agricultural production (cultivation), with processing and distribution as secondary sources. The waste management stage was considered an important and previously overlooked opportunity for process optimization [26].
Chiriacò et al. compared the impact of organic and conventional agriculture on climate change in terms of GHG emissions from organic and conventional agriculture. They compared the production process of organic and conventional whole grain bread produced in central Italy by a small- and medium-sized bakery company. The carbon footprint was assessed using LCA methodology. It was determined that the CF of 1 kg of conventional whole-grain bread was 24% lower compared to the same organic bread, and was 1.18 and 1.55 kg CO2eq, respectively. If CF is evaluated per unit of cultivated area (ha), the organic wheat crop showed better performance in terms of GHG emissions than the conventional one by 60%, with CFs of 1150 and 2870 kg CO2eq per ha, respectively. The higher CF per unit of organic product is due to the lower yield per unit area grown in organic agriculture and the resulting attribution of fewer GHG emission products generated in the field phase of the life cycle. In contrast, the CF per hectare is higher when conventional practices are used due to the higher use of raw materials (higher seed density, agrochemicals for fertilizer and crop protection) for the same organic system. Organic farming for wheat in Italy is a low-carbon agriculture with a smaller contribution to climate change in terms of GHG emissions per hectare compared to conventional wheat farming, although reduced crop yields and the resulting need for more farmland should be considered. A more comprehensive assessment of the actual GHG emitted to the atmosphere from organic and conventional farming systems can be obtained when the CF is assessed per unit area, in addition to the CF per unit product [27]. The carbon footprint is a measure of a farm’s climate warming potential due to its high GHG emissions from agri-food processes. It is measured in kg CO2 equivalents (eq.) and calculated as the sum of the products of the climate warming potentials for individual GHGs (kg CO2eq per kg GHG) and emissions (kg) from all direct and indirect sources [28]. For the case of bread production, the CF was estimated in accordance with the PAS 2050 methodology and in accordance with the ISO 14044 methodology, while the life cycle assessment (LCA) methodology was used to compare the carbon footprint of organic and conventional whole grain bread production processes produced by small- and medium-sized enterprises.
3. Results and Discussion
An analysis of processes to determine the shares of each type of emissions for selected products and to identify directions for optimization of technology was performed. A carbon footprint can be used to assess the amount of greenhouse gas emissions in the food production and distribution area. The CF indicator is increasingly used with the development of low-carbon economy assumptions and the introduction of social responsibility strategies for the agri-food industry. Ongoing research should be aimed at analyzing existing technological processes, identifying solvable problems and developing new technological solutions that significantly affect the carbon footprint of food production [29].
Grain processing characteristics with identification of unit processes were performed. Crop production is one of the main directions of agricultural production in Poland. In recent years, the share of cereals in the global value of agricultural production is at 20%. In the structure of sown crops, cereals account for about 74% of the total area. In 2014–2018, the total grain harvest was at the level of 26.5–31.8 million tons. In 2022, the wheat harvest was as high as 13.5 million tons. Grain is one of the most important plant raw materials used for food production [30]. Grains in milling processes are processed into different types of flour, groats and flakes. The largest part is flour, which can be divided by purpose into bread flours, market flours, pasta flours and confectionery flours [31]. Each flour is characterized by a certain baking value, i.e., the balance between the gluten mesh’s ability to produce and retain gases in wheat bread and the protein mucous membranes in mixed and rye bread. Standardization and improvement of flour quality is based on the correction of the fermentation gas production and retention capacity with appropriate enzymes and with ascorbic acid acting synergistically with the added enzymes and improving the gluten structure. This action improves the fermentation capacity of the flour, strengthens (or weakens) the gluten protein structures, increases the water absorption capacity, resulting in improved dough and crumb quality, increased bread volume and prolonged freshness. The properties of the flour used in baking determine fundamentally, the quality of the resulting bread and the applicability of mechanized and continuous production systems. In processing, we produce different types of flour depending on demand. These are determined by the content of mineral substances in the flour. Thus, for example, type 450 specifies a content of 4.5 g of ash/1 kg of flour, type 750 a content of 7.5 g of ash/1 kg of flour, and type 2000 a content of 20 g of ash/1 kg of flour. Wheat grain is used to produce flours for a variety of products, so it is first necessary to determine the purpose of the flour and, based on this, select a grain with quality characteristics suitable for its production [32]. For the milling industry, it is important, for example, the shape and size of the grain (accuracy, alignment, weight of 1000 grains), the structure of the endosperm and its bonding to the casing (vitreousness, hardness), and the ash content (the maximum ash content in grain for the production of light flours must not exceed 1.80–1.85%) [33].
Each kind of confectionery bread requires flour with different quality parameters. Flour for yeast dough production should have the same quality parameters as flour for bread production, so it should be produced from grain with the same quality parameters, while flour “for cakes” should have lower than average water absorption (50–56%), and the dough should be elastic, “flowing”, inelastic and weak [34]. The best raw material for pasta production is semolina obtained by milling hard wheat. It should be characterized by a yellow color with an amber tint, high protein content (not less than 15%), the amount of gluten not less than 30%, which should be strong, but at the same time stretchy and malleable. Common wheat milling products (flour or porridge) are also used to make pasta [35]. Wheat flakes are one of the products obtained during three-grain milling of wheat. It can be produced in a wide range of granulations, depending on the intended use. For the production of wheat flakes, whole wheat grain is used. In corn milling, it is very important to extract the germ, which contains large amounts of fat, so that the quality and shelf life of milling products deteriorates. Maize milling products in the form of flours are used mainly as an additive in the production of bread, confectionery bread and in the production of pasta. Various types of groats are used to make corn flakes or in the brewing industry [36].
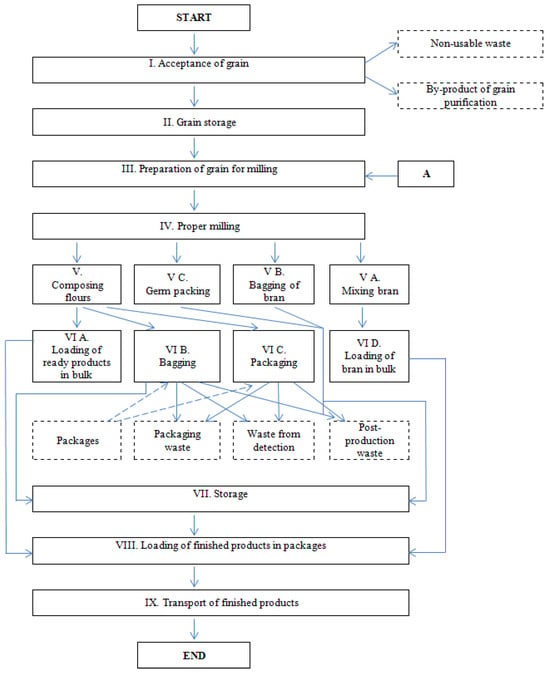
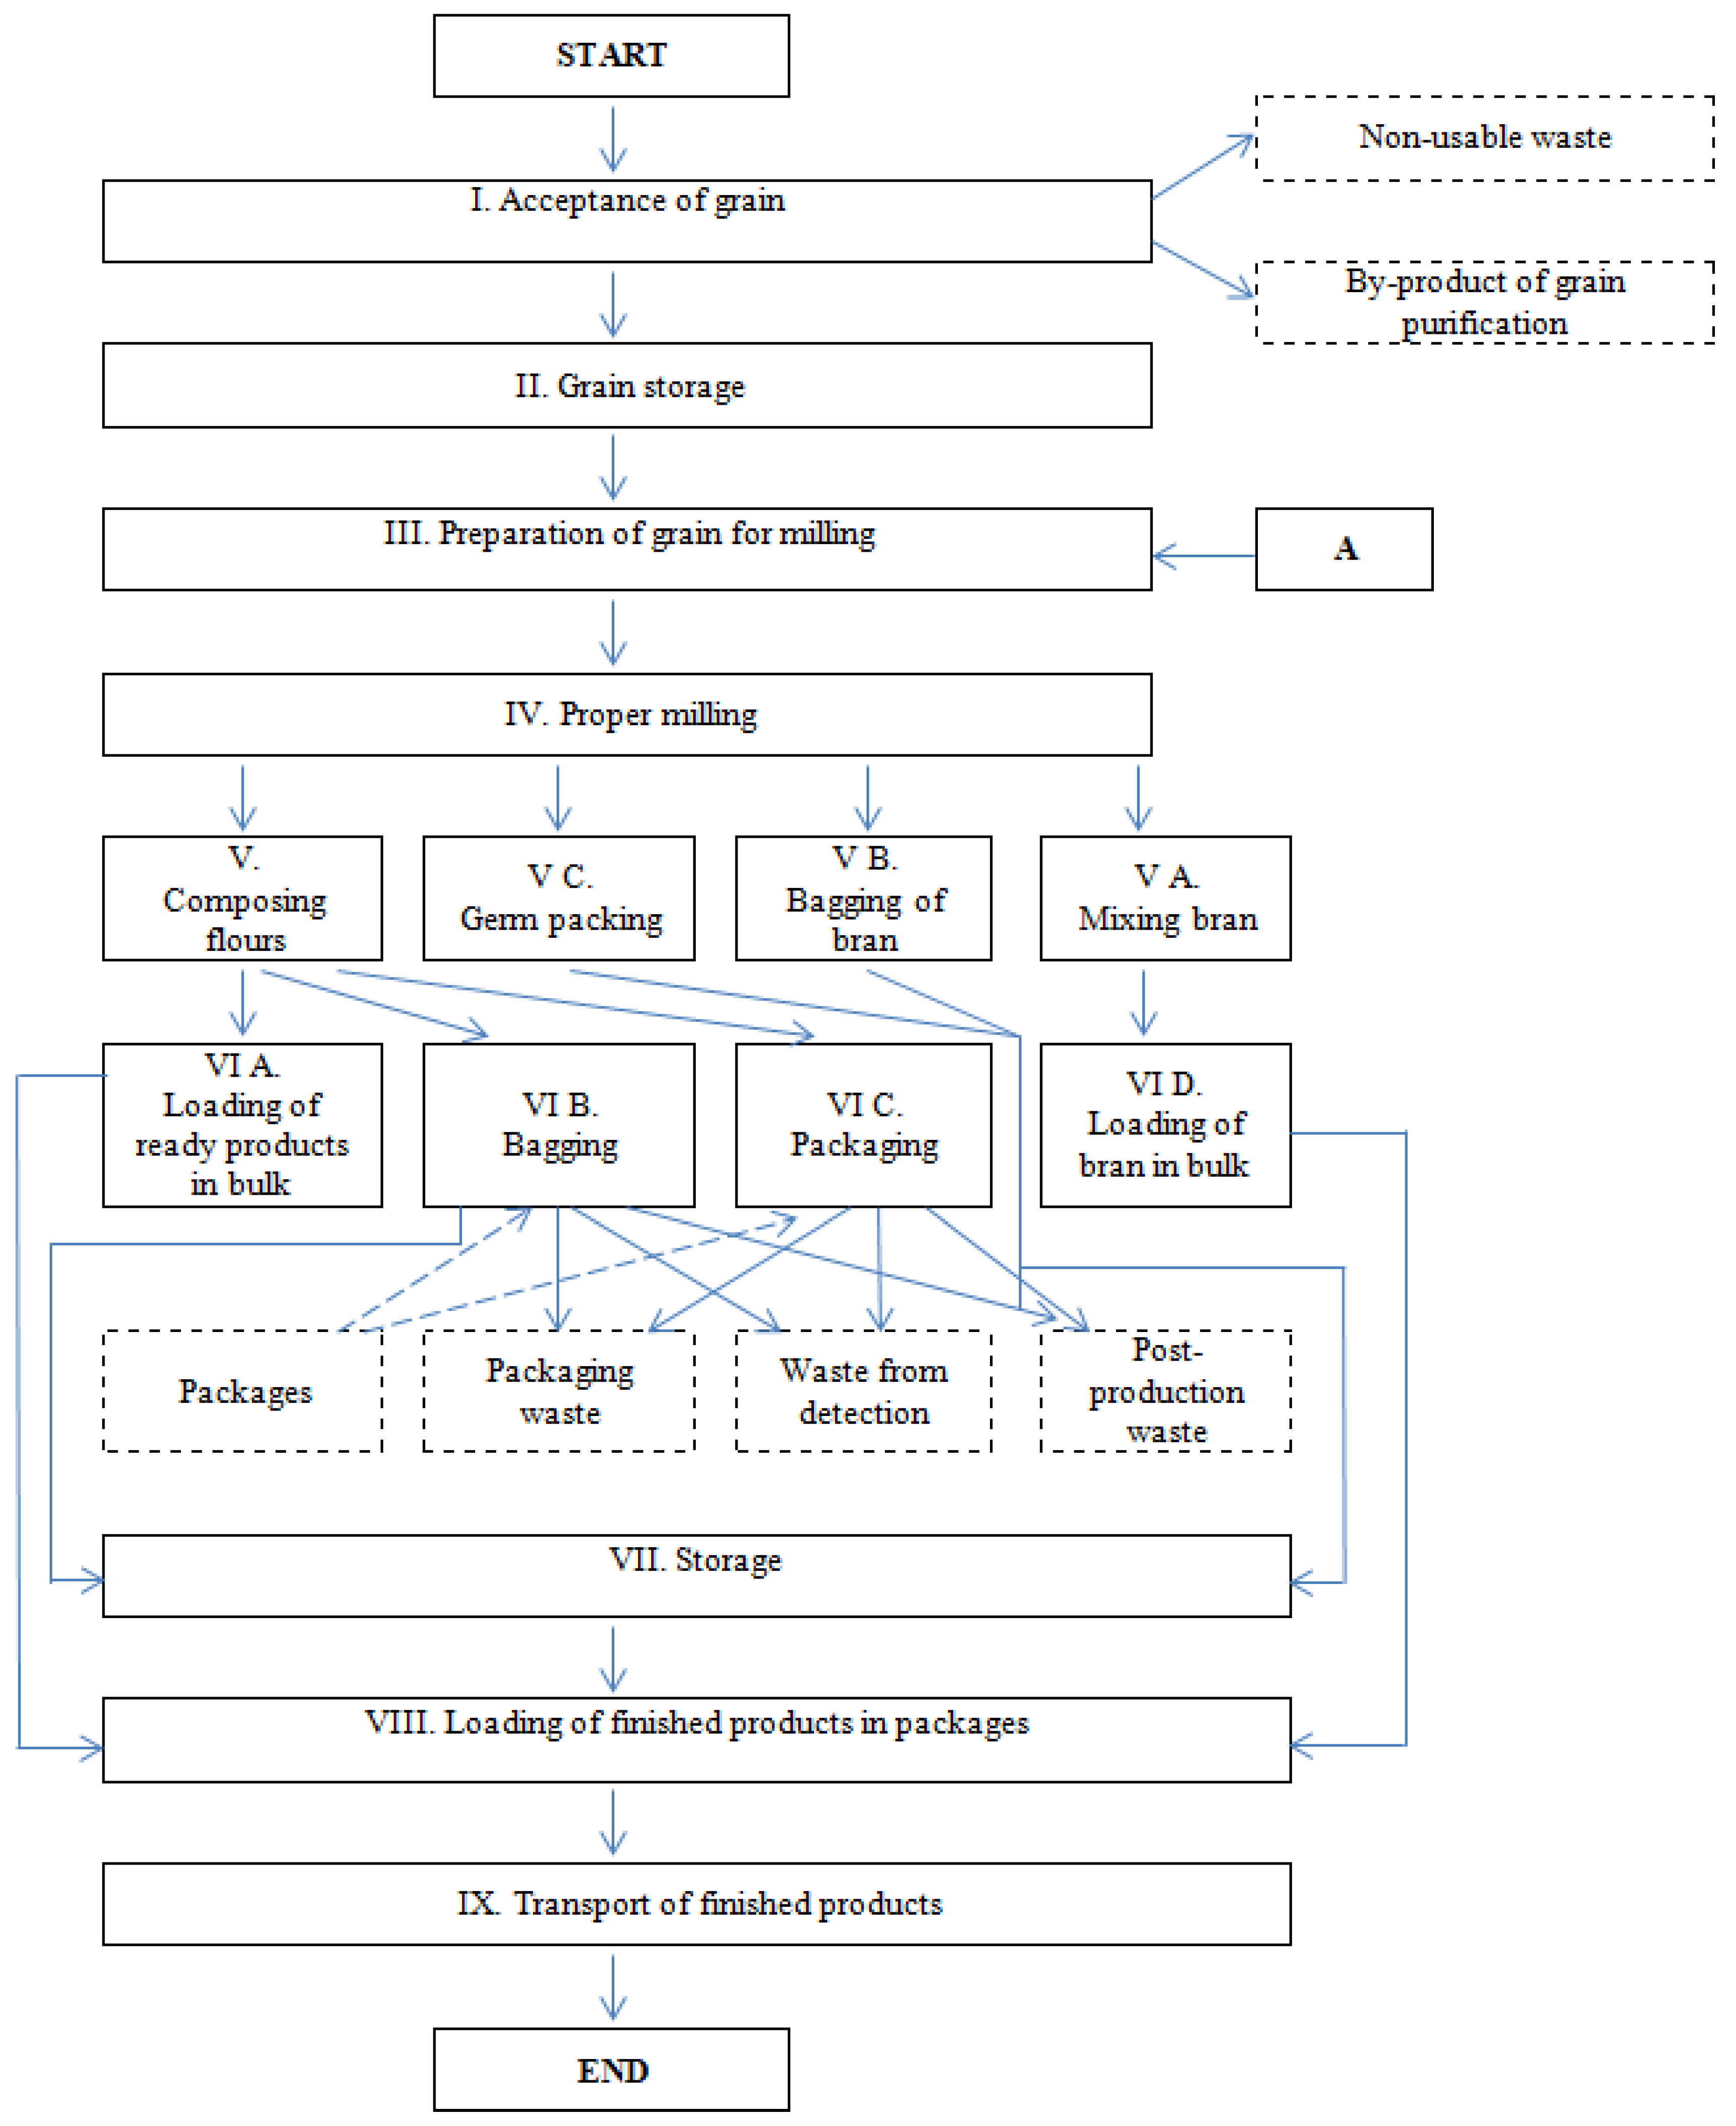
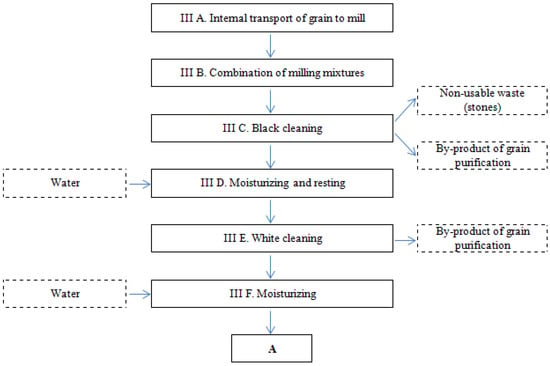
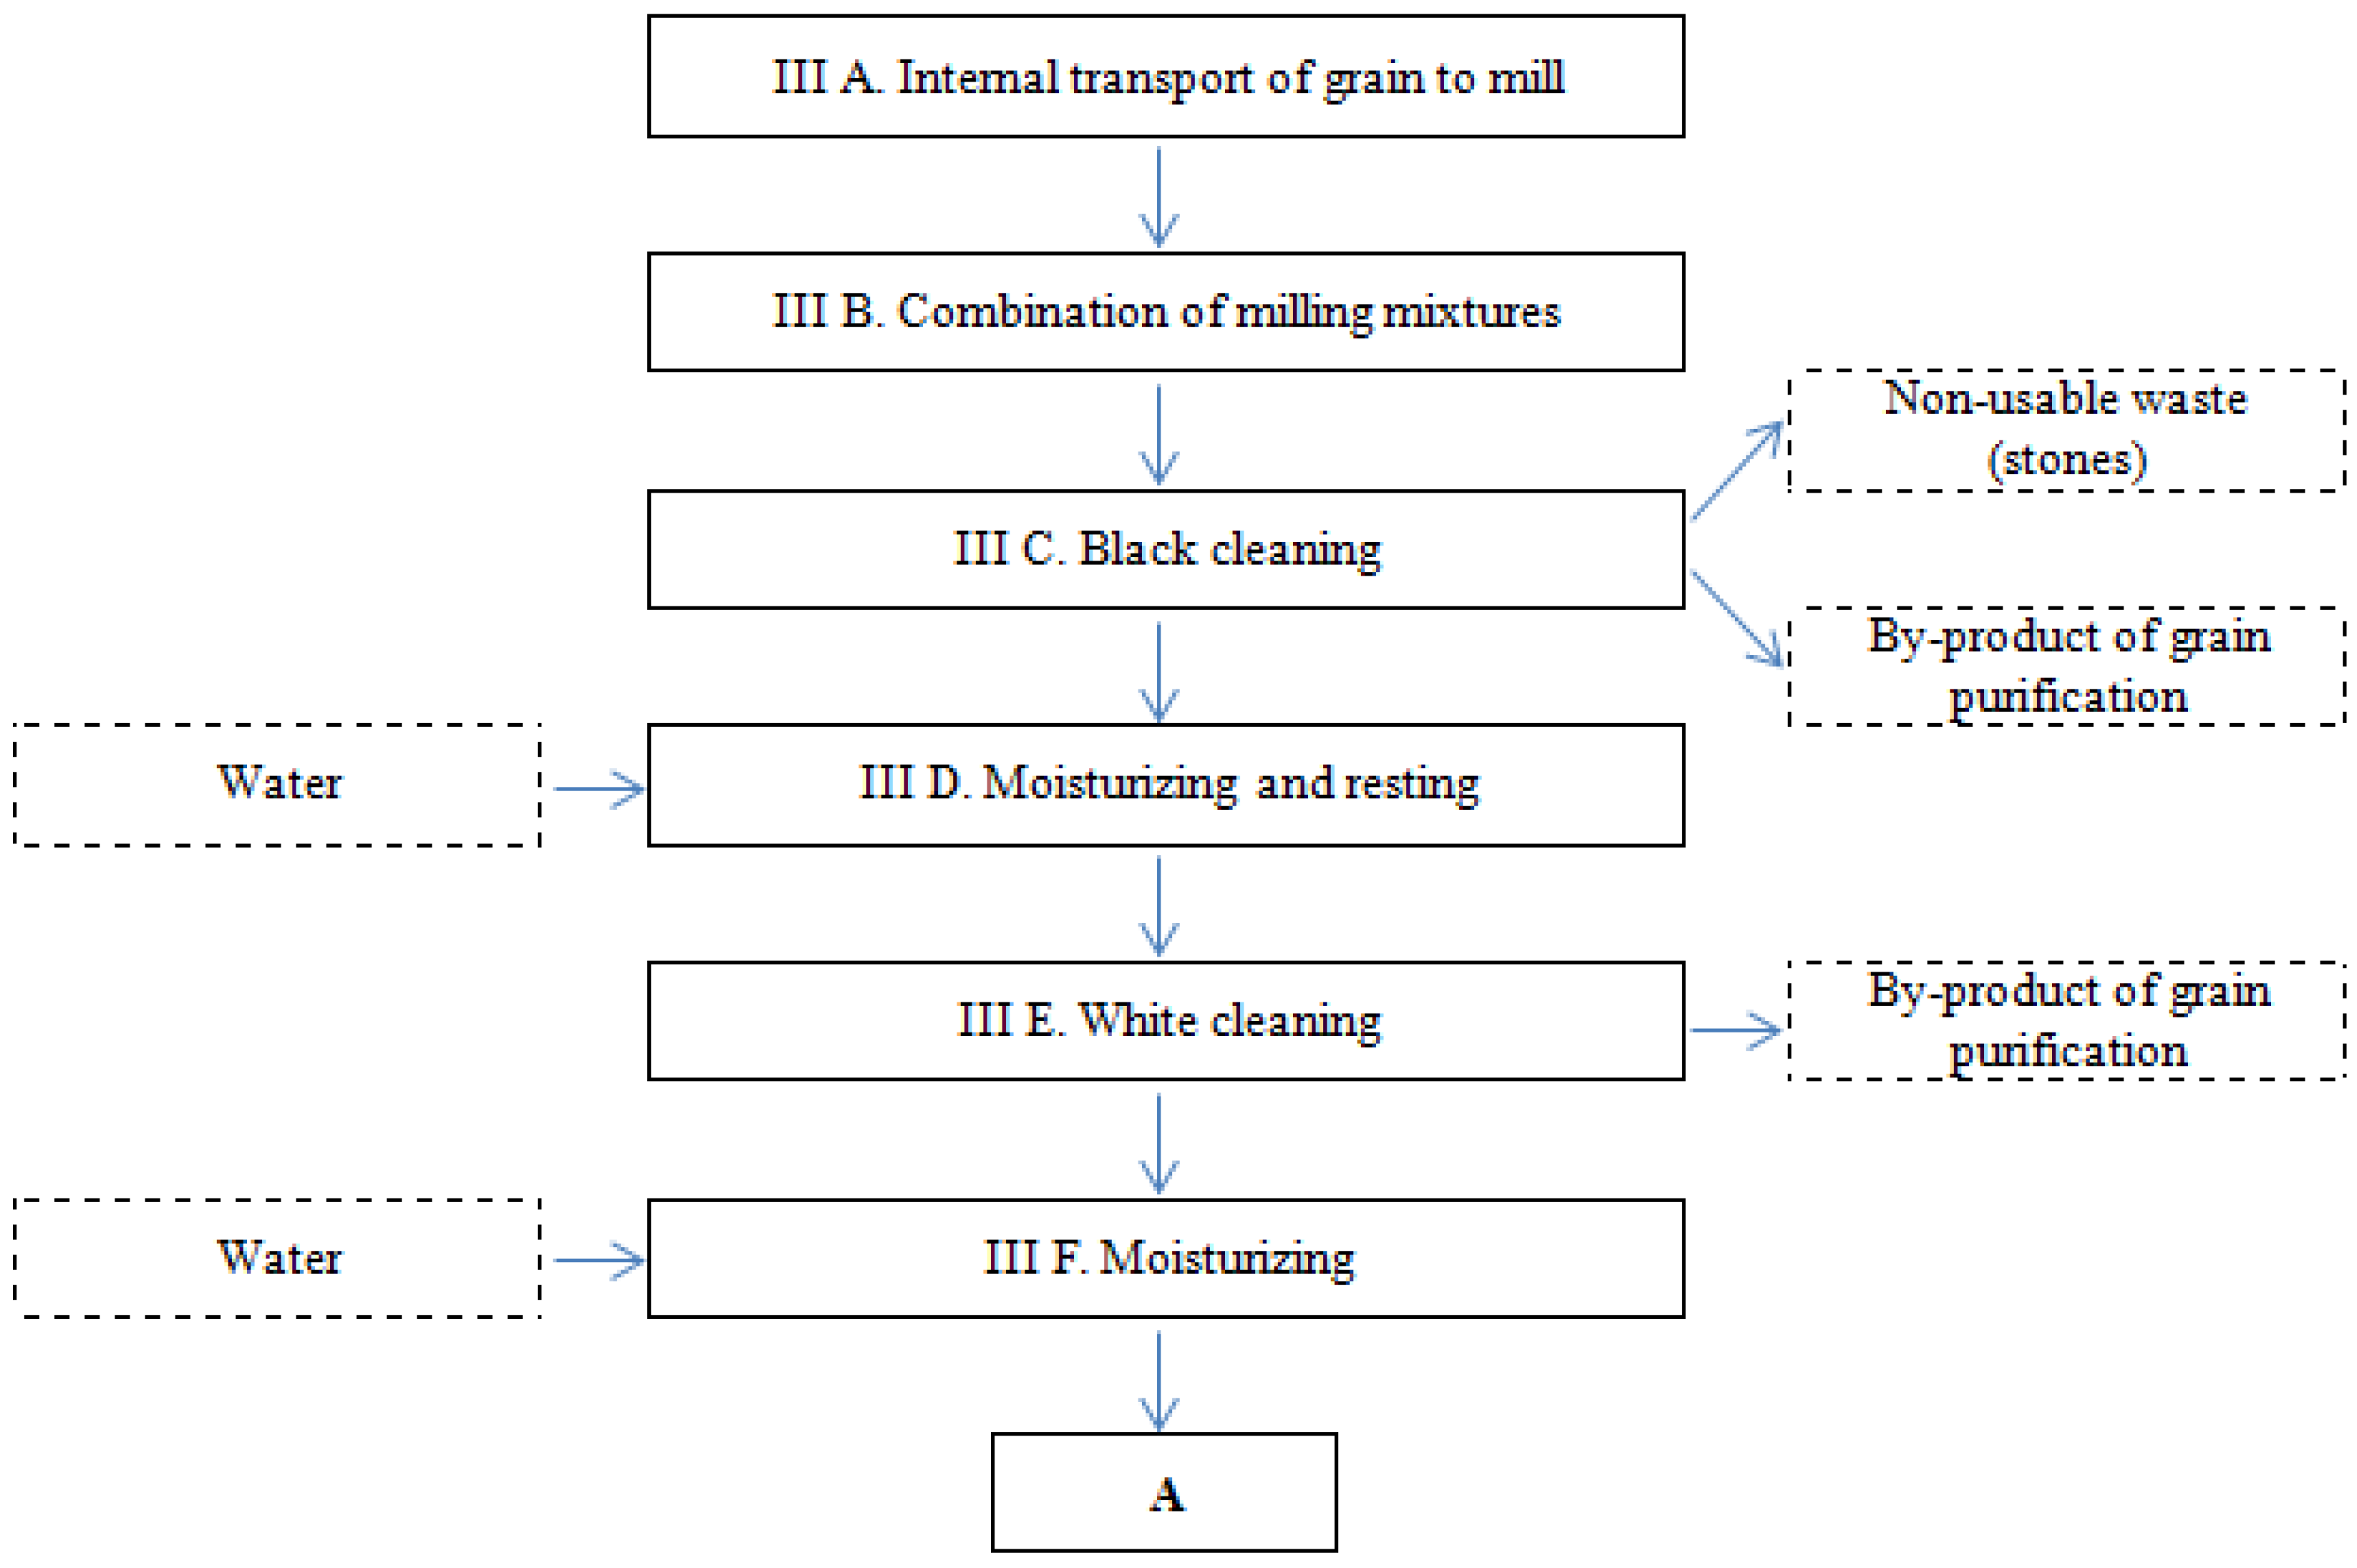
On the basis of data from the manufacturing plant, flour production has been characterized and schematically depicted in two figures to ensure clarity of the identified processes (Figure 1 and Figure 2). The equipment used at the various stages of production is presented in Table 4. The process begins with the preparation of grain for milling in the cleaner. The first step in preparing grain for milling is cleaning. After the grain is cleaned, conditioning must be carried out, which involves moistening and aging the grain. The next stage is cleaning. Its purpose is to remove impurities adhering to the surface of the grain and some parts of the grain, for example, parts of the fruit and seed coat. After these preliminary steps, grain milling is carried out in the mill proper. It involves milling the grain (previously cleaned and subjected to the conditioning process) and then also sorting between the different milling products. As a result, a final product is obtained through screening. The grain passes through the milling machines many times, and each time the milk is sifted to separate the coarse particles from the fine ones. The resulting products are sorted into flours, porridges, middlings and bran. In order to separate adhering fragments of the fruit and seed coatings, porridge and middlings are sorted and cleaned on porridge separators before being sent for further grinding. The product coming out of the creamer is not homogeneous and requires sorting. Sorting between milling products is based on the particle size on sifters (screens). Porridge sifters or flat sifters are used for sifting by quality. The basic multispecies milling is a three-species milling. This milling results in light flour type 550 (to extract 65%), bread flour type 750 (to extract 75–80%) and semolina (1.5%), crisp flour (2%) and cake flour (0.5%) [31,37].
Figure 1.
Scheme of flour production according to the selected plant—without preliminary preparation of grain for milling (stage A in diagram) (own description).
Figure 2.
Preliminary preparation of grain for milling (stage A in Figure 1) (own description).
Table 4.
Flour production stages and equipment used.
A detailed description of the calculation methodology is presented in the works [38,39]. In order to take into account the CF of applied energy media, appropriate conversion indicators were used, the values of which are shown in Table 5. The data on energy media consumption and production volume (Table 6) were collected at the production plant.
Table 5.
Indicator values for conversion of applied energy media for CF analysis.
Table 6.
Characteristics of energy media consumption in 2022.
On this basis, CO2eq emissions related to consumption of energy media were determined (Table 7) and the carbon footprint for each month was estimated (Table 8). The determined carbon footprint of flour production at the plant (scope of analysis: production and transportation) with respect to unit weight was 0.041–0.047 kg CO2eq/kg. The average carbon footprint of flour production was 0.044 kg CO2eq/kg. It was found that there was a dependence of the carbon footprint of poppy production on the season. The lowest value was in the summer months (June) and the highest in the winter months (February). In addition, there was no significant relationship between carbon footprint and monthly production volume. Production-related CO2eq emissions came mainly from indirect emissions from electricity consumed, which accounted for 96.8% of total emissions. CO2eq emissions related to transportation were constant throughout the year analyzed, averaging 2.63%.
Table 7.
CO2eq emissions related to consumption of energy media for 2022.
Table 8.
Monthly values of carbon footprint.
Expanding the analysis of the CF for the entire range (from the field to the table) requires taking into account primary production as well. Climate change has a negative impact on agriculture, which can be seen in the level of variability in yields. Agriculture is subjected to climate conditions, and the greenhouse effect affects food production. Direct GHG emissions associated with agricultural production combined with the expansion of agricultural areas, packaging, distribution, transportation, disposal, emissions from food production and consumption processes can exceed 40% of total global emissions [42].
Factors influencing changes in agricultural carbon dioxide emission levels include soil cultivation technology, the absorption capacity of the soil, the adopted farm profile, as well as state environmental protection measures. The possibility of reducing soil carbon dioxide emissions is carried out through such measures as the plowing of organic fertilizers or their substitutes of properly prepared straw, residual crop residues and green manures, which lead to an increase in the proportion of humus, resulting in the prevention of large amounts of carbon dioxide emissions into the atmosphere [43].
Reducing the use of chemical fertilizers, modern cultivation of agricultural land, more efficient farming technology, and reducing livestock numbers are all measures that significantly reduce GHG emissions in the agricultural sector. Performing farm work with new, less energy-intensive machinery and equipment has allowed farmers to farm more efficiently, both technologically and environmentally [43].
Currently, the development of the agri-food industry is striving to fully automate production processes. Smart greenhouses, intelligent sensor networks and closed production systems, in which human participation is not directly required, are increasingly being used. It is characterized by the implementation of a variety of tools that enable the digitization of food production systems, striving to reduce labor costs as much as possible while maintaining the quality and safety of the products produced, as well as introducing sustainability principles by reducing water, fuel and fertilizer consumption and promoting the use of renewable energy [42,44].
When considering the problem of GHG emissions in agriculture, special attention should be paid to the issue of production technology. Farmers’ investments in modern machinery and adherence to cross-compliance and good agricultural practices have played an important role in leveling emissions of harmful compounds into the atmosphere. Nevertheless, the threat of maintaining food security on a global scale will continue to significantly affect the level of natural resource intensity of the agricultural sector, which will translate into the level of greenhouse gas emissions in this sector of the economy [45]. Expanding the scope of farm-to-table CF analysis requires considering GHG emissions throughout the food production chain, adding up primary production and other stages of the supply chain. A complete CF analysis of flour should include all stages of production; however, in this paper it was narrowed to the stages of processing and transportation (Table 9).
Table 9.
GHG emissions at different stages of food production [43,45].
In recent years, the European Commission has carried out a series of activities to develop uniform methods for measuring the environmental impact of products and companies in different industries. The food sector has included pasta, bottled water, dairy products, wine, beer, olive oil, coffee, marine fish and meat, and pet and livestock feed, among others. In the near future, manufacturers will be required to include environmental footprint information on labels to give consumers the opportunity to make an informed choice among products that affect the environment in varying degrees [46].
4. Summary and Conclusions
The CF provides a measurable and rational basis for starting a discussion on a strategy to increase the efficiency of production processes while reducing energy consumption and developing its optimal distribution. A detailed analysis must be carried out for each production and the method of calculating the CF must be tailored to specific needs. An individual approach is required when analyzing the CF of each product, but it has to take into account the life cycle of the product. The CF is one of the best and most reliable tools for verifying processes and reducing business GHG emissions. CF analysis also allows for a reduced scope, e.g., only the manufacturing process (cradle to gate), which must be detailed in the analysis. Such a broad scope requires more work but allows for a transparent representation of processes throughout the life cycle.
Calculating CF is not yet mandatory, but it is becoming more widely used with the development of low-carbon economy assumptions and the introduction of social responsibility strategies for food producers. Dissemination of the methodology for calculating the carbon footprint can provide an effective stimulus for the implementation of efficient solutions aimed at optimizing energy consumption. Closed-loop economy refers to the constant interaction of the entire chain of actors: starting from farmers, food producers, suppliers and retail chains to consumers, as well as taking environmentally conscious actions.
The life cycle assessment (LCA) methodology was used to compare the CF of organic and conventional bread production processes. There is no unified methodology for a given product group, with individual approaches designed for specific product groups existing in the literature. To date, it has not been possible to finally globally standardize the methodology for calculating the carbon footprint. Therefore, there are many ways/versions of measuring and calculating the CF, which differ significantly from one another. It has been shown that for each production and product, a detailed analysis must be carried out and the CF calculation method must be adapted to specific needs, taking into account their characteristics. Appropriate CF analysis methods and universal metering systems are necessary to identify the individual steps responsible for GHG emissions in food production. CF reduction is possible by shortening the supply chain, optimizing production equipment, and modifying food technology and production planning.
Author Contributions
M.W.-J.: conceptualization; data curation; formal analysis; funding acquisition; investigation; methodology; project administration; resources; supervision; validation; writing—review and editing. E.W.: conceptualization; data curation; formal analysis; investigation; methodology; software; visualization; writing—original draft. All authors have read and agreed to the published version of the manuscript.
Funding
This work was supported by the target grant from the Ministry of Agriculture and Rural Development. Task 4. Identification and development of new national unit indicators and sustainable production methods for environmental protection and combating climate change in agriculture. (Contract No. DRR.prz.070.1.2022.). Task 4. Analysis and methodology for measuring the carbon footprint for selected technologies and agri-food products produced by the domestic food industry (Contract No. DRE.prz.070.2.2023).
Institutional Review Board Statement
Not applicable.
Data Availability Statement
The data presented in this study are available within the article.
Conflicts of Interest
The authors declare no conflict of interest.
References
- Negra, C.; Remans, R.; Attwood, S.; Jones, S.; Werneck, F.; Smith, A. Sustainable agri-food investments require multi-sector co-development of decision tools. Ecol. Indic. 2020, 110, 105851. [Google Scholar] [CrossRef] [Scilit]
- Corredig, M.; Colelli, G. Rethinking packaging for circular and sustainable food supply chains of the future. J. Sci. Food Agric. 2023, 103, 985. [Google Scholar] [CrossRef] [Scilit] [PubMed]
- Palmieri, N.; Forleo, M.B.; Giannoccaro, G.; Suardi, A. Environmental impact of cereal straw management: An on-farm assessment. J. Clean. Prod. 2017, 142, 2950–2964. [Google Scholar] [CrossRef] [Scilit]
- Nie, W.; Liu, C. Assessing food safety risks based on a geospatial analysis: Toward a cross-regional food safety management. J. Sci. Food Agric. 2023, 103, 6654–6663. [Google Scholar] [CrossRef] [Scilit]
- Gliwa, E. Wpływ zmian restrukturyzacyjnych na rozwój sektora rolno-spożywczego w Polsce. Prog. Econ. Sci. 2015, 2, 250-161. [Google Scholar]
- Poczta, W.; Beba, P. Rola przemysłu spożywczego w gospodarkach krajów UE. Probl. World Agric. 2014, 14, 158–167. [Google Scholar] [CrossRef] [Scilit]
- Murphy, C.; Kendall, A. Life cycle inventory development for corn and stover production systems under different allocation methods. Biomass Bioenergy 2013, 58, 67–75. [Google Scholar] [CrossRef] [Scilit]
- Abbade, E.B. Land footprint and GHG emissions from global food loss. J. Sci. Food Agric. 2023, 103, 4430–4440. [Google Scholar] [CrossRef] [Scilit]
- Nabipour, A.H.; Ahmed, J.; Mobin Siddique, B.; Khairuddin, N.; Hassan, A. A comprehensive review on carbon footprint of regular diet and ways to improving lowered emissions. Results Eng. 2023, 18, 101054. [Google Scholar] [CrossRef] [Scilit]
- IPCC. Climate Change 2001: The Scientific Basis; IPCC: Geneva, Switzerland, 2007.
- Caro, D. Carbon Footprint. In Encyclopedia of Ecology, 2nd ed.; Elsevier: Amsterdam, The Netherlands, 2019; pp. 252–257. [Google Scholar] [CrossRef] [Scilit]
- Garnett, T. Cooking Up a Storm—Food, Greenhouse Gas Emissions and Our Changing Climate; Food Climate Research Network; University of Surrey: Guildford, UK, 2008. [Google Scholar]
- ISO 14064:2018; Greenhouse Gases—Part 1: Specification with Guidance at the Organization Level for Quantification and Reporting of Greenhouse Gas Emissions and Removals. ISO: Geneva, Switzerland, 2018.
- ISO 14040:2009; Environmental Management—Life Cycle Assessment—Principles and Framework. ISO: Geneva, Switzerland, 2009.
- ISO 14044:2009; Environmental Management, Life Cycle Assessment—Requirements and Guidelines. ISO: Geneva, Switzerland, 2009.
- Chen, B.; Cui, J.; Dong, W.; Yan, C. Effects of Biodegradable Plastic Film on Carbon Footprint of Crop Production. Agriculture 2023, 13, 816. [Google Scholar] [CrossRef] [Scilit]
- Ruiz-Carrasco, B.; Fernández-Lobato, L.; López-Sánchez, Y.; Vera, D. Life Cycle Assessment of Olive Oil Production in Turkey, a Territory with an Intensive Production Project. Agriculture 2023, 13, 1192. [Google Scholar] [CrossRef] [Scilit]
- Muralikrishna, I.V.; Manickam, V. Chapter Five—Life Cycle Assessment. In Environmental Management; Butterworth-Heinemann: Oxford, UK, 2017; pp. 57–75. [Google Scholar] [CrossRef] [Scilit]
- Mohammadi, A.; Venkatesh, G.; Eskandari, S.; Rafiee, S. Eco-Efficiency Analysis to Improve Environmental Performance of Wheat Production. Agriculture 2022, 12, 1031. [Google Scholar] [CrossRef] [Scilit]
- Holka, M.; Kowalska, J.; Jakubowska, M. Reducing Carbon Footprint of Agriculture—Can Organic Farming Help to Mitigate Climate Change? Agriculture 2022, 12, 1383. [Google Scholar] [CrossRef] [Scilit]
- Kumar, M.; Choubey, V.; Deepak, A.; Gedam, V.; Raut, R. Life cycle assessment (LCA) of dairy processing industry: A case study of North India. J. Clean. Prod. 2021, 326, 129331. [Google Scholar] [CrossRef] [Scilit]
- ISO 14067:2018; Greenhouse Gases Carbon Footprint of Products Requirements and Guidelines for Uantification. ISO: Geneva, Switzerland, 2009.
- PAS 2050:2011; Specification for the Assessment of the Life Cycle Greenhouse Gas Emissions of Goods and Services. London, UK, 2011.
- PAS 2060:2014; Standard for Carbon Neutrality. London, UK, 2014.
- Espinoza-Orias, N.; Stichnothe, H.; Azapagic, A. The carbon footprint of bread. Int. J. Life Cycle Assess 2011, 16, 351–365. [Google Scholar] [CrossRef] [Scilit]
- Jensen, J.K.; Arlbjørn, J.S. Product carbon footprint of rye bread. J. Clean. Prod. 2014, 82, 45–57. [Google Scholar] [CrossRef] [Scilit]
- Chiriacò, M.V.; Grossi, G.; Castaldi, S.; Valentini, R. The contribution to climate change of the organic versus conventional wheat farming: A case study on the carbon footprint of wholemeal bread production in Italy. J. Clean. Prod. 2017, 153, 309–319. [Google Scholar] [CrossRef] [Scilit]
- Kumar, B.M.; Aravindakshan, S. Carbon footprints of the Indian AFOLU (Agriculture, Forestry, and Other Land Use) sector: A review. Carbon Footpr. 2023, 2, 1. [Google Scholar] [CrossRef] [Scilit]
- Ji, C.; Zhai, Y.; Zhang, T.; Shen, X.; Bai, Y.; Hong, J. Carbon, energy and water footprints analysis of rapeseed oil production: A case study in China. J. Environ. Manag. 2021, 287, 112359. [Google Scholar] [CrossRef] [Scilit]
- Situation on Agricultural Markets, Grain Market—Bureau of Analysis and Strategies of the National Center for Agricultural Support; Information Bulletin No. 3/2020; Warsaw, Poland, 2020.
- Campbell, G.M.; Webb, C.; Owens, G.W.; Scanlon, M.G. Milling and flour quality. In Woodhead Publishing Series in Food Science, Technology and Nutrition, Breadmaking, 2nd ed.; Woodhead Publishing: Cambridge, UK, 2012; pp. 188–215. [Google Scholar] [CrossRef] [Scilit]
- Fei, L.; Xiaolin, L.; Zhangxuan, Q. Grain production space reconstruction: Connotation, mechanism and enlightenment. Environ. Dev. 2023, 45, 100818. [Google Scholar] [CrossRef] [Scilit]
- Akin, P.A.; Sezer, B.; Sanal, T.; Apaydin, H.; Koksel, H.; Boyaci, I. Multi-elemental analysis of flour types and breads by using laser induced breakdown spectroscopy. J. Cereal Sci. 2020, 92, 102920. [Google Scholar] [CrossRef] [Scilit]
- Niçin, R.; Özdemir, N.; Şimşek, Ö.; Çon, A.H. Production of volatiles relation to bread aroma in flour-based fermentation with yeast. Food Chem. 2022, 378, 132125. [Google Scholar] [CrossRef] [Scilit] [PubMed]
- Ruisi, P.; Ingraffia, R.; Urso, V.; Giambalvo, D.; Alfonzo, A.; Corona, O.; Settanni, L.; Frenda, A. Influence of grain quality, semolinas and baker’s yeast on bread made from old landraces and modern genotypes of Sicilian durum wheat. Food Res. Int. 2021, 140, 110029. [Google Scholar] [CrossRef] [Scilit] [PubMed]
- Theertha, M.K.; Kumar, A.; Inamdar, A.; Sakhare, S.D. Effect of hydrothermal treatment on physical and semolina milling properties of barley. J. Food Eng. 2020, 287, 110142. [Google Scholar] [CrossRef] [Scilit]
- De Farias, P.; Vasconcelos, L.; Ferreira, M.; Pascall, M.; Tapia-Blácido, D. Nopal cladode (Opuntia ficus-indica) flour: Production, characterization, and evaluation for producing bioactive film. Food Pack. Shelf Life 2021, 29, 100703. [Google Scholar] [CrossRef] [Scilit]
- Wróbel-Jędrzejewska, M.; Markowska, J.; Bieńczak, A.; Woźniak, P.; Ignasiak, Ł.; Polak, E.; Kozłowicz, K.; Różyło, R. Carbon Footprint in Vegeburger Production Technology Using a Prototype Forming and Breading Device. Sustainability 2021, 13, 9093. [Google Scholar] [CrossRef] [Scilit]
- Wróbel-Jędrzejewska, M.; Polak, E. Determination of carbon footprint in the processing of frozen vegetables using an online energy measurement system. J. Food Eng. 2022, 322, 110974. [Google Scholar] [CrossRef] [Scilit]
- Available online: https://www.gov.uk/government/publications/greenhouse-gas-reporting-conversion-factors-2023 (accessed on 10 October 2023).
- KOBiZE. Emission Factors of CO2, SO2, NOX, CO and Total Dust for Electricity Published in December 2022; KOBiZE: Warszawa, Poland, 2022. [Google Scholar]
- Oztemel, E.; Gursev, S. Literature review of Industry 4.0 and related technologies. J. Intel. Manuf. 2020, 31, 127–182. [Google Scholar] [CrossRef] [Scilit]
- Bansal, S.; Yin, X.; Schneider, L.; Sykes, V.; Jagadamma, S.; Lee, J. Carbon footprint and net carbon gain of major long-term cropping systems under no-tillage. J. Environ. Man. 2022, 307, 114505. [Google Scholar] [CrossRef] [Scilit]
- Demartini, M.; Pinna, C.; Tonelli, F.; Terzi, S.; Sansone, C.; Testa, C. Food industry digitalization: From challenges and trends to opportunities and solutions. IFAC 2018, 51, 1371–1378. [Google Scholar] [CrossRef] [Scilit]
- Pajewski, T. Changes in Greenhouse Gas Emissions in Agricultural Production. Sci. Yearbo. Ass. Agricult. Agribus. Econom. 2016, 18, 214–218. [Google Scholar]
- Zhang, L.; Ruiz-Menjivar, J.; Tong, Q.; Zhang, J.; Yue, M. Examining the carbon footprint of rice production and consumption in Hubei, China: A life cycle assessment and uncertainty analysis approach. J. Environ. Manag. 2021, 300, 113698. [Google Scholar] [CrossRef] [Scilit] [PubMed]

Disclaimer/Publisher’s Note: The statements, opinions and data contained in all publications are solely those of the individual author(s) and contributor(s) and not of MDPI and/or the editor(s). MDPI and/or the editor(s) disclaim responsibility for any injury to people or property resulting from any ideas, methods, instructions or products referred to in the content. |
© 2023 by the authors. Licensee MDPI, Basel, Switzerland. This article is an open access article distributed under the terms and conditions of the Creative Commons Attribution (CC BY) license (https://creativecommons.org/licenses/by/4.0/).