
Addressing Water Stress and Climate Variability in the Mediterranean: Study of Regulated Deficit Irrigation (RDI) and Non-Irrigation (NI) in Tempranillo and Cabernet Sauvignon (Vitis vinifera L.)


Abstract
1. Introduction
2. Materials and Methods
2.1. Irrigation Schedule
2.2. Transpiration Determination: Sap Flow, Leaf Water Potential, Photosynthesis, and Pressure–Volume
Data Analysis
3. Results
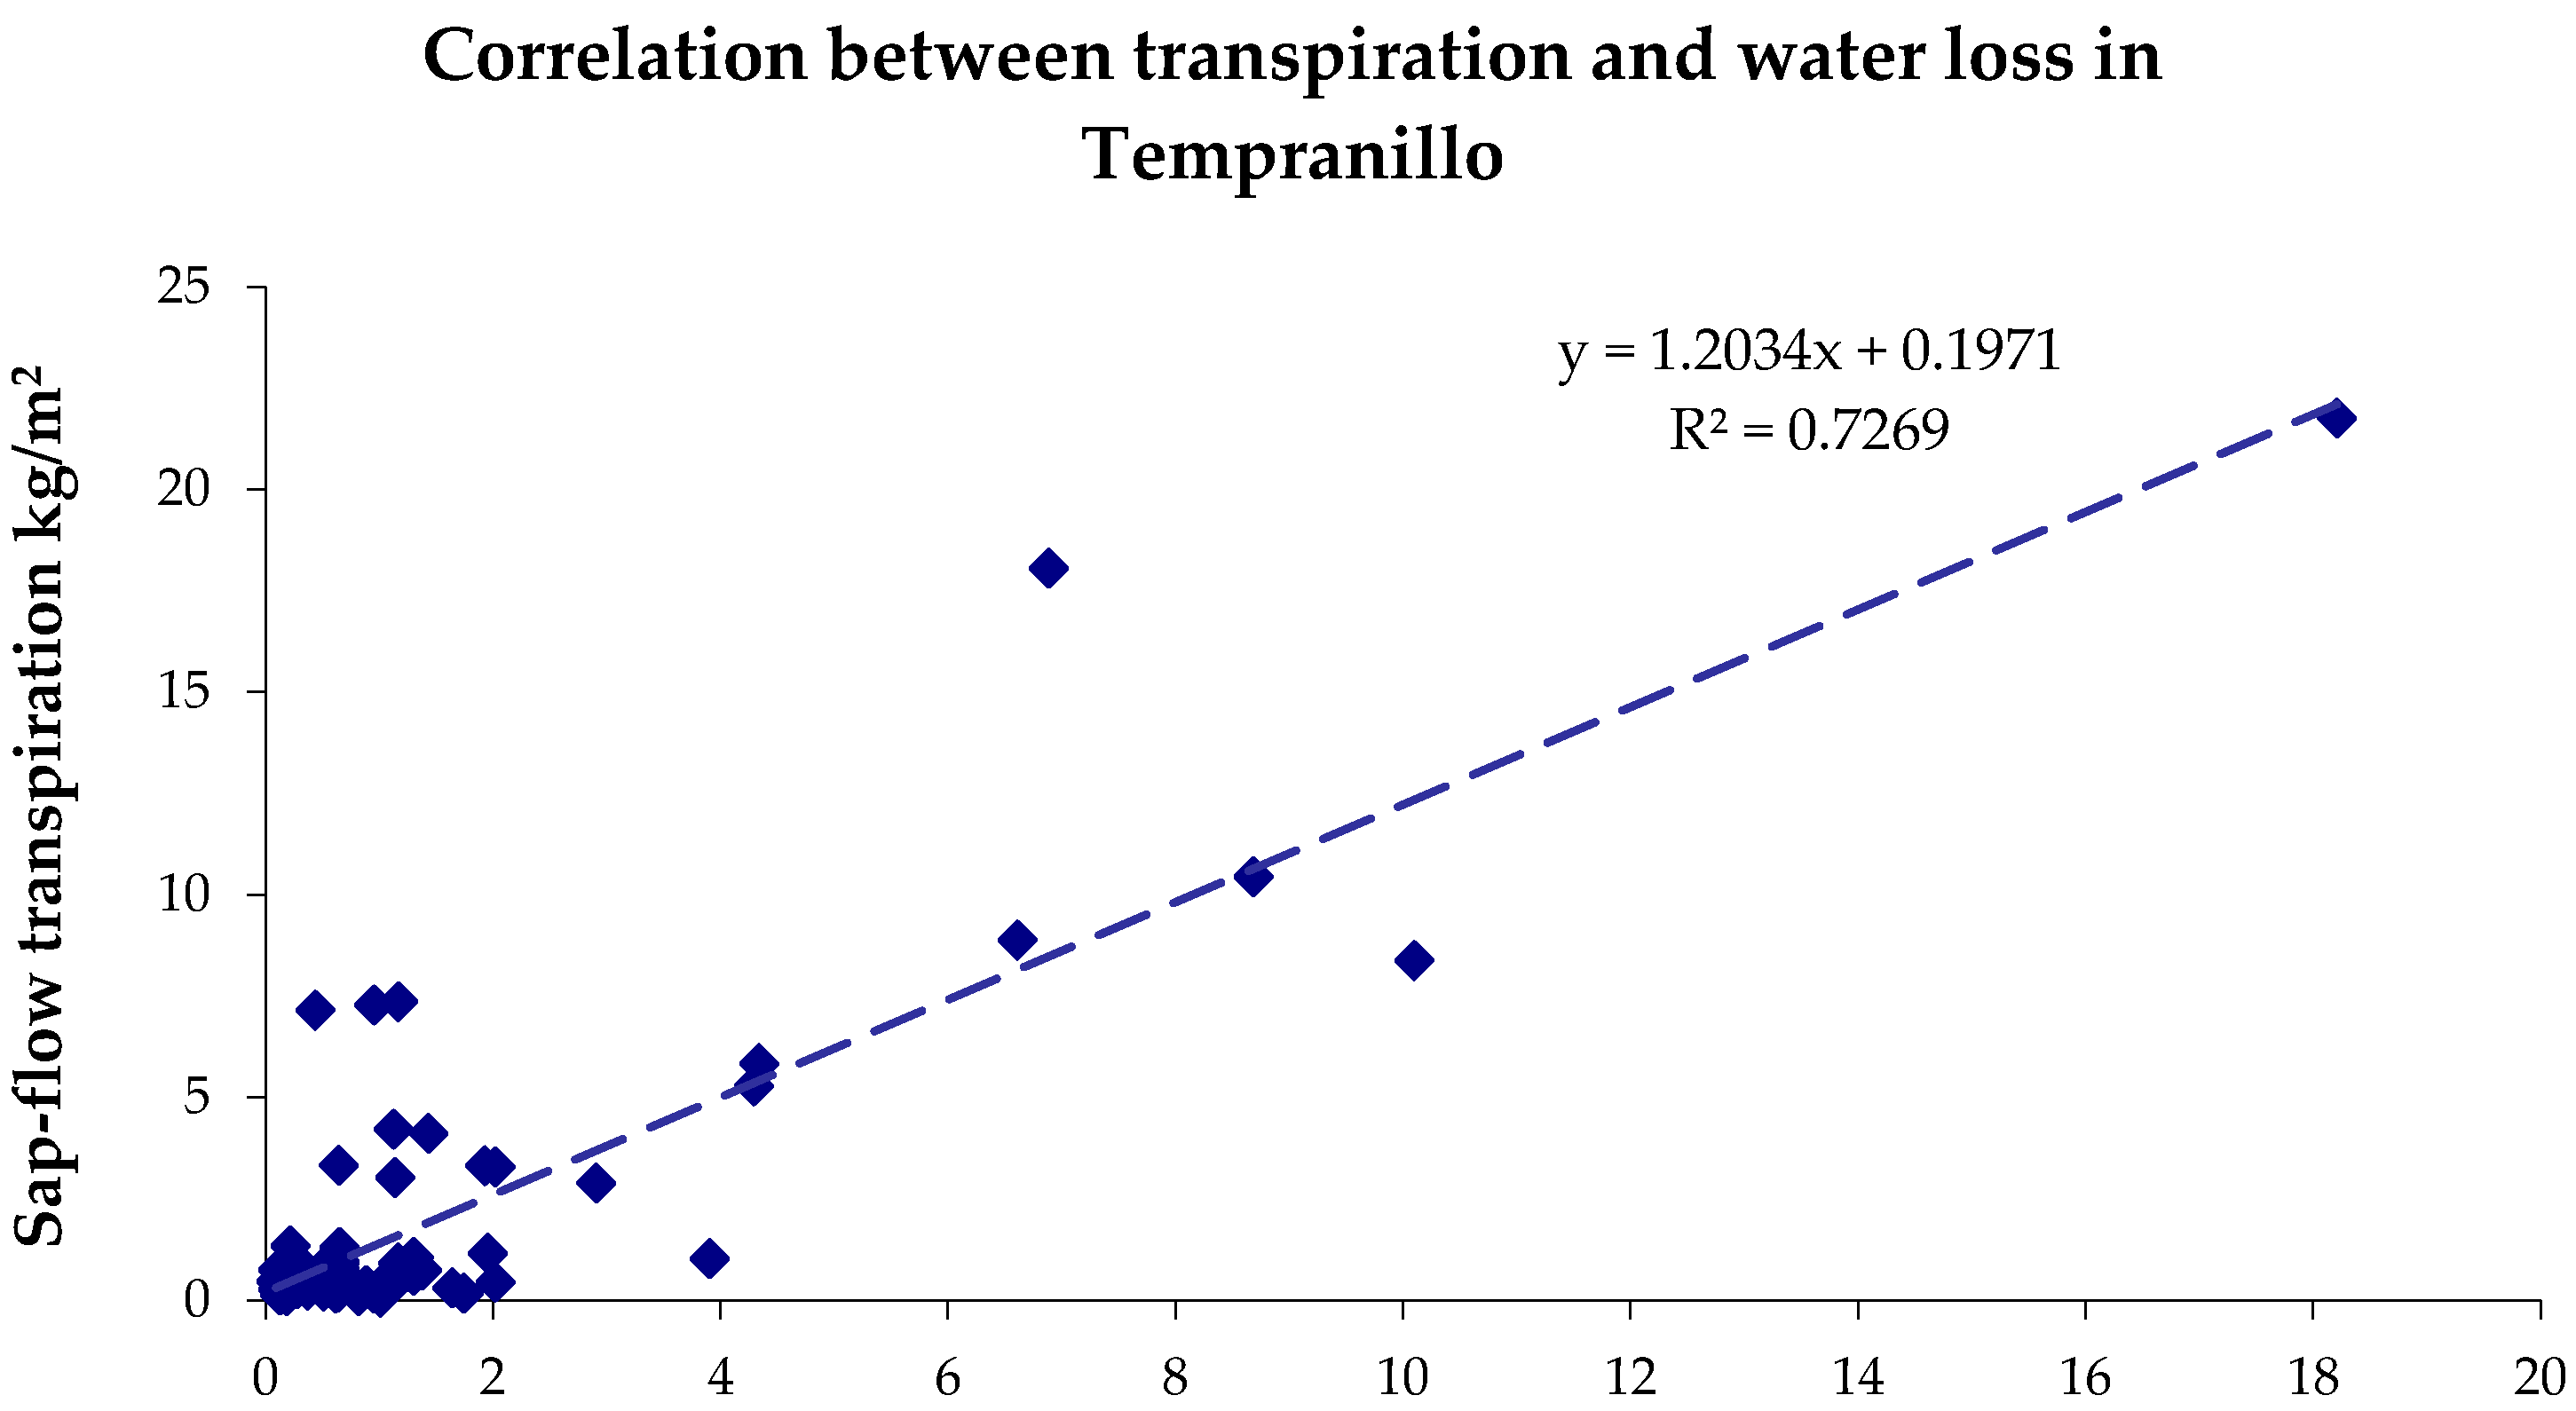
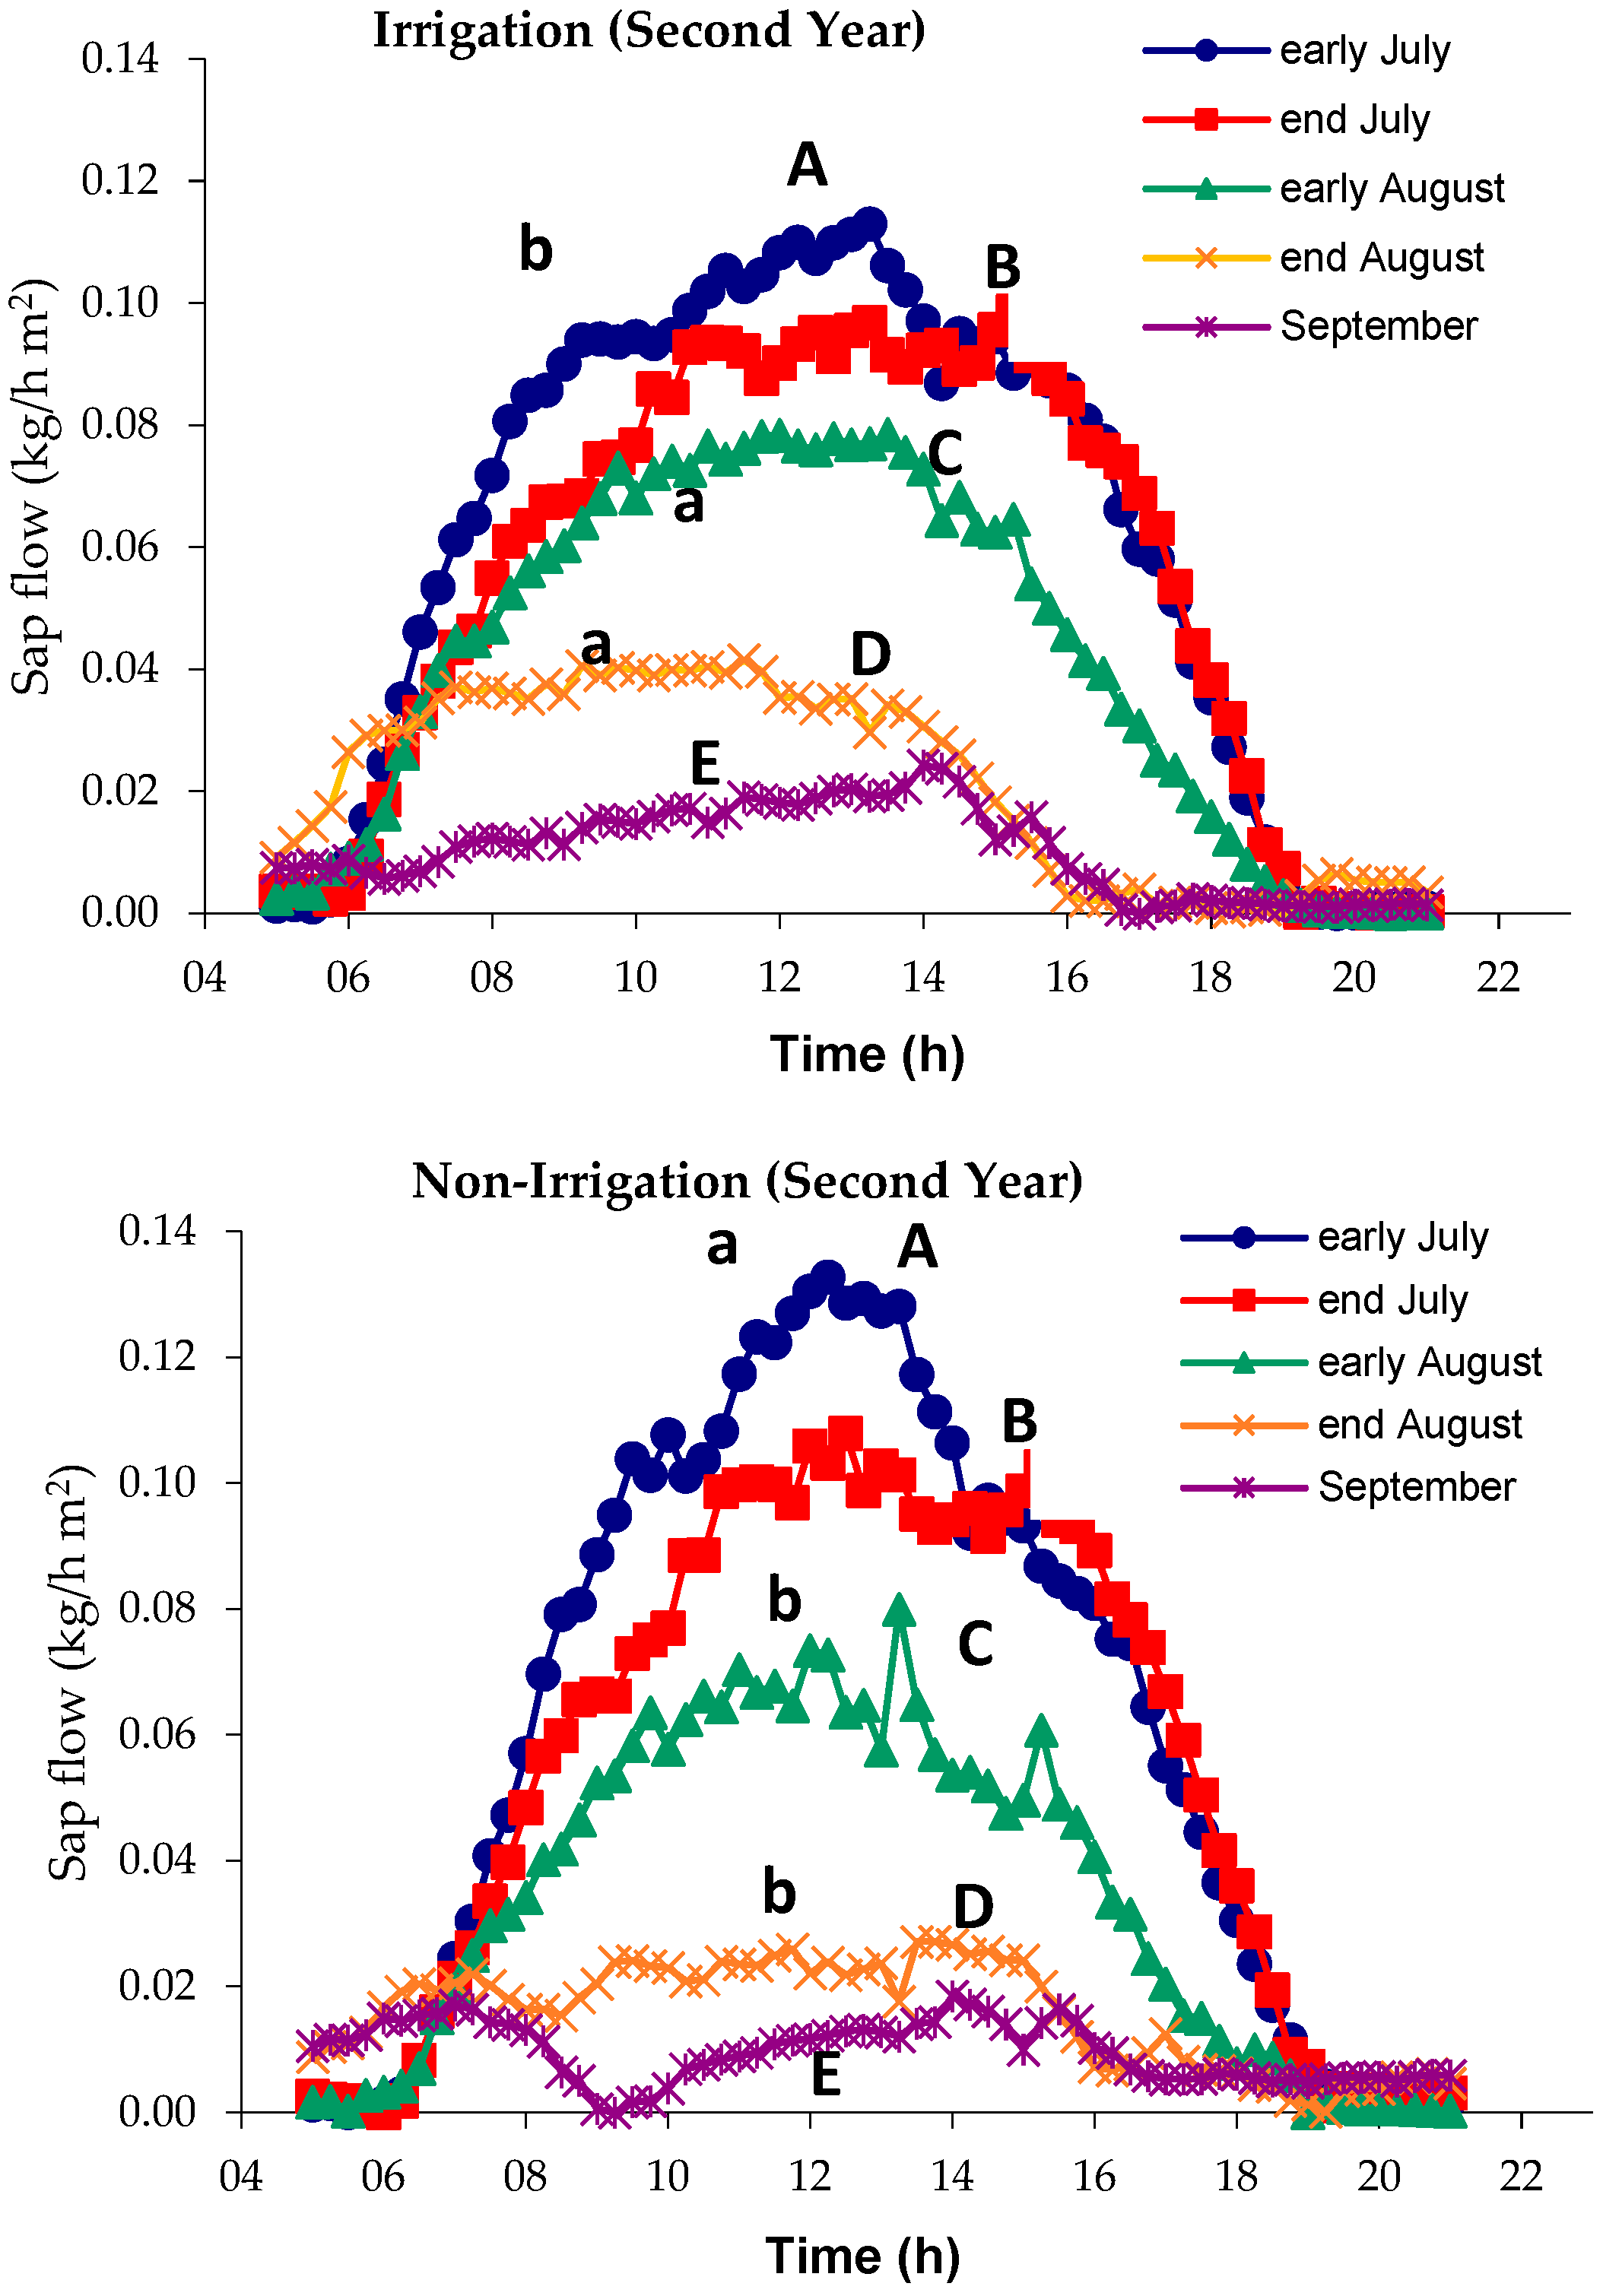
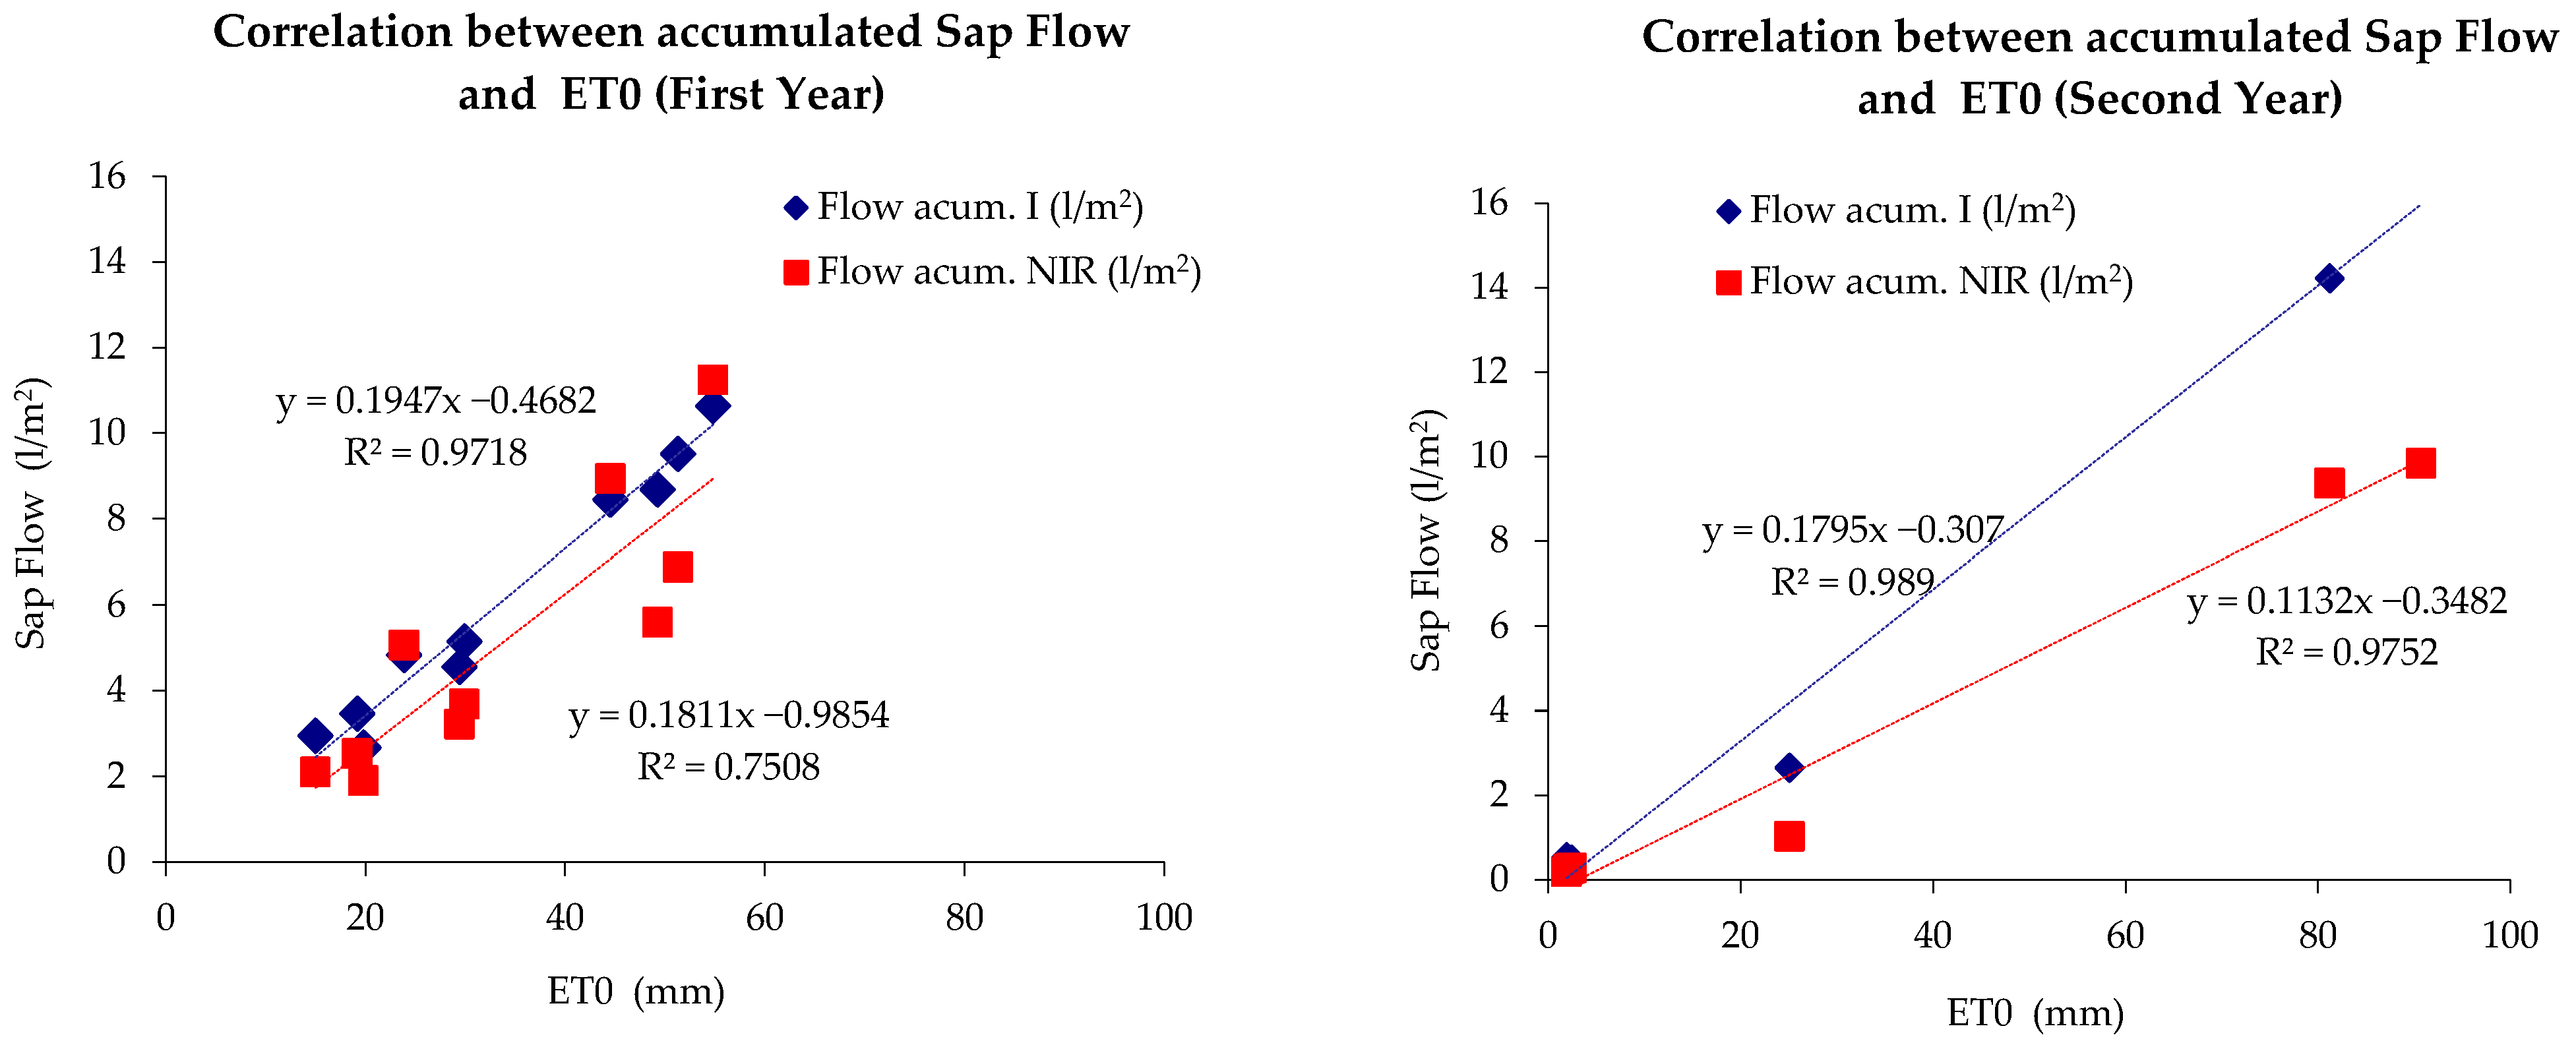
3.1. Sap Flow
3.2. Estimation of Crop Coefficient Kc
3.3. Physiologic Response of Tempranillo Leaves to Hydric Stress
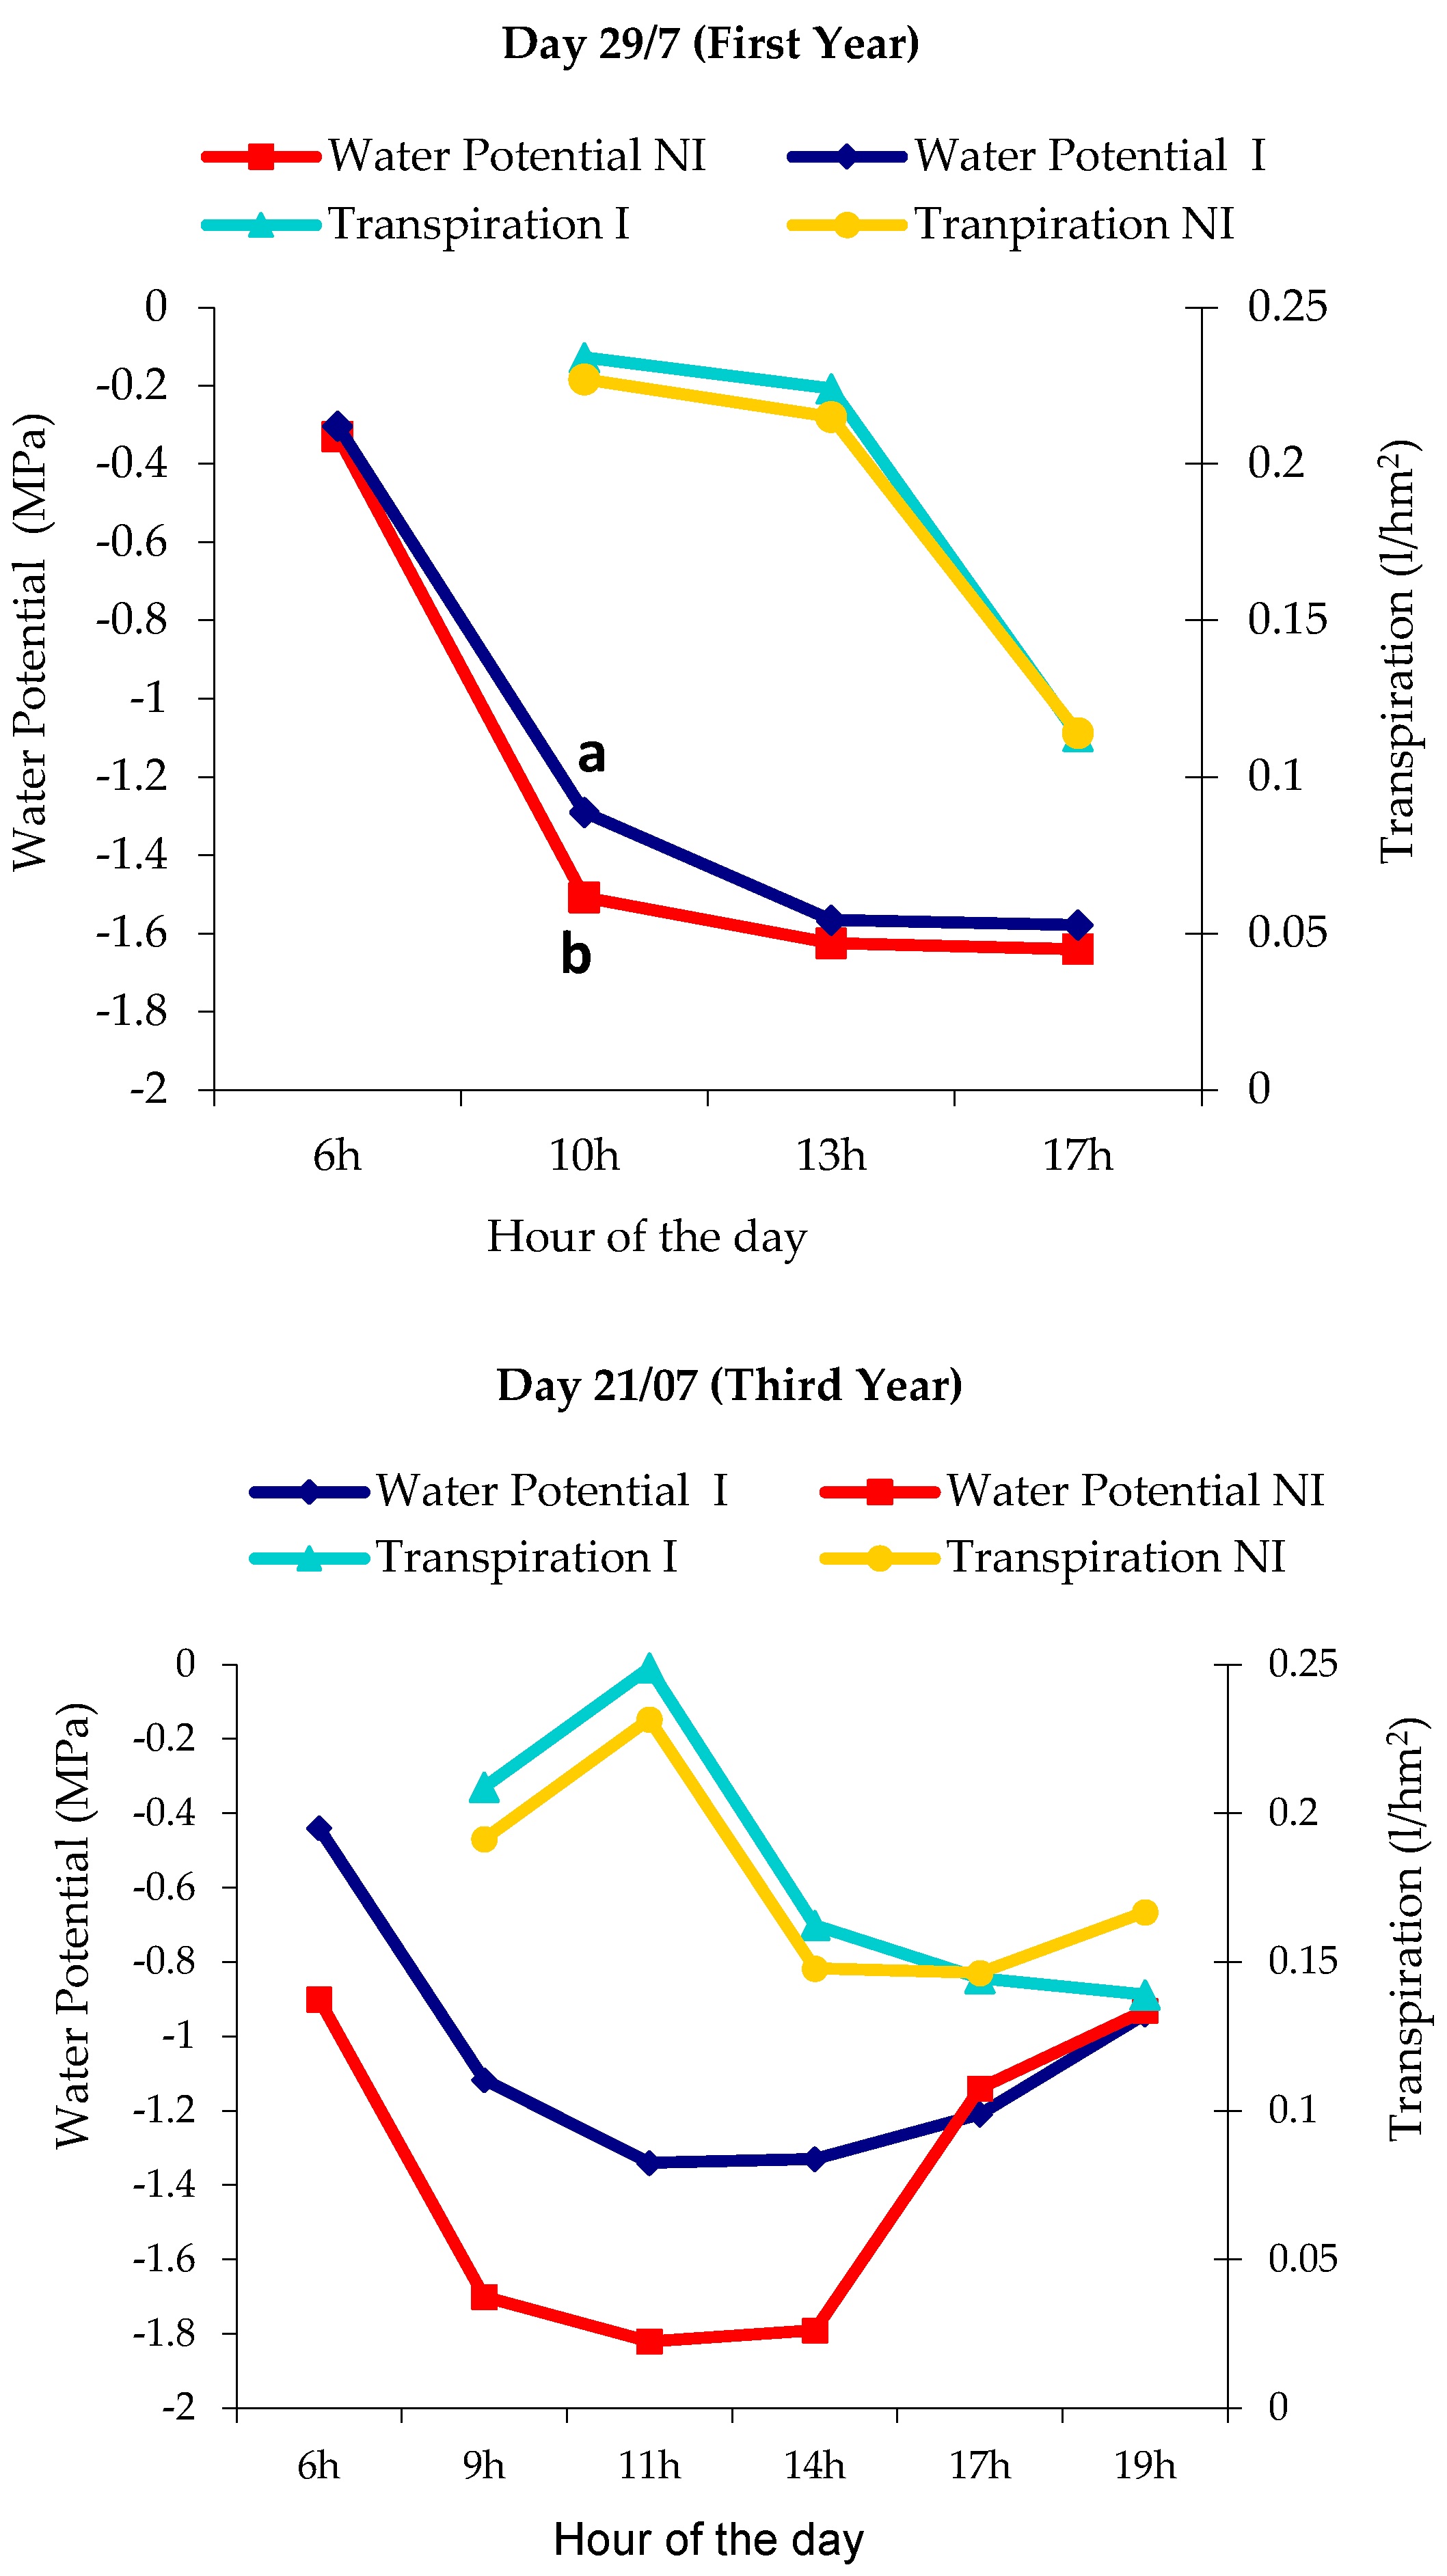
3.3.1. Water Potential
3.3.2. Gas Exchange in Tempranillo
3.3.3. Osmotic Adjustment in Tempranillo and Cabernet Sauvignon: Pressure–Volume Curves
4. Discussion
4.1. Sap Flow
4.2. Crop Coefficient Kc
4.3. Pre-Dawn Water Potential
4.4. Daily Cycle of Water Potential/Transpiration
4.5. Daily Cycle of Water Potential/Photosynthesis
4.6. Pressure–Volume Curves
5. Conclusions
Author Contributions
Funding
Institutional Review Board Statement
Data Availability Statement
Acknowledgments
Conflicts of Interest
References
- Alston, J.M.; Sambucci, O. Grapes in the world economy. In The Grape Genome; Springer: Berlin/Heidelberg, Germany, 2019; pp. 1–24. [Google Scholar]
- Nadal, M.; Lampreave, M. The effects of irrigation on the water relations of the grapevine, yield, grape and wine composition of Tempranillo cv in Mediterranean climate. J. Int. Des Sci. Vigne Du Vin 2004, 38, 75–80. [Google Scholar] [CrossRef]
- Tortosa, I.; Escalona, L.M.E.; Toro, G.; Douthe, C.; Medrano, H. Clonal Behaviour in Response to Soil Water Availability in Tempranillo Grapevine cv: From Plant Growth to Water Use Effciency. Agronomy 2020, 10, 962. [Google Scholar] [CrossRef]
- Williams, L.E.; Mattews, M.A. Grapevine. In Irrigation of Agricultural Crops; Stewart, B.A., Nielsen, D.R., Eds.; American Society of Agronomy, Crop Science Society of America, Soil Science Society of America Publishers: Madison, WI, USA, 1990; pp. 1019–1055. [Google Scholar]
- Williams, L.E. Irrigation of grapevines in California. 12èmes Journees GESCO, (Groupe d’Etudes des Systèmes de Conduite de la Vigne). Gest. De L’eau Dans Le Vign. 2001, 119, 63–74. [Google Scholar]
- Sánchez-Ortiz, A.; Nadal, M.; Lampreave, M.; Mateo-Sanza, J.M. Assessment of colour and tannin extraction in Tempranillo and Caberent-Sauvignon using small-scale fermentation vesses. OENO ONE Open Access 2021, 53, 141–160. [Google Scholar] [CrossRef]
- Droulia, F.; Charalampopoulos, I. Future Climate Change Impacts on European Viticulture: A Review on Recent Scientific Advances. Atmosphere 2021, 12, 495. [Google Scholar] [CrossRef]
- Guiot, J.; Cramer, W. Climate change: The 2015 Paris Agreement thrresholds and Mediterranean basin ecosystems. Scinece 2016, 354, 465–468. [Google Scholar] [CrossRef]
- Sánchez-Ortiz, A.; Mateo-Sanz, J.M.; Nadal, M.; Lampreave, M. Water stress assessment on grapevines by using classification and regression trees. Plant Direct 2021, 5, e00319. [Google Scholar] [CrossRef]
- Climate Change 2014 Mitigation of Climate Change Working Group III Contribution to the Fifth Assessment Report of the Intergovernmental Panel on Climate Change; Chapter 11, Agricuture, Forestry and Oter Land Use (AFOLU); Cambridge University Press: Cambridge, UK; pp. 811–923.
- Vieweg, G.H.; Ziegler, H. Thermoelektrische Registrierung der Geschwindigkeit des Transpirationsstromes. Berichte Dtsch. Bot. Gesellschaf 1960, 73, 221–226. [Google Scholar]
- Daum, C.R. A method for determining water transport in trees. Ecology 1967, 48, 425–431. [Google Scholar] [CrossRef]
- Sakuratani, T. A heat balance for measuring water flow rater in intact plants with the stem heat balance method. J. Agric. Meteor. 1981, 37, 9–17. [Google Scholar] [CrossRef]
- Baker, J.M.; Van Bavel, C.H.M. Measurement of mass flow of water in the stems of herbaceous plants. Plant Cell Environ. 1987, 10, 777–782. [Google Scholar] [CrossRef]
- Sakuratani, T. Improvement of the probe for measuring water flow rate in intact plants with the stem heat balance method. J. Agric. Meteor. 1984, 40, 273–277. [Google Scholar] [CrossRef]
- Steinberg, S.; Cornelius, H.M.; van Bavel McFarland, M.J. A Gauge to Meausure Mass flow Rate of Sap in Stems and Trunks of Woody Plants. J. Am. Soc. Hort. Sci. 1989, 114, 466–472. [Google Scholar] [CrossRef]
- Loveys, B.R. Diurnal changes in water relations and abscisic acid in field-grown Vitis vinifera cultivars. III. The influence of xylem-drived abscisic acid on leaf gas exchange. New Phytol. 1984, 98, 563–573. [Google Scholar] [CrossRef]
- Smart, R.E. Aspects of water relations of the grapevine (Vitis vinifera). Am. J. Enol. Viticult. 1974, 25, 84–91. [Google Scholar] [CrossRef]
- Ollat, N.; Tandonnet, J.P. Effects of two levels of water supply on the photosynthesis and the transpiration of a whole grapevine (Vitis vinifera, cv. Cabernet sauvignon). Acta Hort. 1999, 493, 197–201. [Google Scholar] [CrossRef]
- Prior, L.D.; Grieve, A.M. Water use and irrigation requirements of grapevines. In Proceedings of the 6th Australian Wine Industry Technical Conference, Adelaine, Australia, 14–17 July 1986; Lee, T., Ed.; Australian Industrial Publications: Adelaide, Australia, 1987; pp. 165–168. [Google Scholar]
- Williams, L.E.; Grimes, D.W. Modelling vine growth-development of a data set for a water balance subroutine. In Proceedings of the 6th Australian Wine Industry Technical Conference, Adelaine, Australia, 14–17 July 1986; pp. 169–174. [Google Scholar]
- Chaves, M.; Zarrouk, O.; Francisco, R.; Costa, J.M.; Samtps, T.; Regalado, A.P.; Rodrigues, M.L.; Lopes, C.M. Grapevine underdeficit irrigation: Hints from physiological and molecular data. Am. Bot. 2010, 105, 661–676. [Google Scholar] [CrossRef]
- Gómez del Campo, M.; Ruiz, C.; Sotes, V.; Lissarrague, J.R. Water consumption in grapevines: Influence of leaf area and irrigation. Acta Hort. 1999, 493, 279–286. [Google Scholar] [CrossRef]
- Evans, R.G.; Spayd, S.E.; Wample, R.L.; Kroeger, M.W.; Mahan, M.O. Water use of Vitis vinifera grapes on Washington. Agric. Water Manag. 1993, 23, 109–124. [Google Scholar] [CrossRef]
- Schultz, H.R. Water relations and photosynthetic responses of two grapevine cultivars of different geographical origin during water stress. Acta Hort. 1996, 427, 251–266. [Google Scholar] [CrossRef]
- Tandonnet, J.P.; Ollat, N.; Neveux, M.; Renoux, J.L. Effect of three levels of water supply on the vegetative and reproductive development of Merlot and Cabernet Sauvignon grapevines. Acta Hort. 1999, 493, 301–307. [Google Scholar] [CrossRef]
- Hardie, W.J.; Considine, J.A. Response of grapes to water-deficit stress in particular stages of development. Am. J. Enol. Vitic. 1976, 27, 55–61. [Google Scholar] [CrossRef]
- Araujo, F.J.; Urdaneta, T.; Marin, M.; Williams, L.E. Effects of irrigation regime on photosynthesis and leaf water potential of Vitis vinifera L. (cv. Alphonze lavallé) in Venezuela. Acta Hort. 1999, 493, 219–239. [Google Scholar] [CrossRef]
- Blanco-Cipollone, F.; Lourenço, S.; Silvestre, J.; Conceiçao, N.; Moñini, M.L.; Vivas, A.; Ferreira, M.I. Plant Water Status Indicators for Irigation Scheduling Associated with Iso-and Anisohydric Behaviour: Vine and Plum Trees. Horticulturae 2017, 3, 47. [Google Scholar] [CrossRef]
- Pire, R.; Ojeda, M. Effects of the irrigation regime on water relations of a table grape and two wine grape cultivars in a semiarid region of Venezuela. Acta Hort. 1999, 493, 97–102. [Google Scholar] [CrossRef]
- Rodrigues, M.L.; Santos, T.; Maroco, J.P.; Chaves, M.M.; Lopes, C. Water Potential Gradients in Shoots of Field Grown Grapevines and Mobilization of Photoassimilates to the Cluster Effects of Plant Water Availability. Libro de Comunicaciones, V Simposium Hispano-Portugués de Relaciones Hídricas en las Plantas. 2000. Available online: http://hdl.handle.net/10400.5/23009 (accessed on 25 September 2023).
- Bartolomé, M.C. Respuestas de la vid (V. vinifera L.) a Condiciones de Estrés Hídrico: Efectos Sobre las Relaciones Agua-Planta, el Crecimiento, la Producción y la Calidad. Ph.D. Thesis, Universidad Politecnica de Madrid, Madrid, Spain, 1993. [Google Scholar]
- García-Escudero, E.; López, R.; Santamaría, P.; Zaballa, O.; Arroyo, M.C. Ensayo de riego localizado en viñedos productivos cv. Tempranillo. Vitic./Enol. Prof. 1997, 50, 35–47. [Google Scholar]
- Düring, H.; Scienza, A. Drought resistance of some Vitis species and cultivars. In Proceedings of the 3rd International Symposium on Grape Breeding, Davis, CA, USA, 15–18 June 1980; pp. 179–190. [Google Scholar]
- Buesa, I.; Escalona, J.M.; Tortosa, I.; Marín, D.; Loidi, M.; Santesteban, L.G.; Douthe Cyril Medrano, H. Intracultivar genetic diversity in grapevine: Water use efficiency variability within cv. Grenache. Physiol. Plant. 2021, 173, 2226–2237. [Google Scholar] [CrossRef]
- Barceló, J.M.; Escalona, J.M.; Flexas, J.; Gulías, J.; Savé, R.; Medrano, H. Relaciones hídricas y respuesta a la sequía en dos cultivares de vid. Actas Del IV Simp. Hisp.-Port. De Relac. Hídricas En Las Plantas Múrcia 1998, 4, 61–64. [Google Scholar]
- Turner, N.C.; Jones, M.M. Turgor maintenance by osmotic adjustment: A review and evaluation. In Adaptation of Plants to Water and High Temperature Stress; Turner, N.C., Kramer, I.P.J., Eds.; Wiley and Sons: New York, NY, USA; pp. 87–103.
- Düring, H. Evidence for osmotic adjustment to drought on grapevines (Vitis vinifera L.). Vitis 1984, 23, 1–10. [Google Scholar]
- Düring, H. Osmotic adjustment in grapevines. Acta Hortic. 1985, 171, 315–322. [Google Scholar] [CrossRef]
- Turner, N.C.; Stern, W.R.; Evans, P. Water Relations and Osmotic Adjustment of leaves and Roots of Lupins in Response to Water Deficits. Crop Sci. 1987, 27, 977–983. [Google Scholar] [CrossRef]
- Rodrigues, M.L.; Chaves, M.M.; Wendler, R.; David, M.M.; Quick, W.P.; Leegood, R.C.; Stitt, M.; Pereira, J.S. Osmotic adjustment in water stressed grapevine leaves in relation to carbon assimilation. Aust. J. Plant Physiol. 1993, 20, 309–321. [Google Scholar] [CrossRef]
- Patakas, A.; Noitsakis, B. Cell Wall Elasticity as a Mechanism to Maintain Favorable Water Relations During Leaf Ontogeny in Grapevines. Am. J. Enol. Vitic. 1997, 48, 352–356. [Google Scholar] [CrossRef]
- Godoy, C.; Huitron, M.V. Relaciones hídricas internas de ocho cultivares de vid (Vitis vinifera L.) I. Osmoregulación o ajuste osmótico. ITEA 1995, 91V, 55–62. [Google Scholar]
- Vandeleur, R.K.; Mayo, G.; Shelden, M.C.; Gilliham, M.; Kaiser, B.N.; Tyerman, S.D. The role of plasma membrane intrinsic protein aquaporins in water transport through roots: Diurnal and drought stress responses reveal different strategies between isohydric and anisohydric cultivars of grapevine. Plant Physiol. 2009, 149, 445–460. [Google Scholar] [CrossRef] [PubMed]
- Chaves, M.M.; Flexas, J.; Pinheiro, C. Photosynthesis under drought and salt stress: Regulation mechanisms from whole plant to cell. Ann. Bot. 2009, 103, 551–560. [Google Scholar] [CrossRef]
- Hugalde, I.P.; Vila, H.F. Comportamiento isohídrico o anisohídrico en vides.¿Una controversia sin fin? Argent. RIA 2014, 40, 75–82. [Google Scholar]
- Schultz, H.R. Differences in hydraulic architecture account for near isohydric and anisohydric bahaviour of two fied rown Vitis vinifera L. cultivars during drought. Plant Cell Environ. 2003, 26, 1393–1405. [Google Scholar] [CrossRef]
- Hochberg, U.; Degu, A.; Fait, A.; Rachmilevitch, S. Near isohydric grapevine cultivar displays higher photosynthetic efficiency and photorespiration rates under drought stress as compared with near anisohydric grapevine cultivar. Physiol. Plant. 2012, 147, 443–452. [Google Scholar] [CrossRef]
- Tardieu, F.; Lafarge, T.; Simonneau, T. Stomatal control by fed or endogenous xylem ABA in sunflower. Plant Cell Environ. 1996, 19, 75–84. [Google Scholar] [CrossRef]
- Sade, N.; Gebremedhin, A.; Moshelion, M. Risk taking plants. Anisohydric behaviour as a stress resistance trait. Plant Signal. Behav. 2012, 7, 767–770. [Google Scholar] [CrossRef] [PubMed]
- Sipiora, M.J. Viñas de Cabernet Sauvignon. Comportamiento agronómico (I). Comportamiento agronómico. Vitivinicultura 1996, 74–75, 43–46. [Google Scholar]
- Carbonneau, A.; Casteran, P. Irrigation-depressing effect on floral initiation of Cabernet Sauvignon grapevines in Bordeaux area. Am. J. Enol. Vitic. 1979, 30, 3–7. [Google Scholar] [CrossRef]
- Lampreave, M.; Mateos, S.; Valls, J.; Nadal, M.; Sánchez-Ortiz, A. Carbonated Irrigation Assessment of Grapevine Growth, Nutrient Absorption, and Sugar Accumulation in a Tempranillo (Vitis vinifera L.) Vineyard. Agriculture 2022, 12, 792. [Google Scholar] [CrossRef]
- Doorenbos, J.Y.; Pruitt, W.O. Crop water requirements. In FAO Estudio de Riego y Drenaje No. 24, (Rev.); Organización de las Naciones Unidas para la Agricultura y la Alimentación: Rome, Italy, 1977; 144p. [Google Scholar]
- Scholander, P.; Bradstreet, E.; Hemmingsen, E.; Hammel, H. Sap pressure in Vascular Plants: Negative hydrostatic pressure can be measured in plants. Science 1965, 148, 339–346. [Google Scholar] [CrossRef]
- Lampreave, M. Fisiologia de L’absorció en L’ecosistema Vitícola Sòl-Planta-Atmosfera i Repercussions en la Qualitat del Raïm. Ph.D. Thesis, Department of Bioquímica i Biotecnologia, URV, Tarragona, Spain, 2002; p. 33. [Google Scholar]
- Eastham, J.; Gray, S.A. A Preliminary Evaluation of the Suitability of Sap Flow Sensors for Use in Scheduling Vineyard Irrigation. Am. J. Enol. Vitic. 1998, 49, 171–176. [Google Scholar] [CrossRef]
- Escalona, J.M.; Gulías, J.; Medrano, H. Daily and seasonal Sap Flow (SHB) in irrigated and non-irrigated tempranillo grapevines. Gesco 1999, 1, 316–322. [Google Scholar]
- Schmid, J.; Braun, P. Transpiration of grapevines in the field. Acta Hort. 1997, 449, 475–479. [Google Scholar] [CrossRef]
- Ginestar, J.C.; Eastham, S.; Gray, P. Iland. Use of Sap-Flow Sensors to Schedule Vineyard Irrigation. I. Effects of Post-Veraison Water Deficits on Water Relations, Vine Growth, and Yield of Shiraz Grapevines. Am. J. Enol. Vitic. 1998, 49, 413–420. [Google Scholar] [CrossRef]
- Lascano, R.J.; Baumhardt, R.L.; Lipe, W.N. Meausurement of Water Flow in Young Grapevines Using the Stem Heat Balance Method. Am. J. Enol. Vitic. 1992, 43, 159–165. [Google Scholar] [CrossRef]
- Evans, R.G.; Spayd, S.E.; Wample, R.L.; Kroeger, M.W. Water requirements of Vitis vinifera grapes. In Proceedings of the Third National Irrigation Symposium, Phoenix, AZ, USA, 28 October–1 November 1990; pp. 154–161. [Google Scholar]
- Cienciala, E.; Lindroth, A.; Cermák, J.; Hällgren, J.H.; Kucera, J. The effects of water availability on transpirations, water potential and growth of Picea abies during a growing season. J. Hydrol. 1994, 155, 57–71. [Google Scholar] [CrossRef]
- Ibrahim, A.; Collesano, G.; Williams, L. The effect of rootstock and applied dwater on vine water status and gas exchange of Cabernet Sauvignon. Acta Hortic. 2000, 526, 163–167. [Google Scholar]
- Grimes, D.W.; Williams, L.E. Irrigation Effects on Plant Water Relations and Productivity of Thompson Seedless Grapevines. Crop Ecol. Prod. Manag. 1990, 30, 255–260. [Google Scholar] [CrossRef]
- Macha, L.A.; Uriarte, D.; Valdés, E.; Moreno, D.; del Henar, M. Effects of Regulated Deficit Irrigation and Early Cluster Thinning on Production and Quality Parameters in a Vineyard cv. Tempranillo under Semi-Arid. Agronomy 2021, 11, 34. [Google Scholar] [CrossRef]
- Zwack, J.; Graves, W.R.; Townsend, A.M. Leaf Water Relations and Plant Development of Three Freeman Maple Cultivars Subjected to Drought. J. Am. Soc. Hort. Sci. 1998, 123, 371–375. [Google Scholar] [CrossRef]
- Carbonneau, A. Gestion de l’eau dans le vignoble: Theorie et pratique. 12èmes Journees GESCO, (Groupe d’Etudes des Systèmes de Conduite de la Vigne). Gest. De L’eau Dans Le Vign. 2001, 119, 43–48. [Google Scholar]
- Zaballa, O.; García-Escudero, E. Efecte del Riego Localizado Sobre el Estado Hídrico de la vid; Reunión del Grupo de Trabajo de Experimentación en Viticultura y Enologia del INDO: Laguardia, Spain, 1998. [Google Scholar]
- Naor, A.; Wample, R.L. Gas exchange and water relations of field-grown Concord (Vitis labruscana Bailey) grapevines. Am. J. Enol. Vitic. 1994, 45, 333–337. [Google Scholar] [CrossRef]
- Naor, A.; Bravdo, B.A.; Gelobter, J. Gas Exchange and Water Relations in Field-Grown Sauvignon Blanc Grapevines. Am. J. Enol. Vitic. 1994, 45, 423–428. [Google Scholar] [CrossRef]
- Schultz, H.R. Physiological mechanisms of water use efficiency in grapevines under drought conditions. Acta Hortic. V Int. Symp. Grapevine Physiol. 2000, 526, 115–136. [Google Scholar] [CrossRef]
- Schultz, H.R.; Matthews, M.A. Growth, Osmotic Adjustment, and Cell-Wall Mechanics of Expanding Grape Leaves during Water Deficits. Crop Sci. 1993, 33, 287–294. [Google Scholar] [CrossRef]
- Romero Azorín, P.; García García, J. The Productive, Economic, and Social Efficiency of Vineyards Using Combined Drought-Tolerant Rootstocks and Efficient Low Water Volume Deficit Irrigation Techniques under Mediterranean Semiarid Conditions. Sustainability 2020, 12, 1930. [Google Scholar] [CrossRef]


| T °C (max) | T °C (min) | Radiation (MJd−1) | ET0 (mm) | Rainfall (mm) | Tempranillo Harvest Date | Cabernet Sauvignon Harvest Date | |
|---|---|---|---|---|---|---|---|
| 1st Year | 3 September | 16 September | |||||
| Spring (March–June) | 91 | ||||||
| June | 26.4 | 16.1 | 23.4 | 133.0 | 3 | ||
| July | 29.5 | 16.0 | 24.8 | 10.3 | 0 | ||
| August | 29.6 | 18.3 | 20.4 | 144.9 | 66 | ||
| September | 26.0 | 16.5 | 15.1 | 97.1 | 59 | ||
| Cycle (from harvest to harvest) | 487 | 486 | |||||
| Yearly accumulation | 982 | 395 | |||||
| 2nd Year | 1 September | 21 September | |||||
| Spring (March–June) | 159 | ||||||
| June | 25.4 | 15.7 | 21.3 | 120.3 | 13 | ||
| July | 28.6 | 18.6 | 22.8 | 146.4 | 37 | ||
| August | 29.6 | 20.6 | 18.3 | 129.8 | 11 | ||
| September | 26.8 | 16.2 | 15.3 | 70.0 | 63 | ||
| Cycle (from harvest to harvest) | 394 | 462 | |||||
| Yearly accumulation | 1002 | 372 | |||||
| 3rd Year | 14 September | 26 September | |||||
| Spring (March–June) | 149 | ||||||
| June | 27.1 | 17.5 | 142.5 | 38 | |||
| July | 29.5 | 19.8 | 141.3 | 2 | |||
| August | 30.4 | 20.2 | 152.4 | 12.5 | |||
| September | 27 | 17.6 | 87.4 | 51 | |||
| Cycle (from harvest to harvest) | 305 | 303 | |||||
| Yearly accumulation | 913 | 447 |
| Transpiration (T) (mm) | Evaporated Soil Water (E) (mm) | ET0 (mm) | Ratio E/ET0 | Ratio T/ET0 | ||
|---|---|---|---|---|---|---|
| First Year | I | 62.5 a | 290.8 b | 353.3 | 0.8 | 0.2 |
| NI | 42.7 b | 310.6 a | 353.3 | 0.9 | 0.1 | |
| Second Year | I | 68.1 a | 247.0 a | 315.0 | 0.8 | 0.2 |
| NI | 61.0 b | 254.0 a | 315.0 | 0.8 | 0.2 |
| 6 h | 10 h | 13 h | 17 h | |||||
|---|---|---|---|---|---|---|---|---|
| NI | I | NI | I | NI | I | NI | I | |
| Intrinsic efficiency of water use (EAU) | 32.61 ± 3.24 | 35.62 ± 4.12 | 45.34 ± 2.15 b | 34.5 ± 3.87 a | 51.12 ± 7.08 b | 42.75 ± 3.98 b | ||
| Stomatal conductance (μmol/m2s) (g) | 490 ± 8.74 | 480 ± 9.15 | 320 ± 20.14 b | 420 ± 12.6 a | 170 ± 8.74 a | 250 ± 11.05 b | ||
| Transpiration (l/hm2) (E) | 0.227 ± 0.13 | 0.236 ± 0.18 | 0.216 ± 0.09 | 0.25 ± 0.11 | 0.11 ± 0.04 | 0.13 ± 0.05 | ||
| Water potential (MPa) | −0.30 ± 0.08 | −0.26 ± 0.06 | −1.22 ± 0.07 b | −1.37 ± 0.06 a | −1.57 ± 0.01 a | −1.45 ± 0.02 b | −1.58 ± 0.03 a | −1.43 ± 0.02 b |
| Assimilation of CO2 (A) (μmol/m2s) | 15.32 ± 1.22 | 16.02 ± 1.87 | 13.03 ± 0.58 | 13.24 ± 0.45 | 8.08 ± 0.06 a | 9.99 ± 0.04 b | ||
| Variety | Tempranillo | Cabernet Sauvignon | ||
|---|---|---|---|---|
| Treatment | I | NI | I | NI |
| γπ100 (MPa) | 0.481 ± 1.81 | 0.462 ± 1.34 | 0.131 ± 0.07 a | 0.083 ± 0.01 b |
| γπ0 (MPa) | 0.781 ± 0.21 | 0.800 ± 0.12 | 0.156 ± 0.05 | 0.132 ± 0.04 |
| CHR0 (%) | 69 ± 5.24 | 66 ± 4.06 | 79 ± 5.55 | 74 ± 6.81 |
| ε | 2.9 ± 1.07 a | 1.8 ± 1.11 b | 4.84 ± 1.71 | 3.21 ± 1.87 |
| γH0 (MPa) | −1.4 ± 0.71 | −0.78 ± 0.88 | −1.56 ± 0.66 | −1.33 ± 0.40 |
Disclaimer/Publisher’s Note: The statements, opinions and data contained in all publications are solely those of the individual author(s) and contributor(s) and not of MDPI and/or the editor(s). MDPI and/or the editor(s) disclaim responsibility for any injury to people or property resulting from any ideas, methods, instructions or products referred to in the content. |
© 2024 by the authors. Licensee MDPI, Basel, Switzerland. This article is an open access article distributed under the terms and conditions of the Creative Commons Attribution (CC BY) license (https://creativecommons.org/licenses/by/4.0/).
Share and Cite
Sánchez-Ortiz, A.; Lampreave, M.; Mateos, M.A. Addressing Water Stress and Climate Variability in the Mediterranean: Study of Regulated Deficit Irrigation (RDI) and Non-Irrigation (NI) in Tempranillo and Cabernet Sauvignon (Vitis vinifera L.). Agriculture 2024, 14, 129. https://doi.org/10.3390/agriculture14010129
Sánchez-Ortiz A, Lampreave M, Mateos MA. Addressing Water Stress and Climate Variability in the Mediterranean: Study of Regulated Deficit Irrigation (RDI) and Non-Irrigation (NI) in Tempranillo and Cabernet Sauvignon (Vitis vinifera L.). Agriculture. 2024; 14(1):129. https://doi.org/10.3390/agriculture14010129
Chicago/Turabian StyleSánchez-Ortiz, Antoni, Miriam Lampreave, and Maria Assumpta Mateos. 2024. "Addressing Water Stress and Climate Variability in the Mediterranean: Study of Regulated Deficit Irrigation (RDI) and Non-Irrigation (NI) in Tempranillo and Cabernet Sauvignon (Vitis vinifera L.)" Agriculture 14, no. 1: 129. https://doi.org/10.3390/agriculture14010129
APA StyleSánchez-Ortiz, A., Lampreave, M., & Mateos, M. A. (2024). Addressing Water Stress and Climate Variability in the Mediterranean: Study of Regulated Deficit Irrigation (RDI) and Non-Irrigation (NI) in Tempranillo and Cabernet Sauvignon (Vitis vinifera L.). Agriculture, 14(1), 129. https://doi.org/10.3390/agriculture14010129