Abstract
Automatic weight detection is an essential step in the factory production of Pleurotus eryngii. In this study, a data set containing 1154 Pleurotus eryngii images was created, and then machine vision technology was used to extract eight two-dimensional features from the images. Because the fruiting bodies of Pleurotus eryngii have different shapes, these features were less correlated with weight. This paper proposed a multidimensional feature derivation method and an Attention-Based CNN model to solve this problem. This study aimed to realize the traditional feature screening task by deep learning algorithms and built an estimation model. Compared with different regression algorithms, the R2, RMSE, MAE, and MAPE of the Attention-Based CNN were 0.971, 7.77, 5.69, and 5.87%, respectively, and showed the best performance. Therefore, it can be used as an accurate, objective, and effective method for automatic weight measurements of Pleurotus eryngii.
1. Introduction
Pleurotus eryngii (king oyster mushroom) is an edible mushroom of excellent quality, rich in various plant proteins, amino acids, and polysaccharides [1,2]. In the production of Pleurotus eryngii, a variety of agricultural wastes could also be used as a culture medium, which proved the green sustainability of Pleurotus eryngii production. As the largest producer and consumer of edible mushrooms in the world, China still relies on the manual weighing method to obtain the weight of Pleurotus eryngii, which cannot meet the demand of automated production [3].
In recent years, the use of machine vision to predict the weight of agricultural products has been frequently reported [4,5,6,7,8]. The research methods used in these studies and their advantages and disadvantages are shown in Table 1. As shown in Table 1, the idea of using machine vision technology to obtain the shape size of agricultural products and then build a model to predict the weight was relatively mature, but there was still blank research on the weight prediction of mushrooms with more special shapes. Now, an efficient and convenient machine vision method is urgently needed to weigh Pleurotus eryngii.

Table 1.
The advantages and disadvantages of different research in agricultural weight prediction.
In forming primordia and then differentiating into mushroom buds, the mycelia of Pleurotus eryngii is influenced by multiple factors such as illumination, so the formation rate and differentiation rate of primordia are different, and the morphology is different among fruiting bodies [9,10,11]. Given this characteristic, predicting the weight of Pleurotus eryngii requires higher dimensional characteristics to fit the morphology of Pleurotus eryngii. In the regression estimation task, there is a higher proportion of abnormal data at the sample level and the feature level of the fungi with morphological differences. For this problem, manual feature engineering was very difficult and the results may not be satisfactory.
Designing good features for machine learning models, known as feature engineering, is one of the most important tasks in data analysis [12]. According to the differences between feature engineering and modeling methods, relevant research could be divided according to Table 2.
Table 2.
The advantages and disadvantages of different research directions based on feature engineering and modeling algorithms.
Early studies [4] and some studies [13] required strong interpretability belonging to category (1). The selection of features in these studies were very strict, and the mathematical modeling methods were also very scientific and strongly interpretable. However, more studies [5,14,15] belong to category (2), which used modeling methods of machine learning, such as support vector machines, BP neural networks, random forests, etc. The common advantages and disadvantages of these two categories were interpretability but need strongly experiential and complex work.
The disadvantages of manual feature engineering are that it requires a large workload of manual feature selection and feature analysis, relies on personal experience, and only uses features with strong correlation [16]. It needed to judge what features the model needs, limiting the choice of features. The development direction of artificial intelligence is to hand over various tasks in practical problems to computers as much as possible [17,18]. It is an essential direction of related research to delegate the tasks of feature mining and feature screening in traditional feature engineering to deep learning algorithms [19]. This method is widely used in popular research fields with more complex features, such as economics [20,21], medicine [22], and electronic information field [23,24]. These studies using artificial intelligence methods for automated feature engineering all belong to category (3). Apart from the need for high-performance computing, there are basically no disadvantages. Its principle of action can also be deduced and explained on the basis of certain mathematical theories. According to the error backpropagation algorithm in deep learning theory, the weight of the network was updated, and better features were automatically selected to give higher weights during the training process of the neural network. This method was completely more reliable and efficient than manual feature analysis, avoiding cumbersome verification and analysis, and could also have better results.
Therefore, this paper proposed a feature derivation and screening method based on this idea. Based on feature derivation and feature combination, a small number of original features were power-derived and cross-combined to enrich features in an extensive range. On this basis, a convolutional neural network with an attention mechanism was designed to automatically screen and use excellent features. The attention mechanism could help the convolutional neural network to complete this task, fit the relationship between appearance size and weight of Pleurotus eryngii within the range of multidimensional features, and establish a weight estimation model. Automatic weight measurement of Pleurotus eryngii was realized by artificial intelligence method to promote the industrialization of Pleurotus eryngii production. This method had a good application prospect for bulk or weight prediction of most agricultural products.
2. Materials and Methods
2.1. Pleurotus eryngii Sample and Image Collection
All the samples used in this study were fresh Pleurotus eryngii, obtained on the same day in a supermarket (Nanjing, China), with different shapes and sizes and no apparent defects or damage to the appearance. The Pleurotus eryngii was stored in a refrigerator at 4 °C before image collection, and all image collections were completed during the same period. The total samples of Pleurotus eryngii contained 1154 Pleurotus eryngii with weights ranging from 15 to 265 g, which was sufficiently representative in the weight range. The Pleurotus eryngii was weighed by a calibrated electronic scale (JCS-600, Kaifeng Group Co., Ltd., Jinhua, China) with a maximum range of 600 g and a dividing value of 0.01 g.
CMOS camera (MV-CE120-10GC, Hangzhou Haikang Robot Technology Co., Ltd., Hangzhou, China) was used for image acquisition. The lens distance of the camera was 0.75 m from the measured object, and the complete image of Pleurotus eryngii (4024 × 3036 pixels) was collected under the appropriate field of view (FOV). The scale of Pleurotus eryngii is obtained by the conversion of the actual size and the pixel size. The conversion relationship between the actual size (cm) and the pixel size (px) is 1:178.
The image processing algorithms and machine learning algorithms were performed on Python 3.10 using the open-source computer vision library OpenCV 4.5.4, the machine learning toolbox scikit-learn 1.1.2, and the neural network toolbox PyTorch 1.2.0 (CUDA version 11.6). All programs were run on a computer equipped with AMD Ryzen 7-5800H CPU 3.20 GHz, NVIDIA GeForce RTX 3060 Laptop GPU 6 GB, 16 GB RAM, and Windows 10 operating system.
2.2. Image Processing and Feature Extraction
Image processing aimed to segment the background and object regions and extract the region of Interest (ROI) to obtain the two-dimensional features of Pleurotus eryngii [25]. The features included the contour and size information of different parts of Pleurotus eryngii. The commercially available Pleurotus eryngii was the fruiting body part of Pleurotus eryngii, including pileus and stipe. The pileus and stipe were essentially the same, and the stipe was the main part, so the pileus part was not analyzed separately.
Images’ fuzzy semantic information took much work to apply to regression prediction tasks directly. Therefore, eight original features with actual physical significance were extracted by using image processing technology, including the projection area (), contour perimeter (C), area of the minimum bounding rectangle (), width (W), length (L), and n diameters (dn). Diameters were selected according to a theory of slice method [6], and the larger n was, the more detailed the expression of the volume of Pleurotus eryngii would be. Considering the number of parameters and the change in Pleurotus eryngii’s diameter, the shape of Pleurotus eryngii would be better reflected when n = 3 was selected [5].
The image processing process included the following steps, and the output image of each step was shown in Figure 1: (1) Read the original image of Pleurotus eryngii; (2) Convert to grayscale image; (3) After Gaussian filtering, edge detection algorithm Canny [26] was used to solving edge gradient information; (4) Obtain the whole contour and close edge after morphological processing and hole filling; (5) Draw the minimum bounding rectangle (MBR); (6) The MBR was divided into four equal parts by three line segments along the long edge, and the three diameters of Pleurotus eryngii was calculated with the help of the intersection points between these line segments and the contour edge.
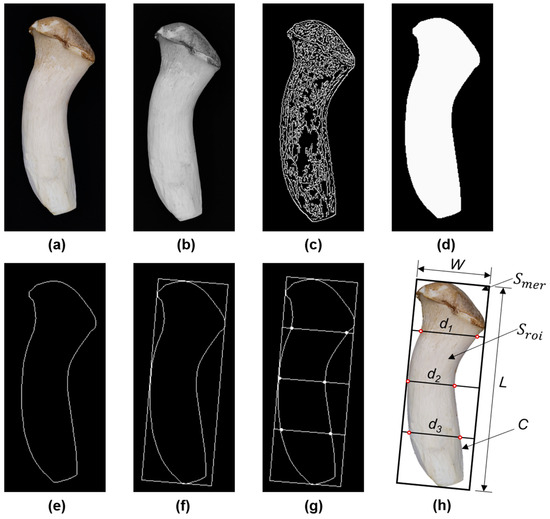
Figure 1.
The output of each step in processing the Pleurotus eryngii image: (a). Original image (1 cm:178 px); (b). Grayscale image; (c). Gradient edge image; (d). Binary image; (e). Contour edge; (f). Minimum enclosing rectangle; (g). Schematic diagram of the diameter acquisition method; (h). Schematic diagram of the features of Pleurotus eryngii.
2.3. Mu Ltidimensional Feature Matrices
The purpose of feature combination was to mine the possible special relationships between features. This study proposed a multidimensional feature creation method, which created new features with actual scene significance based on original features through feature derivation and feature combination, enriched the original sample information, improved the upper limit of sample prediction ability, and obtained higher prediction accuracy. These features needed to be combined into a matrix form to satisfy the input form of the convolutional neural network.
2.3.1. Summarize the Rules of Multidimensional Features
According to the ideal model method, Pleurotus eryngii was regarded as a cylinder to calculate, and the ideal volume (V) of Pleurotus eryngii was calculated by Equation (1). Compared with length, width, and height, shape features had richer semantic information than these size features. Circularity (E) was calculated by Equation (2), circumferential diameter ratio (e) was calculated by Equation (3), rectangularity (R) was calculated by Equation (4), and aspect ratio (r) was calculated by Equation (5). These shape features could better describe the shape of the contour. All the above features were multidimensional features generated by combining original features.
The above multidimensional features frequently used in agricultural and forestry research [27,28] could be summarized in the form of Equation (6), where a and b are original features, k1 and k2 represent different powers, and c is a constant. According to this rule, the derivation of multidimensional features could be carried out in a wide range.
2.3.2. Feature Combination Method
The 8 size features (, C, L, W, d1, d2, and d3) with actual physical significance obtained by image processing were derived by ±1, ±2 power. All the results were spliced to form a column vector containing 32 elements. The column vector and its transpose vector were multiplied to obtain a 32 × 32 feature combination matrix. The process is shown in Equation (7). The matrix contained size features and shape features of different dimensions. All elements in the matrix satisfied the combination form expressed by Equation (6) and were multidimensional features derived from the original features. The multidimensional features described the irregular morphology of Pleurotus eryngii from different specific perspectives, which enriched the morphological description of a single Pleurotus eryngii sample.
The establishment process from the original features to the multidimensional feature matrix is shown in Figure 2. Through this method, new features could be derived and combined as much as possible to form a matrix form, which was in line with the input form of CNN.
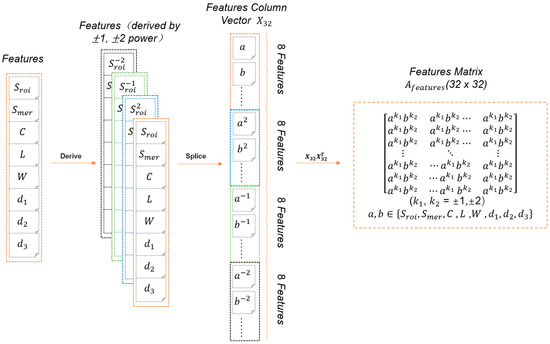
Figure 2.
Multidimensional feature matrix establishment process.
The basic design of CNN restricts the ability to model only local information well [29]. The feature matrix was sorted manually, and this arrangement has nothing to do with the shape of Pleurotus eryngii. Artificial local information would mislead the training of CNN. Therefore, 8 random number sequences generated by 8 random seeds were used as indexes, the feature combination matrix’s feature elements were shuffled, and a feature matrix group with 8 channels was merged as the final input form.
2.4. Attention-Based CNN
Convolutional neural networks are built upon the convolution operation, which extracts informative features by fusing spatial and channel-wise information together within local receptive fields [30]. The convolution kernel is usually regarded as an information aggregate containing spatial information and channel-wise information in the local receptive field. In this study, a convolutional neural network with an attention module was designed and applied to the weight estimation task of Pleurotus eryngii, called Attention-Based CNN.
2.4.1. Purpose of the Convolution Operation
In the neural network, the features of Pleurotus eryngii are only used as a numerical value in the feature matrix. Features in a convolutional neural network are higher dimensional features obtained by the convolution operation of the screening and combination of multidimensional features of Pleurotus eryngii. In this study, the spatial and channel-wise information corresponded to the position of elements and the relationship between elements in the feature matrix of Pleurotus eryngii, respectively. The purpose was to explore the special relationship between the position of each element in the matrix and the value through the convolution operation and learn the local optimal description of the weight of Pleurotus eryngii from the multidimensional feature matrix.
2.4.2. Attention Module and Its Working Principle
As an input selection mechanism, the function of the attention mechanism is to achieve the weighted selection process of output results to multiple input variables and find the most relevant input to the current output [31]. The principle of the attention mechanism in the convolutional neural network is to make the model pay attention to more helpful information by using channel information and spatial information of feature maps in the process of convolution to assist the neural network in the learning process of task targets.
CBAM (Convolutional Block Attention Module) is a lightweight attention module that performs attention operations in spatial and channel dimensions [32]. As shown in Figure 3, the whole attention module was divided into two steps: (1) Channel Attention: The channel dimension was unchanged, and the spatial dimension was compressed. This step focused on the meaningful information in the input. (2) Spatial Attention: The spatial dimension was unchanged, and the channel dimension was compressed. This step focused on the location information of the features.
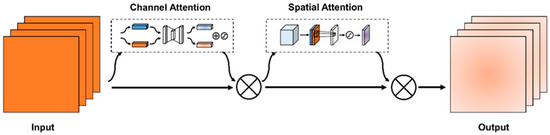
Figure 3.
CBAM (Convolutional Block Attention Module).
2.4.3. Design of Attention-Based CNN
Networks such as VGG [33] and ResNet [34] connect pooling and activation layers with convolutional layers. The pooling layer completes the down-sampling task, increases the invariance of the network to translation, and improves the network’s generalization in classification and detection tasks. Activation layers often provide nonlinear activations to the network. All the above designs are designed for image tasks, which will result in excessive information being discarded when applied to the task of this study. Therefore, the pooling layers must be abandoned in the convolutional neural network’s main structure design for this research task. The convolution layers with a step size of 2 were used to realize down-sampling. At the same time, the use of the activation layers was reduced to avoid the high complexity of the model, which leads to overfitting.
The network structure is shown in Figure 4; a CBAM module was connected after every two convolutional layers, and the first convolutional layer in each 2 layers had a step size of 2 to realize down-sampling. At the same time, the convolution kernel was 2 times the number of input channels to reduce information loss. The second convolutional layer had a step size of 1 in each 2 layers. The padding of different convolutional layers was designed to be a specific number, which could not change the size of the matrix. For example, the padding of the 3 × 3 convolution operation was 1. In the initial convolution layer, the design of 7 × 7 convolution kernels was used, and then a convolution layer with 1 × 1 convolution kernels was connected. The purpose of using a 7 × 7 convolution kernel was to increase the effective receptive field when the neural network was initialized. The 1 × 1 convolution kernel was to realize the information interaction between each channel and provided a certain nonlinear influence for the model. The other four convolutional layers were all designed with the specification of 3 × 3 convolution kernels. The input multidimensional feature matrix needed to be convolved 6 times and down-sampled 3 times. After that, all channels of the output were flattened and passed into the fully connected part of the neural network. The fully connected part had a LeakyReLU layer between the two fully connected layers as the activation layer, and the neural network finally outputs a prediction value.
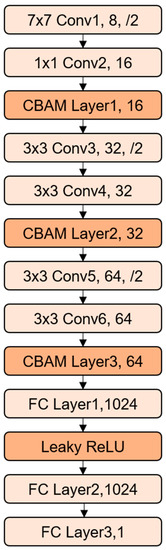
Figure 4.
The network structure of Attention-Based CNN.
2.5. Data Processing and Model Training
2.5.1. Data Standardization
There are significant numerical differences between features of different dimensions and different meanings. To improve the accuracy and convergence speed of the model, it is necessary to standardize the features. Z-Score standardization is a common method for data processing. The data of different magnitudes are transformed into Z-Score values of a unified measure to ensure the comparability between the data. Z-Score standardizes the features of each position in the multidimensional feature matrix through Equation (8), where μ is the mean value of the overall sample, σ is the standard deviation of the overall sample, and x is the measured value of the individual.
In the multidimensional feature matrix, each element corresponds to a different feature of the same sample. Normalization is performed between different samples for the same feature, rather than within the matrix as the image processing tasks.
2.5.2. Model Training
The dataset contained 1154 Pleurotus eryngii image samples, and 8 two-dimensional features (, C, L, W, d1, d2, and d3) of each image were extracted by image processing. A weight label was obtained by manual weighing. The 8 two-dimensional features of each sample were used to establish a matrix group (8 × 32 × 32) as the input of model training according to the feature matrix establishment method in Section 2.3.2. In the whole data set, 80% of samples were randomly selected as the training set and 20% as the test set. The training set contained 925 samples, and the test set contained 229 samples.
It is challenging to collect agricultural data sets, so the data sets are generally small. To ensure the training results and better use the training set data, the training set was randomly divided into 5 equal parts and trained by K-fold cross-validation (K = 5). In each training, one was used as the validation set (containing 185 samples), and the rest were used as the training set (containing 740 samples) for this training. The model with the best validation sets work results was selected as the final prediction model.
In the training process, the mean square error (MSE) was used as the loss function, the Adam algorithm was used as the optimizer, the learning rate was set to 3 × 10⁻⁵ the epoch was set to 64, and the batch size of the training set was set to 64. The visual training process of the model is shown in Figure 5.
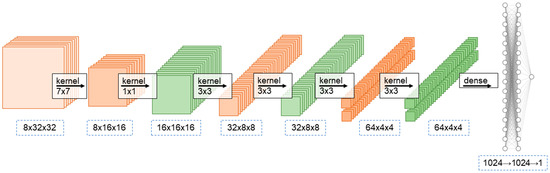
Figure 5.
Visualize model training.
2.6. Other Modeling Algorithms
The neural network method, support vector regression method, tree regression method, and KNN method were used to fit the original features. The models established by these methods were compared with the models shown in this study to select the best-fitting model.
There are many highly collinear features with no significant correlation with the prediction target in the multidimensional feature matrix, which is unsuitable for the above conventional methods and easy to make the model fail to fit the target. These modeling methods only use original features as input for the above reasons.
2.6.1. BP Neural Network
As the most basic neural network, BP neural network (BPNN) is widely used in various tasks [35]. After the pre-test, according to the test results, when the number of neurons in the hidden layer was equal to the number of input features, the network prediction effect was better, so the number of neurons in the hidden layer was set to 8.
2.6.2. Support Vector Regression
Support vector regression (SVR) is derived from the support vector machine (SVM) and has good results for some specific regression problems [36]. Radial basis function (RBF) kernels for SVM have been routinely used in a wide range of classification problems, delivering consistently good performance for those problems where the kernel computations are numerically feasible. This paper selected support vector regression based on the Gaussian kernel as a comparison [37].
2.6.3. Random Forest Regression
Tree regression methods can model complex and nonlinear data. This method is mainly based on a tree structure that cuts the data set into multiple easy-to-model data and then establishes a regression prediction model. In this paper, the representative Random Forest regression (RF) was selected as a comparison [38], and the number of trees was set to 20 after a preliminary test.
2.6.4. K-Nearest Neighbor
The advantage of K-nearest neighbor (KNN) regression is that the model is easy to understand and performs well for some nonlinear regression problems without too much parameter adjustment [39].
2.6.5. CNN without CBAM
As a comparison of the Attention mechanism, the network structure of CNN without the attention mechanism is consistent with the Attention-Based CNN designed in this study, using the same input and training settings, except that the CBAM module is not added.
2.7. Model Evaluation Metrics
To evaluate and analyze the model prediction results, root means square error (RMSE), coefficient of determination (R2), mean absolute error (MAE), and mean absolute percentage error (MAPE) were selected as the evaluation metrics. The formulas are Equations (9)–(12).
The result of R2 clearly shows the quality of the model fitting effect. The larger this metric was, the better, and the smaller the other metrics were. MAE and MAPE could be combined with the test set weight mean () to evaluate how well the model fits samples of different orders of magnitude.
3. Results
3.1. Prediction Results
The test set consisting of 229 samples was loaded onto the weight estimation model and the comparison model in this study to estimate the weight of Pleurotus eryngii. The fitting results of different models were described according to the above evaluation metrics. The comparison models are common regression prediction algorithms using original features (, C, L, W, d1, d2, and d3) as input and convolutional neural networks without attention methods using multidimensional feature matrices as input.
Figure 6 compares the predicted weight and measured weight of regression models obtained by different methods: Attention-Based CNN, CNN, BPNN, SVR, KNN, and RF. Table 3 shows the evaluation metrics of all models and the comparison between MAPE × and MAE, and the of the test set was 102.91 g.
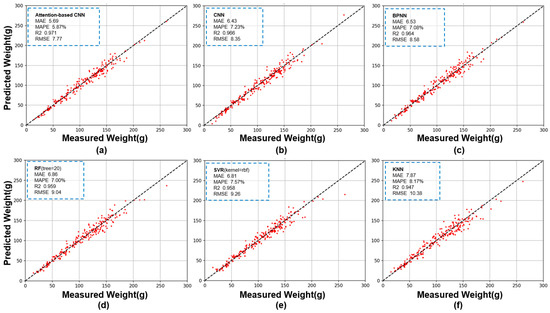
Figure 6.
Comparison of predicted weight and measured weight of six regression models. (a). Attention-Based CNN; (b). CNN; (c). BPNN; (d). RF; (e). SVR; (f). KNN.
Table 3.
Evaluation metrics and MAPE × compared with MAE.
3.2. Analysis of Prediction Results
According to the data in Table 3, the R2 of all prediction models was above 0.947, which proved that the 8 original features obtained by machine vision technology in the weight estimation task of Pleurotus eryngii had an excellent description effect on the morphology of Pleurotus eryngii.
Among all models, the R2 of the two models using the multidimensional feature matrix as input was above 0.966, which was significantly higher than that of other models. This result proved that the multidimensional feature matrix based on feature derivation and feature combination proposed in this study had a better description effect on Pleurotus eryngii morphology than the original features when used in conjunction with CNN. It was proved that the purpose of this research was basically realized, and the training process of CNN was also a process of automatic weight evaluation of features.
The R2, RMSE, MAE, and MAPE of BPNN were 0.964, 8.58, 6.53, and 7.08%, respectively. The prediction results of BPNN were the worst among all neural network methods. However, at the same time, its effects were the best of all the models that take the original features as input. It is proved that the neural network method has better results than the conventional method in solving complex problems. As long as the number of iterations was sufficient, the neural network method could automatically evaluate the screening features by updating the weights, and establish a suitable model. At the same time, when the complexity of the model was sufficient, it could also use the features that the conventional algorithm cannot use.
Compared with the prediction effect of Attention-Based CNN, the R2, RMSE, MAE, and MAPE of CNN were 0.966, 8.35, 6.43, and 7.23%, respectively, which was slightly lower than that of Attention-Based CNN. This showed that the multidimensional feature matrix created more available information but also introduced more noise. The conventional convolutional neural network could not effectively separate and utilize reliable multidimensional features from noise. After adding the Attention mechanism, the R2, RMSE, MAE, and MAPE of Attention-Based CNN were 0.971, 7.77, 5.69, and 5.87%, respectively, and all the evaluation indicators were better than other models. Compared with CNN, the MAPE index was reduced by 1.36%, which was also in line with the optimization range of the CBAM module for CNN. The addition of the CBAM module did not increase the number of layers of the neural network but only modified the feature weights passed during training. This also proved the superior performance of the CBAM module.
This paragraph discussed the comparison between MAPE × and MAE. The six prediction models generally had poor predictions for samples with small true values, but all were within the acceptable range. The effect of Attention-Based CNN, KNN, and RF was better than other models, and the MAPE × of each model was 6.15%, 6.86%, and 4.96% higher than MAE, respectively. Except for Attention-Based CNN in this study, KNN and RF were all algorithms that divided data based on the idea of nearest neighbors. Therefore, these two methods had some inherent advantages over other models in predicting samples in various numerical ranges. However, the other evaluation indexes of KNN and RF were worse than other models.
In summary, all the evaluation indicators proved that the prediction model in this study had the optimal performance in the weight estimation task of Pleurotus eryngii and had an excellent fitting effect for samples in various numerical ranges. The multidimensional feature matrix proposed in this study could describe Pleurotus eryngii with special morphology from a multidimensional perspective. According to the core idea of neural network training that were error reverse transmission and automatic weight update, the training process of neural network was used to automatically select and evaluate the features. It was feasible to derive a large number of features and give them to the neural network for screening and has a good performance in the automatic weighing of Pleurotus eryngii.
4. Conclusions
In this study, aiming at the weight detection task of Pleurotus eryngii, combining machine vision technology and artificial intelligence method, a weight estimation model of Pleurotus eryngii was proposed. Machine vision technology was used to process the original image of Pleurotus eryngii and 8 two-dimensional image features (, C, L, W, d1, d2, and d3) were extracted. According to these features, the multidimensional feature derivation method based on feature combination was used to generate a large number of multidimensional features, enrich semantic information, compose a feature matrix, and improve the upper limit of prediction accuracy. For this research task, an Attention-Based CNN model was designed to estimate the weight of Pleurotus eryngii combined with a multidimensional feature matrix as input. In the course of training, the feature selection and evaluation were completed automatically, and a prediction model was established. Compared with the prediction results of CNN, BPNN, SVR, KNN, and RF, the estimation methods designed in this study performed best with R2, RMSE, MAE, and MAPE were 0.971, 7.77, 5.69, and 5.87%, respectively. All the evaluation metrics were better than other models, and all the Pleurotus eryngii samples of different orders of magnitude had great prediction results. This method could effectively replace manual weighing, save labor costs, improve production efficiency and quality, and have a good application scenario in the factory production of Pleurotus eryngii. There were many reports on the breeding and planting of Pleurotus eryngii, but few studies on its post-harvest. Applying this research to the design of the Pleurotus eryngii sorting machine will effectively realize the automatic production, sorting, and packaging of Pleurotus eryngii. This AI method saved manpower, in addition, it will promote the large-scale production of Pleurotus eryngii, bringing this high-yield and high-quality mushroom to more people’s dinner tables. The method proposed in this study has a certain demand for computing power, and the computing time and the selection of computing hardware should be considered in the application of production. Further research will be carried out to simplify model parameters and increase migration generalization ability. It was hoped that it would have certain reference significance for more machine vision weighing agricultural products research.
Author Contributions
Conceptualization, K.C.; data curation, K.C., J.J., F.H., X.Z., Z.B. and Y.W.; formal analysis, K.C., J.J., F.H., X.Z., Z.B. and Y.W.; methodology, K.C., J.J., F.H., X.Z., Z.B. and Y.W.; project administration, K.C., X.Z. and Y.W.; supervision, K.C.; visualization, J.J. and X.Z.; writing—original draft, J.J., F.H. and Y.W. All authors have read and agreed to the published version of the manuscript.
Funding
This research did not receive any specific grant from funding agencies in the public, commercial, or not-for-profit sectors. This research received no external funding.
Institutional Review Board Statement
Not applicable.
Informed Consent Statement
Not applicable.
Data Availability Statement
Data will be made available on reasonable request.
Acknowledgments
The authors are grateful to Nanjing Agricultural University for providing the experimental equipment and materials.
Conflicts of Interest
The authors declare no conflict of interest.
References
- Choi, U.K.; Bajpai, V.K.; Lee, N.H. Influence of calcinated starfish powder on growth, yield, spawn run and primordial germination of king oyster mushroom (Pleurotus eryngii). Food Chem. Toxicol. 2009, 47, 2830–2833. [Google Scholar] [CrossRef]
- Zhang, B.; Li, Y.; Zhang, F.; Linhardt, R.J.; Zeng, G.; Zhang, A. Extraction, structure and bioactivities of the polysaccharides from Pleurotus eryngii: A review. Int. J. Biol. Macromol. 2020, 150, 1342–1347. [Google Scholar] [CrossRef]
- Yang, C.; Ma, X.D.; Guan, H.O.; Fan, B.W. Rapid detection method of Pleurotus eryngii mycelium based on near infrared spectral characteristics. Spectroc. Acta Part A Molec. Biomolec. Spectr. 2022, 271, 9. [Google Scholar] [CrossRef] [PubMed]
- Sa’ad, F.S.A.; Ibrahim, M.F.; Shakaff, A.Y.M.; Zakaria, A.; Abdullah, M.Z. Shape and weight grading of mangoes using visible imaging. Comput. Electron. Agric. 2015, 115, 51–56. [Google Scholar] [CrossRef]
- Xie, W.; Wei, S.; Zheng, Z.; Chang, Z.; Yang, D. Developing a stacked ensemble model for predicting the mass of fresh carrot. Postharvest Biol. Technol. 2022, 186, 111848. [Google Scholar] [CrossRef]
- Tri, H.; Ly, T.; Son, D. Real-Time Size and Mass Estimation of Slender Axi-Symmetric Fruit/Vegetable Using a Single Top View Image. Sensors 2020, 20, 5406. [Google Scholar] [CrossRef]
- Lee, J.; Nazki, H.; Baek, J.; Hong, Y.; Lee, M. Artificial Intelligence Approach for Tomato Detection and Mass Estimation in Precision Agriculture. Sustainability 2020, 12, 9138. [Google Scholar] [CrossRef]
- Ma, H.; Zhu, X.; Ji, J.; Wang, H.; Jin, X.; Zhao, K. Rapid estimation of apple phenotypic parameters based on 3D reconstruction. Int. J. Agric. Biol. Eng. 2021, 14, 180–188. [Google Scholar] [CrossRef]
- Cui, F.; Li, Y.; Yang, Y.; Sun, W.; Wu, D.; Ping, L. Changes in Chemical Components and Cytotoxicity at Different Maturity Stages of Pleurotus eryngii Fruiting Body. J. Agric. Food Chem. 2014, 62, 12631–12640. [Google Scholar] [CrossRef] [PubMed]
- Ohga, S. Influence of wood species on the sawdust-based cultivation of Pleurotus abalonus and Pleurotus eryngii. J. Wood Sci. 2000, 46, 175–179. [Google Scholar] [CrossRef]
- Yue, Z.; Zhang, W.; Liu, W.; Xu, J.; Liu, W.; Zhang, X. Effect of Different Light Qualities and Intensities on the Yield and Quality of Facility-Grown Pleurotus eryngii. J. Fungi 2022, 8, 1244. [Google Scholar] [CrossRef]
- Oyamada, M. Extracting Feature Engineering Knowledge from Data Science Notebooks. In Proceedings of the 2019 IEEE International Conference on Big Data (Big Data), Los Angeles, CA, USA, 9–12 December 2019. [Google Scholar] [CrossRef]
- Abedi, M.; Tan, X.; Stallknecht, E.J.; Runkle, E.S.; Klausner, J.F.; Murillo, M.S.; Bénard, A. Incorporating the effect of the photon spectrum on biomass accumulation of lettuce using a dynamic growth model. Front. Plant Sci. 2023, 14, 1106576. [Google Scholar] [CrossRef]
- Kieslich, C.A.; Alimirzaei, F.; Song, H.; Do, M.; Hall, P. Data-driven prediction of antiviral peptides based on periodicities of amino acid properties. In Computer Aided Chemical Engineering; Türkay, M., Gani, R., Eds.; Elsevier: Amsterdam, The Netherlands, 2021; Volume 50, pp. 2019–2024. [Google Scholar] [CrossRef]
- Kosarirad, H.; Ghasempour Nejati, M.; Saffari, A.; Khishe, M.; Mohammadi, M. Feature Selection and Training Multilayer Perceptron Neural Networks Using Grasshopper Optimization Algorithm for Design Optimal Classifier of Big Data Sonar. J. Sens. 2022, 2022, 9620555. [Google Scholar] [CrossRef]
- Chen, X.; Lin, Q.; Luo, C.; Li, X.; Zhang, H.; Xu, Y.; Dang, Y.; Sui, K.; Zhang, X.; Qiao, B.; et al. Neural Feature Search: A Neural Architecture for Automated Feature Engineering. In Proceedings of the 2019 IEEE International Conference on Data Mining (ICDM), Beijing, China, 8–11 November 2019. [Google Scholar] [CrossRef]
- Li, H. Research on the Significance of Big Data and Artificial Intelligence Technology to Enterprise Business Management. Mob. Inf. Syst. 2022, 2022, 7639965. [Google Scholar] [CrossRef]
- Xia, M.; Zhou, Y. Research on UI Design and Optimization of Digital Media Based on Artificial Intelligence. J. Sens. 2022, 2022, 7014070. [Google Scholar] [CrossRef]
- Rodrigues, E.D.S.; Lima Martins, D.M.; de Lima Neto, F.B. Self-Organizing Transformations for Automatic Feature Engineering. In Proceedings of the 2021 IEEE Symposium Series on Computational Intelligence (SSCI), Orlando, FL, USA, 5–7 December 2021. [Google Scholar] [CrossRef]
- Li, G.; Zhang, A.; Zhang, Q.; Wu, D.; Zhan, C. Pearson Correlation Coefficient-Based Performance Enhancement of Broad Learning System for Stock Price Prediction. IEEE Trans. Circuits Syst. II Express Briefs 2022, 69, 2413–2417. [Google Scholar] [CrossRef]
- Zhang, X.; Zhang, L. Forecasting Method of Stock Market Volatility Based on Multidimensional Data Fusion. Wirel. Commun. Mob. Comput. 2022, 2022, 6344064. [Google Scholar] [CrossRef]
- Wang, J.-H.; Li, C.-R.; Hou, P.-L. Feature screening for survival trait with application to TCGA high-dimensional genomic data. PeerJ 2022, 10, e13098. [Google Scholar] [CrossRef]
- Ma, H.; Xu, L.; Javaheri, Z.; Moghadamnejad, N.; Abedi, M. Reducing the consumption of household systems using hybrid deep learning techniques. Sustain. Comput. Inform. Syst. 2023, 38, 100874. [Google Scholar] [CrossRef]
- Liu, J.; Prabuwono, A.S.; Abulfaraj, A.W.; Miniaoui, S.; Taheri, N. Cognitive cloud framework for waste dumping analysis using deep learning vision computing in healthy environment. Comput. Electr. Eng. 2023, 110, 108814. [Google Scholar] [CrossRef]
- Kumar, G.; Bhatia, P.K. A Detailed Review of Feature Extraction in Image Processing Systems. In Proceedings of the 2014 Fourth International Conference on Advanced Computing & Communication Technologies, Rohtak, India, 8–9 February 2014. [Google Scholar] [CrossRef]
- Canny, J. A computational approach to edge-detection. IEEE Trans. Pattern Anal. Mach. Intell. 1986, 8, 679–698. [Google Scholar] [CrossRef] [PubMed]
- Diao, X.M.; Furuno, T.; Fujita, M. Digital image analysis of cross-sectional tracheid shapes in Japanese softwoods using the circularity index and aspect ratio. J. Wood Sci. 1999, 45, 98–105. [Google Scholar] [CrossRef]
- Wang, X.F.; Du, J.X.; Zhang, G.J. Recognition of leaf images based on shape features using a hypersphere classifier. In Lecture Notes in Computer Science; Huang, D.S., Zhang, X.P., Huang, G.B., Eds.; Springer: Berlin/Heidelberg, Germany, 2005; pp. 87–96. [Google Scholar] [CrossRef]
- Liu, J.; Liu, Z.; Wang, L.; Guo, L.; Dang, J. Speech emotion recognition with local-global aware deep representation learning. In Proceedings of the 2020 IEEE International Conference on Acoustics, Speech and Signal Processing (ICASSP), Barcelona, Spain, 4–8 May 2020. [Google Scholar] [CrossRef]
- Hu, J.; Shen, L.; Sun, G. Squeeze-and-Excitation Networks. In Proceedings of the 2018 IEEE/CVF Conference on Computer Vision and Pattern Recognition, Salt Lake City, UT, USA, 18–23 June 2018. [Google Scholar] [CrossRef]
- Niu, Z.; Zhong, G.; Yu, H. A review on the attention mechanism of deep learning. Neurocomputing 2021, 452, 48–62. [Google Scholar] [CrossRef]
- Woo, S.; Park, J.; Lee, J.-Y.; Kweon, I.S. CBAM: Convolutional Block Attention Module. arXiv 2018, arXiv:1807.06521. [Google Scholar] [CrossRef]
- Simonyan, K.; Zisserman, A. Very Deep Convolutional Networks for Large-Scale Image Recognition. arXiv 2014, arXiv:1409.1556. [Google Scholar] [CrossRef]
- He, K.; Zhang, X.; Ren, S.; Sun, J. Deep Residual Learning for Image Recognition. In Proceedings of the 2016 IEEE Conference on Computer Vision and Pattern Recognition (CVPR), Las Vegas, NV, USA, 27–30 June 2016. [Google Scholar] [CrossRef]
- Rumelhart, D.E.; Hinton, G.E.; Williams, R.J. Learning representations by back-propagating errors. Nature 1986, 323, 533–536. [Google Scholar] [CrossRef]
- Awad, M.; Khanna, R. Support Vector Regression. In Efficient Learning Machines: Theories, Concepts, and Applications for Engineers and System Designers; Awad, M., Khanna, R., Eds.; Apress: Berkeley, CA, USA, 2015; pp. 67–80. [Google Scholar] [CrossRef]
- Izmailov, R.; Vapnik, V.; Vashist, A. Multidimensional splines with infinite number of knots as SVM kernels. In Proceedings of the the 2013 International Joint Conference on Neural Networks (IJCNN), Dallas, TX, USA, 4–9 August 2013; pp. 1–7. [Google Scholar] [CrossRef]
- Svetnik, V.; Liaw, A.; Tong, C.; Culberson, J.C.; Sheridan, R.P.; Feuston, B.P. Random forest: A classification and regression tool for compound classification and QSAR modeling. J. Chem. Inf. Comput. Sci. 2003, 43, 1947–1958. [Google Scholar] [CrossRef] [PubMed]
- Cover, T.; Hart, P. Nearest neighbor pattern classification. IEEE Trans. Inf. Theory 1967, 13, 21–27. [Google Scholar] [CrossRef]
Disclaimer/Publisher’s Note: The statements, opinions and data contained in all publications are solely those of the individual author(s) and contributor(s) and not of MDPI and/or the editor(s). MDPI and/or the editor(s) disclaim responsibility for any injury to people or property resulting from any ideas, methods, instructions or products referred to in the content. |
© 2023 by the authors. Licensee MDPI, Basel, Switzerland. This article is an open access article distributed under the terms and conditions of the Creative Commons Attribution (CC BY) license (https://creativecommons.org/licenses/by/4.0/).