Article

Growth Performance of Photoperiod-Sensitive Rice (Oryza sativa L.) Varieties in Different Soil Types under Rainfed Condition in Cambodia

1
International Rice Research Institute, Cambodia Office, Phnom Penh 12101, Cambodia
2
Nagoya University Asian Satellite Campus Institute-Cambodia, Royal University of Agriculture, Phnom Penh 120501, Cambodia
3
Faculty of Agronomy, Royal University of Agriculture, Phnom Penh P.O. Box 2696, Cambodia
4
International Center for Research and Education in Agriculture, Nagoya University, Furo-cho, Chikusa-ku, Nagoya 464-8601, Japan
5
Graduate School of Bioagricultural Sciences, Nagoya University, Furo-cho, Chikusa-ku, Nagoya 464-8601, Japan
*
Author to whom correspondence should be addressed.
Agriculture 2023, 13(8), 1602; https://doi.org/10.3390/agriculture13081602
Submission received: 2 July 2023 / Revised: 6 August 2023 / Accepted: 11 August 2023 / Published: 13 August 2023
(This article belongs to the Section Crop Production)

Abstract

:
In Cambodia, rice is predominantly produced in areas with rainfed lowland conditions where photoperiod-sensitive varieties are cultivated. A number of varieties have been released for rainfed lowland areas, and the rice grain yield has reportedly increased by approximately 12% over the past ten years. Moreover, great fluctuations in yield performance have been observed across different soil types of the rainfed ecosystems of Cambodia. Therefore, the present study aimed to analyze the grain yield and stability among ten popular varieties that were released for rainfed lowland ecosystems across the four different soil types in Cambodia in two years. The grain yield varied 566 g m−2 as the highest in clay soil and about 220 g m−2 as the lowest in sandy soil. A combined ANOVA revealed significant differences for the main effect of genotype, environment, and genotype-by-environment interaction (GEI) for all yield-related traits and grain yield per square meter. The principal component test results showed that the heterogeneity of grain yield was mainly attributable to the effect of environment, followed by the effect of genotype. In fertile conditions, a higher percentage of filled grains was supported by higher leaf N until the late stage with a wider flag leaf. In conditions of moderate fertility, larger numbers of panicles were supported by a higher percentage of productive culms with higher leaf N until the late stage. In conditions of poor fertility, a higher percentage of filled grains was supported by higher leaf N until the late stage, which is considered to be important for higher grain yield. The variety Phka Rumduol showed these preferable traits and produced higher yields in fertile to poor natural soil fertility conditions with moderate variation. This variety is considered to be more desirable and ideal due to its stability and higher grain yield. The other varieties, namely, Phka Mealdei, Phka Rumdeng, and CAR4, were identified as above-average yielders. Therefore, those varieties potentially may be recommended for cultivation in rainfed lowland rice ecosystems in Cambodia due to their high yields. CAR4 showed moderate variation at the same level as Phka Rumduol. From the point of stability, Phka Rumduol and CAR4 can be expected to excel.

1. Introduction

Under changing climate conditions, the improvement of varieties previously released is a major challenge. Understanding the yield-determining factors and yield stability performance of certain varieties is important for selecting and breeding stable and high-yielding varieties.
Yield is a complex trait controlled by multiple genes; usually, the yield performance of genotypes fluctuates greatly from environment to environment due to differences in temperature, soil fertility, levels of diseases and insects, and more, [1,2,3], which might result in low genetic gain in the artificial selection process [4,5]. Selection for high yields in rice has partly been based on yield-related parameters. A number of studies, such as Chandra et al. (2019) [6], Chung et al. (2005) [7], Huang et al. (2011) [8], Li et al. (2019) [9], and Yang et al. (2008) [10], have reported the association between grain yield and direct and indirect yield-related traits such as plant height, panicle length, fertile spikelets per panicle, and total biomass.
Large variations in grain yields across the environment are a major concern for plant breeders’ efforts to effectively select the ideal genotypes/varieties. The presence of the genotype-by-environment interaction (GEI) reportedly confounds plant breeders and complicates the selection of the ideal varieties [11]. Therefore, analysis of GEI is inevitably a prerequisite to effectively selecting stable genotypes and/or specifically identifying well-adapted genotypes for different environments [12,13,14]. Thus, the concept of stability analysis has become a subject of interest among plant breeders.
Rice (Oryza sativa L.) is the most important staple crop in Cambodia, providing approximately 60 to 70 percent of the total calories for its people. The historical cultivation of rice crop among Cambodian farmers is believed to date back more than 2000 years [15]. In Cambodia, rice alone has contributed approximately 60 percent of the agricultural sector’s share of the national GDP [16]; it has been estimated that the total of rice cultivation accounts for approximately 75.8% (3,328,000 ha) of the country’s arable land [17].
Rainfed lowland rice ecosystems cover 9.5 × 10⁶ ha, equivalent to more than 80% of the total area of rice (Oryza sativa L.) in the Mekong region of Southeast Asia [18]. Rainfed lowland conditions, where photoperiod-sensitive rice varieties are cultivated, are predominant in the rice-farming ecosystems of Cambodia, accounting for up to 62.3% of the total area of rice cultivation [17]. Although a number of rice varieties have been released for the rainfed lowland ecosystems in Cambodia, the yield of rainfed lowland rice has increased approximately 12% within the past ten years [17]. Yet, it has been reported that the average yield of rainfed lowland rice in Cambodia remains lower than 3 metric tons per hectare. Moreover, recent investigations on grain yield performance in different important soil types of the rainfed lowland ecosystems of Cambodia under different systems of nutrient management have revealed great fluctuations in grain yield performance, ranging from 0.9 to 5.2 metric tons per hectare [19,20]. This indicates that it is important for the country to further increase rice yield in the context of climate change to ensure sustainable rice production and food security.
The rainfed lowland ecosystem of Cambodia is complex and covers diverse soil groups used for rice production. Low soil fertility is a major constraint on rainfed lowland rice yields [21]. The Cambodian Agronomic Soil Classification (CASC) has classified rice-farming soils into eleven groups based on differences in their soil surface properties and physical characteristics [22]. Among the eleven soil groups, four types of soil—(1) Tuol Samroung, (2) Krakor, (3) Prateah Lang, and (4) Prey Khmer—represent the most important soil types of the rainfed lowland ecosystem of Cambodia. The soil texture of Toul Samroung and Krakor are characterized as clay-dominant, while those of the Prateah Lang and Prey Khmer are sand-dominant. Generally, soil texture affects plant growth and yield performance; different soil textures [23,24] might have different influences on a plant’s nutrient uptake as affected by different chemical properties [25]. For example, soils with a dominant clay content tend to be more fertile due to higher organic matter content compared to sand-dominant soil types. This seems to imply that soil plays an important role in determining rice growth and grain yield performance.
Most of the photoperiod-sensitive rice varieties available for rainfed lowlands in Cambodia were released in the 1990s. The stability of these varieties’ grain yield performance is uncertain after such long period; therefore, investigating their agronomic and yield performance stability across different soil types of the rainfed lowland rice ecosystem in Cambodia is imperative, as knowing the yield stability is required for recommending superior and stable varieties for specific environments [13,26]. Moreover, no research has yet been conducted to understand the yield trends among the popular photoperiod-sensitive rice varieties released for the rainfed lowland ecosystem of Cambodia. Therefore, multi-environment trials (METs) were conducted over two years in order to analyze the yield stability of ten rice varieties across four different soil types of the lowland ecosystems in Cambodia and to understand the grain yield-determining factors of Cambodia’s popular improved rice varieties.

2. Materials and Methods

2.1. Plant Materials

2.1.1. Trial in 2019

Ten popular photoperiod-sensitive rice varieties released by the Cambodian Agricultural Research and Development Institute (CARDI) were used in the present multi-environment trails (METs): Phka Rumduol (entry code: G1, released in 1999; the same notation is used for the following varieties as well), Phka Romeat (G2, 2007), Phka Rumdeng (G3, 2007), Phka Mealdei (G4, 2018), Phka Chan Sen Sar (G5, 2009), Raing Chey (G6, 1999), CAR3 (G7, 1995), CAR4 (G8, 1995), CAR6 (G9, 1995), and CAR11 (G10, 1997).

2.1.2. Trial in 2020

Four photoperiod-sensitive rice varieties were selected from the ten varieties used in 2019: Phka Rumduol, Phka Mealdei, Raing Chey, and CAR4.

2.2. Environments and Experimental Design

2.2.1. Trial in 2019

The METs were conducted in eight rainfed lowland environments during the wet season from July to December, 2019 at two different locations in each of four provinces—Battambang (BTB), Pursat (PUR), Kampong Thom (KPT), and Siem Reap (SRP)—where different soil types were distributed as follows: (1) Tuol Samroung (light gray to brown, clayey topsoil with big cracks when dry), (2) Krakor (light gray to brown, loamy topsoil over loamy subsoil), (3) Prateah Lang (sandy topsoil with a bright color over loamy subsoil), and (4) Prey Khmer (very sandy soil with a bright color). The eight experimental sites represented the most important rainfed paddy rice ecosystems surrounding the Great Lake of Cambodia.
Topsoil layers 0–20 cm and 20–40 cm in depth were collected from the eight experimental sites prior to cultivation in 2019 and their soil textures and chemical properties were analyzed; the detailed soil properties of the eight test environments are elaborated in Table 1. Soil analysis was conducted at a laboratory of the General Directorate of Agriculture, Ministry of Agriculture, Forestry and Fisheries. We followed the standard protocols in Dobermann and Fairhurst (2000) [27] for the following parameters: pH (1:1 v/v soil–H2O mixture), total soil C, total soil N, total soil P, cation-exchange capacity (CEC), exchangeable K, and soil texture. Daily rainfall and air temperature were recorded at the meteorological station in each province. Soil pH was measured at a soil:1 N HCl ratio of 1:2.5 (w v−1) by a pH meter. The total nitrogen and carbon concentrations were measured by the Pregl–Dumas Method [28]. The determination of total phosphorus was analyzed considering the former description [29]. The exchangeable K+, Ca2+, Mg2+, and Na+ were measured by the ammonium acetate saturation method [30]. The cation exchange capacity was calculated from the amounts of K+, Ca2+, Mg2+, and Na+ measured in the samples.
The ten rice genotypes were evaluated using a randomized complete block (RCB) design with four replications at each experimental site. Eighteen-day-old seedlings of each genotype were transplanted in a 10 m2 plot at a density of 250 hills per plot (20 cm × 20 cm: 1 seedling/hill) in July of 2019. The specific fertilization rate for each soil type of the eight environments was used based on the recommended doses proposed by CARDI; the recommended rates of fertilizer application (N:P2O5:K2O kg ha−1) were 64:23:20, 118:23:0, 57:23:30, and 65:25:25 for the Tuol Samroung, Krakor, Prateah Lang, and Prey Khmer soil groups, respectively. A compound fertilizer of urea, DAP, and KCl was applied as the source of N, P2O5, and K2O at all experiment sites. Briefly, all DAP and KCl applications were done basally, while urea was split for two times, of which half was applied basally and the other half was evenly split and used as top-dressing fertilizer at the early tillering and panicle initiation stages.
The precipitation and air temperature data during the rice cultivation season from June to December 2019 over the past five years were collected from the meteorological station in each province.

2.2.2. Trial in 2020

The experiment was conducted in four rainfed lowland environments in the wet season from July to December, 2020, on location in each of the same four provinces as in the experiment in the previous year, namely, Battambang (BTB: BTB1 in 2019), Pursat (PUR: PUR1 in 2019), Kampong Thom (KPT: KPT1 in 2019), and Siem Reap (SRP: SRP2 in 2019). The methods of fertilizer application management and cultivation were the same as those in the experiment in 2019. The data of daily mean air temperature and monthly rainfall were recorded at the provincial meteorological station in each province.

2.3. Measurements

2.3.1. Trial in 2019

Data collection was conducted based on the Standard Evaluation System (SES) for rice of IRRI. Five plants were randomly selected from each replication for measuring the number of stems. Then, five plants were randomly sampled from each replication for measuring plant length, panicle number per hill, spikelet number per panicle, and percentage of filled grains. The panicle length of the longest culm in each hill was measured. Growth duration was recorded when the panicles in each plot turned brown. To measure dry matter weight as biomass, the shoot dry weights (above-ground biomasses) of five random plants were collected at the full-heading stage and the physiological maturity stage and were subjected to an oven-drying process at 70 °C until the constant weight was obtained.
To estimate the grain yield per square meter, 250 plants were harvested in a 10 m2 plot and determined based on the basis of a standardized 14% moisture content. The grain yield per square meter along with agronomic traits such as growth duration, plant height, panicle number per hill, spikelet number per panicle, percentage of filled grains, 1000-grain weight (14% moisture content basis), and harvest index (grain yield/(grain yield + straw biomass)) were recorded.

2.3.2. Trial in 2020

Five plants were randomly selected at first from each replication and continuously used for measuring the number of stems and plant length every two weeks. Shoot dry matter weight, panicle length, yield components, and grain yield were measured by the same methods as used in the experiment in the previous year. The flag leaf on the main stem was used for measuring the length and width of the leaf blade. The nitrogen concentration in white rice was measured by the Kjeldahl method.

2.4. Statistical Analysis

All data were processed using Microsoft Excel 2019, and a statistical analysis was performed with SPSS (IBM SPSS Statistics, Chicago, IL, USA). The correlation analysis between the soil phyco-chemical parameters or between the agronomic parameters was used to clarify the important factors relating to the difference in the natural soil fertility. An analysis of variance (ANOVA) was conducted to evaluate the variation of genotypes, environments, and genotype-by-environment interaction across the eight environments. Tukey’s honestly significant difference test was used to clarify the differences in the grain yield and yield components between the varieties or environments. The principal component analysis was employed to summarize explanatory variables such as agronomic parameters and environmental factors into fewer indicators and to identify the contribution of each parameter or factor to the difference in the grain yield. Pearson product–moment correlation analysis for the grain yield was performed between the locations and provinces to clarify the differences in grain yield between the varieties in different environments. Multiple regression analysis was conducted by the step-wise method to estimate the most important yield components.

3. Results and Discussion

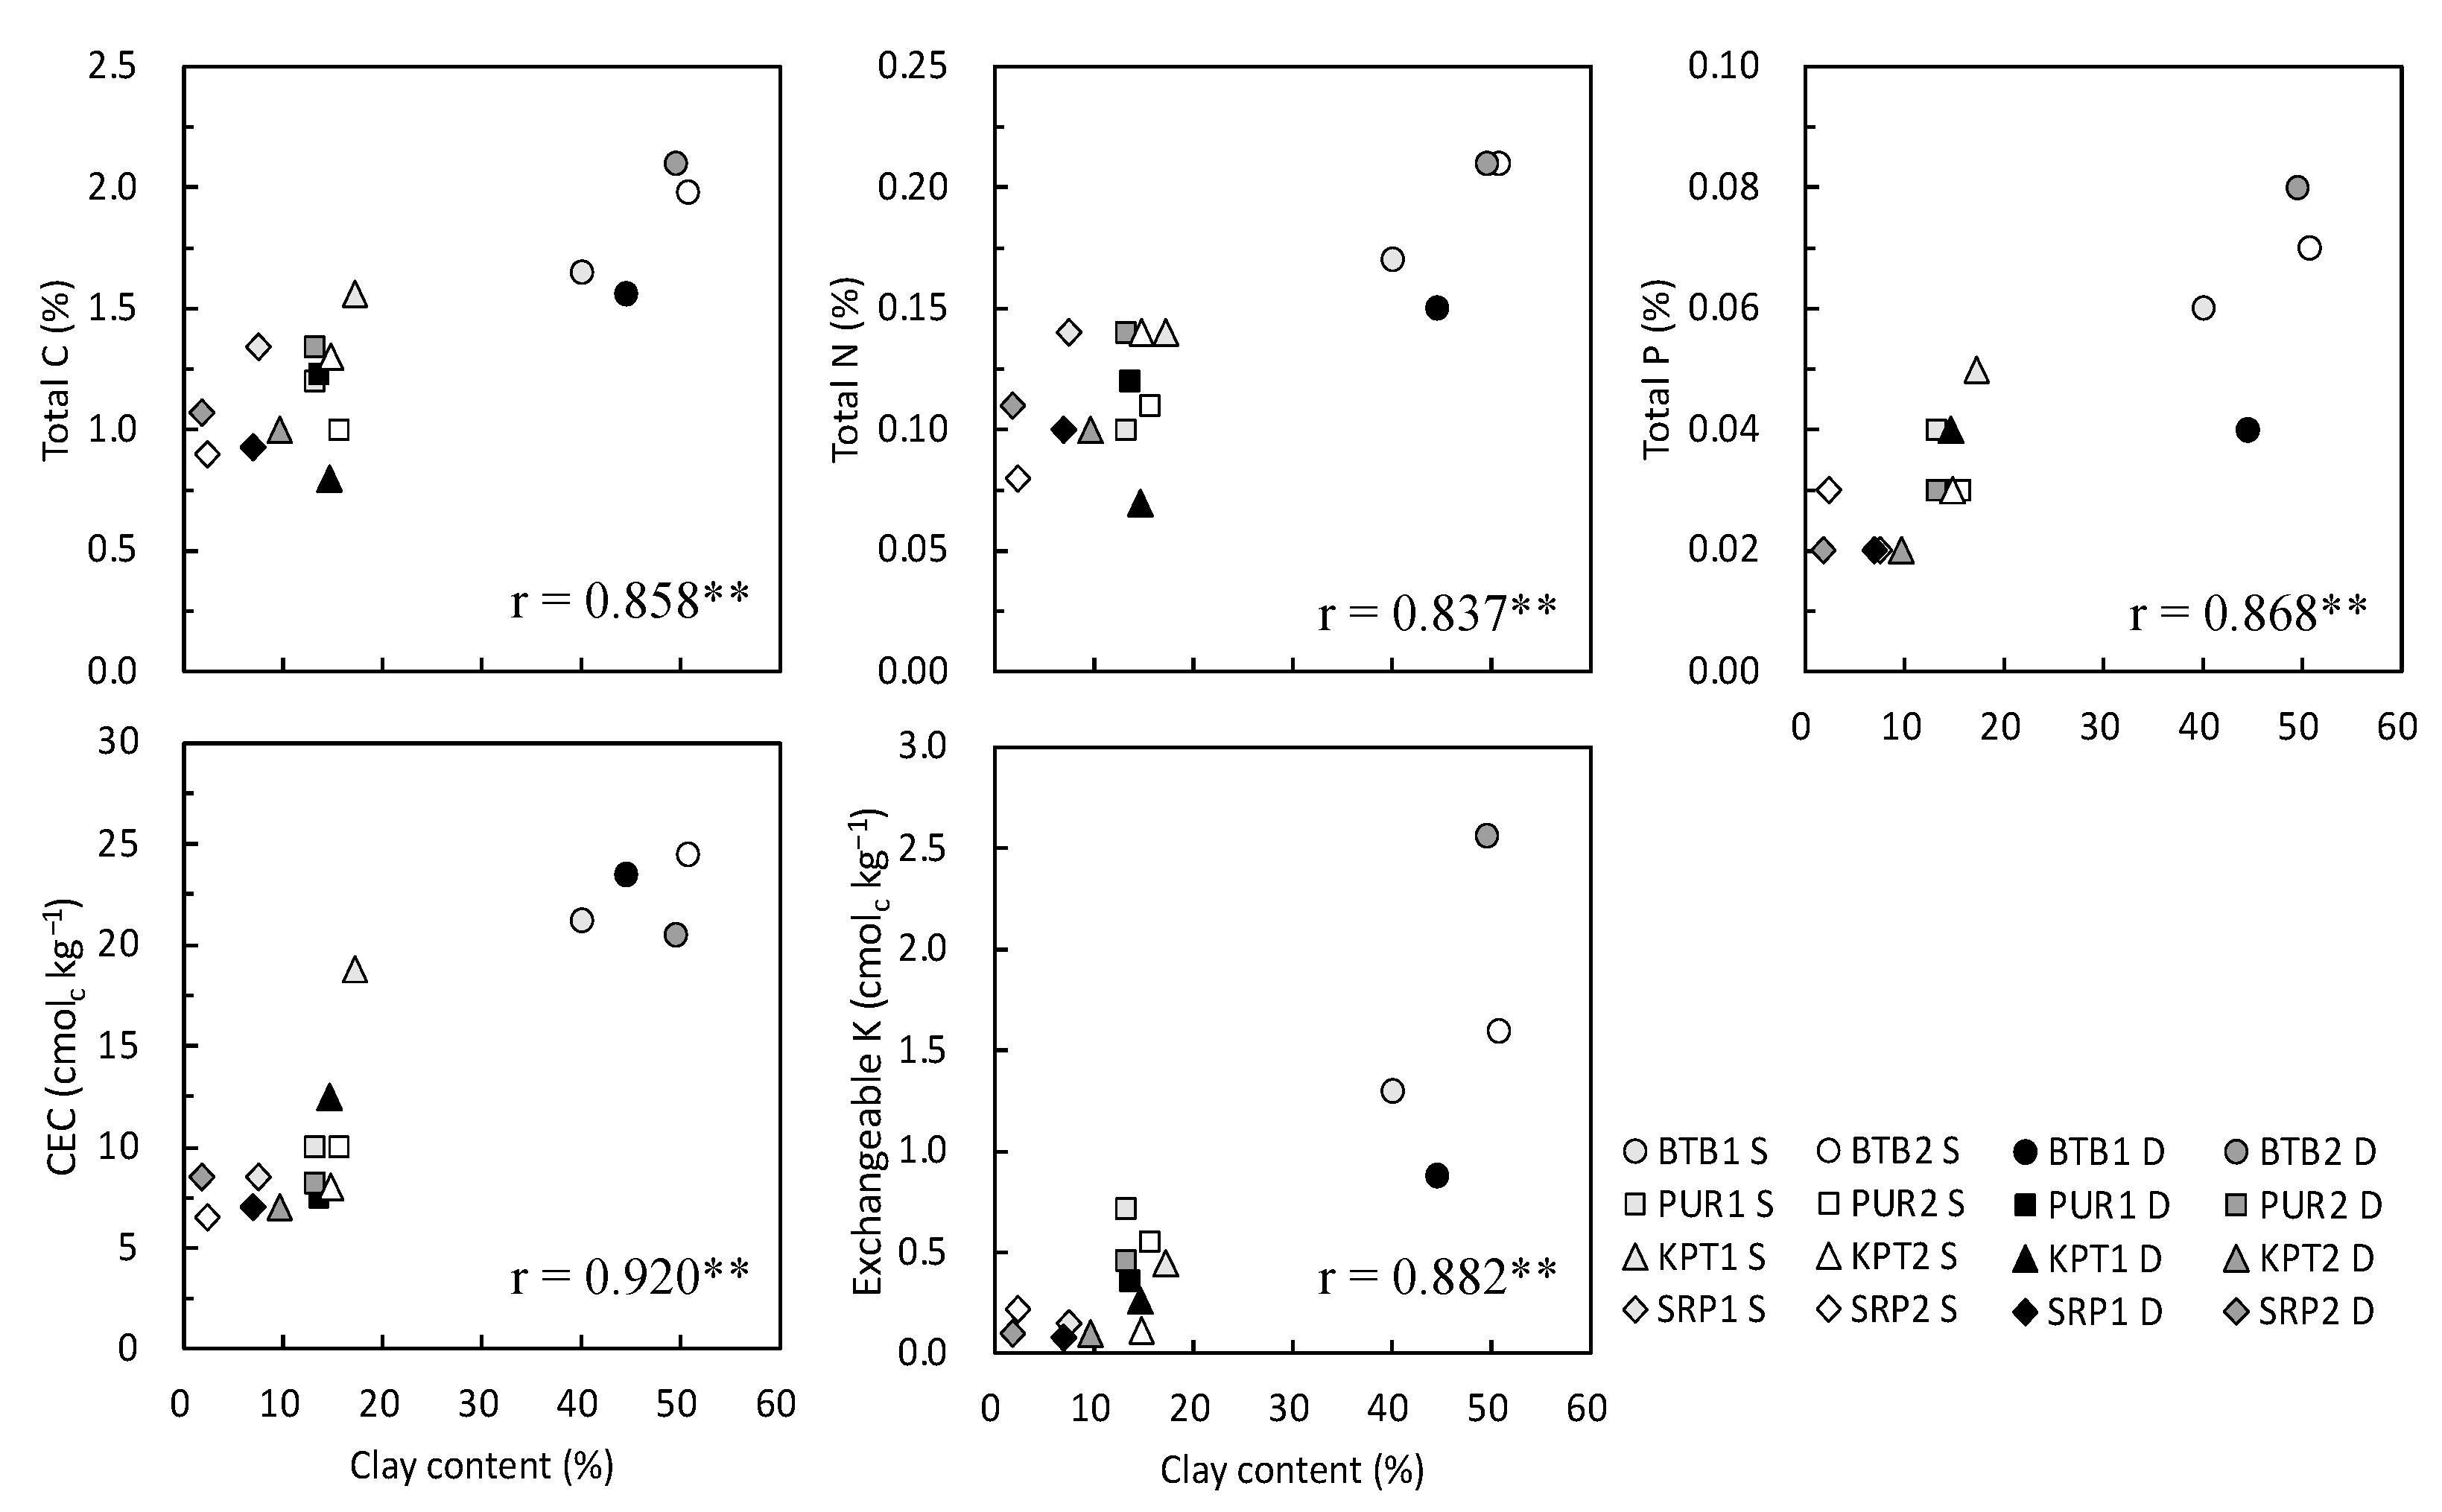
3.1. Soil Properties at the Experimental Sites

This study was conducted at eight sites (two locations in each of four provinces where different types of soil are distributed). Therefore, soil physical and chemical parameters were compared among the experimental sites. Soil characteristics at the experimental sites differed greatly among the provinces (Table 2).
The pH, total C, total N, total P, CEC, and exchangeable K were mostly highest in the Toul Samroung soil at the BTB1 or BTB2 site, and tended to be low in SRP, especially SRP2. The variation in soil texture between the environments appeared large in clay. When exploring the relationship between soil chemical properties and soil texture, a significant positive relationship (p < 0.01) was found between the clay content and the total C, total N, total P, CEC, and exchangeable K (Figure 1). These results suggest that soil with higher clay content tended to be more fertile than soil with lower clay content. Kong et al. (2019) [19] reported that the sand content was negatively correlated with the clay content, CEC, and available K in Battambang, Kampong Thom, Pursat, and Siem Reap. They stated that a high sand content decreased the soil’s ability to retain nutrients in Cambodia [19]. Their finding that rice yield in unfertilized plots strongly reflected the inherent soil fertility or nutrient-holding capacity agrees with the findings of previous studies [31,32]. According to White et al. (2000) [33], the Toul Samroung, Prateah Lang, and Prey Khmer soils are classified as Endoaqualfs (loamy/clayey topsoil, clayey subsoil), Plinthustalfs (sandy topsoil, loamy/clayey subsoil), and Psamments (sandy topsoil, sandy subsoil), respectively, in the USDA classification Krakor (loamy/clayey topsoil, loamy/clayey subsoil). Toul Samroung soil proved to be the most fertile of the three soil groups used in this study, probably because of its high clay and CEC [33]. In the case of our current study, the clay content was positively correlated with the total C, total N, total P, CEC, and exchangeable K, as described above. These results are considered to have a tendency similar to those of several former reports. Natural soil fertility was comparatively high in Tuol Samroung soil in Battambang and comparatively low in Prey Khmer soil in Siem Reap.

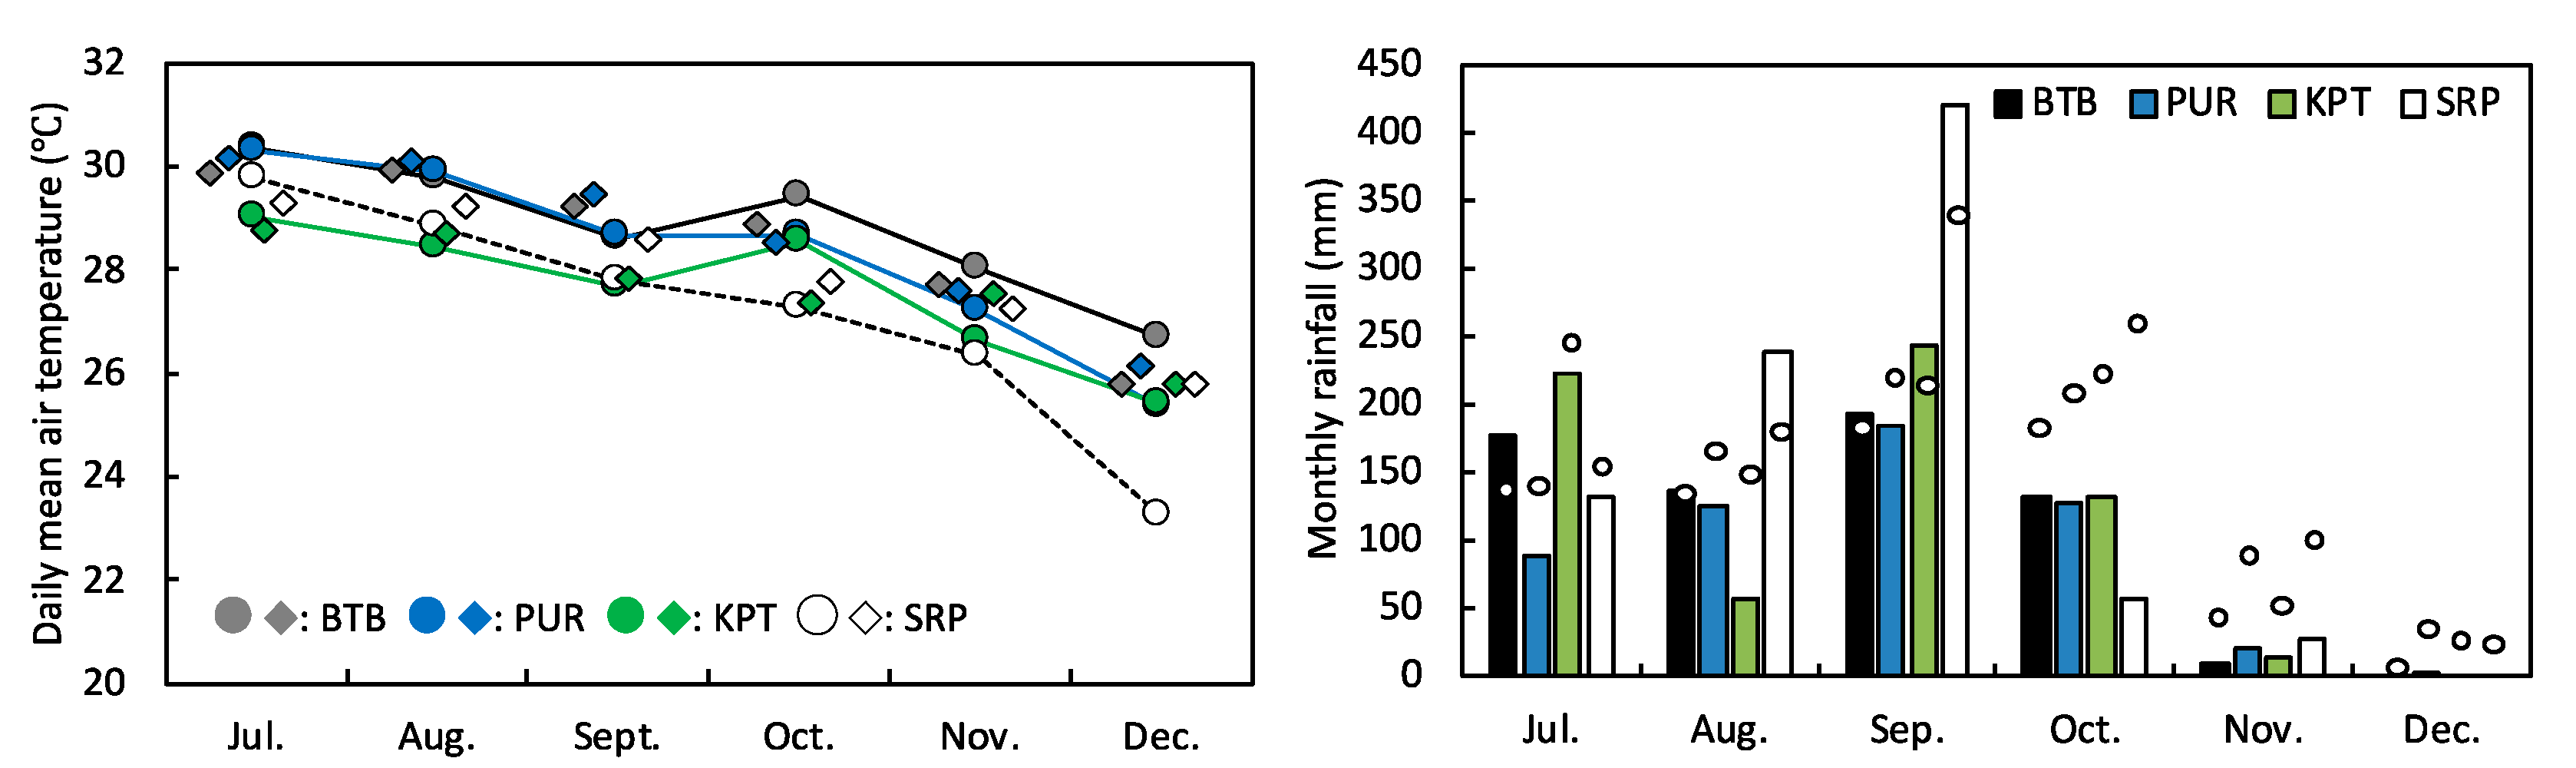
3.2. Climatic Conditions of the Experimental Sites in 2019

The four provinces are located west, south, east, and north of Tonle Sap Lake, where the climate is considered to be varied. Thus, the recorded daily mean air temperature and monthly rainfall are shown in Figure 2 and compared. The daily mean air temperature tended to be lower in Siem Reap (SRP) at the later part of growth (during the reproductive stage after October) than in the other provinces in 2019 as compared with the average for the most recent five years. The air temperature tended to be high in Battambang (BTB) in 2019. It was observed that the highest monthly rainfall was recorded during the vegetative stage in September rather than by the late growth stage. There was more precipitation in 2019 in September in Siem Reap (SRP) and less in all the provinces after October as compared with the average over the most recent five years.
The climate in this region is tropical monsoonal, with a wet season (from June to November) followed by a prolonged dry season, and rainfall is irregular both from year to year and within years [19]. While rice is grown mostly during the wet season, there is frequent intermittent drought [34]. The area of rice cultivation in Cambodia has almost tripled from 1984 (0.978 × 10⁶ ha) to 2014 (2.859 × 10⁶ ha), and it continued to increase by 2.57% per year until 2020 [35]. Although the grain yield level in average has increased from 1.29 t ha−1 (1984) to 3.39 t ha−1 (2020), the yield of rainfed lowland rice in the wet season remains lower than 3.0 t ha−1 [19]. The variation in the amount of precipitation between provinces in 2019 appears larger compared with the average for five years due to the large value in Siem Reap in 2019 as opposed to the average in August and September and the smaller value in all provinces from October to December in 2019.

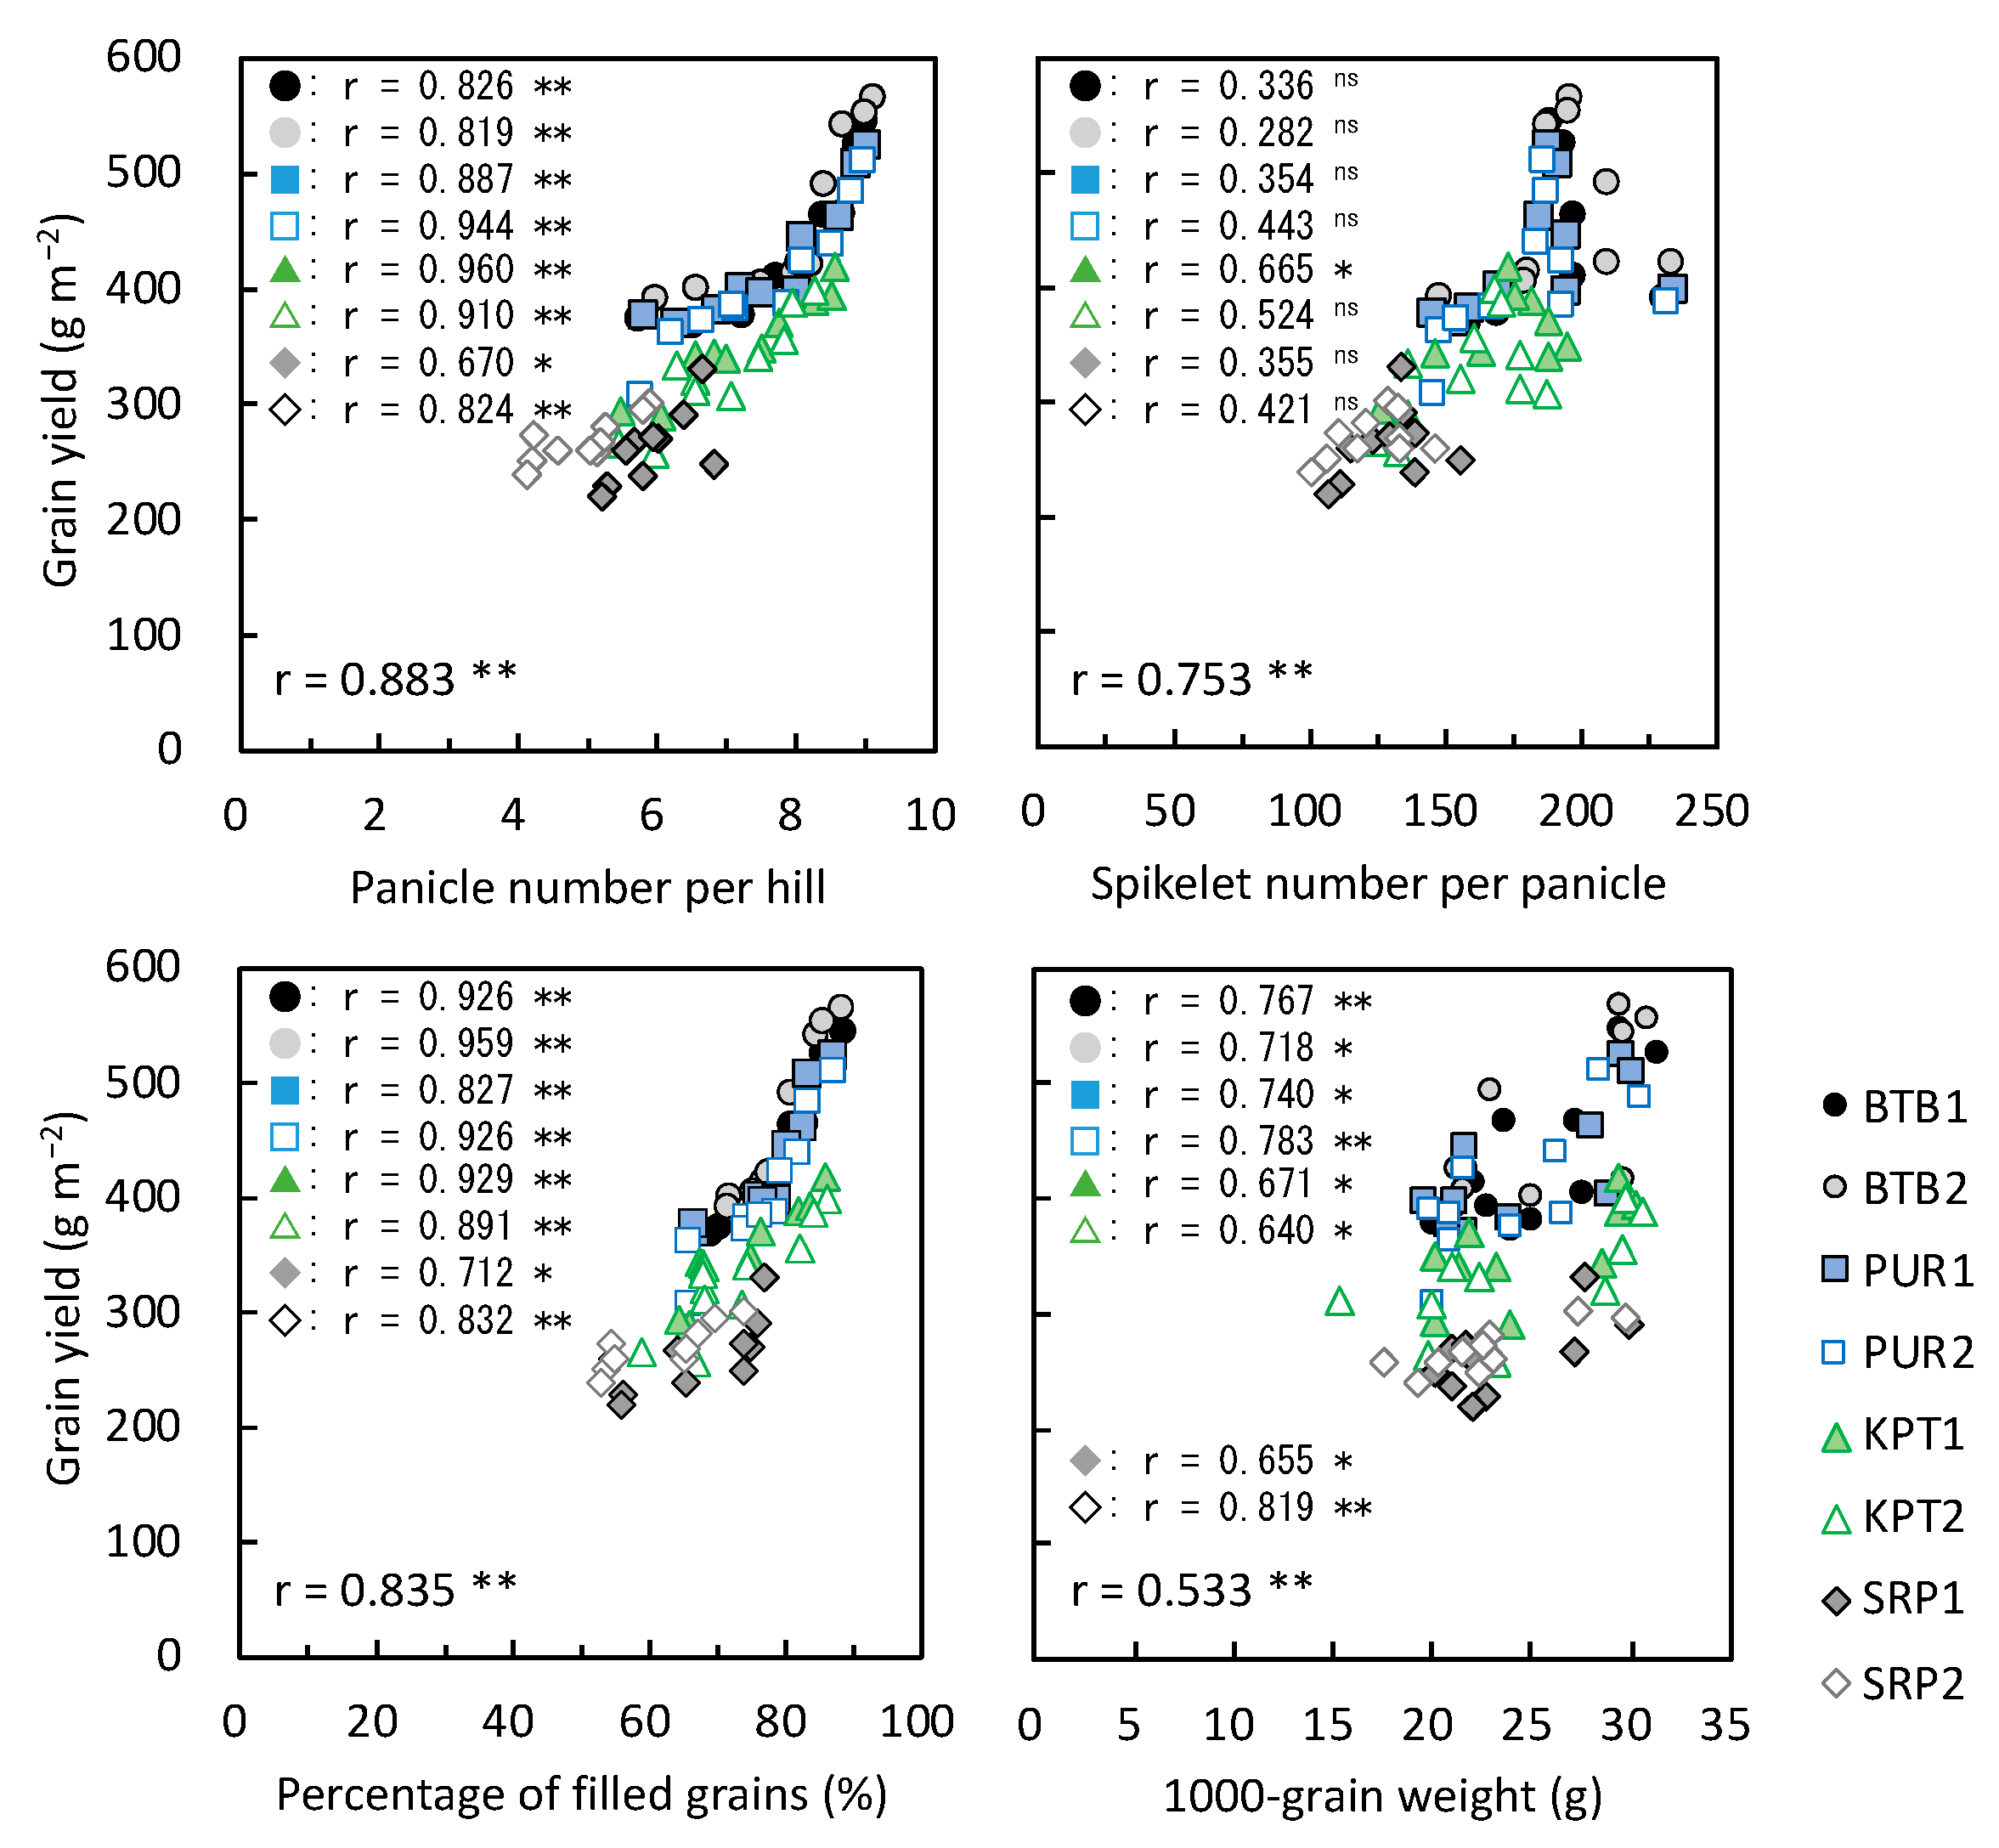
3.3. Yield-Related Traits in 2019

The grain yield and its components have large variation in the rainfed rice varieties grown at different environments. The grain yield per unit land area and its yield components are initially listed in Table 3 for comparison. The yield components and yield of the ten photoperiod-sensitive varieties across the eight environments were investigated (Table 3). The ANOVA results detected a highly significant difference for the main effects of genotype and environment on yield components; moreover, the genotype-by-environment interaction effect was significant for all these components. As shown in Table 3, the heaviest mean grain yield of 449.8 g m−2 was recorded in Phka Rumduol (G1), followed by Phka Mealdei (G4), yielding 430.4 g m−2, while the lowest mean grain yield of 309.1 g m−2 was observed in CAR11. The highest mean panicle number per hill and percentage of filled grains were observed in Phka Rumduol (G1), followed by Phka Mealdei (G4). The mean spikelet number per panicle was largest in Raing Chey (G6), and the mean 1000-grain weight was heaviest in Phka Mealdei (G4). Environment E2 (Battambang, BTB2) showed the highest mean for all yield components and grain yields, followed by E1 (BTB1). The lowest mean grain yield level was recorded in E7 and E8 in Siem Reap (Table 3). All of the yield components were high in Battambang and low in Siem Reap.
As the next analysis, the principal component test was conducted, employing various agronomic and environmental factors, such as the maximum stem number per hill; plant length at harvesting; shoot dry matter weight at heading and harvesting; panicle length; panicle number per hill; spikelet number per panicle; percentage of filled grains; 1000-grain weight; harvest index (HI); clay content; soil pH; total C, N, and P contents; cation exchange capacity (CEC); exchangeable K content; average daily mean air temperature; and accumulated precipitation during each variety’s growth period to summarize many explanatory variables into fewer indicators and identify the contribution extent of each parameter or factor to the difference in the grain yield. Three interaction principal components were extracted; the first component (PC1) and the second component (PC2) accounted for 58.1% and 15.1%, respectively, of the total variation of grain yield in the METs (Figure 3A). The loading value for PC1 was large in the clay content, exchangeable K content, CEC, and total P content (Figure 3B). Then, the loading value of precipitation for PC1 became a large value on the negative side (Figure 3B), meaning that high precipitation leads to a smaller grain yield. However, this was due to originally high precipitation from August to November in Siem Reap, which has comparatively poor natural fertility compared with the other provinces. Temperature and precipitation are known to be the key determinant factors affecting rice production in the context of climate change [36]. According to Pheakdey et al. (2017) [36], the three climate variables (TCV), that is, maximum temperature, minimum temperature, and rainfall by the Ordinary Least Squares analysis, explained approximately 63% of rice yields in the wet season, which was large compared to the results in the dry season, at 56% for the period of 1993–2012 in Cambodia. The amount of rainfall did not have a direct influence on the grain yield in the cases of these four provinces in the current study. The remaining percentage could be explained by non-climate factors such as soil fertility and other factors. In the current study, the rainfall condition was considered to have a relationship with natural soil fertility partly at the selected experimental sites as described above. The total precipitation in Siem Reap is 1072 mm in the ordinal year, the value of which is larger by approximately 30, 20, and 10%, respectively, than that of BTB, PUR, and KPT (Figure 2). As the results of the principal component test indicate, PC1 consisted of parameters relating to the environment and PC2 consisted agronomic parameters (Figure 3A,B).
In Figure 3C, the relationship between the coefficient of variance (CV) in grain yield and grain yield is shown. The CV in grain yield among the genotypes in each environment was largest by 15.1% in E2, followed by E1, and was smallest by 7.3% in E8. Additionally, the CV values showed a significantly positive correlation with the grain yield (r = 0.7171, p = 0.046). From this relationship, it can be seen that the variation in grain yield between genotypes is enlarged under fertile conditions rather than in conditions that have comparatively poor natural soil fertility. The CV in grain yield across different environments in each variety was highest by 24.0% in G4 and smallest by 15.5% in G7, values that did not show specific relationships with grain yield. The variation in grain yield depending on genotypes was apparently small in comparison with that depending on different environments. These results suggest that the eight trial environments in the current study were diverse and constituted the major cause of the heterogeneity of grain yield performances of those genotypes across the eight sites tested. This finding agrees with those of several authors who reported that environment is the main cause of the variation in yield performance [37,38,39]. Gauch and Zobel (1997) [40] stated that when the genotype-by-environment is large, genotypes should be selected for local/specific adaptation. However, the effect of genotype-by-environment interaction (GEI) was relatively small as compared with that of environment (E) and genotype (G) in the current study (Table 3).
Table 4 shows the grain yield of each variety in each environment for comparison across the varieties in each environment or across the environment in each variety. Phka Rumduol (G1) in BTB, PUR, SRP, and SRP showed grain yields (g m−2) of approximately 546 to 566, 512 to 525, 399 to 419, and 301 to 331, respectively. The grain yield was apparently high in BTB, at the same level or above in PUR, at the same or slightly lower level in KPT, and distinctively higher in SRP as compared with that in rainy rainfed fields in 2016 and 2017, as reported by Kong et al. [21]. All of the varieties used were released for rainfed conditions; Phka Mealdei (G4), CAR3 (G7), and CAR4 (G8) seem to be drought tolerant, and Phka Rumduol (G1), Phka Romeat (G2), Phka Rumdeng (G3), and CAR6 (G9) seem to be submergence tolerant (Kong, K., Director of Rice Department, General Directorate of Agriculture, MAFF of Cambodia, personal communication). As described above, the precipitation was comparatively small at the later stage of growth in 2019, while Phka Rumduol (G1), which might be recognized as submergence tolerant, showed preferable growth. Therefore, it was considered that the grain yield of all varieties in the current study in 2019 would be at ordinary levels or above their averages.
The influence of environmental differences such as natural soil fertility on grain yield was similar in all varieties used. The value tended to be large in BTB and small in SRP regardless of the variety (Table 4).
Moreover, the Pearson product–moment coefficient of the grain yield is shown in Table 5, which was performed between the locations and provinces in order to clarify the difference in the grain yield between the varieties in different environments. The correlation coefficient of the relationship in the order of grain yield among ten varieties at a single environment and that in a different environment was significantly positive in any combination. This means that high-yielding varieties in a fertile environment show comparatively high yields in poor-fertility environments or intermediate environments. In contrast, low-yielding varieties show comparatively low yields everywhere. The ideal genotypes must be both high-yielding and stable. In the current study, Phka Rumduol showed the highest grain yield in all environments (E1 to E8) and its variation depending on different environments was 22.5%, which was in the intermediate level among the ten varieties, which averaged 20.8% (Table 4, Figure 3C).

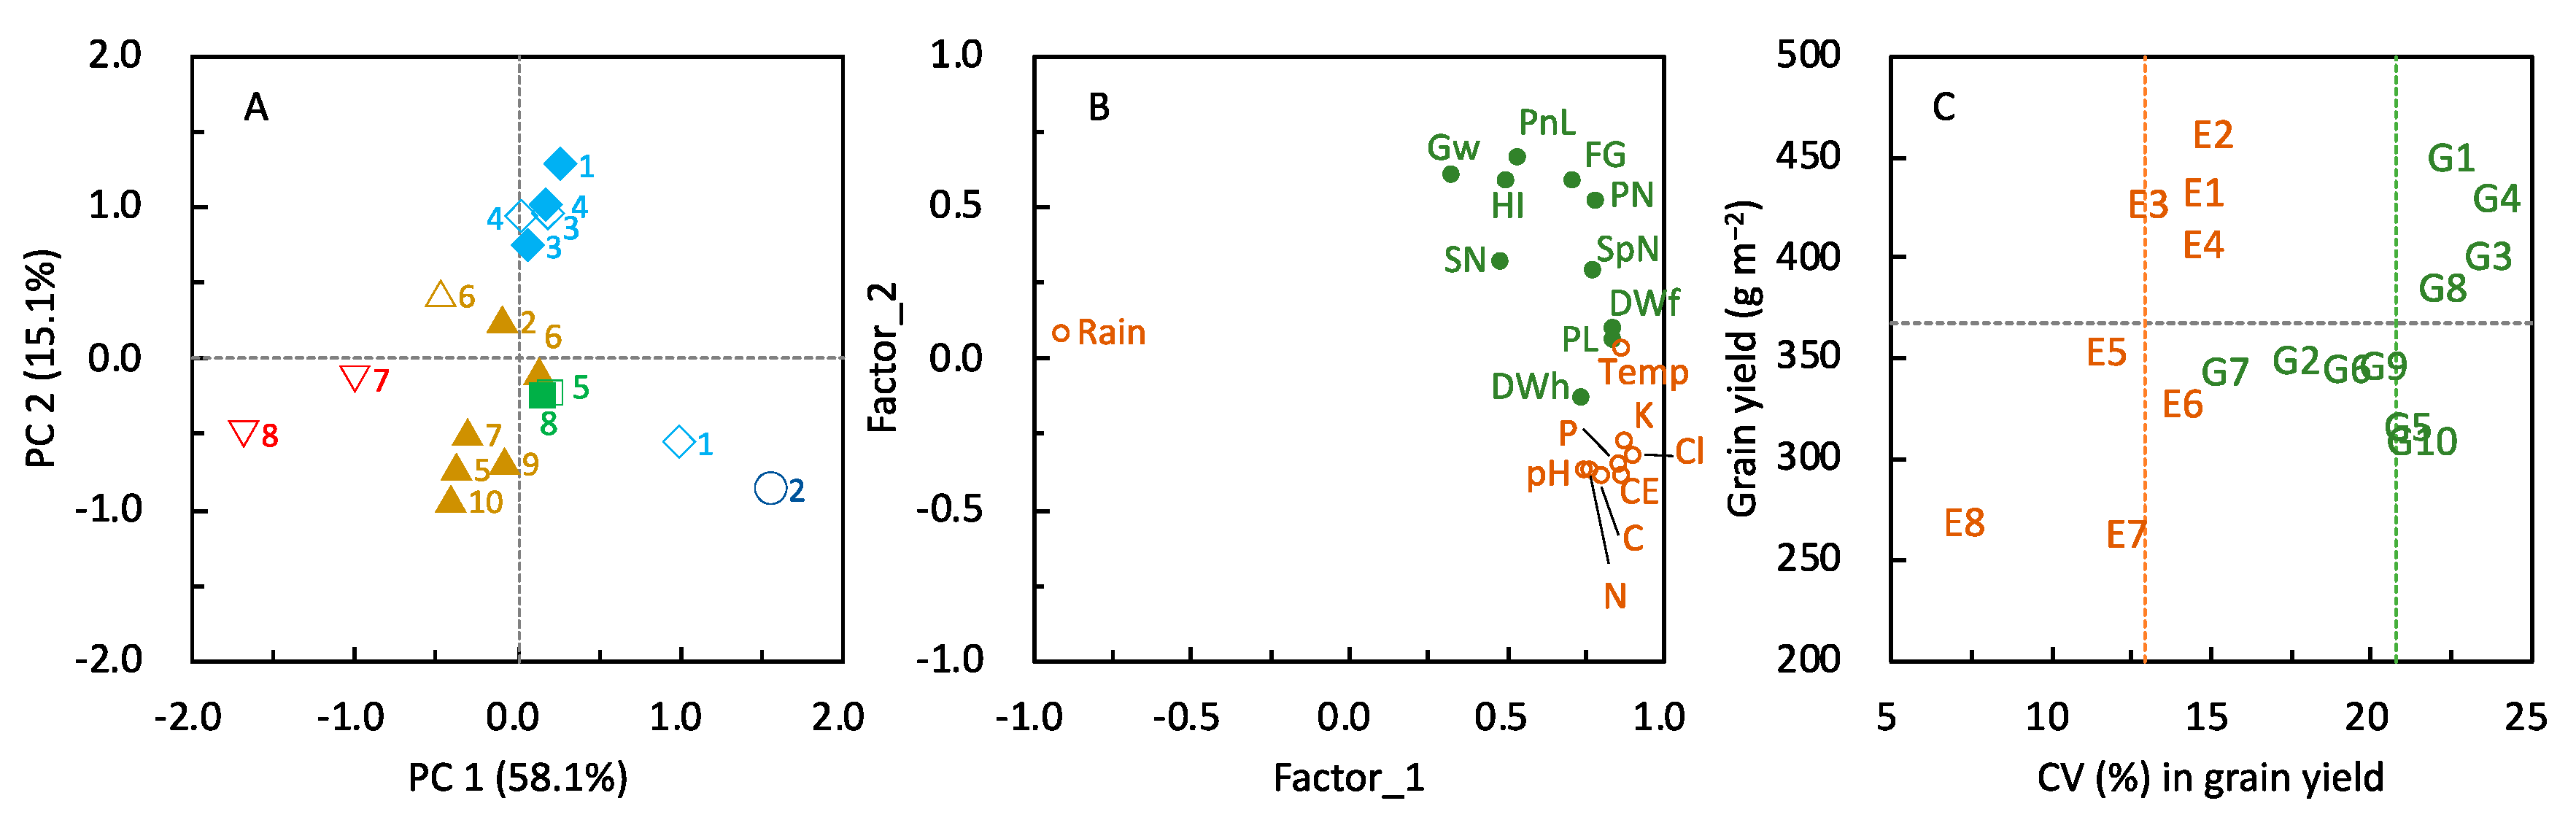
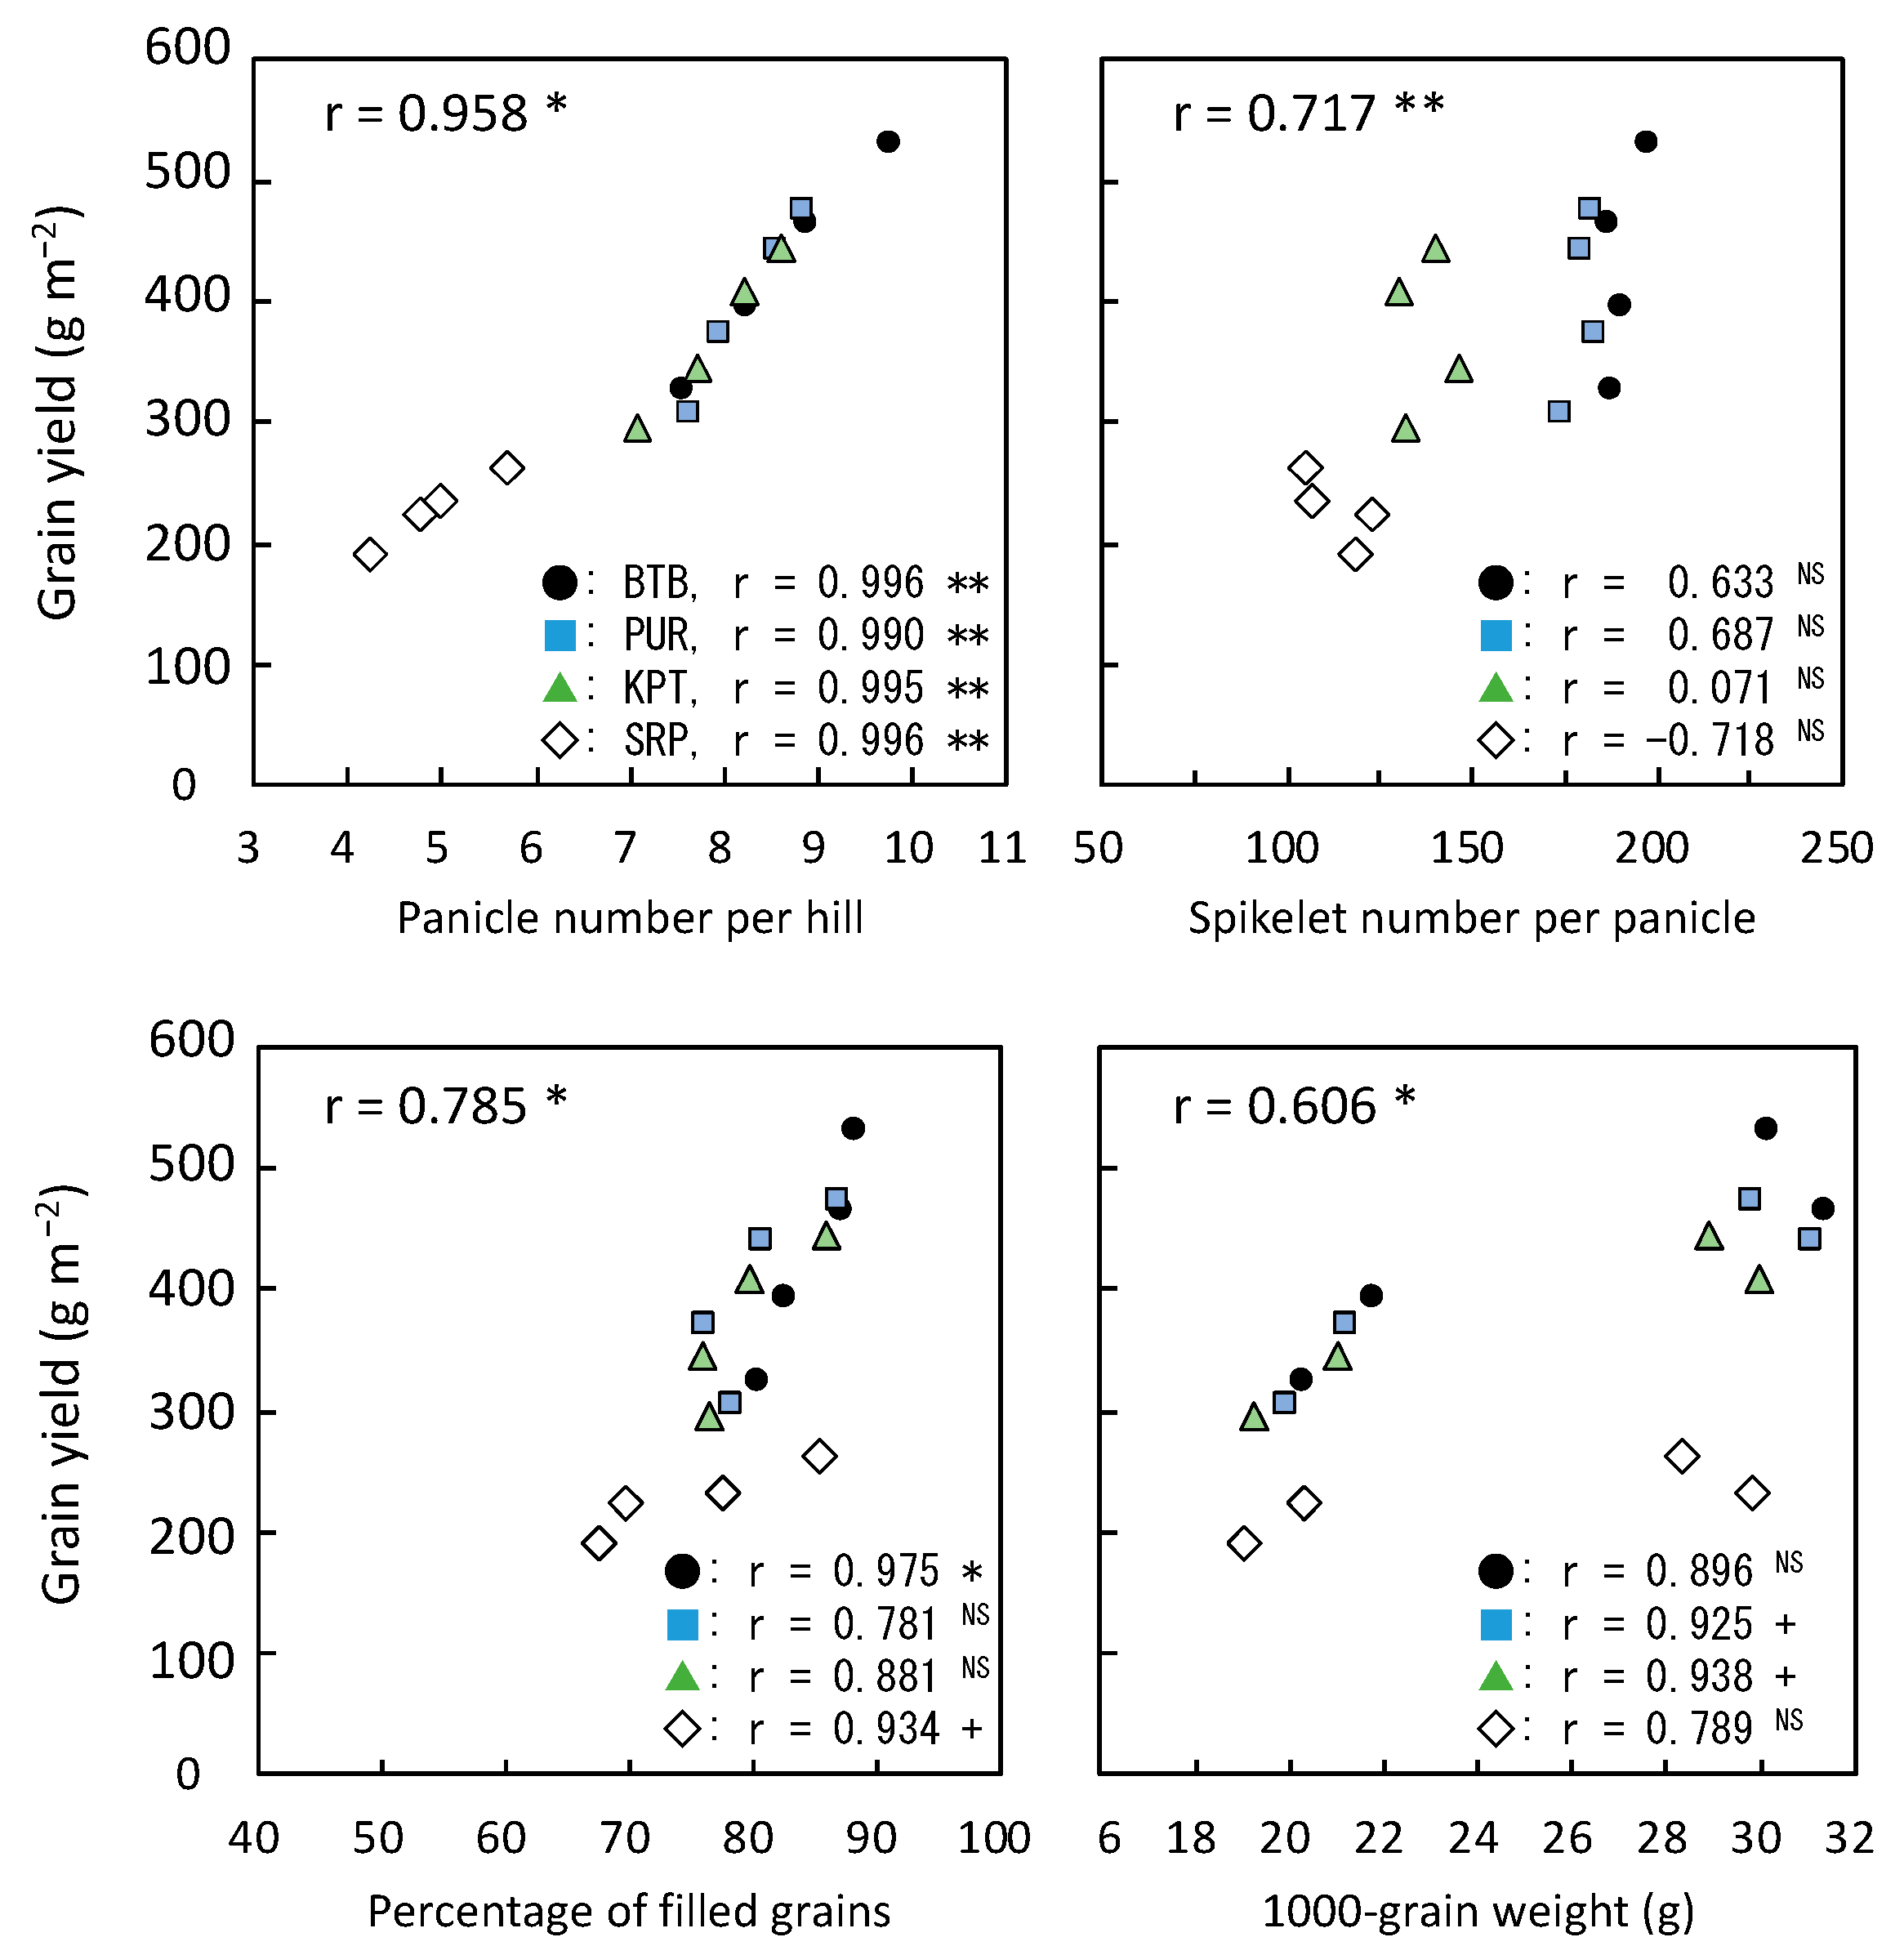
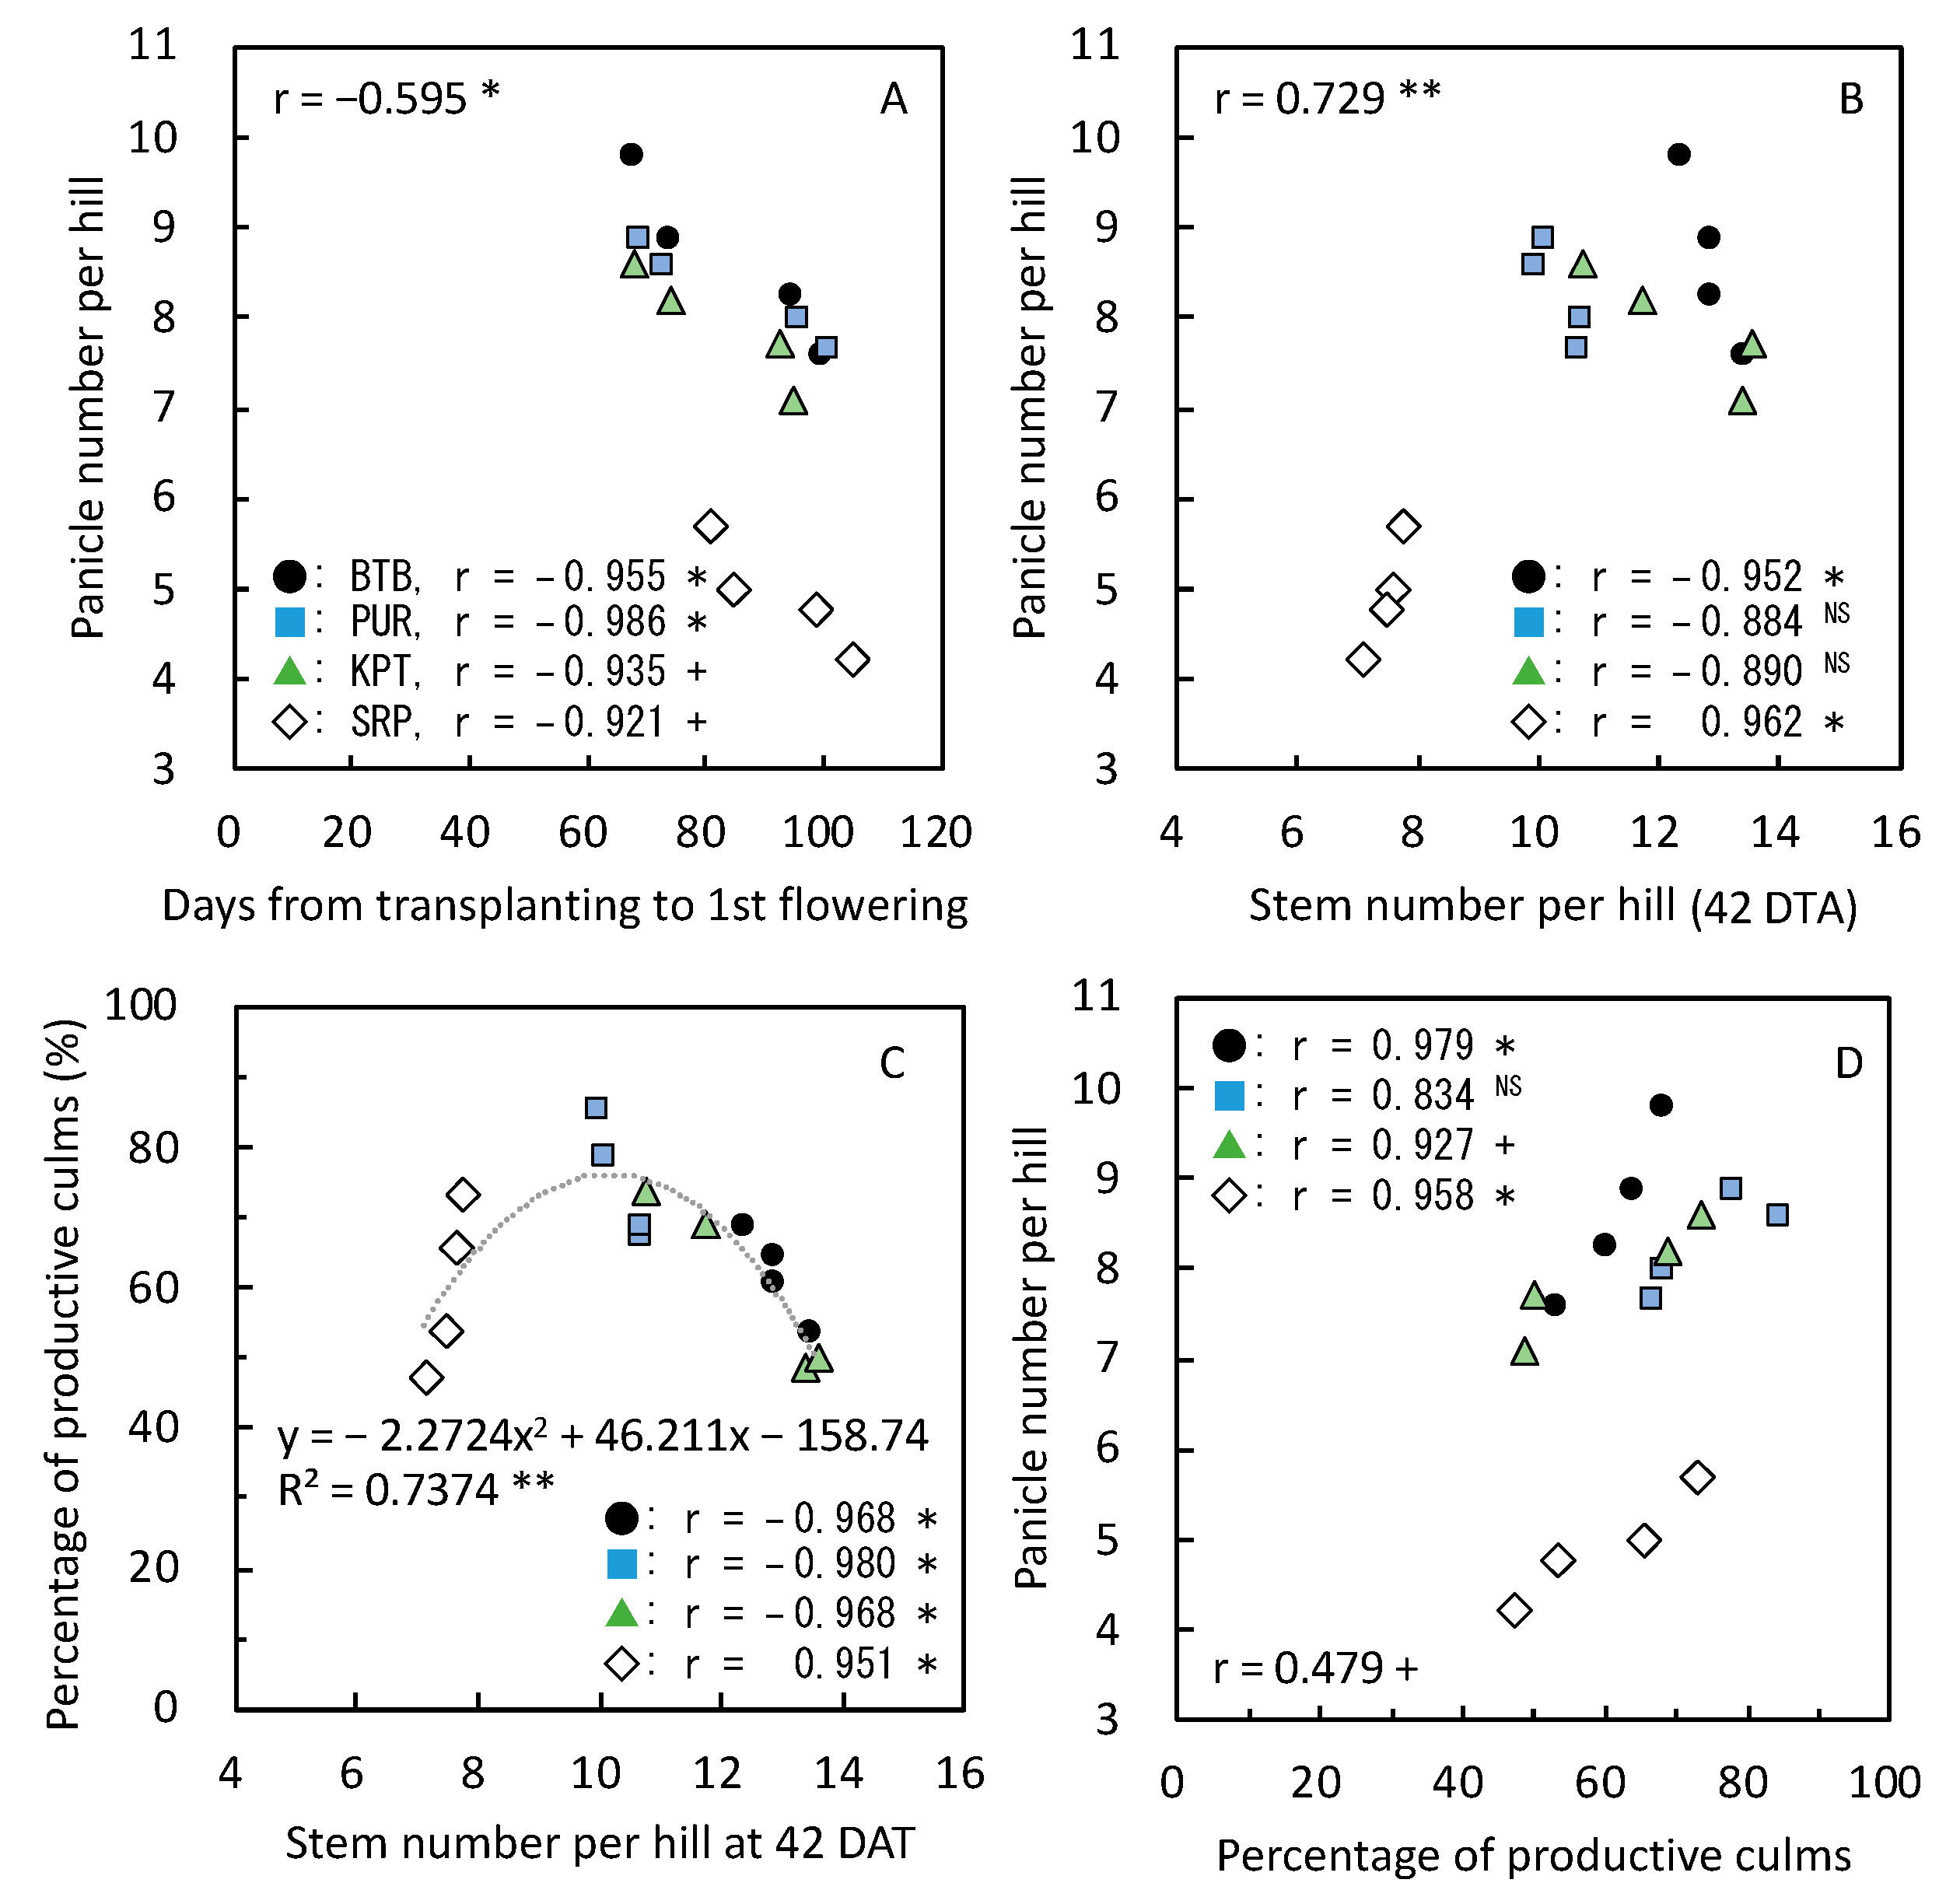
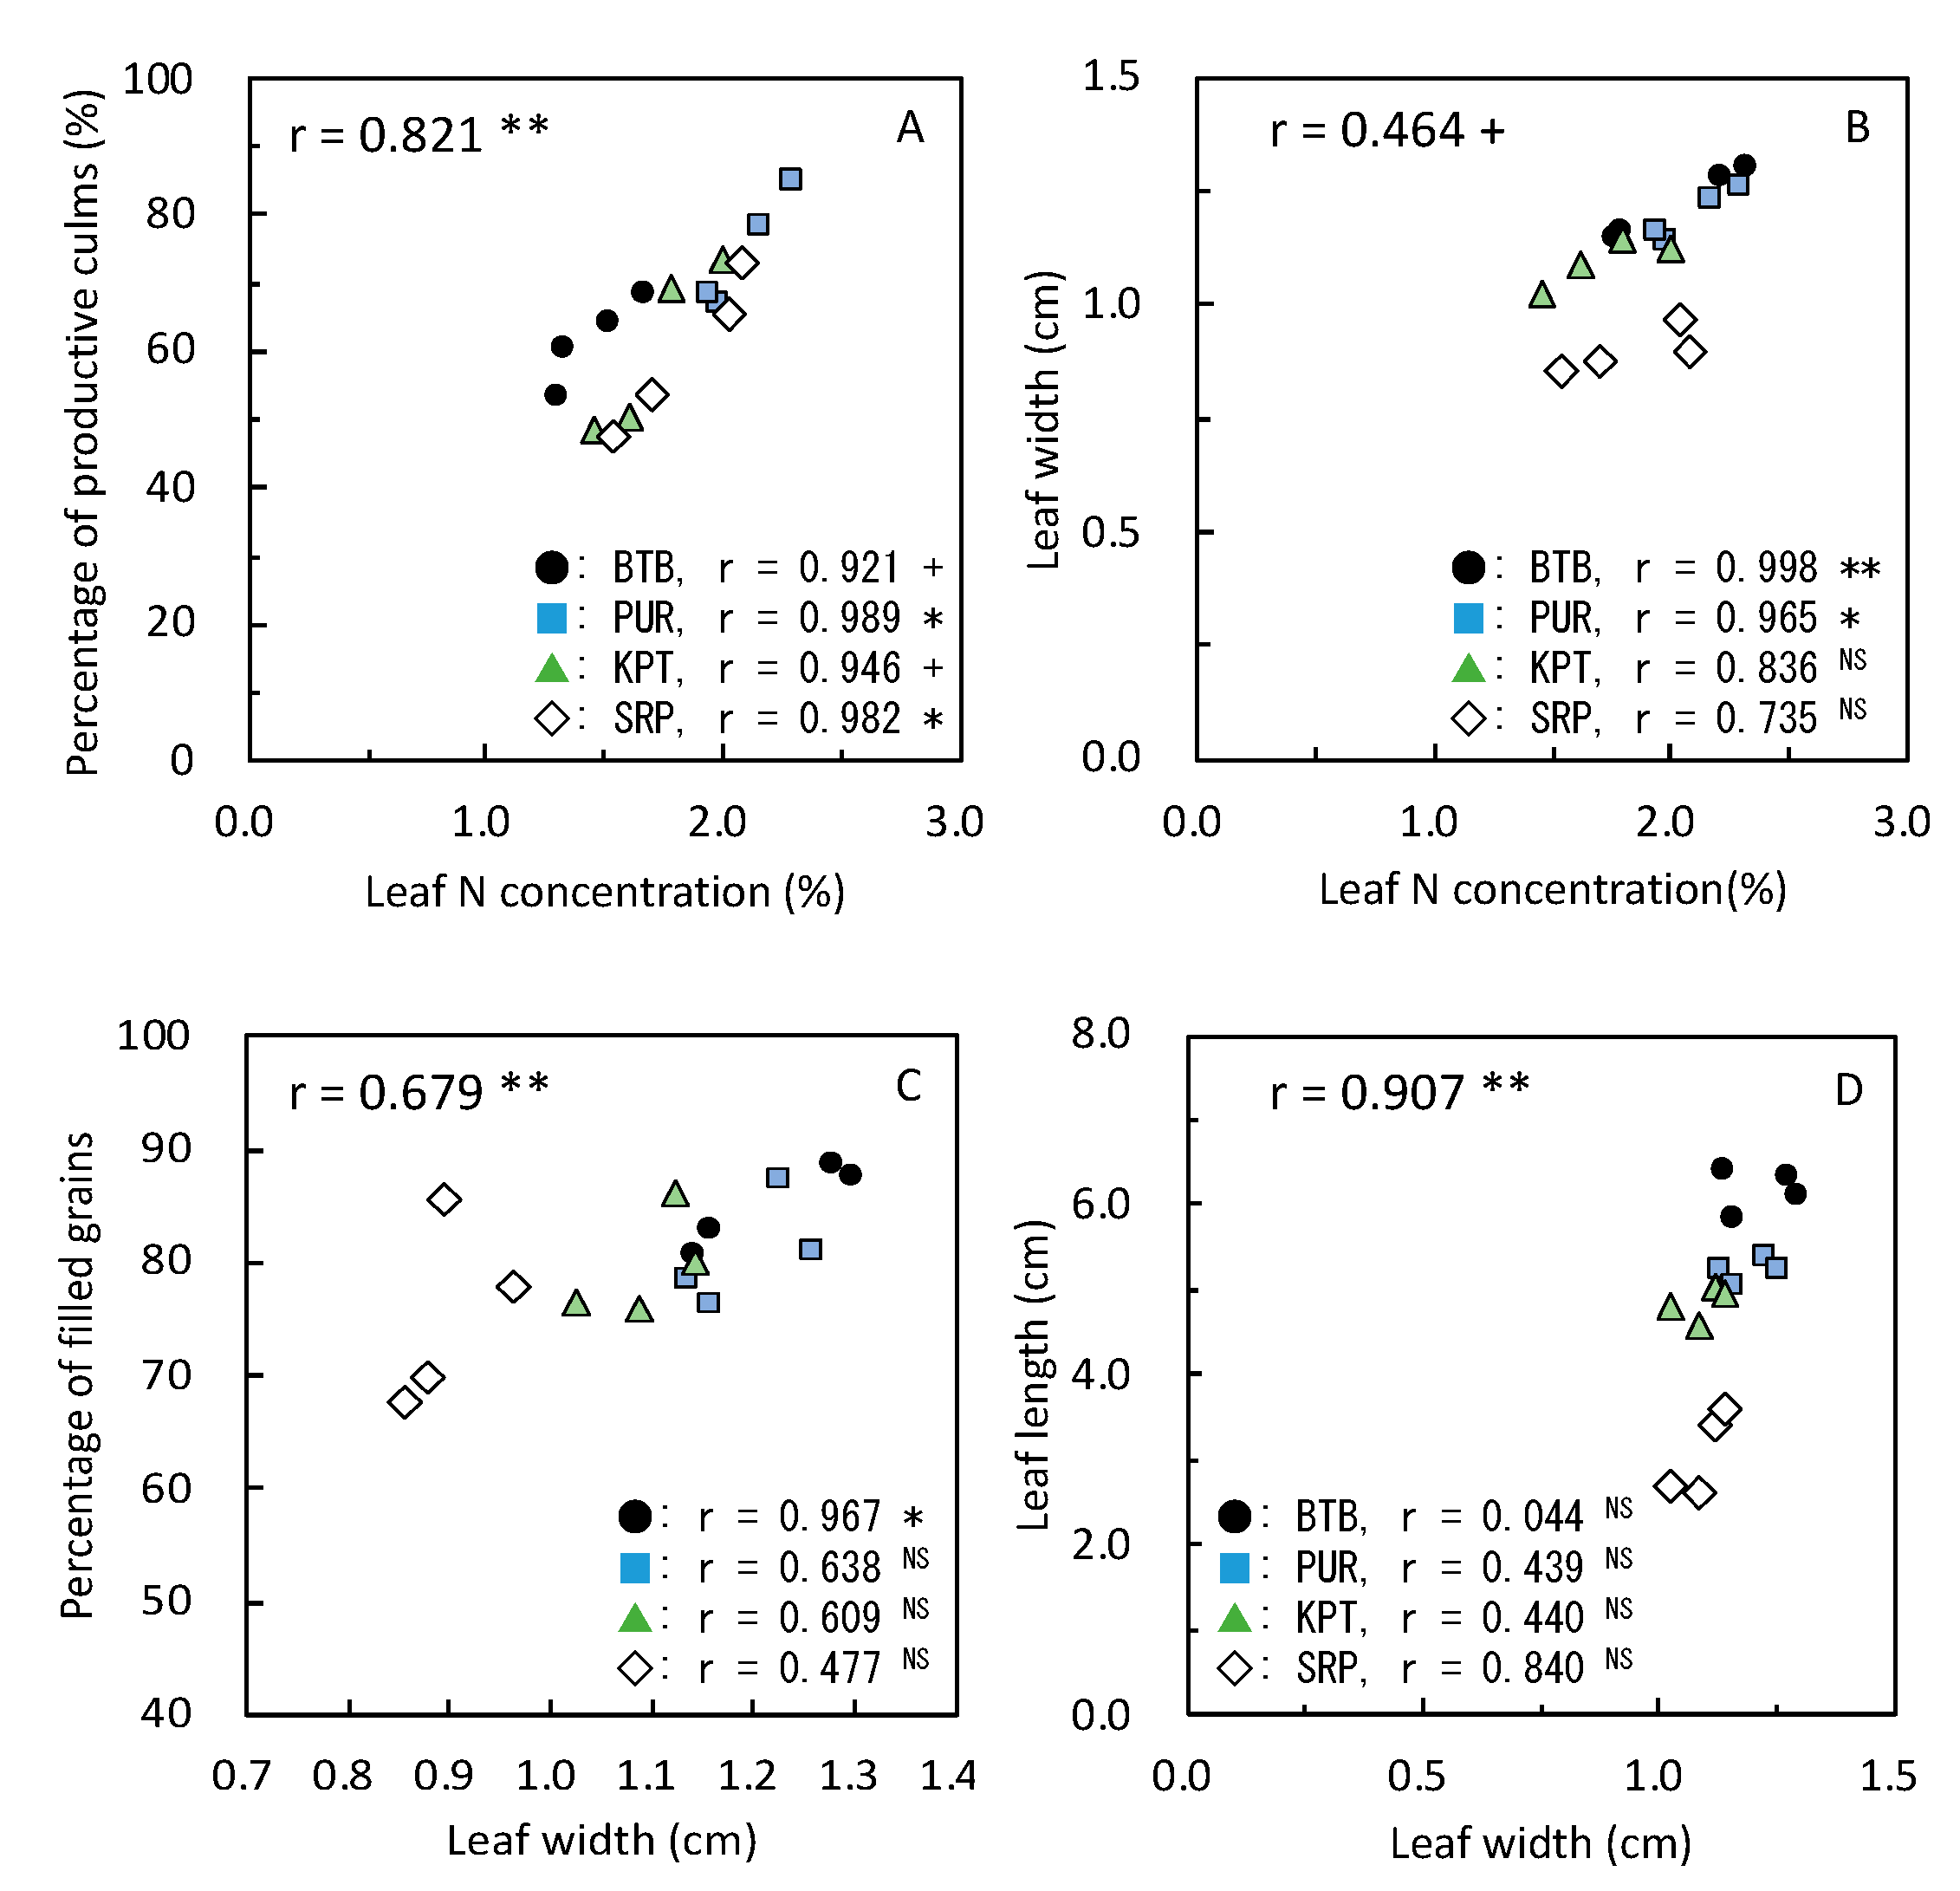
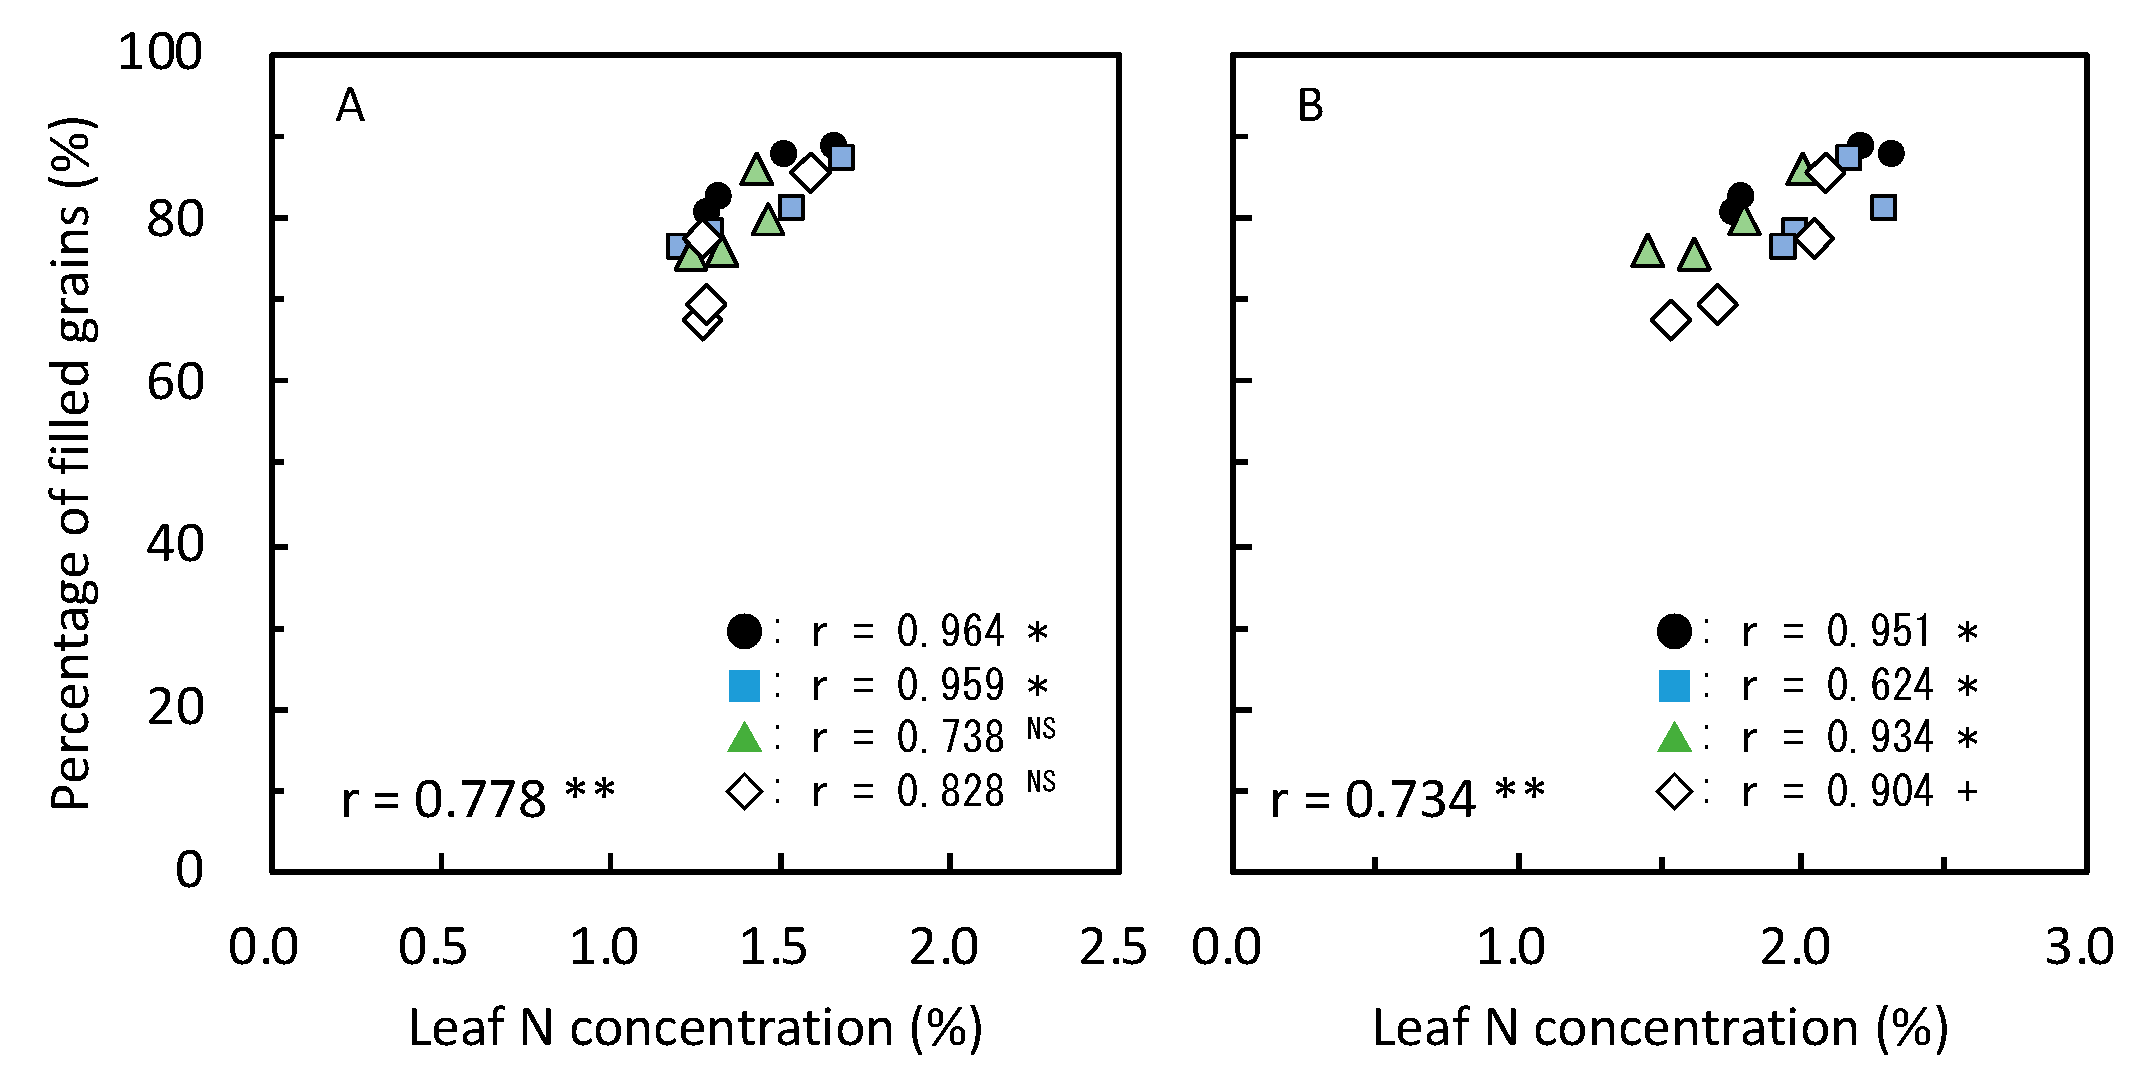
3.4. Yield-Determining Factors in 2019

The relationships between the yield components and grain yield used to investigate the yield-determining factors are shown in Figure 4. The panicle number per hill, percentage of filled grains, and 1000-grain weight showed significant positive correlations with the grain yield in all environments and in the case of all of the data pooled. On the contrary, the spikelet number per panicle showed a positive correlation with the grain yield only at E5 (KPT1). Kong et al. (2019) [19] reported with regard to the growth of a popular high-quality rice cultivar “Phka Rumduol” that the effect of location (L: four provinces where are same with the current study) X management (M: kind and amount of fertilizer) on the spikelet number per panicle was not clear during the wet season of 2017. Thus, as the next step, a multiple regression analysis was conducted with the yield components as applied variables for grain yield according to the stepwise method. The percentage of filled grains was extracted as the most important variable for explaining the difference in the grain yield at E1 (BTB1) and E1 (BTB2), where there were comparatively fertile soil conditions, and at E7 (SRP1) and E8 (SRP2), where there were comparatively poor natural soil fertility conditions (Table 6). In contrast, the panicle number per hill was extracted as the most important variable at E3 (PUR1), E4 (PUR2), E5 (KPT1), and E6 (KPT2), where there are intermediate conditions of natural soil fertility. However, the limiting factors of grain yield in each environment were not clear. Study of these ten popular photoperiod-sensitive varieties should be repeated for another year in different environments in order to confirm their real yield and stability performances. To this end, we conducted an experiment with the same concept in the following year.

3.5. Yield and Its Components with Relating Parameters in 2020

In the 2020 study, four photoperiod-sensitive varieties were examined: Phka Rumduol (G1 in 2019), which was the highest yielding variety in the previous experiment in 2019; Phka Mealdei (previous G4), which was high-yielding on a level similar to that of Phka Rumduol; CAR4 (previous G8), which was a high-yield variety after G1 and G4; and Raing Chey (previous G6), which was comparatively low yielding and is a popular variety cultivated in over 70% of provinces in Cambodia [41]. were used. These four varieties were cultivated at one site each in the four provinces and the cultivation management was the same as in 2019. Thus, similar analytical procedures as were used for 2019, such as ANOVA for investigating the influence of genotype or environment on the grain yield, its difference between the varieties or environments, the relationships between the grain yield per unit land area, and the yield components between the important yield components and agronomic parameters or plant nutrient status were employed for the results in 2020. Climate conditions such as the change in daily mean air temperature and monthly rainfall in in July to December 2020 were very similar to the average for the most recent five years, and it can be said that the rice cultivation season in 2020 was ordinal. The results of two-way factorial ANOVA for grain yield are shown in Table 7. The effects of variety (genotype: G), province (environment: E), and G × E on the grain yield were significant; the results are the same as those from the previous year 2019. The order of varieties in grain yield in each environment and that of environment in each variety are shown in Table 8. Their tendencies were similar to those determined in the previous year’s experiment (Table 4). The effect of environment on the variation in grain yield was larger than that of genotype, and this tendency was similar to that in 2019 (Table 4). As shown in Figure 2, the monthly rainfall in 2019 tended to be smaller compared to the average for the most recent 5 years except in BTB in July, KPT in September, and SRP in August and September. However, the difference in grain yield between the varieties in each province and between the provinces in each variety was confirmed to be similar in 2019 and 2020, which means the effect of the soil environment on the grain yield can be considered large compared to that of the precipitation.
The relationships between the yield components and grain yield are shown in Figure 5. The panicle number per hill had a positive correlation with the grain yield in four environments as well as in the case when all of the data were pooled. The spikelet number per panicle did not show any specific relationship with grain yield in four environments. The percentage of filled grains showed a positive relationship with yield at BTB (fertile condition) and SRP (poor fertility) and in all the data pooled, and the 1000-grain weight showed a positive relationship with the yield at PUR and KPT (comparatively intermediate fertility) and in all of the pooled data. The trend in the relationships between the yield components and grain yield was similar with that in the previous year, 2019. According to Banayo et al. (2018) [42], in the absence of any specific growth constraints, sink size (the number of spikelets m−2) is a major yield constraint for rainfed lowland rice. In the current study, the variation in spikelet number per panicle was comparatively small in sandy soil condition (SRP) rather than in the other soil types (BTB, PUR, KPT) (Figure 5). However, the difference in spikelet number per panicle between the varieties did not reflect in the difference in grain yield in any soil types. Therefore, it was considered that sink size was determined primarily by the panicle number per hill in rainfed condition in Cambodia.
Thus, we investigated the parameters that have a unique relationship with the panicle number per hill and the percentage of filled grains that were determined to be the important parameters depending on the genotype in different environments obtained by multiple regression analysis in the previous experiment (Table 6). Then, we found that the days from transplanting to the first flowering showed a negative relationship with grain yield in the four environments (Figure 6A). Additionally, the stem number per hill 42 days after transplanting (DAT) showed a negative relationship with panicle number per hill at BTB; from this, it can be understood that a smaller stem number around the maximum tillering stage in a fertile soil condition is better for securing a larger number of panicles (Figure 6B). On other hand, the stem numbers at 42DAT showed a positive correlation with panicle number per hill, which means that a larger number of stems around the maximum tillering stage should be secured for a larger number of panicles (Figure 6B). At the same time, in the relationship between the stem number per hill at 42 DAT and the percentage of productive culms, an optimal number of stems, specifically around ten stems per hill, was found to produce a preferable higher percentage of productive culms (Figure 6C). In addition, the percentage of productive culms showed a positive relationship with the panicle number per hill (Figure 6D).
Furthermore, the percentage of productive culms had a positive relationship with the leaf N concentration of the flag leaf at the late stage (after heading) (Figure 7A). Ehara et al. (1997) [43] reported that the leaf N concentration indicates the extent of nitrogen absorption capacity of each variety, especially NH4+ absorption on a root weight basis. The nitrogen concentration in rice seedlings correlates with tiller emergence [44], and the soluble nitrogen in plants is reflected by the amount of total nitrogen.
With regard to tillering [45], Ehara et al. (1992a) [46] stated that securing sufficiently high nitrogen content per unit leaf area of rice seedlings is important for attaining vigorous tillers that will become productive culms. Our current findings in the relationship between the leaf N concentration and the percentage of productive culms are in good agreement with the findings of previous reports [44,45,46]. On the other hand, the leaf N concentration tended to be in a positive relationship with the leaf width of the flag leaf blade at flowering; this correlation coefficient was significant in BTB and PUR as well as when all of the data were pooled (Figure 7B). At same time, leaf width showed a positive correlation with the percentage of filled grains in BTB (Figure 7C). In fertile soil conditions, the larger leaf width, leading to a larger leaf area, contributes to an increased percentage of filled grains through maintenance of the photosynthetic rate until a later stage of growth. Moreover, leaf width did not have a positive relationship with leaf length of the flag leaf blade at flowering in any soil environment in the current study (Figure 7D). Of course, a longer leaf blade will lead to a larger leaf area in general, although in the case of BTB the larger leaf area of the flag leaf supported by the wider leaf blade, not by the longer leaf blade, was considered to be important. Ehara et al. (1992) [47] reported that a larger leaf area supporting the elongation of the leaf blade with its erect form is preferable for attaining a higher net assimilation rate in rice plants. In the current study, we found a tendency that differed from that found in a former study [47], which showed that due to specific characteristics of Cambodian rice different varieties tend to have extremely long leaves.
Therefore, in the case of Cambodian rice varieties a larger leaf area supported by wider leaf blades will be preferable. Furthermore, the leaf N concentration after heading showed an especially positive relationship with the percentage of filled grains (Figure 8A). Then, the leaf N concentration at harvesting had a positive relationship with the percentage of filled grains in all of the environments (Figure 8B). From these results, we are certain that higher leaf nitrogen nutrition is valuable for securing a higher percentage of filled grains. However, as Khema et al. (2022) [41] suggested, a higher nitrogen concentration in rice plants leads to a higher protein concentration in the grains until the late stage of growth, which is a negative factor when discussing the quality of rice grain, that is to say, the taste of the cooked rice. It may be necessary to consider a kind of trade-off between rice grain quantity and quality for rice cropping in rainfed conditions.

4. Conclusions

Our principal component test results showed that the heterogeneity of grain yield was mainly attributable to the effect of the environment, followed by the effect of genotype. In fertile conditions, a higher percentage of filled grains was supported by the higher leaf N until late stage, with a wider flag leaf; in moderate fertility conditions, more panicles were supported by a higher percentage of productive culms with a higher leaf N until the late stage, while in conditions of poor fertility a higher percentage of filled grains were supported by higher leaf N until the late stage. These results are important for research into higher grain yields. The Phka Rumduol variety has these preferable traits, and can be expected to produce higher yields in fertile to poor natural soil fertility conditions with moderate variations. This variety may be considered more desirable and ideal due to its stability and high grain yield. Other varieties, namely, Phka Mealdei, Phka Rumdeng, and CAR4, were identified as above-average yielders. Therefore, these varieties are potentially recommended for cultivation in the rainfed lowland rice ecosystems of Cambodia. CAR4 showed moderate variation at the same level as Phka Rumduol. Thus, from the point of stability, CAR4 can be expected to excel.

Author Contributions

C.U. and H.E. conceived and designed the experiments; C.U. performed the experiments; C.U., S.R. (Siranet Roeurn) and H.E. analyzed the data; C.U., S.R. (Siranet Roeurn) and H.E. wrote the paper; S.R. (Sophoanrith Ro), M.K.-N. and A.Y. contributed by providing input for this paper. All authors have read and agreed to the published version of the manuscript.

Funding

This research was supported by Nagoya University Asian Satellite Campus Institute and the Applied Social System Institute of Asia, Nagoya University.

Institutional Review Board Statement

Not applicable.

Data Availability Statement

Not applicable.

Acknowledgments

The authors were supported by the Nagoya University Asian Satellite Campus Institute.

Conflicts of Interest

The authors declare no conflict of interest.

References

  1. Oladosu, Y.; Rafii, M.; Abdullah, N.; Hussin, G.; Ramli, A.; Rahim, H.A.; Miah, G.; Usman, M. Priciple and application of plant mutagenesis in crop improvement: A review. Biotechnol. Biotechnol. Equip. 2016, 30, 1–16. [Google Scholar]
  2. Wang, S.; Wu, K.; Yuan, Q.; Liu, X.; Liu, Z.; Lin, X.; Zeng, R.; Zhu, H.; Dong, G.; Qian, Q.; et al. Control of grain size, shape and quality by OsSPL16 in rice. Nat. Genet. 2012, 44, 950–954. [Google Scholar] [CrossRef] [PubMed]
  3. Zeng, D.; Tian, Z.; Rao, Y.; Dong, G.; Yang, Y.; Huang, L.; Leng, Y.; Xu, J.; Sun, C.; Zhang, G.; et al. Rational design of high-yield and superior-quality rice. Nat. Plants 2017, 3, 17031. [Google Scholar] [CrossRef]
  4. Gruneberge, W.J.; Manrique, K.; Zhang, D.; Hermann, M. Genotype x environment interactions for a diverse set of sweet potato clones evaluated across varying ecogeographic conditions in Peru. Crop Sci. 2005, 45, 2160–2171. [Google Scholar] [CrossRef]
  5. Horn, L.; Shimelis, H.; Sarsu, F.; Mwadzingeni, L.; Laing, M.D. Genotype-by-environment interaction for grain yield among novel cowpea (Vigna unguiculata L.) selections derived by gamma irradiation. Crop J. 2018, 6, 306–313. [Google Scholar] [CrossRef]
  6. Chandra, B.S.; Reddy, T.D.; Ansari, N.A.; Kumar, S.S. Correlation and path analysis for yield and yield components in rice (Oryza sativa L.). Agric. Sci. Dig. 2019, 29, 45–47. [Google Scholar]
  7. Chung, S.O.; Sudduth, K.A.; Chang, Y.C. Path analysis of factors limiting crop yield in rice paddy and upland corn fields. J. Biosyst. Eng. 2005, 39, 377–388. [Google Scholar]
  8. Huang, M.; Zou, Y.B.; Jiang, P.; Xia, B.; Md, I.; Ao, H.J. Relationship between grain yield and yield components in super hybrid rice. Agric. Sci. China 2011, 10, 1537–1544. [Google Scholar]
  9. Li, R.; Li, M.; Liu, S.; Zhang, J. Exploring the relationships between yield and yield-related traits for rice varieties released in China from 1978 to 2017. Front. Plant Sci. 2019, 10, 543. [Google Scholar]
  10. Yang, W.; Peng, S.; Laza, R.C.; Visperas, R.M. Yield gap analysis between dry and wet season rice crop grown under high-yielding management conditions. Agron. J. 2008, 100, 1390–1395. [Google Scholar] [CrossRef] [Green Version]
  11. Kang, M.S. Quantitative genetics, genomics and plant breeding. Ann. Bot. 2004, 93, 225. [Google Scholar] [CrossRef] [Green Version]
  12. Horn, L.; Shimelis, H.; Sarsu, F.; Mwadzingeni, L.; Laing, M.D. Genotype by environment (G × E) interaction study on yield traits in different maturity group of rice. J. Crop Sci. Biotechnol. 2019, 22, 425–449. [Google Scholar]
  13. Yan, W. GGE biplot- A windows application for graphical analysis of multi-environment trial data and other types of two-way data. Agron. J. 2001, 93, 1111–1118. [Google Scholar] [CrossRef] [Green Version]
  14. Zobel, R.W.; Wright, M.J.; Gauch, H.G. Statistical analysis of yield trail. Agron. J. 1988, 80, 388–393. [Google Scholar]
  15. Nesbitt, H.J. Rice Production in Cambodia; International Rice Research Institute: Manila, Philippines, 1997; pp. 1–112. Available online: http://books.irri.org/9712201007_content.pdf (accessed on 22 May 2023).
  16. Jones, M.; Leng, V.; Ong, S.; Mean, M. Gender Technology Assessment: Appropriate Scale Mechanization Consortium. Feed the Future. Available online: https://agrilinks.org/sites/default/files/resources/jones_leng_ong_mean_2019_ca_service_provision_tech_assessment_final.pdf (accessed on 22 May 2023).
  17. Ministry of Agriculture, Forestry and Fisheries. Annual Conference Report on Agriculture Forestry and Fisheries; Ministry of Agriculture, Forestry and Fisheries: Phnom Penh, Cambodia, 2019; pp. 1–137. [Google Scholar]
  18. Fukai, S.; Ouk, M. Increased productivity of rainfed lowland rice cropping systems of the Mekong region. Crop Pasture Sci. 2012, 63, 944–973. [Google Scholar] [CrossRef]
  19. Kong, K.; Hin, S.; Seng, V.; Ismail, A.M.; Vergara, G.; Choi, I.R.; Ehara, H.; Kato, Y. Importance of phosphorus and potassium in soil-specific nutrient management for wet-season rice in Cambodia. Exp. Agric. 2019, 56, 204–217. [Google Scholar] [CrossRef]
  20. Kong, K.; Hin, S.; Seng, V.; Ismail, A.M.; Vergara, G.; Choi, I.-R.; Ehara, H.; Kato, Y. Potential yield and nutrient requirements of direct-seeded, dry-season rice in Cambodia. Exp. Agric. 2019, 56, 255–264. [Google Scholar] [CrossRef]
  21. Kato, Y.; Katsura, K. Panicle architecture and grain number in irrigated rice, grown under different water management regimes. Field Crops Res. 2010, 117, 237–244. [Google Scholar] [CrossRef]
  22. Seng, V.; Ros, C.; Bell, R.W.; White, P.F.; Hin, S. Nutrient requirements of rainfed lowland rice in Cambodia. In Increased Lowland Rice Production in the Mekong Region; Fukai, S., Basnayake, J., Eds.; ACIAR Proceedings No. 101; Australian Centre for International Agricultural Research: Canberra, Australia, 2001; pp. 170–178. [Google Scholar]
  23. Dou, F.; Soriano, J.; Tabien, R.E.; Chen, K. Soil Texture and Cultivar Effects on Rice (Oryza sativa L.) Grain Yield, Yield Components and Water Productivity in Three Water Regimes. PLoS ONE 2016, 11, e0150549. [Google Scholar] [CrossRef] [PubMed]
  24. Zhao, C.; Chen, M.; Li, X.; Dai, Q.; Xu, K.; Guo, B.; Hu, Y.; Wang, W.; Huo, Z. Effects of Soil Types and Irrigation Modes on Rice Root Morphophysiological Traits and Grain Quality. Agronomy 2021, 11, 20. [Google Scholar] [CrossRef]
  25. Blair, G.; Blair, N. Nutrient Status of Cambodian Soils, Rationalisation of Fertiliser Recommendations and the Challenges Ahead for Cambodian Soil Science. Curr. Agric. Res. J. 2014, 2, 5–13. [Google Scholar]
  26. Becker, H.C.; Leon, J. Stability analysis in plant breeding. Plant Breed. 1988, 101, 1–23. [Google Scholar] [CrossRef]
  27. Dobermann, A.; Fairhurst, T.H. Rice: Nutrient Disorders and Nutrient Management; Potash and Phosphate Institute, International Rice Research Institute: Los Baños, Philippines, 2000; pp. 1–254. [Google Scholar]
  28. Sumi, A.; Sugata, S.; Yahiro, I.; Odawara, M. Effect of fertilizer and fixed nitrogen on the water use efficiency of genge (Astragalus sinicus L.). Plant Prod. Sci. 2015, 18, 104–110. [Google Scholar] [CrossRef] [Green Version]
  29. Skyer, J.K.; Wiliams, J.D.H.; Walker, T.W. The determination of total phosphorus in soils and parent materials. New Z. J. Agric. Res. 1968, 11, 757–762. [Google Scholar]
  30. Schollenberger, C.J.; Dreibelbis, E.R. Analytical methods in base-exchange investigations on soils. Soil Sci. 1930, 30, 161–173. [Google Scholar]
  31. Homma, K.; Horie, T.; Shiraiwa, T.; Supapoj, N.; Matsumoto, N.; Kabaki, N. Toposequential variation in soil fertility and rice productivity of rainfed lowland paddy fields in mini-watershed (Nong) in Northeast Thailand. Plant Prod. Sci. 2003, 6, 147–153. [Google Scholar] [CrossRef]
  32. Sharma, S.; Panneerselvam, P.; Castillo, R.; Manohar, S.; Raj, R.; Ravi, V.; Buresh, R.J. Web-based tool for calculating field-specific nutrient management for rice in India. Nutr. Cycl. Agroecosystems 2019, 113, 21–33. [Google Scholar] [CrossRef] [PubMed] [Green Version]
  33. White, P.; Dobermann, A.; Oberthur, T.; Ros, S. The rice soils of Cambodia, I. Soil classification for agronomists using the Cambodian Agronomic Soil Classification system. Soil Use Manag. 2000, 16, 12–19. [Google Scholar] [CrossRef]
  34. Tsubo, M.; Fukai, S.; Basnayake, J.; Tuong, T.P.; Bouman, B.; Harnpichitvitaya, D. Effects of soil clay content on water balance and productivity in rainfed lowland rice ecosystem in Northeast Thailand. Plant Prod. Sci. 2007, 10, 232–241. [Google Scholar]
  35. FAOSTAT. Electronic Database; Food and Agricultural Organization: Rome, Italy, 2020; Available online: http://www.fao.org/faostat/ (accessed on 30 June 2023).
  36. Pheakdey, D.V.; Xuan, T.D.; Khanh, T.D. Influence of climate factors on rice yields in Cambodia. Geosciences 2017, 3, 561–575. [Google Scholar]
  37. Bishwas, K.C.; Poudel, M.R.; Regmi, D. AMMI and GGE biplot analysis of yield of different elite wheat line under terminal heat stress and irrigated environment. Heliyon 2021, 7, e07206. [Google Scholar] [CrossRef]
  38. Yan, W.; Kang, M.S. GGE Biplot Analysis, A Graphical Tool for Breeders, Genetics, and Agronomist; CRC Press: Washington, DC, USA, 2003; pp. 1–225. [Google Scholar]
  39. Zewdu, Z.; Dessie, A.; Worede, F.; Atinaf, M.; Berie, A.; Tahir, Z.; Kinfe, H.; Bitew, M. Agronomic performance evaluation and yield stability analysis of upland rice (Oryza sativa L.) varieties using AMMI and GGE biplot. Plant 2020, 8, 87–92. [Google Scholar]
  40. Gauch, H.G.; Zobel, R.W. Identifying mega-environments and targeting genotypes. Crop Sci. 1997, 37, 311–326. [Google Scholar] [CrossRef]
  41. Khema, S.; Rin, S.; Fujita, A.; Kong, K.; Ngin, C.; Kano-Nakata, M.; Yamauchi, A.; Ehara, H. Grain yield and gross return above fertilizer cost with parameters relating to the quality of white rice cultivated in rainfed paddy fields in Cambodia. Sustainability 2022, 14, 10708. [Google Scholar] [CrossRef]
  42. Banayo, N.P.M.C.; Haefele, S.M.; Desamero, N.V.; Kato, Y. Site-specific nutrient management enhances sink size, a major yield constraint in rainfed lowland rice. Field Crops Res. 2018, 224, 76–79. [Google Scholar] [CrossRef]
  43. Ehara, H.; Komada, C.; Goto, M.; Morita, O. Relationship between nitrogen content in leaf dry weight basis and absorption capacity of ammonium and nitrate of rice seedlings grown under low nutrient concentration. Jap. J. Crop Sci. 1997, 66, 329–330. [Google Scholar] [CrossRef] [Green Version]
  44. Takahashi, N.; Okajima, H.; Takashiro, S.; Honda, T. Tiller emergence mechanizm in rice plant: I. Tiller emergence of rice seedlings cultivated under nitrogen deficient condition. Bull. Inst. Agric. Res. Tohoku Univ. 1956, 8, 91–117. [Google Scholar]
  45. Oshima, M. Study on nitrogen nutrition in rice plant: IV. The effect of nitrogen nutrition on tillering. Jpn. Soc. Soil Sci. Plan Nutr. 1962, 33, 243–246. [Google Scholar]
  46. Ehara, H.; Tushiya, M.; Naito, H.; Ogo, T. Effect of the high nitrogen treatment priot to transplanting on the growth and yield in rice. Jpn. J. Crop Sci. 1992, 61, 1–9. [Google Scholar] [CrossRef] [Green Version]
  47. Ehara, H.; Tushiya, M.; Hirai, Y.; Ogo, T. Varietal difference on morphological change of leaf blade by different nutrient concentration of culture solution in rice seedlings. Jpn. J. Crop Sci. 1992, 61, 10–15. [Google Scholar]
Figure 1. Relationship between clay content and total C, total N, total P, cation-exchange capacity (CEC), and exchangeable K content in soil (2019). S: 0–20 cm, D: 20–40 cm. **: significant at 0.01 probability level.
Agriculture 13 01602 g001
Figure 2. Change in daily mean temperature and precipitation during the cultivation period in each province in 2019. Diamond markers in the (left) figure and open circles in the (right) figure indicate average value for the most recent 5 years.
Agriculture 13 01602 g002
Figure 3. Relationships between PC1 and PC2 (A), between loading values in PC1 (Factor_1) and PC2 (Factor_2) (B), and between coefficients of variance (CV) in grain yield and grain yield (C). Closed symbols indicate data of G1 to G10 and open symbols indicate data of E1 to E8. Different forms of symbols indicate different yield levels (g m−2): Agriculture 13 01602 i001 ≧ 450, 450 > Agriculture 13 01602 i002 ≧ 400, 400 > Agriculture 13 01602 i004 ≧ 350, 350 > Agriculture 13 01602 i005 ≧ 300, and 300 > Agriculture 13 01602 i003 ≧ 250. SN: maximum stem number per hill; PL: plant length at harvesting; DWh: shoot dry matter weight at heading; DWf: shoot dry matter weight at harvesting; PnL: panicle length; PN: panicle number per hill; SpN: spikelet number per panicle; FG: percentage of filled grains; GW: 1000-grain weight; HI: harvest index; Cl: clay content; pH: pH(HCl); C: total C; N: total N; P: total P; CE: CEC; K: exchangeable K; Temp: average daily mean air temperature; Rain: accumulated precipitation during growth period of each variety.
Agriculture 13 01602 g003
Figure 4. Relationships between grain yield and yield components (2019). * and **: significant at 0.05 and 0.01 probability levels, respectively.
Agriculture 13 01602 g004
Figure 5. Relationships between grain yield and yield components (2020). +, *, **: significant at 0.10, 0.05, 0.01 probability level, respectively. NS: not significant.
Agriculture 13 01602 g005
Figure 6. Relationships between days from transplanting to first flowering (A), stem number per hill 42 days after transplanting (B), stem number and percentage of productive culms (C), and percentage of productive culms and panicle number per hill (D) (2020). +, *, and **: probability level at 0.10, 0.05, and 0.01, respectively. NS: not significant.
Agriculture 13 01602 g006
Figure 7. Relationships between leaf N concentration at a late growth stage and the percentage of productive culms (A), leaf N concentration at harvesting and leaf width of the flag leaf at flowering (B), leaf width and percentage of filled grains (C), and leaf width and leaf length at flowering (D) (2020). +, *, and **: probability level at 0.10, 0.05, and 0.01, respectively. NS: not significant.
Agriculture 13 01602 g007
Figure 8. Relationships between the percentage of filled grains and leaf N concentration at the late growth stage and the percentage of filled grains (A) and the leaf N concentration at harvesting (B). (2020). +, *, and **: probability level at 0.10, 0.05, and 0.01, respectively. NS: not significant.
Agriculture 13 01602 g008
Table 1. Locations and descriptions of soil classifications of the experimental sites.
Location
Environment
ProvinceVillageLatitude, LongitudeSoil Classification
E1 (BTB1)BattambangThmei12°55.039′ N, 103°8.094′ ETuol Samroung
E2 (BTB2)BattambangChong Samnay12°47.324′ N, 103°27.400′ ETuol Samroung
E3 (PUR1)PursatSen Pen12°29.467′ N, 104°2.771′ EKrakor
E4 (PUR2)PursatTbaeng Chum12°30.025′ N, 104°2.743′ EKrakor
E5 (KPT1)Kampong ThomSakream Cheung13°11.379′ N, 104°45.690′ EPrateah Lang
E6 (KPT2)Kampong ThomBoeng Lvea12°34.229′ N, 105°8.665′ EPrateah Lang
E7 (SRP1)Siem ReapTeuk Thla13°23.766′ N, 103°47.594′ EPrey Khmer
E8 (SRP2)Siem ReapPrey Thmei13°24.344′ N, 103°47.511′ EPrey Khmer
Table 2. Description of soil textures and chemical properties of the experimental sites.
ParameterSoil
Depth
E1
BTB1
E2
BTB2
E3
PUR1
E4
PUR2
E5
KPT1
E6
KPT2
E7
SRP1
E8
SRP2
pH (HCl)0–206.086.795.525.106.594.975.504.92
20–406.825.235.815.126.014.965.535.41
Total C (%)0–201.651.981.201.001.561.301.340.90
20–401.562.101.231.340.801.000.931.07
Total N (%)0–200.170.210.100.110.140.140.140.08
20–400.150.210.120.140.070.100.100.11
Total P (%)0–200.060.070.040.030.050.030.020.03
20–400.040.080.030.030.040.020.020.02
CEC (cmolc kg−1)0–2021.224.510.010.018.88.08.56.5
20–4023.520.57.58.212.57.07.08.5
Exchangeable K (cmolc kg−1)0–201.301.600.720.550.450.110.150.22
20–400.882.560.360.460.260.100.080.10
Clay (%)0–2040.150.813.115.717.314.97.52.3
20–4044.649.613.613.214.79.77.01.8
Silt (%)0–2029.817.327.434.215.711.51.32.2
20–4023.719.227.132.130.313.06.06.6
Sand (%)0–2013.117.619.319.733.640.025.339.7
20–4015.714.123.522.530.041.824.634.6
Table 3. The combined ANOVA and mean for agronomic and yield-related traits of the ten rice genotypes across the eight environments (2019).
FactorPanicle Number
Per Hill
Spikelet Number Per PaniclePercentage of Filled Grains1000-Grain Weight (g)Grain Yield (g m−2)
Variety/genotype
G1 Phka Rumduol8.17a169.6d84.1a28.9b449.8a
G2 Phka Romeat6.67g155.5g69.5g27.5c349.7e
G3 Phka Rumdeng7.71c166.1f79.6c26.8c401.1c
G4 Phka Mealdei8.00b172.1c81.2b30.5a430.4b
G5 Phka Chan Sen Sar5.86i138.9i64.4i23.0de316.4f
G6 Raing Chey7.33e201.2a75.1e20.6f345.8e
G7 CAR36.33h145.6h67.9h23.1d343.7e
G8 CAR47.39d178.4b76.3d22.1e384.9d
G9 CAR66.82f168.5e70.4f20.2f345.8e
G10 CAR115.42j130.0j63.2j20.5f309.1f
Location/environment
E1 (BTB1)7.76b182.0b78.1b25.4ab433.2b
E2 (BTB2)7.92a187.9a78.8a25.5a461.6a
E3 (PUR1)7.59c180.0c77.1c23.6bc427.2b
E4 (PUR2)7.48d177.5d76.4d24.0cd406.7c
E5 (KPT1)7.24e166.6e73.6e23.6abc353.2d
E6 (KPT2)6.92f157.3f73.0f24.0cd327.9e
E7 (SRP1)5.92g127.7g67.1g23.6d262.8f
E8 (SRP2)4.93h121.8h61.2h22.6e268.8f
F value, Probability
Genotype (G)7428.6<0.0017428.6<0.0013281.4<0.001286.1<0.001417.6<0.001
Environment (E)13,717.4<0.00113,717.4<0.0012980.2<0.00122.8<0.0011367.2<0.001
G × E89.8<0.00189.8<0.00139.4<0.0015.2<0.00110.5<0.001
Values followed by different letters are significantly different among varieties (genotypes) or between environments in each column at 0.05 probability level by Tukey’s honest significant difference test.
Table 4. Grain yield (g m−2) of ten varieties in different environments (2019).
GenotypeE1
(BTB1)
E2
(BTB2)
E3
(PUR1)
E4
(PUR2)
E5
(KPT1)
E6
(KPT2)
E7
(SRP1)
E8
(SRP2)
CV (%)
1. Phka Rumduol546.1 a B565.9 a A525.0 a C511.5 a C418.8 a D399.0 a E331.0 a F301.3 a G22.5
2. Phka Romeat403.5 cd A415.0 de A402.0 c A384.3 d B344.5 d C320.8 bc D267.5 bcd E260.0 de E17.7
3. Phka Rumdeng465.8 b B542.8 b A463.3 b B440.0 c B389.0 b C355.8 ab D270.5 bc E281.3 bc E23.7
4. Phka Mealdei526.0 a AB554.0 ab A509.3 a BC485.5 b C393.8 b D387.5 a D291.3 ab E295.8 ab E24.0
5. Phka Chan Sen Sar369.5 e B401.5 ef A370.8 d AB363.0 e B290.0 f C257.3 e D228.5 cd D250.5 ef D21.2
6. Raing Chey391.5 cde AB422.8 d A398.3 cd A388.8 d AB349.0 cd BC307.3 cd C248.8 bcd D259.3 de D19.3
7. CAR3378.5 de B406.3 def A383.0 cd B373.8 de B342.0 d C333.5 bc C260.0 bcd D272.8 cd D15.5
8. CAR4464.3 b AB491.8 c A445.8 b BC424.8 c C371.3 bc E341.5 bc E272.5 bc E268.0 cde E22.3
9. CAR6411.3 c AB423.3 d A397.5 cd AB386.3 d B339.8 d C311.0 bc C238.3 cd D259.5 de D20.4
10. CAR11375.5 de A393.0 f A377.5 cd A309.0 f B294.0 f BC265.5 de CD219.5 d E239.0 f DE21.6
CV (%)14.815.113.014.811.714.112.47.3
Values followed by different small letters are significantly different among varieties (genotypes) in each environment and those followed by different capital letters are significantly different among varieties (genotypes) in each environment at a 0.05 probability level by a Tukey’s honest significant difference test.
Table 5. The Pearson product–moment correlation coefficient of grain yield between provinces (2019).
E1 (BTB1)E2 (BTB2E3 (PUR1)E4 (PUR2)E5 (KPT1)E6 (KPT2)E7 (SRP1)E8 (SRP2)
E1 (BTB1)0.952 **0.964 **0.939 **0.939 **0.855 **0.976 **0.915 **
E2 (BTB2)0.952 **0.952 **0.988 **0.891 **0.830 **0.952 **0.867 **
E3 (PUR1)0.964 **0.952 **0.976 **0.891 **0.855 **0.915 **0.915 **
E4 (PUR2)0.939 **0.988 **0.976 **0.879 **0.842 **0.915 **0.879 **
E5 (KPT1)0.939 **0.891 **0.891 **0.879 **0.927 **0.939 **0.952 **
E6 (KPT2)0.855 **0.830 **0.855 **0.842 **0.927 **0.867 **0.976 **
E7 (SRP1)0.976 **0.952 **0.915 **0.915 **0.939 **0.867 **0.915 **
E8 (SRP2)0.915 **0.867 **0.915 **0.879 **0.952 **0.976 **0.915 **
**: significant at 0.01 probability levels.
Table 6. Results of multiple regression analysis by the stepwise method (2019).
ProvinceApplied VariableAdjusted
R Square
F =p =Unstandard CoefficientStandardized
ConstantVariable
E1 (BTB1)Percentage of filled grains0.86156.546<0.001−306.9499.4780.936
E2 (BTB2)Percentage of filled grains0.90890.103<0.001−460.51911.7040.958
E3 (PUR1)Panicle number per hill0.75528.744<0.00185.80544.9270.885
E4 (PUR2)Panicle number per hill0.87764.993<0.00126.29750.8560.944
E5 (KPT1)Panicle number per hill0.90788.623<0.00174.08938.5010.958
E6 (KPT2)Panicle number per hill0.80137.119<0.00114.14145.2780.907
E7 (SRP1)Percentage of filled grains0.4478.2650.02189.7672.5770.713
E8 (SRP2)Percentage of filled grains0.65418.0180.003141.5382.0790.832
Table 7. Results of two-way factorial ANOVA for grain yield (2020).
Factord.f.Sum of
Squared Deviation
Unbiased
Variance
F =p =
All6360.5320.961
Genotype (G)319.9966.6651484.468>0.001
Province (E)337.83012.6102808.403>0.001
G × E92.4900.27761.624>0.001
Error480.2160.005
Table 8. Grain yield (g m−2) of four varieties in four different environments (2020).
VarietyBTBPURKPTSRPCV (%)
Phka Rumduol531.0 a A473.0 a B445.0 a C263.0 a D27.0
Phka Mealdei464.0 b A405.0 b B409.0 b C234.0 b D26.4
Raing Chey325.0 d A305.0 d B296.0 d B192.0 c C21.3
CAR 4394.0 c A372.0 c B346.0 c C224.0 b D22.7
CV (%)20.718.017.712.8
Values followed by different small letters are significantly different among varieties (genotypes) in each environment, and those followed by different capital letters are significantly different among varieties (genotypes) in each environment at a 0.05 probability level by a Tukey’s honest significant difference test.
Disclaimer/Publisher’s Note: The statements, opinions and data contained in all publications are solely those of the individual author(s) and contributor(s) and not of MDPI and/or the editor(s). MDPI and/or the editor(s) disclaim responsibility for any injury to people or property resulting from any ideas, methods, instructions or products referred to in the content.

