Article

Effects of Dietary Bacillus subtilis BC02 Supplementation on Growth Performance, Antioxidant Capacity, and Cecal Microbes in Broilers

1
Key Laboratory of Efficient Utilization of Non-Grain Feed Resources (Co-Construction by Ministry and Province), Ministry of Agriculture and Rural Affairs, Shandong Agricultural University, Tai’an 271018, China
2
Shandong Taishan Shengliyuan Group Co., Ltd., Tai’an 271000, China
3
Fushan Livestock and Veterinary Station, Zhaoyuan 265400, China
*
Authors to whom correspondence should be addressed.
These authors contributed equally to this work.
Agriculture 2023, 13(8), 1561; https://doi.org/10.3390/agriculture13081561
Submission received: 18 July 2023 / Revised: 1 August 2023 / Accepted: 2 August 2023 / Published: 4 August 2023
(This article belongs to the Section Farm Animal Production)

Abstract

:
This study investigated the effects of Bacillus subtilis BC02 supplementation on broiler performance, antioxidant capacity, and cecal microbes. A total of 288 one-day-old Arbor Acres broilers were randomly divided into three groups. The control group were fed a basal diet, and experimental groups were fed a basal diet supplemented with 250 and 500 mg/kg Bacillus subtilis BC02 (BS250 and BS500), respectively. The results showed that Bacillus subtilis BC02 supplementation increased the average daily feed intake but decreased the feed to gain ratio in broilers from 0 to 14, 0 to 28, and 0 to 42 days. Meanwhile, BS500 significantly decreased triglyceride and serum urea nitrogen levels compared with the control and BS250 groups (p < 0.05). Moreover, diet supplemented with 500 mg/kg Bacillus subtilis BC02 improved the antioxidant capacity by increasing the serum and jejunum levels of superoxide dismutase and glutathione, decreasing that of malondialdehyde and increasing the jejunum mRNA expression of SOD2, CAT, GPX1, and Nrf2 (p < 0.05). Dietary Bacillus subtilis BC02 supplementation increased the villus height, velvet concealed ratio, and the mRNA expressions of IL-2, IL-4, IL-10, and IL-12 (p < 0.05). In addition, the Bacteroidota, Proteobacteria, Helicobacter, and Prevotellaceae UCG-001 were significantly increased (p < 0.05) in the BS500 group. In conclusion, dietary Bacillus subtilis BC02 supplementation can improve the growth performance, antioxidant capacity, and intestinal microflora abundances in broilers.

1. Introduction

Antibiotics as a feed additive can effectively prevent livestock diseases and improve feed conversion rate and growth performance [1]. However, long-term use of antibiotics can cause resistance in poultry, reducing the ability of animals to resist disease-causing microorganisms [2,3]. With the ban of antibiotics, finding a new product that can replace antibiotics has attracted increased attention [4]. Probiotics are regarded as a good substitute for antibiotics, widely applied to the poultry industry [5,6,7]. Bacillus subtilis, as a safe and reliable probiotic, plays a crucial role in replacing antibiotics [8].
Bacillus subtilis BC02 is an oxygen-consuming Gram-positive bacterium with the advantages of strong tolerance and no drug resistance [9,10]. Studies have suggested that the dietary addition of Bacillus subtilis can improve the growth performance, antioxidant and immune capacity, and maintain intestinal microbial balance [11,12,13,14,15]. Meanwhile, Bacillus subtilis can produce a variety of bioactive molecules, such as digestive enzymes and antimicrobial peptides [16]. In addition, the equilibrium of gut microbes is critical for poultry growth and immunity [17,18]. Numerous studies have demonstrated that the supplementation of probiotics early in growth improves broiler growth performance, antioxidant capacity, as well as alters the microflora structure of the cecal microbiome of broilers [19,20,21].
However, most Bacillus subtilis species have slow growth rates and intestinal germination colonization in poultry. In the current study, Bacillus subtilis BC02 was isolated and bred from the intestinal tract of healthy animals and obtained by liquid submerged fermentation and drying, which is rich in Bacillus subtilis BC02 endospores. The objective of this experiment was to explore the influences of Bacillus subtilis BC02 on the growth performance, antioxidant capacity, and cecal microbes of broilers.

2. Materials and Methods

2.1. Experimental Design and Layers Management

A total of 288 one-day-old AA (Arbor Acres, 42 ± 0.5 g) male broilers were randomly assigned to 3 treatments (6 replicates and 16 broilers per replicate). The control group was fed a basal diet and the treatment groups were fed a basal diet supplemented with 250 and 500 mg/kg Bacillus subtilis BC02 (BS250 and BS500), respectively. The Bacillus subtilis BC02 was provided by Shanghai Bangcheng Bioengineering Co., Ltd. (Shanghai, China), with endospore content ≥ 4.0 × 10⁹ cfu/g. The diets were formulated according to the Feeding Standard of Chicken of the People’s Republic of China, NY/T 33-2004 [22], and the details are provided in Table 1.
The broilers were raised in special cages for broilers in a closed temperature-controlled chicken house, with an unlimited supply of feed and water, and the health status of the broilers was observed every day. The broilers were managed according to AA broiler management guidelines [23]. The average daily feed intake (ADFI), average daily gain (ADG), and feed/gain ratio (F/G) was recorded on d 14, d 28, and d 42.

2.2. Sampling Collection

On day 42, two broilers near the average body weight (BW) from each repeat were selected and fasted for 12 h. The broilers were humanely slaughtered after brachial wing vein blood was collected, and the serum was then obtained by centrifugation (3500× g, 15 min) and stored at −20 °C until analysis.
After slaughtering, the jejunum was separated, washed, and stored at −80 °C for mRNA analysis to be conducted. In addition, an approximately 3 cm middle jejunum was fixed in paraformaldehyde at a concentration of 4% (w/v) to analyze intestinal morphology according to the methods described in a previous study [24].
The cecum was ligated with sterile hemp rope, and 2 mL of cecal contents were placed in a cryopreservation tube and stored at −80 °C for cecal microbes analysis.

2.3. Serum Biochemistry

The triglyceride (TG), total cholesterol (TCHO), glucose (GLU), serum urea nitrogen (SUN), and total protein (TP) on serum were analyzed in a Cobus Mira plus automatic biochemical analyzer (Roche, Cobus MIRA Plus, Roche Diagnostic System Inc., United States) according to the methods described in Liu et al. (2022) [25].

2.4. Antioxidant Capacity of Serum and Jejunum

Superoxide dismutase (SOD), malondialdehyde (MDA), and glutathione (GSH) in serum and jejunum were determined according to the kits (Jiancheng Biotechnology Co., Ltd., Jiangsu, China).

2.5. Jejunal Morphological Observation

A microtome was used to slice the fixed jejunum to a thickness of 5 μm while it was submerged in a rotating paraffin microtome (HM355S, Burton International Trading Co., Ltd., Shandong, China). Afterwards, the samples were stained using a stainer (A81500101, Thermo Scientific, Chadwick Road, Asttmoor, Runccorn, Cheshire, UK) and sealed with neutral resin. With the aid of a microscope (Nikon elipse 80i, Nikon, Tokyo, Japan) and after being photographed, the jejunum morphology was observed. An image analyzer (Motic images 2000.1.3, Lucia software, Zadrahau) was used to measure 10 well-oriented villi which were measured for villus height, crypt depth for each example, and for the calculation of the ratio of villi to crypts.

2.6. Quantitative Real-Time PCR Analysis

Real-time quantitative PCR analysis was conducted according to the previous study [26]. The utilized the kit to extract the total RNA from the broiler jejunum and converted the RNA to cDNA for a quantitative PCR experiment. β-actin was used as the internal control. The 2−△△CT method was applied to calculate the relative expression of mRNA of the detected genes. The used primer sequences are shown in Table 2.

2.7. Cecal Microbial Sequencing

The microbial DNA from the cecal contents was extracted using the E.Z.N.A.® Soil DNA Kit (Omega Biotek, Buffalo, NY, USA). Further, the extracted DNA concentration and purity were analyzed by TBS-380 (Turner BioSystems, Sunnyvale, CA, USA) and NanoDrop2000 (Thermo Fisher Scientific, Waltham, MA, USA), respectively. The detected OD value (260/280) between 1.7 and 2.0 was qualified. The DNA integrity was detected by 1% agarose gel electrophoresis. Qualified microbial DNA samples were used for subsequent sequencing. The V4 hypervariable 16S rRNA gene region was amplified by PCR utilizing DNA as the template and barcoded fusion primers [forward primer: 520 (5-AYTGGGYDTAAAGNG-3), reverse primer: 802 (5-TACNVGGGTATCTAATCC-3)]. Library construction on-machine sequencing was performed using the Tru Seq® DNA PCR-Free Sample Preparation Kit (Illumina, USA). On-machine sequencing was conducted using HiSeq2500 PE2500 (Beijing Nuohe Zhiyuan Technology Co., Ltd., Beijing, China). Splicing, quality control, and chimera filtering were performed on the sequencing data to obtain valid data for analysis. The valid data of all samples were clustered into operational units (OTUs) according to 97% consistency, and the representative sequences of OTUs were clustered.
The NCBI sequence Read Archive (Illumina sequences) has all the sequencing dates available under the accession number PRJNA848930.

2.8. Statistical Analysis

Growth performance, serum biochemistry, serum and jejunum antioxidants, jejunum villus morphology, and mRNA expression data were obtained using the General Linear Model (GLM) in SAS 9.4 (SAS Institute Inc., Cary, NC, USA), and the variations among the treatments were compared with Tukey’s multiple range test. The mean and standard error of the mean (SEM) were used to present the results. Every statement of significance was predicated on the likelihood that p < 0.05. A one-way ANOVA was used to assess the four indices of Chao1, ACE, Shannon, and Simpson’s alpha diversity, and Duncan’s test was used to compare the differences (p < 0.05). The correlation analysis between the growth performance, serum biochemistry, serum and jejunal antioxidants, jejunum villus morphology, mRNA expression data, and cecal microbial data was carried out by IBM SPSS Statistics 23 (version 23.0, Chicago, IL, USA), and p < 0.05 was considered to be significantly different.

3. Results

3.1. Growth Performance

The growth performance of broilers is shown in Table 3. Compared with the control group, the ADG in the BS250 and BS500 group increased and F/G reduced at 0–14 d (p < 0.05). Moreover, the BS500 treatment resulted in a lower F/G at 0–28 d and 0–42 d than the control group (p < 0.05). There was no significant difference in ADG and ADFI between the control, BS250, and BS500 groups at 15–28 d, 29–42 d, 0–28 d, and 0–42 d.

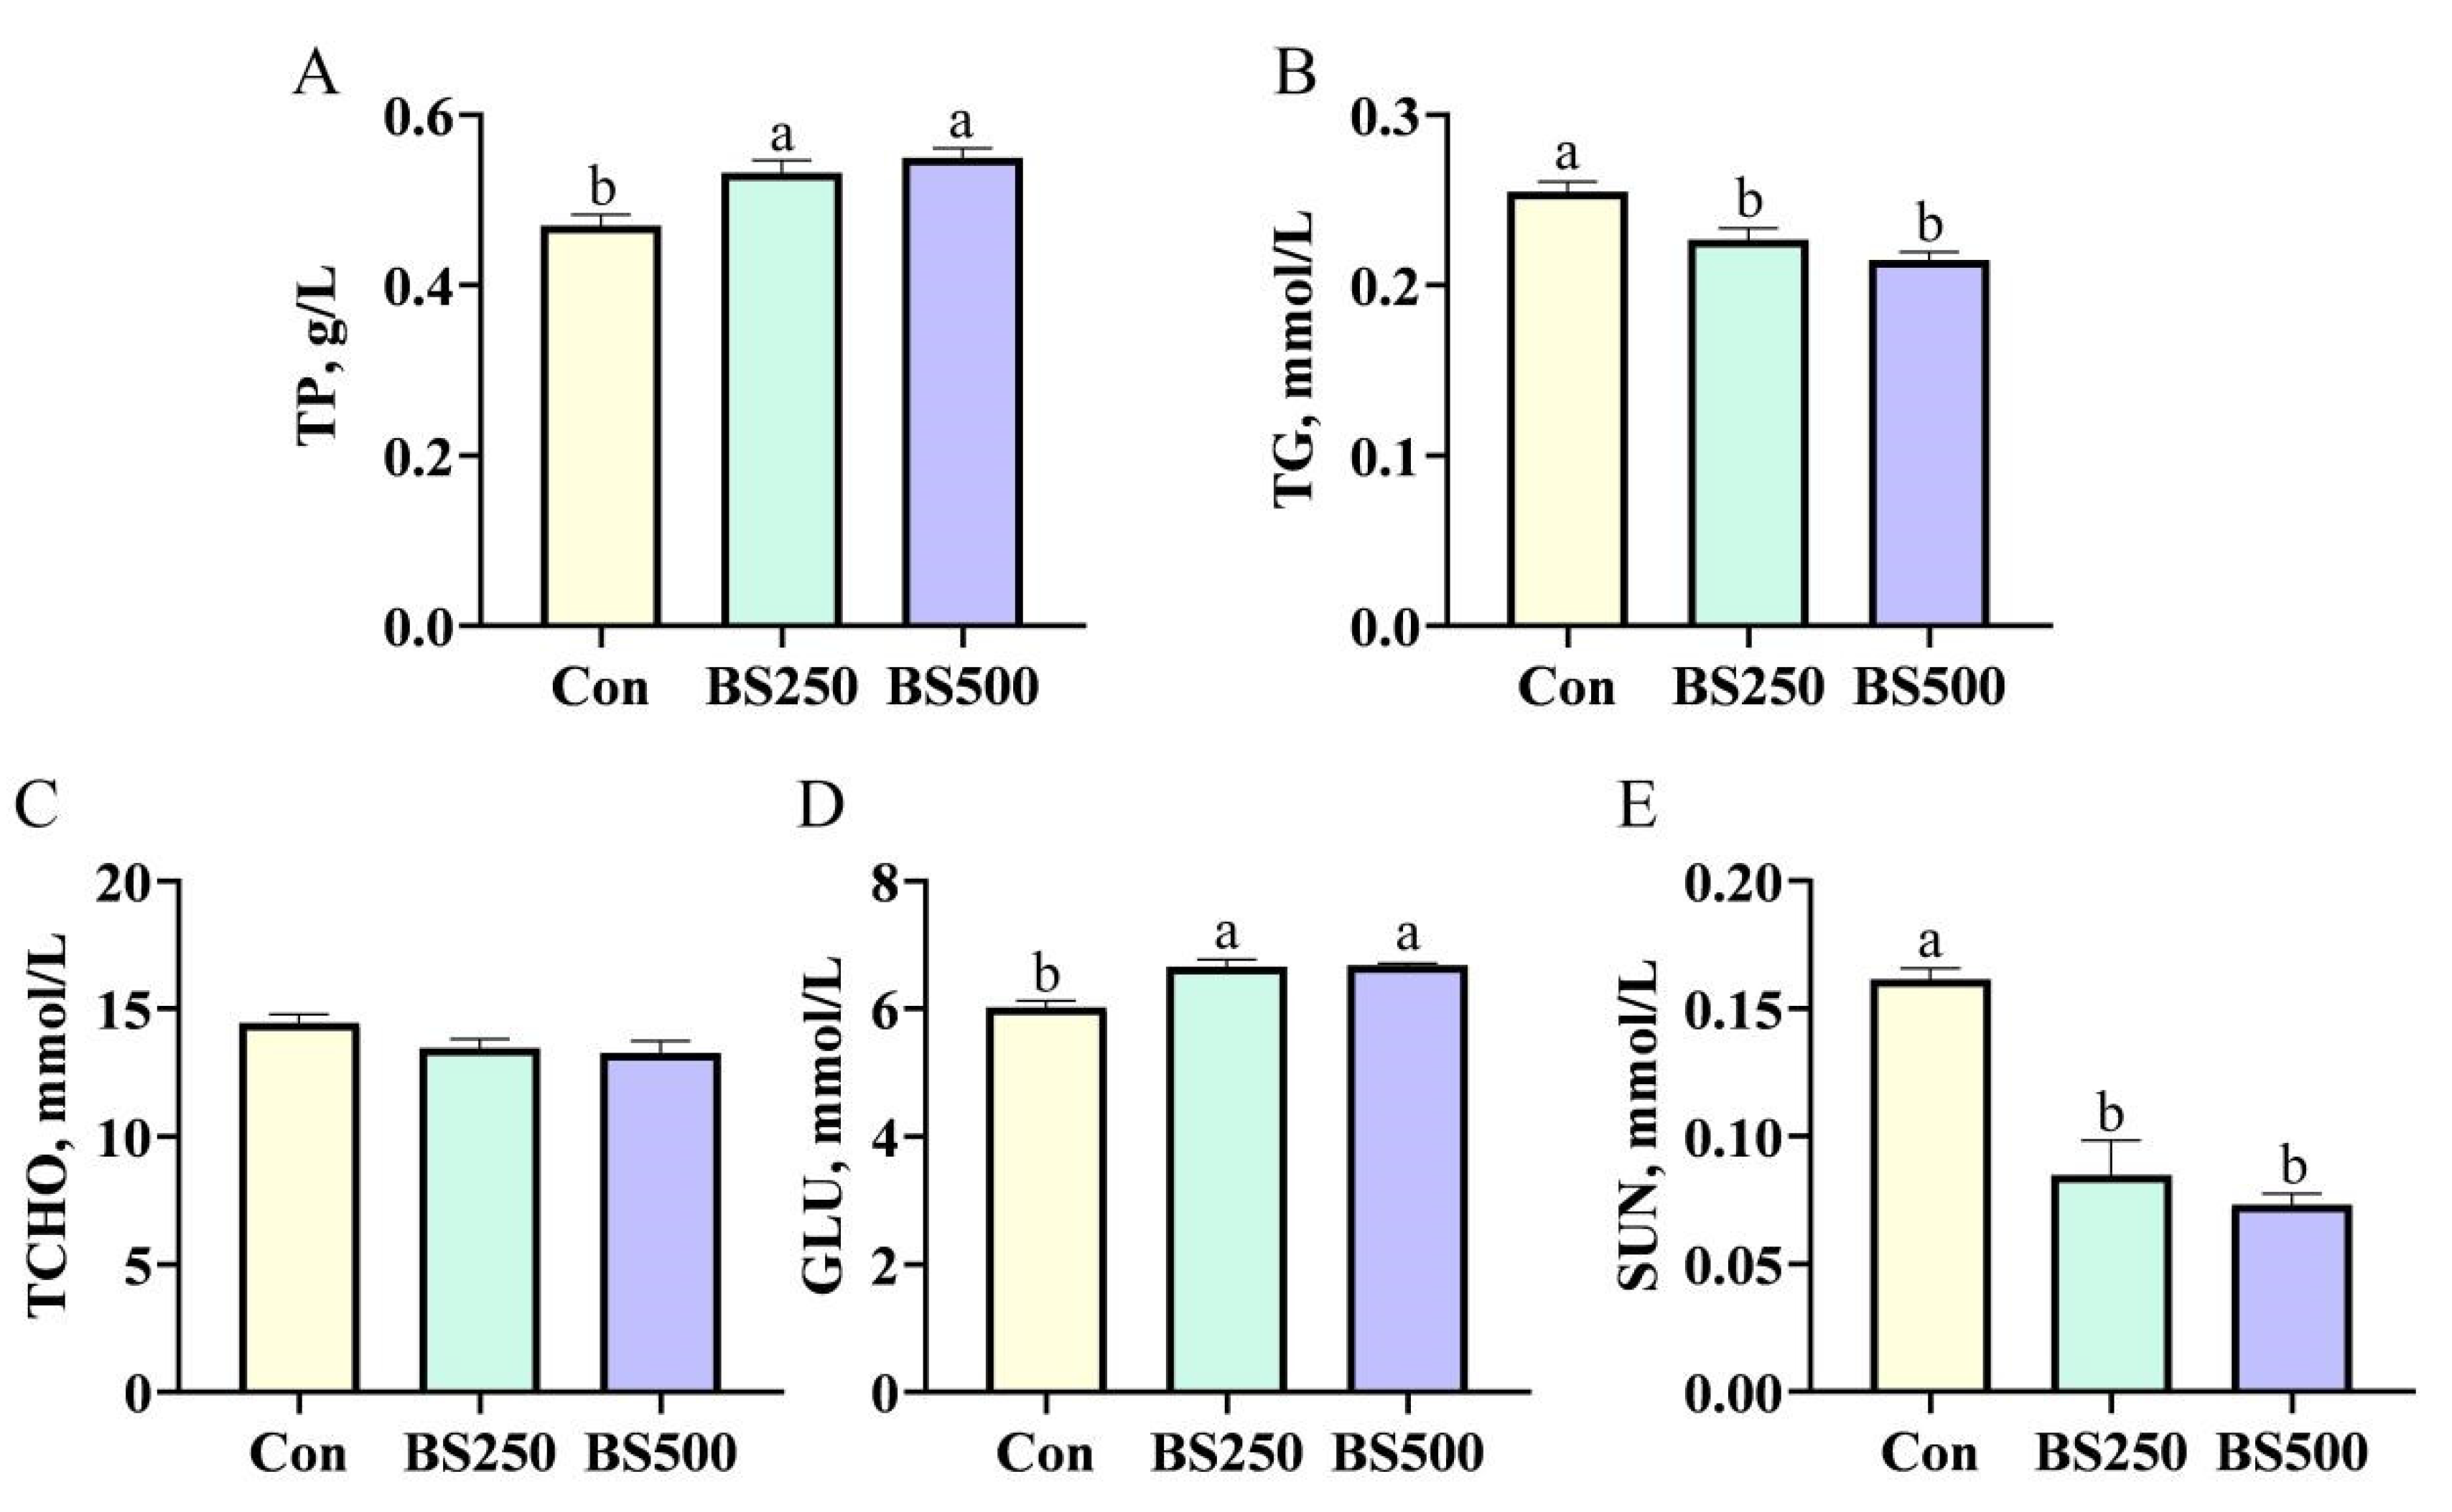
3.2. Serum Biochemistry

The serum biochemistry of broilers is shown in Figure 1. Compared with the control group, the content of TP and GLU was increased, while that of TG and SUN was decreased in BS groups (p < 0.05). However, BS supplementation did not alter the content of TCHO.

3.3. Serum Antioxidant

The serum antioxidant of broilers is shown in Figure 2. Compared with the control group, the GSH content was increased, while the MDA content was decreased in BS groups (p < 0.05). BS supplementation did not alter the content of SOD.

3.4. Jejunum Antioxidant

The jejunum antioxidant of broilers is shown in Figure 3. Compared with the control group, the SOD and GSH content in the BS500 group was significantly increased (p < 0.05). However, the MDA content in the BS250 and BS500 group was decreased compared to the control group (p < 0.05). Meanwhile, the mRNA expression of SOD2, CAT, GPX1, and Nrf2 was significantly increased in the BS250 and BS500 groups compared to the control group (p < 0.05). But Bacillus subtilis supplementation did not influence the mRNA expression of SOD1.

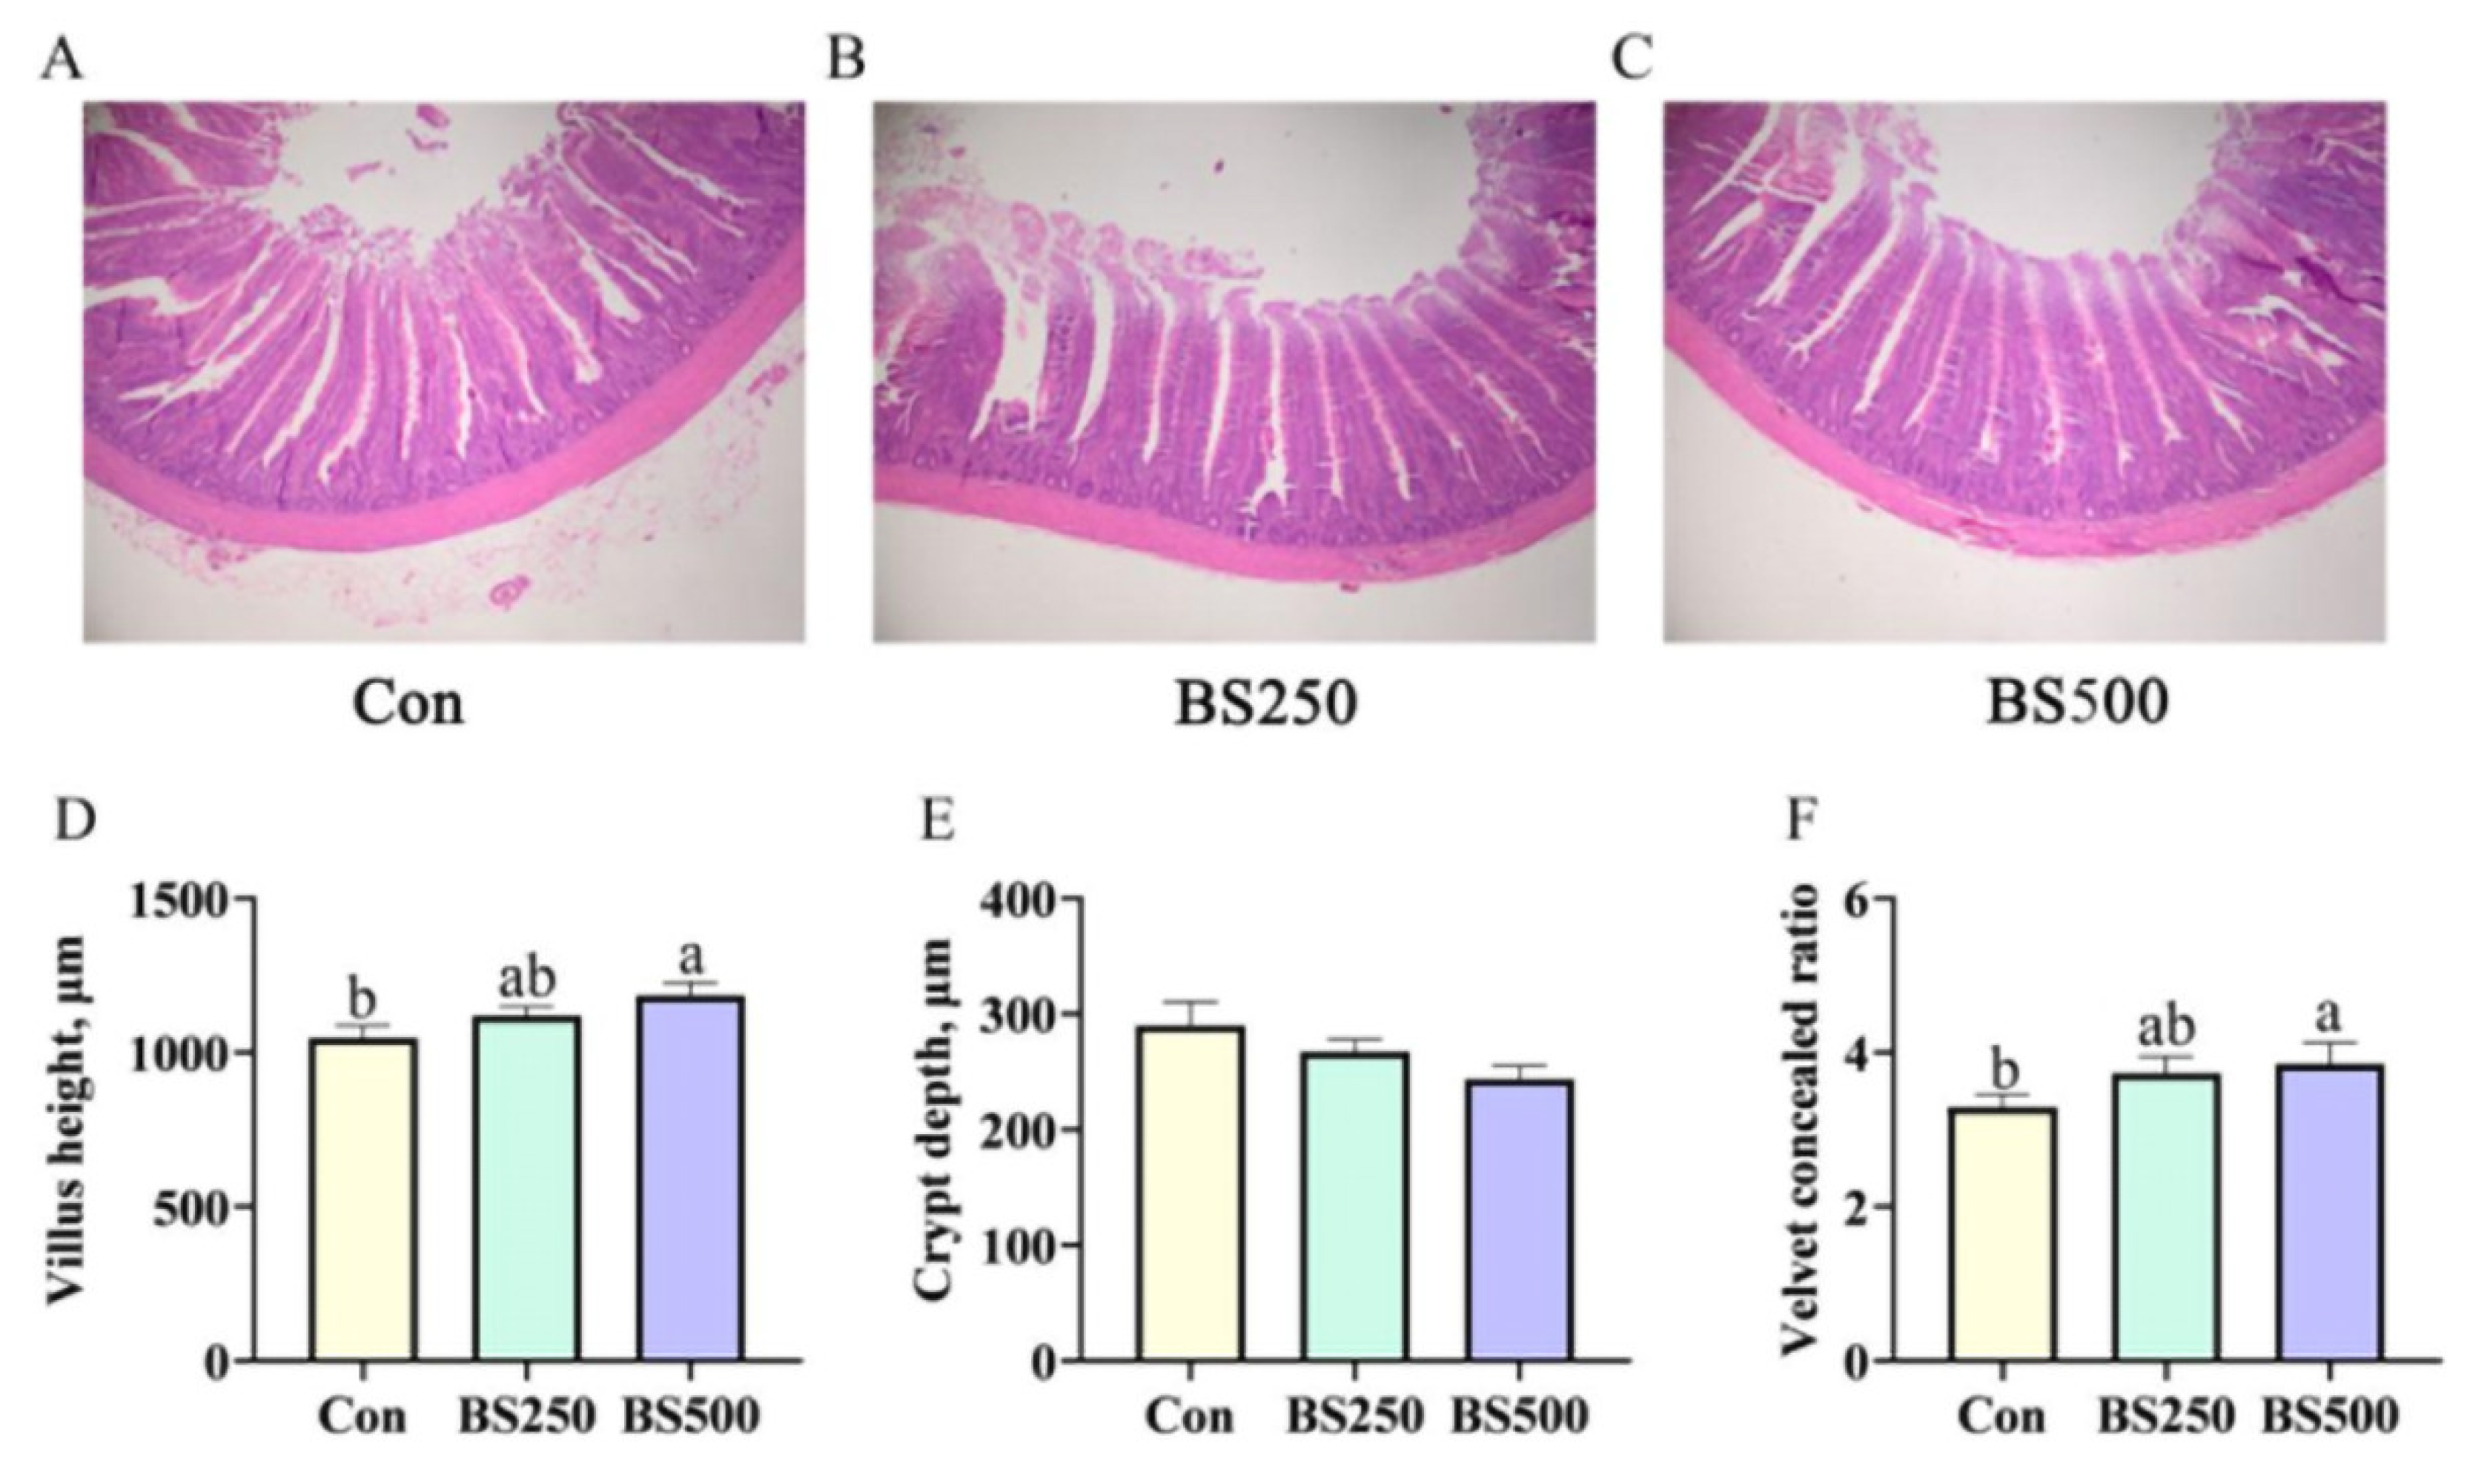
3.5. Jejunum Morphological Observation

The jejunum morphological observation of broilers is shown in Figure 4. In comparison with the control group, the villus height and velvet concealed ratio in the BS500 group were significantly improved (p < 0.05). Bacillus subtilis BC02 supplementation did not influence the crypt depth.

3.6. Jejunum Inflammatory Factor mRNA Expression

The jejunum inflammatory factor expression is shown in Figure 5. Compared with the control group, Bacillus subtilis BC02 supplementation increased the anti-inflammatory factor IL-2, IL-4, IL-10, and IL-12 mRNA expression (p < 0.05), but it did not influence the mRNA expression of IL-6.

3.7. Assessment of Microbial Diversity in Broilers

The Venn diagram drawn by OTUs is shown in Figure 6A. The Con, BS250, and BS500 groups contained 223, 209, and 296 unique sequences, respectively, and there were 667 common sequences among the three treatment groups. The species accumulation boxplot and rarefaction curve are shown in Figure 6B,C, which were utilized to calculate the species richness and diversity. The species accumulation boxplot (Figure 6B) tends to flatten as the number of sequencings reaches 18, indicating that OTUs sequences were sufficient to predict the species richness of the samples. Meanwhile, the rarefaction curve (Figure 6C) also tends to asymptotes, proving that the depth of the sequence was adequate to represent the bulk of species richness and bacterial community diversity.

3.8. Alpha Diversity Index

The alpha diversity index (Chao1, ACE, Shannon, and Simpson) is shown in Figure 7. The Chao1, ACE, Shannon, and Simpson were not different between the three groups.

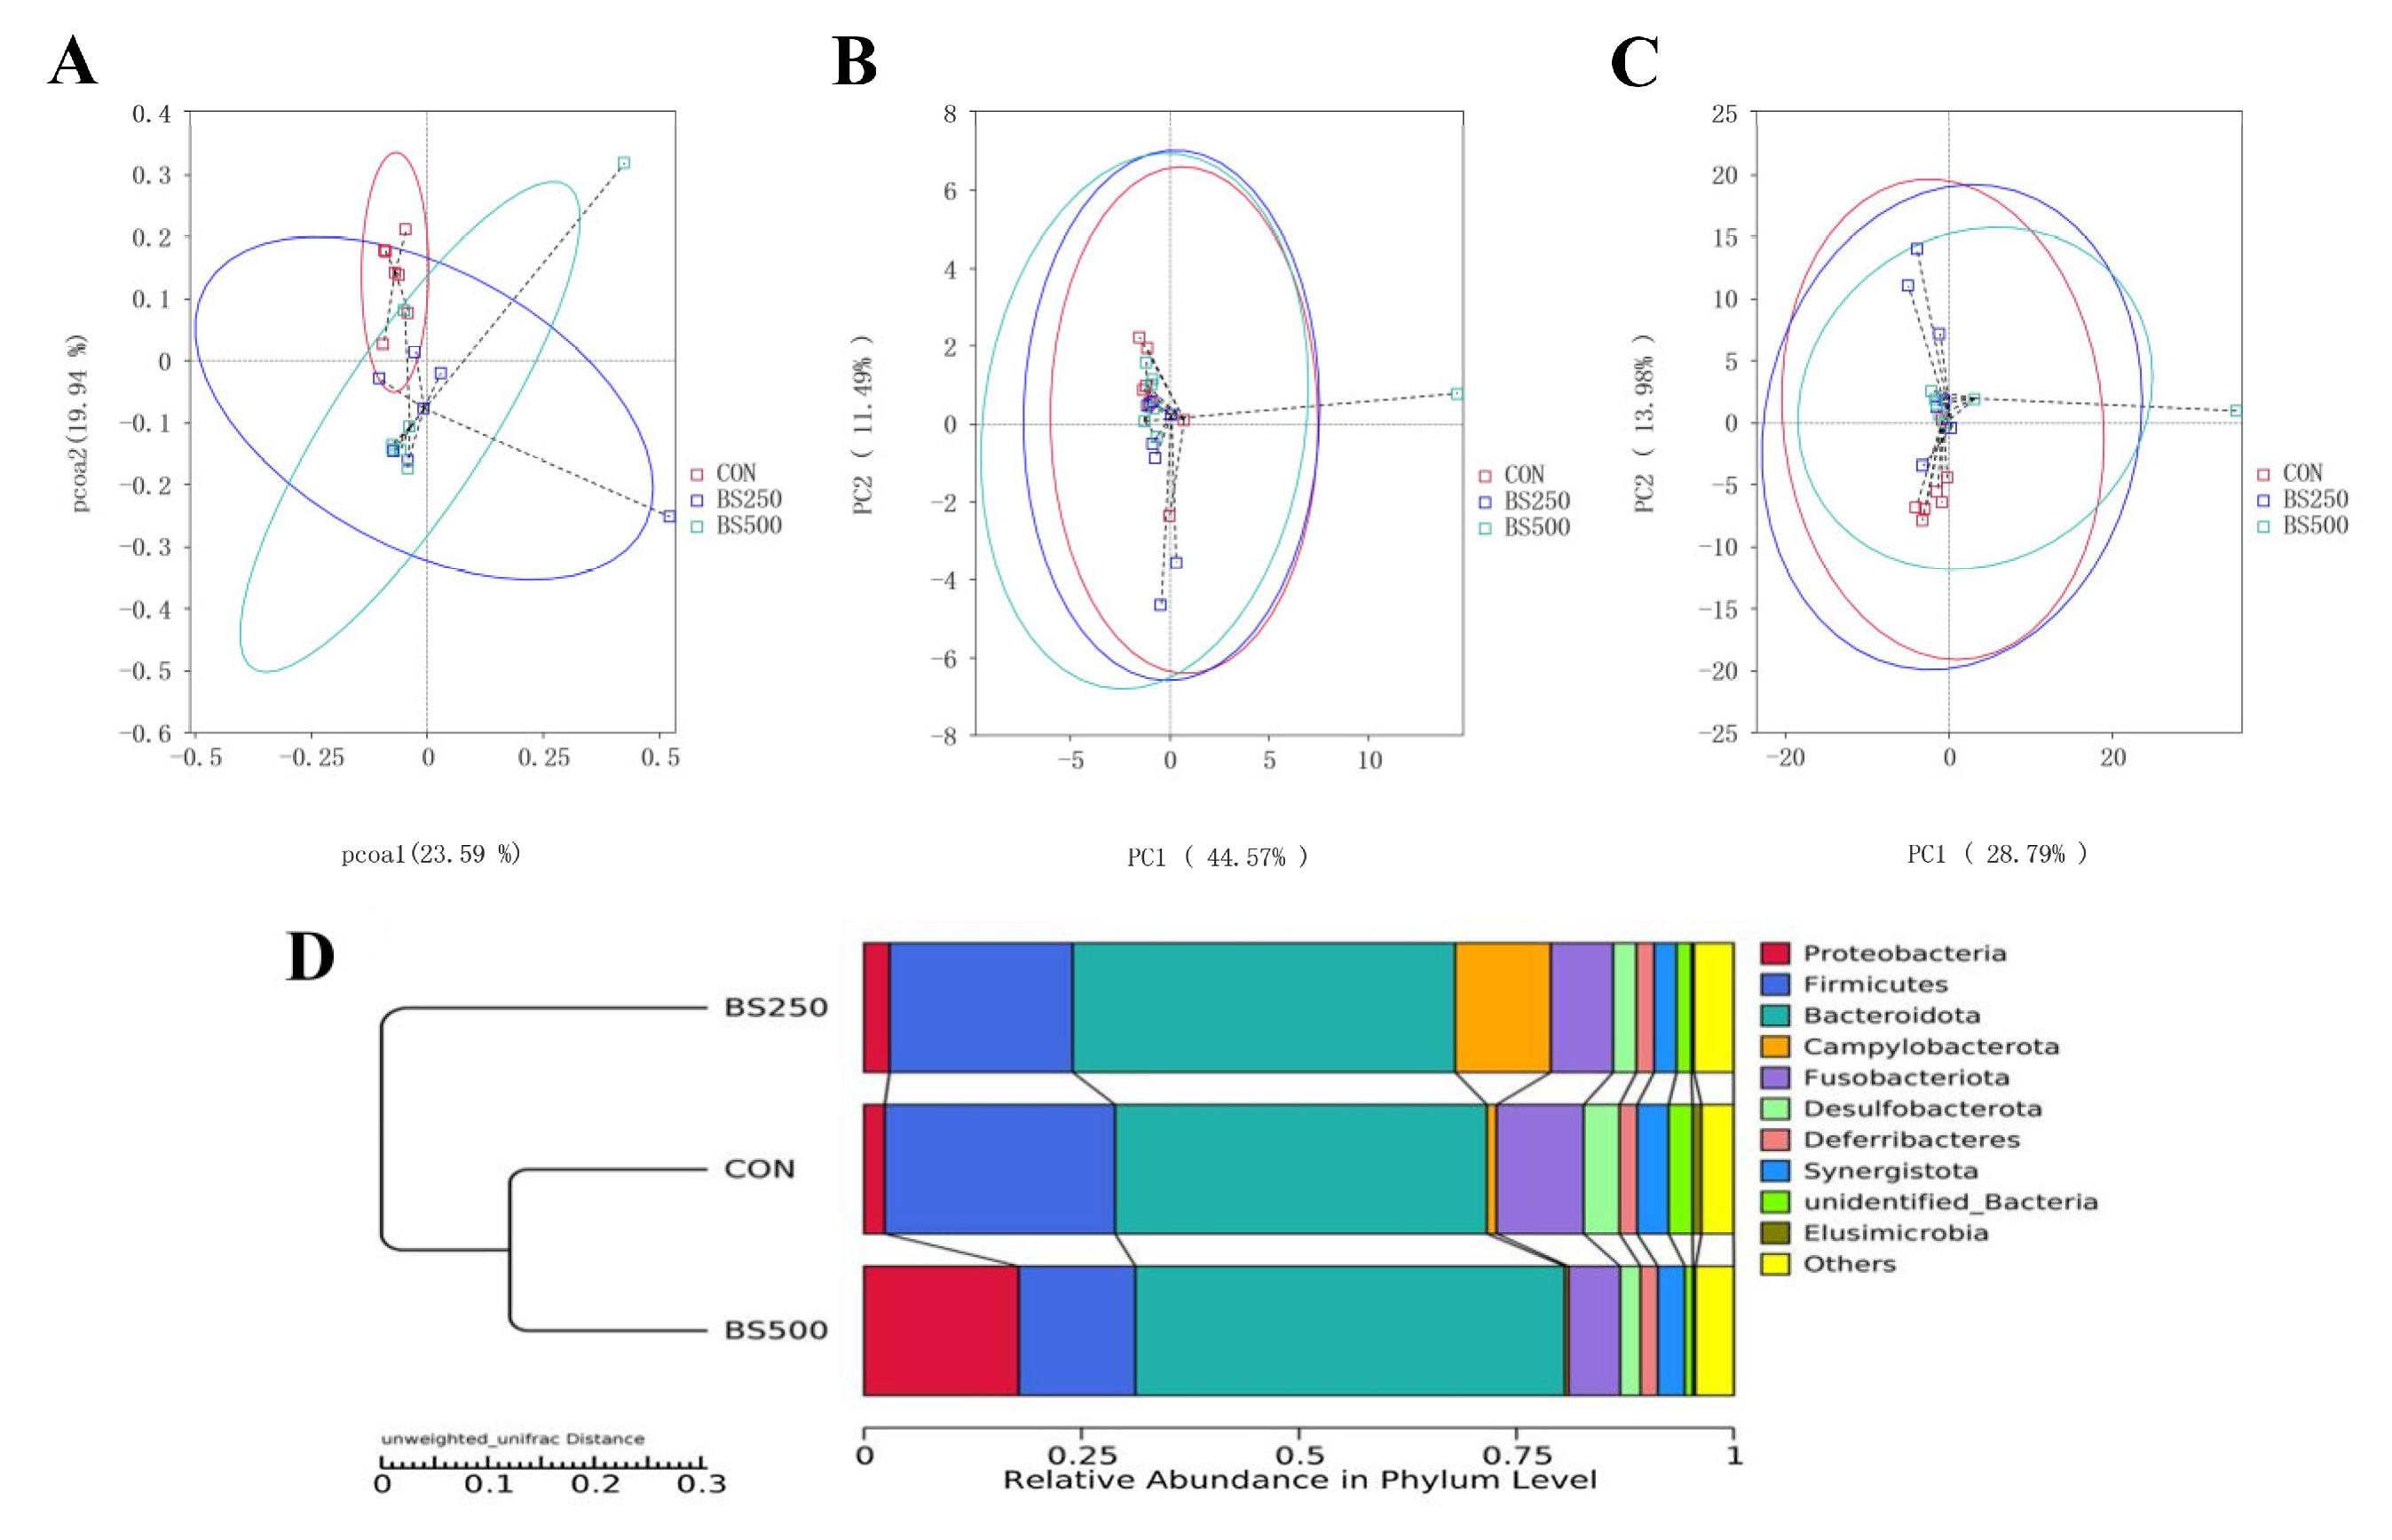
3.9. Beta Diversity Index Analysis

The beta diversity index (pcoa1, PCA, UPGMA) are shown in Figure 8. The principal co-ordinates analysis (pcoa1) (Figure 8A) was executed according to the weighted unifrac distance and unweighted unifrac distance. The samples from the BS250 and BS500 groups were far apart, indicating a clear separation between the BS250 and BS500 groups. Likewise, significant separation was found between samples from the BS250 and BS500 groups at the principal component analysis (PCA) phylum level (Figure 8B) and the PCA genus level (Figure 8C). In addition, the unweighted pair-group method with an arithmetic mean (UPGMA) phylogenetic tree (Figure 8D) exhibited that the Con and BS500 groups were within a close distance and gathered one group.

3.10. Species Relative Abundance Column Chart

The species relative abundance column chart is shown in Figure 9. The top 10 species at the phylum level (Figure 9A) were Proteobacteria, Firmicutes, Bacteroidota, Campylobacterota, Fusobacteriota, Desulfobacterota, Deferribacteres, Synergistota, Unidentified-Bacteria, and Cyanobacteria, of which Firmicutes and Bacteroidota were the dominant phyla. Compared with the control group, the Bacteroidota and Proteobacteria in the BS500 group were significantly increased (p < 0.05), and Firmicutes, Campylobacterota, Fusobacteriota, Desulfobacterota, and Cyanobacteria were markedly decreased (p < 0.05). Moreover, Campylobacterota increased, while Fusobacteriota, Desulfobacterota, and unidentified Bacteria decreased in the BS250 group compared to the control group (p < 0.05). However, there were no differences between the BS250 and BS500 groups in Fusobacteriota, Desulfobacterota, and unidentified Bacteria.
The top 30 species at the genus level were displayed in Figure 9B. The top 10 genus accounted for more than 50%, which were Lactobacillus, Pseudomonas, Helicobacter, Bacteroides, Fusobacterium, Prevotellaceae UCG-001, Phascolarctobacterium, Mucispirillum, Desulfovibrio, and Synergistes, respectively. The Lactobacillus and Fusobacterium were significantly decreased (p < 0.05), while Helicobacter and Prevotellaceae UCG-001 were markedly increased in the BS250 group compared to the control group (p < 0.05). The Pseudomonas and Prevotellaceae UCG-001 were significantly increased, and Lactobacillus and Fusobacterium were decreased in the BS500 group compared to the control group (p < 0.05).

3.11. Similarity Percentage Analysis

The simper (similarity percentage) analysis is shown in Figure 10. The species with high contribution to the Con, BS250, and BS500 group differences were Deferribacteres, Bacteroidota, Desulfobacterota, Firmicutes, Fusobacteriota, Campylobacterota, Proteobacterota, Unidentified-Bacteria, Synergistota, and Verrucomicrobiota at the phylum level (Figure 10A). In addition, the species genus levels (Figure 10B) with a high contribution to the differences were Lactobacillus, Fusobacterium, Pseudomonas, and Bacteroides in the Con, BS250, and BS500 groups.

3.12. LDA Effect Size Analysis

The LEfSe (LDA Effect Size) analysis is shown in Figure 11. The LDA score (Figure 11A) was used to calculate the impact of different species, and LDA > 4 times was considered significantly different. LEfSe analysis revealed 10 species with significant differences in abundance between the three groups. The Lactobacillales, lactobacillaceae, Barnesiellaceae, lactobacillus, Barnesiella, and lactobacillus aviarius expressed high abundance in the control group (p < 0.05). The abundance of Bacteroides caecigallinarum in the BS500 group and Campylobacterota, Campylobacterales, and Campylobacteria in the BS250 group was higher than other groups (p < 0.05). In Cladogram (Figure 11B), circles radiating from the inside out represent the classification level from the phylum to genus (or species). The Barnesiellaceae, Lactobacillaceae, and Lactobacillales played important roles in the control group. Meanwhile, Campylobacterales and Campylobacteria played important roles in the BS250 group.

3.13. Correlation Analysis

The phylum level correlation analysis is shown in Figure 12. The Top10 microorganisms at the phylum level with relative abundance were screened for correlation analysis with growth performance, serum biochemical content, and antioxidant capacity. The ADFI and F/G were significantly negatively correlated with Bacteroidota (Figure 12A). The TP and SUN were significantly positively correlated with Firmicutes and Desulfobacterota, respectively (Figure 12B). In the serum and jejunum antioxidants, Bacteroidota was positively correlated with SOD and negatively correlated with MDA (Figure 12C).
The Top10 microorganisms at the genus level with relative abundance were screened for correlation analysis with growth performance, serum biochemical content, and antioxidant capacity. The ADFI and F/G were significantly positively correlated with Fusobacterium and Barnesiella, respectively. In addition, ADFI was negatively correlated to Prevotellaceae UCG001 (Figure 12D). The TP was significantly positively correlated with Prevotellaceae UCG001 and negatively correlated with Barnesiella. GLU was significantly negatively related to Barnesiella, and SUN was significantly positively related to Desulfovibrio and Barnesiella (Figure 12E). The MDA was significantly positively correlated with Barnesiella (Figure 12F).

4. Discussion

The vast majority of studies have reported the positive effects of dietary Bacillus subtilis supplementation on the growth performance of broiler chickens [27,28,29,30]. Consistent with previous research, this study showed that the supplementation of Bacillus subtilis increased ADG and decreased F/G in 0–14 d, 0–28 d, and 0–42 d broilers. But there were no significant effects on ADG and ADFI during 15–28, 29–42, 0–28, and 0–42 d. This may be caused by different types of Bacillus subtilis strains in broilers [31,32]. In this study, we found that Bacteroidetes were significantly negatively correlated with ADFI and F/G at the phylum level. Meanwhile, we also found that the Fusobacterium and Barnesiella were positively related to ADFI and F/G at the genus level, respectively. At the same time, Prevotellaceae UCG001 was negatively correlated with F/G at the genus level. We found that the dietary addition of Bacillus subtilis significantly increased the phylum level of Bacteroides in the relative abundance histogram of species, and then the phenomenon of ADFI and F/G decreased. Bacteroides are Gram-negative anaerobic bacteria that feed on host-derived polysaccharides in the absence of fibers [33,34]. Consistently, Bacteroidetes play an important role in sugar metabolism as Bacteroidetes and Bacteroidetes encode the genes required for the metabolism of a large number of polysaccharides [35,36]. In addition, the main by-products of the anaerobic respiration of Bacteroides are acetic acid, isovaleric acid, and succinic acid [37]. Studies have reported that short-chain fatty acids such as acetic acid can increase nutrient absorption and inhibit pathogenic microorganisms [38,39,40]. Meanwhile, acetate and butyrate provide a carbon source for the gut microbiota by activating glyoxylate pathway enzymes, thereby affecting energy metabolism [35,36]. Therefore, we speculate that adding Bacillus subtilis to the diet resulted in an abundance of cecal Bacteriodetes and improved nutrient absorption, energy, and fat metabolism, which ultimately enhanced the growth performance.
Serum biochemical indicators can partially reflect poultry metabolism and health [41]. TP and SUN in serum can reflect the metabolism of proteins [42]. TG content represents the level of lipid utilization [43]. Meanwhile, TCHO and GLU represent the metabolism of carbohydrate and lipid in animals [44]. In the current experiment, the dietary supplementation of Bacillus subtilis significantly increased the content of TP and GLU and decreased TG and SUN, which is consistent with previous findings [45]. This may be caused by the effects of Bacillus subtilis supplementation in inhibiting the growth of pathogens and the breakdown of protein into nitrogen, improving the utilization rate of dietary protein [46]. In addition, we found that Firmicutes and Desulfobacteria were positively correlated with TG and SUN, respectively. Barnesiella was negatively correlated with TP and GLU and positively correlated with SUN, and TP and SUN were also significantly positively correlated with Prevotellaceae UCG001 and Desulfovibrio, respectively. Firmicutes are involved in the absorption of nutrients and convert various carbohydrates into short-chain fatty acids, which in turn affect energy metabolism [28,47]. Desulfobacteria generally produces acetic acid, which also affects gut microbes [48]. Barnesiella affects pathogens in the cecum via non-metabolic pathways [49]. Prevotellaceae negatively correlated with host body weight [50]. The present study indicated that the dietary supplementation of Bacillus subtilis reduced the abundance of Firmicutes and Desulfobacteria, which in turn led to a decrease in the serum TG and SUN content. Simultaneously, the serum TP and GLU content increased due to the effects of the microbes in inhibiting the growth of pathogens and improving the absorption of nutrients such as proteins and carbohydrates.
SOD, MDA, and GSH are important indicators reflecting the antioxidant capacity of the body [51]. SOD and GSH play major roles in endogenous defense mechanisms [52]. MDA levels reflect the extent of damage caused by lipid peroxidation [53]. Previous studies have shown that adding Bacillus subtilis to the diet can improve antioxidant capacity in broilers [32,54]. A similar conclusion was made in this study. Diet supplemented with Bacillus subtilis significantly increased SOD and GSH levels in serum and jejunum, while it decreased MDA content. In the association analysis of microbial flora and serum antioxidant indicators, we found that Bacteroidota was positively correlated with SOD and negatively correlated with MDA. At the same time, Barnesiella was positively correlated with MDA at the genus level. Short-chain fatty acids produced by Bacteroidota could enhance the intestinal epithelial barrier function [55,56]. In addition, Bacteroidota could metabolize a variety of plant- and animal-derived glycans, which contributed to enhancing the antioxidant capacity [57,58]. SOD1 and SOD2 are composed of metallo-coenzymes and proteins which can convert superoxide radicals to molecular oxygen and hydrogen peroxide [59]. In addition, CAT and GPX1 are also important antioxidant genes in broilers [60]. In this study, Bacillus subtilis BC02 supplementation to the diet significantly increased Nrf2, SOD2, CAT, and GPX1 mRNA expression, which is consistent with the findings of previous studies. The dietary supplementation of Bacillus subtilis significantly increased the mRNA expression of related antioxidant genes, resulting in the increased activity of related antioxidant enzymes.
The dietary addition of Bacillus subtilis can improve the intestinal morphology [61,62]. In this study, the addition of Bacillus subtilis BC02 increased jejunum villus height and villus concealed rate; similar results were found in previous studies [30,63]. Thereby, the supplementation of Bacillus subtilis can increase villus height, which leads to the enhancement of nutrition absorption.
The gut microbiota is influenced by many factors and is very important for the growth and health of broilers [64]. Differences were found between Con, BS250, and BS500 groups by pcoa1, PCA, and UPGMA analysis of the beta diversity index. But there was no significant difference with Shannon and Simpson when Bacillus subtilis BC02 was added to the diet. This indicated that the dietary addition of Bacillus subtilis BC02 changed the abundance of microbial flora. Firmicutes and Bacteroidota were the dominant flora at the phylum level, which account for more than 70% of the total flora. This is the same as previous studies in which Firmicutes and Bacteroidota were the main flora in broilers gut microbiota [65,66]. In our study, Bacteroidota was the dominant phylum at the broiler phylum level. But other studies have shown Firmicutes to be the dominant phylum [67,68]. The reason for this difference may be influenced by the age and breed of the broiler. Likewise, the dominant bacteria at the genus level were also Bacteroides. This suggests that Bacteroidota and Bacteroides play an important role in our study. Through Simper analysis, it was found that Proteobacterota made the biggest differential contribution at the phylum level. Similarly, Pseudomonas made the largest contribution at the genus level. Meanwhile, the above conclusions were obtained by LEfSe analysis. An interesting phenomenon emerged in our experiments: Proteobacteria was significantly increased in the BS500 group and Firmicutes was significantly decreased when compared with the control and BS250 groups. At the same time, the abundance of Pseudomonas was significantly increased, and the abundance of Lactobacillus was significantly decreased at the genus level. This situation requires further research before conclusions can be drawn.

5. Conclusions

The current study demonstrated that the dietary supplementation of Bacillus subtilis BC02 can improve growth performance, antioxidant capacity, intestinal morphology, increase cecum microflora abundances, and maintain the intestinal health of broilers.

Author Contributions

Conceptualization, X.R., Y.Z. and W.Y.; data curation, X.R. and Y.Z.; formal analysis, X.R., H.L. and N.J.; funding acquisition, J.L. and W.Y.; methodology, X.R., N.J., S.J., Y.L., J.L. and W.Y.; writing—original draft preparation, X.R. and Y.Z.; writing—review and editing, H.L., N.J., S.J. and Y.L. All authors have read and agreed to the published version of the manuscript.

Funding

This research was funded by the key research and development program of Shandong Province (grant number 2022LZGCQY016).

Institutional Review Board Statement

In this experiment, the experimental procedures were reviewed and approved by the Institutional Animal Care and Use Committee of Shandong Agricultural University (approval number: SDAUA-2022-0810; date of approval: 10 August 2022).

Data Availability Statement

Not applicable.

Conflicts of Interest

The authors declare no conflict of interest.

References

  1. Zhang, R.; Li, Z.; Gu, X.; Zhao, J.; Guo, T.; Kong, J. Probiotic Bacillus subtilis LF11 protects intestinal epithelium against Salmonella infection. Front. Cell Infect. Microbiol. 2022, 12, 837886. [Google Scholar]
  2. Sweeney, M.T.; Lubbers, B.V.; Schwarz, S.; Watts, J.L. Applying definitions for multidrug resistance, extensive drug resistance and pandrug resistance to clinically significant livestock and companion animal bacterial pathogens-authors’ response. J. Antimicrob. Chemother. 2019, 74, 536–537. [Google Scholar] [CrossRef]
  3. Selaledi, L.A.; Hassan, Z.M.; Manyelo, T.G.; Mabelebele, M. The current status of the alternative use to antibiotics in poultry production: An African perspective. Antibiotics 2020, 9, 594. [Google Scholar]
  4. Tang, K.L.; Caffrey, N.P.; Nóbrega, D.B.; Cork, S.C.; Ronksley, P.E.; Barkema, H.W.; Polachek, A.J.; Ganshorn, H.; Sharma, N.; Kellner, J.D.; et al. Restricting the use of antibiotics in food-producing animals and its associations with antibiotic resistance in food-producing animals and human beings: A systematic review and meta-analysis. Lancet Planet. Health 2017, 1, e316–e327. [Google Scholar] [CrossRef]
  5. Nami, Y.; Haghshenas, B.; Abdullah, N.; Barzegari, A.; Radiah, D.; Rosli, R.; Yari Khosroushahi, A. Probiotics or antibiotics: Future challenges in medicine. J. Med. Microbiol. 2015, 64, 137–146. [Google Scholar] [CrossRef] [Green Version]
  6. Abd El-Hack, M.E.; El-Saadony, M.T.; Shafi, M.E.; Qattan, S.Y.A.; Batiha, G.E.; Khafaga, A.F.; Abdel-Moneim, A.E.; Alagawany, M. Probiotics in poultry feed: A comprehensive review. J. Anim. Physiol. Anim. Nutr. 2020, 104, 1835–1850. [Google Scholar]
  7. de Melo Pereira, G.V.; de Oliveira Coelho, B.; Magalhães, A.I., Jr.; Thomaz-Soccol, V.; Soccol, C.R. How to select a probiotic? A review and update of methods and criteria. Biotechnol. Adv. 2018, 36, 2060–2076. [Google Scholar] [CrossRef]
  8. Du, Y.; Xu, Z.; Yu, G.; Liu, W.; Zhou, Q.; Yang, D.; Li, J.; Chen, L.; Zhang, Y.; Xue, C.; et al. A newly isolated Bacillus subtilis srain named WS-1 inhibited diarrhea and death caused by pathogenic Escherichia coli in Newborn Piglets. Front. Microbiol. 2019, 10, 1248. [Google Scholar] [PubMed]
  9. Guo, J.R.; Dong, X.F.; Liu, S.; Tong, J.M. Effects of long-term Bacillus subtilis CGMCC 1.921 supplementation on performance, egg quality, and fecal and cecal microbiota of laying hens. Poult. Sci. 2017, 96, 1280–1289. [Google Scholar] [PubMed]
  10. Zhang, L.; Bai, K.; Zhang, J.; Xu, W.; Huang, Q.; Wang, T. Dietary effects of Bacillus subtilis fmbj on the antioxidant capacity of broilers at an early age. Poult. Sci. 2017, 96, 3564–3573. [Google Scholar] [CrossRef] [PubMed]
  11. Park, J.W.; Jeong, J.S.; Lee, S.I.; Kim, I.H. Effect of dietary supplementation with a probiotic (Enterococcus faecium) on production performance, excreta microflora, ammonia emission, and nutrient utilization in ISA brown laying hens. Poult. Sci. 2016, 95, 2829–2835. [Google Scholar] [CrossRef]
  12. Aliakbarpour, H.R.; Chamani, M.; Rahimi, G.; Sadeghi, A.A.; Qujeq, D. The Bacillus subtilis and lactic acid bacteria probiotics influences intestinal mucin gene expression, histomorphology and growth performance in broilers. Asian-Australas. J. Anim. Sci. 2012, 25, 1285–1293. [Google Scholar] [CrossRef] [PubMed] [Green Version]
  13. Tsukahara, T.; Tsuruta, T.; Nakanishi, N.; Hikita, C.; Mochizuki, M.; Nakayama, K. The preventive effect of Bacillus subtilus strain DB9011 against experimental infection with enterotoxcemic Escherichia coli in weaning piglets. Anim. Sci. J. 2013, 84, 316–321. [Google Scholar] [PubMed]
  14. Xing, Y.; Wang, S.; Fan, J.; Oso, A.O.; Kim, S.W.; Xiao, D.; Yang, T.; Liu, G.; Jiang, G.; Li, Z.; et al. Effects of dietary supplementation with lysine-yielding Bacillus subtilis on gut morphology, cecal microflora, and intestinal immune response of Linwu ducks. J. Anim. Sci. 2015, 93, 3449–3457. [Google Scholar] [PubMed]
  15. Tang, W.; Qian, Y.; Yu, B.; Zhang, T.; Gao, J.; He, J.; Huang, Z.; Zheng, P.; Mao, X.; Luo, J.; et al. Effects of Bacillus subtilis DSM32315 supplementation and dietary crude protein level on performance, gut barrier function and microbiota profile in weaned piglets1. J. Anim. Sci. 2019, 97, 2125–2138. [Google Scholar] [PubMed]
  16. Algburi, A.; Al-Hasani, H.M.; Ismael, T.K.; Abdelhameed, A.; Weeks, R.; Ermakov, A.M.; Chikindas, M.L. Antimicrobial activity of Bacillus subtilis KATMIRA1933 and Bacillus amyloliquefaciens B-1895 against staphylococcus aureus biofilms isolated from wound infection. Probiotics Antimicrob. Proteins. 2021, 13, 125–134. [Google Scholar] [CrossRef]
  17. Rychlik, I. Composition and function of chicken gut microbiota. Animals 2020, 10, 103. [Google Scholar] [CrossRef] [Green Version]
  18. Hong, Y.; Cheng, Y.; Li, Y.; Li, X.; Zhou, Z.; Shi, D.; Li, Z.; Xiao, Y. Preliminary study on the effect of Bacillus amyloliquefaciens TL on cecal bacterial community structure of broiler chickens. BioMed Res. Int. 2019, 2019, 5431354. [Google Scholar] [CrossRef] [Green Version]
  19. Ocejo, M.; Oporto, B.; Hurtado, A. 16S rRNA amplicon sequencing characterization of caecal microbiome composition of broilers and free-range slow-growing chickens throughout their productive lifespan. Sci. Rep. 2019, 9, 2506. [Google Scholar] [CrossRef] [Green Version]
  20. Gadde, U.; Oh, S.T.; Lee, Y.S.; Davis, E.; Zimmerman, N.; Rehberger, T.; Lillehoj, H.S. The Effects of direct-fed microbial supplementation, as an alternative to antibiotics, on growth performance, intestinal lmmune status, and epithelial barrier gene expression in broiler chickens. Probiotics Antimicrob. 2017, 9, 397–405. [Google Scholar] [CrossRef] [PubMed]
  21. Rhayat, L.; Jacquier, V.; Brinch, K.S.; Nielsen, P.; Nelson, A.; Geraert, P.A.; Devillard, E. Bacillus subtilis strain specificity affects performance improvement in broilers. Poult. Sci. 2017, 96, 2274–2280. [Google Scholar] [CrossRef]
  22. NY/T 33-2004; Nutrient Requirements of Chinese Feeding Standard of Chicken. The Ministry of Agriculture of the People’s Republic of China: Beijing, China, 2004.
  23. Huntsville, A.L. Arbor Acres Broiler Breeder Manual; Acbor Acres Farm, Inc.: Iron Bridge, ON, Canada, 1996. [Google Scholar]
  24. Liu, Y.; Wang, Q.; Liu, H.; Niu, J.; Jiao, N.; Huang, L.; Jiang, S.; Guan, Q.; Yang, W.; Li, Y. Effects of dietary Bopu powder supplementation on intestinal development and microbiota in broiler chickens. Front. Microbiol. 2022, 13, 1019130. [Google Scholar] [CrossRef]
  25. Liu, Y.; Li, Y.; Niu, J.; Liu, H.; Jiao, N.; Huang, L.; Jiang, S.; Yan, L.; Yang, W. Effects of dietary Macleaya cordata extract containing isoquinoline alkaloids supplementation as an alternative to antibiotics in the diets on growth performance and liver health of broiler chickens. Front. Vet. Sci. 2022, 9, 950174. [Google Scholar] [CrossRef]
  26. Chen, X.; Ma, X.M.; Yang, C.W.; Jiang, S.J.; Huang, L.B.; Li, Y.; Zhang, F.; Jiao, N.; Yang, W.R. Low level of dietary organic trace elements improve the eggshell strength, trace element utilization, and intestinal function in late-phase laying hens. Front. Vet. Sci. 2022, 9, 903615. [Google Scholar] [CrossRef] [PubMed]
  27. Liu, X.; Yan, H.; Lv, L.; Xu, Q.; Yin, C.; Zhang, K.; Wang, P.; Hu, J. Growth performance and meat quality of broiler chickens supplemented with Bacillus licheniformis in drinking water. Asian-Australas. J. Anim. Sci. 2012, 25, 682–689. [Google Scholar] [CrossRef]
  28. Chen, Y.C.; Yu, Y.H. Bacillus licheniformis-fermented products improve growth performance and the fecal microbiota community in broilers. Poult. Sci. 2020, 99, 1432–1443. [Google Scholar] [CrossRef]
  29. Bilal, M.; Achard, C.; Barbe, F.; Chevaux, E.; Ronholm, J.; Zhao, X. Bacillus pumilus and Bacillus subtilis promote early maturation of cecal microbiota in broiler chickens. Microorganisms 2021, 9, 1899. [Google Scholar] [CrossRef]
  30. Sen, S.; Ingale, S.L.; Kim, Y.W.; Kim, J.S.; Kim, K.H.; Lohakare, J.D.; Kim, E.K.; Kim, H.S.; Ryu, M.H.; Kwon, I.K.; et al. Effect of supplementation of Bacillus subtilis LS 1-2 to broiler diets on growth performance, nutrient retention, caecal microbiology and small intestinal morphology. Res. Vet. Sci. 2012, 93, 264–268. [Google Scholar] [CrossRef] [PubMed]
  31. Lee, K.W.; Lillehoj, H.S.; Jang, S.I.; Lee, S.H. Effects of salinomycin and Bacillus subtilis on growth performance and immune responses in broiler chickens. Res. Vet. Sci. 2014, 97, 304–308. [Google Scholar] [CrossRef]
  32. Xu, Y.; Yu, Y.; Shen, Y.; Li, Q.; Lan, J.; Wu, Y.; Zhang, R.; Cao, G.; Yang, C. Effects of Bacillus subtilis and Bacillus licheniformis on growth performance, immunity, short chain fatty acid production, antioxidant capacity, and cecal microflora in broilers. Poult. Sci. 2021, 100, 101358. [Google Scholar] [CrossRef]
  33. Nihira, T.; Suzuki, E.; Kitaoka, M.; Nishimoto, M.; Ohtsubo, K.; Nakai, H. Discovery of β-1,4-D-mannosyl-N-acetyl-D-glucosamine phosphorylase involved in the metabolism of N-glycans. J. Biol. Chem. 2013, 288, 27366–27374. [Google Scholar] [CrossRef] [Green Version]
  34. Magnúsdóttir, S.; Heinken, A.; Kutt, L.; Ravcheev, D.A.; Bauer, E.; Noronha, A.; Greenhalgh, K.; Jäger, C.; Baginska, J.; Wilmes, P.; et al. Generation of genome-scale metabolic reconstructions for 773 members of the human gut microbiota. Nat. Biotechnol. 2017, 35, 81–89. [Google Scholar] [CrossRef] [Green Version]
  35. Li, C.L.; Wang, J.; Zhang, H.J.; Wu, S.G.; Hui, Q.R.; Yang, C.B.; Fang, R.J.; Qi, G.H. Intestinal morphologic and microbiota responses to dietary Bacillus spp. in a broiler chicken model. Front. Physiol. 2019, 9, 1968. [Google Scholar] [CrossRef] [Green Version]
  36. Medvecky, M.; Cejkova, D.; Polansky, O.; Karasova, D.; Kubasova, T.; Cizek, A.; Rychlik, I. Whole genome sequencing and function prediction of 133 gut anaerobes isolated from chicken caecum in pure cultures. BMC Genom. 2018, 19, 561. [Google Scholar] [CrossRef] [Green Version]
  37. Magne, F.; Gotteland, M.; Gauthier, L.; Zazueta, A.; Pesoa, S.; Navarrete, P.; Balamurugan, R. The Firmicutes/Bacteroidetes Ratio: A Relevant Marker of Gut Dysbiosis in Obese Patients? Nutrients 2020, 12, 1474. [Google Scholar] [CrossRef]
  38. Dittoe, D.K.; Ricke, S.C.; Kiess, A.S. Organic acids and potential for modifying the avian gastrointestinal tract and reducing pathogens and disease. Front. Vet. Sci. 2018, 5, 216. [Google Scholar] [CrossRef] [Green Version]
  39. Macfarlane, G.T.; Macfarlane, S. Bacteria, colonic fermentation, and gastrointestinal Health. J. AOAC Int. 2012, 95, 50–60. [Google Scholar] [CrossRef]
  40. Ríos-Covián, D.; Ruas-Madiedo, P.M.; Argolles, A.; Gueimonde, M.; de Los Reyes-Gavilán, C.G.; Salazar, N. Intestinal short chain fatty acids and their link with diet and human health. Front. Microbiol. 2016, 7, 185. [Google Scholar]
  41. Ahmat, M.; Cheng, J.; Abbas, Z.; Cheng, Q.; Fan, Z.; Ahmad, B.; Hou, M.; Osman, G.; Guo, H.; Wang, J.; et al. Effects of Bacillus amyloliquefaciens LFB112 on growth performance, carcass traits, immune, and serum biochemical response in broiler chickens. Antibiotics 2021, 10, 1427. [Google Scholar] [CrossRef]
  42. Xiao, X.; Wang, Y.; Liu, W.; Ju, T.; Zhan, X. Effects of different methionine sources on production and reproduction performance, egg quality and serum biochemical indices of broiler breeders. Asian-Australas. J. Anim. Sci. 2017, 30, 828–833. [Google Scholar] [CrossRef] [Green Version]
  43. Wang, X.; Wang, Y.; Wang, Q.; Dai, C.; Li, J.; Huang, P.; Li, Y.; Ding, X.; Huang, J.; Hussain, T.; et al. Effect of dietary protein on growth performance, and serum biochemical index in late pregnant Hu ewes and their offspring. Anim. Biotechnol. 2023, 34, 97–105. [Google Scholar] [CrossRef]
  44. Luo, J.; Song, J.; Liu, L.; Xue, B.; Tian, G.; Yang, Y. Effect of epigallocatechin gallate on growth performance and serum biochemical metabolites in heat-stressed broilers. Poult. Sci. 2018, 97, 599–606. [Google Scholar] [CrossRef]
  45. Gong, L.; Wang, B.; Mei, X.; Xu, H.; Qin, Y.; Li, W.; Zhou, Y. Effects of three probiotic Bacillus on growth performance, digestive enzyme activities, antioxidative capacity, serum immunity, and biochemical parameters in broilers. Anim. Sci. J. 2018, 89, 1561–1571. [Google Scholar] [CrossRef]
  46. Abdel-Moneim, A.E.; Selim, D.A.; Basuony, H.A.; Sabic, E.M.; Saleh, A.A.; Ebeid, T.A. Effect of dietary supplementation of Bacillus subtilis spores on growth performance, oxidative status, and digestive enzyme activities in Japanese quail birds. Trop. Anim. Health Prod. 2020, 52, 671–680. [Google Scholar] [CrossRef]
  47. Huang, Y.; Shi, X.; Li, Z.; Shen, Y.; Shi, X.; Wang, L.; Li, G.; Yuan, Y.; Wang, J.; Zhang, Y.; et al. Possible association of Firmicutes in the gut microbiota of patients with major depressive disorder. Neuropsychiatr. Dis. Treat. 2018, 14, 3329–3337. [Google Scholar] [CrossRef] [Green Version]
  48. Müller, J.A.; Galushko, A.S.; Kappler, A.; Schink, B. Initiation of anaerobic degradation of p-cresol by formation of 4-hydroxybenzylsuccinate in desulfobacterium cetonicum. J. Bacteriol. 2001, 183, 752–757. [Google Scholar] [CrossRef] [Green Version]
  49. Ubeda, C.; Bucci, V.; Caballero, S.; Djukovic, A.; Toussaint, N.C.; Equinda, M.; Lipuma, L.; Ling, L.; Gobourne, A.; No, D.; et al. Intestinal microbiota containing Barnesiella species cures vancomycin-resistant enterococcus faecium colonization. Infect. Immun. 2013, 81, 965–973. [Google Scholar] [CrossRef] [Green Version]
  50. Unno, T.; Kim, J.M.; Guevarra, R.B.; Nguyen, S.G. Effects of antibiotic growth promoter and characterization of ecological succession in Swine gut microbiota. J. Microbiol. Biotechnol. 2015, 25, 431–438. [Google Scholar] [CrossRef] [Green Version]
  51. Lauridsen, C. From oxidative stress to inflammation: Redox balance and immune system. Poult. Sci. 2019, 98, 4240–4246. [Google Scholar] [CrossRef] [PubMed]
  52. Spyropoulos, B.G.; Misiakos, E.P.; Fotiadis, C.; Stoidis, C.N. Antioxidant properties of probiotics and their protective effects in the pathogenesis of radiation-induced enteritis and colitis. Dig. Dis. Sci. 2011, 56, 285–294. [Google Scholar] [CrossRef] [PubMed]
  53. Li, W.H.; Wang, L.; He, H.Y.; Chen, J.; Yu, Y.R. Expression of neutrophil gelatinase-associated lipocalin in low osmolar contrast-induced nephropathy in rats and the effect of N-acetylcysteine. Exp. Ther. Med. 2016, 12, 3175–3180. [Google Scholar] [CrossRef] [Green Version]
  54. Bai, K.; Huang, Q.; Zhang, J.; He, J.; Zhang, L.; Wang, T. Supplemental effects of probiotic Bacillus subtilis fmbJ on growth performance, antioxidant capacity, and meat quality of broiler chickens. Poult. Sci. 2017, 96, 74–82. [Google Scholar] [CrossRef] [PubMed]
  55. Suzuki, T.; Yoshida, S.; Hara, H. Physiological concentrations of short-chain fatty acids immediately suppress colonic epithelial permeability. Br. J. Nutr. 2008, 100, 297–305. [Google Scholar] [CrossRef] [PubMed] [Green Version]
  56. Li, X.; Wu, S.; Li, X.; Yan, T.; Duan, Y.; Yang, X.; Duan, Y.; Sun, Q.; Yang, X. Simultaneous supplementation of Bacillus subtilis and antibiotic growth promoters by stages improved intestinal function of pullets by altering gut microbiota. Front. Microbiol. 2018, 9, 2328. [Google Scholar] [CrossRef]
  57. Sergeant, M.J.; Constantinidou, C.; Cogan, T.A.; Bedford, M.R.; Penn, C.W.; Pallen, M.J. Extensive microbial and functional diversity within the chicken cecal microbiome. PLoS ONE 2014, 9, e919412014. [Google Scholar] [CrossRef] [Green Version]
  58. Pfefferle, P.I.; Renz, H. The mucosal microbiome in shaping health and disease. F1000Prime Rep. 2014, 6, 11. [Google Scholar] [CrossRef]
  59. Piao, C.S.; Gao, S.; Lee, G.H.; Kim, D.S.; Park, B.H.; Chae, S.W.; Chae, H.J.; Kim, S.H. Sulforaphane protects ischemic injury of hearts through antioxidant pathway and mitochondrial K(ATP) channels. Pharmacol. Res. 2010, 61, 342–348. [Google Scholar] [CrossRef]
  60. Wang, S.; Wu, H.; Zhu, Y.; Cui, H.; Yang, J.; Lu, M.; Cheng, H.; Gu, L.; Xu, T.; Xu, L. Effect of lycopene on the growth performance, antioxidant enzyme activity, and expression of gene in the Keap1-Nrf2 signaling pathway of arbor acres broilers. Front. Vet. Sci. 2022, 9, 833346. [Google Scholar] [CrossRef] [PubMed]
  61. Oladokun, S.; Koehler, A.; MacIsaac, J.; Ibeagha-Awemu, E.M.; Adewole, D.I. Bacillus subtilis delivery route: Effect on growth performance, intestinal morphology, cecal short-chain fatty acid concentration, and cecal microbiota in broiler chickens. Poult. Sci. 2021, 100, 100809. [Google Scholar] [CrossRef]
  62. Qiu, K.; Li, C.L.; Wang, J.; Qi, G.H.; Gao, J.; Zhang, H.J.; Wu, S.G. Effects of dietary supplementation with bacillus subtilis, as an alternative to antibiotics, on growth performance, serum immunity, and intestinal health in broiler chickens. Front. Nutr. 2021, 8, 786878. [Google Scholar] [CrossRef]
  63. Li, X.W.; Chen, H.P.; He, Y.Y.; Chen, W.L.; Chen, J.W.; Gao, L.; Hu, H.Y.; Wang, J. ffects of rich-polyphenols extract of dendrobium loddigesii on anti-diabetic, anti-inflammatory, anti-oxidant, and gut microbiota modulation in db/db mice. Molecules 2018, 23, 3245. [Google Scholar] [CrossRef] [PubMed] [Green Version]
  64. Zhang, L.; Wu, W.; Lee, Y.K.; Xie, J.; Zhang, H. Spatial heterogeneity and Co-occurrence of mucosal and luminal microbiome across swine intestinal tract. Front. Microbiol. 2018, 9, 48. [Google Scholar] [CrossRef] [PubMed] [Green Version]
  65. Pandit, R.J.; Hinsu, A.T.; Patel, N.V.; Koringa, P.G.; Jakhesara, S.J.; Thakkar, J.R.; Shah, T.M.; Limon, G.; Psifidi, A.; Guitian, J.; et al. Microbial diversity and community composition of caecal microbiota in commercial and indigenous Indian chickens determined using 16s rDNA amplicon sequencing. Microbiome 2018, 6, 115. [Google Scholar] [CrossRef] [PubMed]
  66. Zhang, S.; Zhong, G.; Shao, D.; Wang, Q.; Hu, Y.; Wu, T.; Ji, C.; Shi, S. Dietary supplementation with Bacillus subtilis promotes growth performance of broilers by altering the dominant microbial community. Poult. Sci. 2021, 100, 100935. [Google Scholar]
  67. Awad, W.A.; Mann, E.; Dzieciol, M.; Hess, C.; Schmitz-Esser, S.; Wagner, M.; Hess, M. Age-related differences in the luminal and mucosa-associated gut microbiome of broiler chickens and shifts associated with campylobacter jejuni infection. Front. Cell Infect. Microbiol. 2016, 6, 154. [Google Scholar] [CrossRef] [Green Version]
  68. Mancabelli, L.; Ferrario, C.; Milani, C.; Mangifesta, M.; Turroni, F.; Duranti, S.; Lugli, G.A.; Viappiani, A.; Ossiprandi, M.C.; van Sinderen, D.; et al. Insights into the biodiversity of the gut microbiota of broiler chickens. Environ. Microbiol. 2016, 18, 4727–4738. [Google Scholar] [CrossRef]
Figure 1. Effects of Bacillus subtilis BC02 supplementation on serum biochemical index content of broilers (n = 6). (A) Contents of total protein (TP) in the serum; (B) contents of triglyceride (TG) in the serum; (C) contents of total cholesterol (TC) in the serum; (D) contents of glucose (GLU) in the serum; (E) contents of urea nitrogen (BUN) in the serum. Con, BS250, and BS500 represent the control group and Bacillus subtilis supplemented at 250 and 500 mg/kg, respectively. a,b Means within a row different lowercase letters indicate significant differences (p < 0.05).
Agriculture 13 01561 g001
Figure 2. Effects of Bacillus subtilis BC02 supplementation on serum antioxidant of the broilers (n = 6). (A) Activities of superoxide dismutase (SOD) in the serum; (B) contents of malondialdehyde (MDA) in the serum; (C) contents of glutathione (GSH) in the serum. Con, BS250, and BS500 represent the control group and Bacillus subtilis supplemented at 250 and 500 mg/kg, respectively. a,b Means within a row different lowercase letters indicate significant differences (p < 0.05).
Agriculture 13 01561 g002
Figure 3. Effects of Bacillus subtilis BC02 supplementation on jejunum antioxidant of the broilers (n = 6). (A) Activities of superoxide dismutase (SOD) in the jejunum; (B) contents of malondialdehyde (MDA) in the jejunum; (C) contents of glutathione (GSH) in the jejunum; (D) the mRNA expression of superoxide dismutase 1 (SOD1); (E) the mRNA expression of superoxide dismutase 2 (SOD2); (F) the mRNA expression of catalase (CAT); (G) the mRNA expression of glutathione peroxidase 1 (GPX1); (H) the mRNA expression of nuclear factor erythroid 2-related factor 2 (Nrf2). Con, BS250, and BS500 represent the control group and Bacillus subtilis supplemented at 250 and 500 mg/kg, respectively. a,b Means within a row different lowercase letters indicate significant differences (p < 0.05).
Agriculture 13 01561 g003
Figure 4. The effects of Bacillus subtilis BC02 supplementation on the jejunum morphology of broilers (n = 6). Figure (AC) representative images (40×) were stained with hematoxylin and eosin (H & E). (D) Villus height; (E) crypt depth; (F) velvet concealed ratio. Con, BS250, and BS500 represent the control group and Bacillus subtilis supplemented at 250 and 500 mg/kg, respectively. a,b Means within a row different lowercase letters indicate significant differences (p < 0.05).
Agriculture 13 01561 g004
Figure 5. Effects of Bacillus subtilis BC02 supplementation on jejunum inflammatory factor mRNA expression of the broilers (n = 6). Figures (AE) represent the mRNA expression of interleukin-2 (IL-2), interleukin-4 (IL-4), interleukin-6 (IL-6), interleukin-10 (IL-10), and interleukin-12 (IL-12), respectively. Con, BS250, and BS500 represent the control group and Bacillus subtilis supplemented at 250 and 500 mg/kg, respectively. a,b Means within a row different lowercase letters indicate significant differences (p < 0.05).
Agriculture 13 01561 g005
Figure 6. Differences in bacterial community diversity and richness among the treatments (n = 6). (A) Venn diagram drawn by OTUs; (B) cumulative box plot of species, small circles represent outliers where the data exceeds the uper or lower limits; (C) species diversity curve. Con, BS250, and BS500 represent the control group and Bacillus subtilis supplemented at 250 and 500 mg/kg, respectively.
Agriculture 13 01561 g006
Figure 7. Alpha diversity index analysis (n = 6). (A) The Chao1 index in the cecum microorganism; (B) the ACE index in the cecum microorganism; (C) the Shannon index in the cecum microorganism; (D) the Simpson index in the cecum microorganism. Con, BS250, and BS500 represent the control group and Bacillus subtilis supplemented on 250 and 500 mg/kg, respectively.
Agriculture 13 01561 g007
Figure 8. Beta diversity index analysis (n = 6). (A) Principal coordinates analysis (PCoA) profile of weighted unifrac distances; (B) principal component analysis phylum level; (C) principal component analysis genus level; (D) cluster analysis of unweighted pairs method (UPGMA). Weighted unifrac distances with arithmetic means. Con, BS250, and BS500 represent the control group and Bacillus subtilis supplemented on 250 and 500 mg/kg, respectively.
Agriculture 13 01561 g008
Figure 9. Species relative abundance column chart (n = 6). (A) Column diagram of relative abundance of horizontal species of phylum; (B) column diagram of relative abundance of horizontal species of genus. Con, BS250, and BS500 represent the control group and Bacillus subtilis supplemented on 250 and 500 mg/kg, respectively.
Agriculture 13 01561 g009
Figure 10. Simper difference contribution analysis chart (n = 6). (A) The simper difference contribution analysis chart of horizontal species of phylum (Top 10); (B) the simper difference contribution analysis chart of horizontal species of genus (Top 30). MS250 represent dietary supplemented with 250 mg/kg Bacillus subtilis BC02; MS500 represent dietary supplemented with 500 mg/kg Bacillus subtilis BC02; The number after point represent one repetition of each treatments. Con, BS250, and BS500 represent the control group and Bacillus subtilis supplemented on 250 and 500 mg/kg, respectively.
Agriculture 13 01561 g010
Figure 11. LDA effect size analysis (n = 6). (A) The LDA value distribution histogram; (B) the evolutionary branch diagram, the node size corresponds to the average relative abundance of the taxa. Con, BS250, and BS500 represent the control group and Bacillus subtilis supplemented on 250 and 500 mg/kg, respectively.
Agriculture 13 01561 g011
Figure 12. The correlation analysis heat map (n = 6). Correlation analysis between Top10 phylum and genus levels and growth performance, serum biochemical content, and antioxidant capacity. (A,D) Growth performance; (B,E) serum biochemical content; (C,F) serum antioxidant capacity. ADG: average daily gain; ADFI: average daily feed intake; F/G: feed: gain ration; TP: total protein; TG: triglyceride; TC: total cholesterol; GLU: glucose; SUN: serum urea nitrogen; SOD: superoxide dismutase; MDA: malondialdehyde; GSH: glutathione. The square color was proportional to the correlation coefficient. * represents p < 0.05; ** represents p < 0.01.
Agriculture 13 01561 g012
Table 1. Composition and nutrient levels in the basal diet (DM basis) %.
Ingredients1–14 d15–28 d29–42 dNutrient Levels 21–14 d15–28 d29–42 d
Corn33.6033.9034.20ME, MJ/kg12.1312.7613.39
Wheat29.0029.0029.00CP22.0021.0020.00
46% Puffed soybean meal23.8021.4019.00Ca0.960.90.84
Cottonseed meal4.004.004.00Phosphorus0.660.610.56
Corn protein flour2.002.002.00Nonphytate phosphorus0.450.430.4
Hydrolyzed feather meal1.001.001.00Lysine, %1.471.451.43
16.5% Calcium hydrogen phosphate0.900.850.80Methionine, %0.590.550.51
Limestone1.701.651.60Threonine, %0.920.870.82
Soybean oil2.004.206.40
Premix 12.002.002.00
Total100100100
1 The premix provided the following per kilogram of diet: VA 12 500 IU; VD3 2 500 IU; VK3 2.65 mg; VB1 2 mg; VB2 6 mg; VB12 0.025 mg; VE 30 IU; biotin 0.0325 mg; folic acid, 1.25 mg; pantothenic acid 12 mg; nicotinic acid 50 mg; Cu 8 mg; Zn 75 mg; Fe 80 mg; Mn 100 mg; Se 0.15 mg; I 0.35 mg. 2 The nutrient levels were calculated values.
Table 2. Primer sequences used for quantitative real-time PCR.
Target Genes 2Primer Sequence 1 (5′ to 3′)Product SizeAccession No.
SOD1F: CGCAGGTGCTCACTTCAATCC
R: CAGTCACATTGCCGAGGTCAC
89NM_205064.2
SOD2F: GCTGTATCAGTTGGTGTTCAAGGA
R: GCAATGGAATGAGACCTGTTGTTC
130NM_204211.2
CATF: GGAGGTAGAACAGATGGCGTATG
R: CGATGTCTATGCGTGTCAGGAT
114NM_001031215.2
CAT1F: CTCTGGCTTGGTGGTGAACATCT
R: CGTGCTTGGCTTGAGGGTAGT
88NM_001145490.2
GPX1F: CGGCTTCAAACCCAACTTCAC
R: CTCTCTCAGGAAGGCGAACAG
85NM_001277853.3
Keap1F: GCATCACAGCAGCGTGGAGAG
R: GCGTACAGCAGTCGGTTCAGC
108NC_028739.2
Nrf2F: CGCAGAGCACAGATACTTCAA
R: CTGGAGAAGCCTCATTGTCATCTA
109NM_001396902.1
IL-2F: GCAGTGTTACCTGGGAGAAGT
R: GGTGTGATTTAGACCCGTAAGACT
133NM_204153.2
IL-4F: GTCTTCCTCAACATGCGTCAG
R: CCATTGAAGTAGTGTTGCCTGCT
93NM_001007079.2
IL-6F: AACAACCTCAACCTGCCCAAG
R: AGGTAGGTCTGAAAGGCGAACA
116NM_204628.2
IL-10F: GGGTGAAGTTTGAGGAAATTAAGGA
R: TCATCTGTAGAAGCGCAGCA
148NM_001004414.4
IL-12F: ATGTCTCACCTGCTATTTGCCTTA
R: GTCTCATCGTTCCACTCAGATTCT
116NM_213571.2
β-actinF: ATTGTCCACCGCAAATGCTTC
R: AAATAAAGCCATGCCAATCTCGTC
113NM_205518.1
1 F: forward primer; R: reverse primer; 2 SOD1, superoxide dismutase 1; SOD2, superoxide dismutase 2; CAT, catalase; CAT1, catalase 1; GPX1, glutathione peroxidase 1; Keap1, Kelch-like ECH-associated protein 1; Nrf2, nuclear factor erythroid 2-related factor 2; IL-2, interleukin-2; IL-4, interleukin-4; IL-6, interleukin-6; IL-10, interleukin-10; IL-12, interleukin-12.
Table 3. Effects of Bacillus subtilis on the growth performance of broilers 1.
Items 2ConBS250BS500SEM 3p-Value
0–14 d
1 d-LBW, g42.6242.7742.380.3340.905
14 d-LBW, g361.88 b385.50 a396.27 a4.7310.017
ADG, g23.54 b24.60 a24.81 a0.2060.015
ADFI, g31.30 a29.85 a,b28.62 b0.316<0.001
F/G1.33 a1.21 b1.16 b0.019<0.001
14–28 d
28 d-LBW, g774.66775.51729.0118.0700.514
ADG, g64.2264.7764.850.7900.734
ADFI, g119.15118.00116.721.1390.711
F/G1.861.831.810.0210.328
29–42 d
42 d-LBW, g1220.21152.81158.455.8320.875
ADG, g65.3566.1866.911.0720.787
ADFI, g157.99152.80149.342.2770.533
F/G2.432.312.240.0350.151
0–28 d
ADG, g43.8744.6944.830.4420.417
ADFI, g75.2773.9372.670.6310.269
F/G1.59 a1.52 a,b1.48 b0.016<0.001
0–42 d
ADG, g51.0351.8552.190.4850.423
ADFI, g102.84100.2298.220.8860.210
F/G1.87 a1.78 a,b1.73 b0.018<0.001
ADG = average daily gain; ADFI = average daily feed intake; F/G = ADFI, g/DAG, g. 1 Data are means for 6 replicates of 16 broilers per replicate. 2 Con, BS250, and BS500 represent the control group, Bacillus subtilis supplemented at 250 and 500 mg/kg, respectively. 3 Total standard error of the means. a,b Means within a row with different letters are significantly different (p < 0.05).
Disclaimer/Publisher’s Note: The statements, opinions and data contained in all publications are solely those of the individual author(s) and contributor(s) and not of MDPI and/or the editor(s). MDPI and/or the editor(s) disclaim responsibility for any injury to people or property resulting from any ideas, methods, instructions or products referred to in the content.

