Article

Parameterization of the Response Function of Sesame to Drought and Salinity Stresses

by
Hamed Ebrahimian
1,2,
Haruyuki Fujimaki
2,* and
Kristina Toderich
3
1
Department of Irrigation and Reclamation Engineering, College of Agriculture and Natural Resources, University of Tehran, Karaj 31587-77871, Iran
2
Arid Land Research Center (ALRC), Tottori University, Tottori 680-0001, Japan
3
International Platform for Dryland Research and Education (IPDRE), Tottori University, Tottori 680-0001, Japan
*
Author to whom correspondence should be addressed.
Agriculture 2023, 13(8), 1516; https://doi.org/10.3390/agriculture13081516
Submission received: 22 June 2023 / Revised: 24 July 2023 / Accepted: 26 July 2023 / Published: 28 July 2023

Abstract

:
In drylands, poor rains combined with high evaporation rates increase the risks of soil salinization in addition to drought stress. Here, we determined the values of the parameters in the Feddes root water uptake function for sesame (Sesamum indicum L.) under drought and salinity stresses in a pot experiment using “Lebap-55”, which has been bred for the drylands of the Aral Sea Basin but is moderately sensitive to salinity stress. We measured the hourly values of the transpiration, soil moisture, and salinity in the upper and lower soil layers in pots, solar radiation, and root distribution. The values were quantified by two methods. The bulk method uses only daily pot weight data, and the average soil water content and salt concentration are back-calculated from the mass balance. The inverse method uses the monitored values of the soil water content and salinity as well as daily weight data and solar radiation. Both methods could successfully estimate all the parameter values for both stresses. The bulk method performed better under drought stress, even without the measured soil water content or root distribution. It also had satisfactory accuracy in estimating the values under salinity stress. Both methods performed better under drought stress than under salinity stress. The parameter values determined here could be used for irrigation scheduling and salinity management using numerical models for the studied crop.

1. Introduction

Drought and salinity are becoming increasingly common, particularly in arid and semi-arid regions. Food security is becoming significantly important because of the growing population and climate change. Sustainable farming is crucial under severe environmental conditions, such as drought, soil salinity, and heat stress. Therefore, crop irrigation scheduling and farm water management must be optimized to promote food security and farmers’ better livelihoods [1]. Salinization is recognized to be among the most severe soil degradation factors in arid and semiarid regions [2]. Access to fresh irrigation water in these regions has drastically decreased in recent years, imposing additional obstacles to agricultural production. Crop diversification through the cultivation of salt- and drought-tolerant unconventional crops could be an option to sustain productivity of salt-affected drylands. This can be achieved by integrating new genetically improved lines with high yield- and quality-promoting traits into a saline agricultural production system [3].
Crop responses to drought and salinity stresses must first be predicted. Many simulation models can simulate crop responses to abiotic stresses if the crop parameter values as inputs are accurately determined. Models such as AquaCrop [4], WASH_2D [5], HYDRUS [6], SWAP [7], and APSIM [8] use a root water uptake function to take drought and salinity stresses into account. As most use the macroscopic root water uptake function [9], determining the crop parameter values of this function is important for improving their accuracy in order to estimate crop yield and water use. In addition, the crop parameters need to be calibrated for each crop.
Several studies have determined the parameter values of the Feddes response function for various crops, including alfalfa in a sandy loam in the Netherlands [10], soybean in a sand in Tsukuba, Japan [11], jatropha and canola in a Kanto loam in Tsukuba [12,13], spring maize in a sandy loam in northwest China [14], and winter wheat in a stony soil in Selhausen, Germany [15]. Fujimaki and Kikuchi [12] determined the response function of jatropha to drought and salinity stresses by using experimental data and an inverse approach and showed that jatropha is more sensitive to both stresses than soybean and wheat. Cai et al. [15] used inverse modeling to optimize the parameter values of winter wheat by using the measured soil water content, soil water potential, and cumulative daily actual transpiration. Massoud et al. [16] and Dainese and Tarantino [17] used an inverse modeling approach to derive the parameters of the Feddes root water uptake model (Feddes response function) for tree species by using sap flux and stem water potential. Rabbel et al. [18] parameterized the Feddes root water uptake model for Norway spruce by using sap flow data and demonstrated the potential of sap flow measurements for the determination of water stress in forest trees. De Melo and van Lier [19] highlighted the importance of calibrating the parameter values of the Feddes root water uptake model under different conditions (soil, climate, crop) to enhance its applicability and accuracy, and suggested using inverse modeling approaches to determine the values of the root water uptake parameters. But whereas several studies have determined the drought stress response function, few have determined the salinity stress response function.
Sesame (Sesamum indicum L.; Pedaliaceae) is a major annual oilseed crop that was domesticated some 5500 years ago [20]. It is grown mainly for oil production. Growing in arid and semi-arid lands, it is exposed to drought and salinity stresses [21,22], which impose the main yield-limiting constraints during both vegetative and flowering stages [3]. Several studies have investigated the effects of these stresses on sesame growth and yield. Sun et al. [23] showed that drought stress had stronger effects at the flowering stage than that at the seedling stage, and responses differed among genotypes. In Isfahan, Iran, Bahrami, and Razmjo [24] found that germination and early seedling growth of ten sesame cultivars were strongly inhibited by an electrical conductivity of water (ECw) of 12.05 dS m−1. In Morocco, El Harfi et al. [25] found that salinity stress had a lesser inhibitory effect on germination and seedling growth compared to drought stress. Additionally, both stresses had a greater impact on seedling growth than on seed germination. In Campina Grande, Brazil, Suassuna et al. [26] found that salinity did not affect sesame germination, but seedling growth was hindered at ECw ≥ 1.6 dS m−1. Seed production of sesame is affected by salinity at all phenological stages. Changes in nutritional value and phytochemical composition of sesame induced by soil salinity significantly lower grain production [27].
Sesame is classified as sensitive to salinity stress [28], dependent on cultivar, climate, soil conditions, and cultural practices. However, it is more tolerant than other oilseed crops [29]. Sesame is relatively drought-tolerant, but severe drought stress can curtail its yield [30]. Its yield capacity under salinity stress varies widely among cultivars and phenological stages; the cultivar Lebap-55, from Uzbekistan, is more tolerant than other cultivars at the germination and initial growth stages. In the Aral Sea Basin, the increase in soil salinity and sodicity has significant agricultural impacts, as it reduces crop production and soil quality. The pre-reproductive and flowering stages in sesame are the most sensitive to salinity and drought stresses, which negatively influence seed production and seed quality at a commercial scale. Applying excessive amounts of fertilizer and irrigation during these stages can delay seed maturation and harvest without providing a proportional return on investment. We used the local variety, Lebap-55, which is widely recognized by local farmers and householders. Therefore, an investigation of salt-and-drought response of sesame cultivars would be beneficial for reclamation of marginal salt-affected lands that promote increasing the cultivation areas and seed production of sesame for local markets.
However, data on the effects of salinity on sesame in the available literature are scarce and there is no information on the phenological stages at which plants are most sensitive. Sesame production and productivity in the Aral Sea Basin are severely constrained by a lack of high-yielding and locally adapted cultivars. The cultivars grown there have low grain yields (<0.6 t ha−1). No published study has determined the parameter values for the root water uptake models of sesame under drought and salinity stresses. Thus, we determined the parameter values of sesame Lebap-55 local variety under salinity and drought stresses under a continental climate. Another purpose of this study is to compare two different methods, bulk and inverse, for quantifying the crop parameters values. The quantified parameters could be used for irrigation scheduling and salinity management to promote food security and sustainable saline agriculture.

2. Materials and Methods

2.1. Crop Response Function

The Feddes macroscopic root water uptake model [9] uses a reduction coefficient, α, to take abiotic stresses into consideration:
S = α S P
where S is the actual water uptake rate (s−1) and SP is the potential water uptake rate (s−1).
An additive form may be used to consider the reduction in the water uptake rate under combined drought and salinity stresses [31]:
α = 1 1 + h h 50 + h o h o 50 p
where h and ho are the matric and osmotic heads, respectively; h50 and ho50 are the matric and osmotic potentials when the water uptake is 50% of its potential rate; and p is an empirical parameter. Sp is proportional to root activity and potential transpiration as follows:
S P = β T P
where β is the normalized root density (cm−1) and TP is the potential transpiration rate (cm s−1).

2.2. Experiment

A pot experiment was conducted in a greenhouse at the Arid Land Research Center, Tottori University, Japan, from May to August 2022. It used seeds of Lebap-55, an early maturing, white-grain cultivar identified as a potential source material to use in breeding for the Aral Sea environment. The seeds were provided by the Karakalpakstan Research Institute of Agriculture and Agrotechnologies in Uzbekistan. All seeds were collected at the same time, under the same cultural management practices, and were treated with a dicarboximide before sowing. Lebap-55 is widely grown on salt-affected lands in the downstream of the Amu Darya River. We used three treatments—control (C, no stress), drought stress (W), and salinity stress (S)—with three replicates and hence nine pots (C1–C3, W1–W3, S1–S3). Seeds were sown on 27 May 2022 in plastic pots with an upper diameter of 15.9 cm, a lower diameter of 15.0 cm, and a height of 19.0 cm. One seed was sown per pot 3 cm deep; pots contained sand (1.40 g cm−3) for C and S but loamy sand (1.15 g cm−3) for W. Because of the highly non-linear retention curve of Tottori sand, drought stress may be imposed too sudden and suction estimation may be less accurate owning to measurement error of soil moisture. Therefore, we used a finer soil, loamy sand having smoother retention curve to drought pots. Both soils were collected in Tottori Prefecture, Japan. Figure 1 shows their hydraulic properties.
Two sensors were inserted horizontally into each of the six pots under stress at depths of 4.8 and 14.3 cm. The soil surface was covered with an aluminum-coated foam sheet to prevent evaporation. Plants were initially grown by applying enough tap water (electrical conductivity [EC] = 0.1 dS m−1) containing 1:1000-diluted liquid fertilizer (N-P-K = 8-0-5, Hyponex Japan, Osaka, Japan). Until 55 days after sowing, all pots were manually irrigated to keep the average volumetric soil water content (VWC) around 0.25. At 55 days after sowing, the W and S pots were saturated, and water was no longer applied to the W pots. All pots were weighed by hand daily at 09:00 on a balance (GX-12001M, A&D Co., Kotara, Australia) to monitor transpiration rate. The weights of all pots were also recorded automatically every hour in WinCT v. 5.4 software which downloads data from the A&D balance into a computer. The transpiration rate of each pot was calculated from the difference in weights between consecutive time steps. We considered transpiration from the control pots as potential transpiration and that from the stress pots as actual transpiration. The relative transpiration (ratio of actual to potential transpiration) was evaluated every morning, and when it fell below 0.5, NaCl solution of 2.0 g/L was applied to the S pots until the average volumetric soil water content reached 0.25. Fresh water was applied to the C pots every day to refill the root zone to around 0.25. When the relative transpiration decreased to 0.1, each pot was dismantled. By gradually increasing the salinity over time in the S treatment, we achieved a wide range of salinities. Similarly, by withholding water in the W treatment, we achieved a wide range of soil water contents.
Solar radiation was measured by a modular micro-environment weather station (ATMOS 41, Meter Group, Pullman, WA, USA) inside the greenhouse. The ATMOS 41 measures 12 weather variables, such as air temperature, relative humidity, vapor pressure, barometric pressure, wind speed and direction, solar radiation, precipitation, and lightning. It was connected to a datalogger (ZL6 Basic, Meter Group, Pullman, WA, USA). Total incoming solar radiation (direct and diffuse) is measured by a pyranometer at the top of the ATMOS 41. The ZL6 datalogger is purpose-built to collect data from environmental sensors. The datalogger has six ports for sensors and a micro-USB port for communicating with a computer. The logger uses six batteries, and solar cells recharge NiMH batteries. The soil water contents in all W pots and the S1 and S2 pots were measured with a TEROS 10 soil moisture sensor (Meter Group). The soil water content and EC of the S3 pot (ECsw) were measured with a TEROS 12 soil moisture sensor. The TEROS 10 measures the volumetric water content of soil through the use of an electromagnetic field to measure the apparent dielectric permittivity of the surrounding medium. The TEROS 12 measures soil moisture, temperature, and EC; it applies an alternating electrical current to two electrodes and measures the resistance between them to determine the EC. The sensors in each S pot were also connected to a ZL6 datalogger, which recorded the outputs hourly. During the experiments, the response of transpiration was measured across a wide range of water contents in the W treatments and of salinities in the S treatments. At the end of the experiment, the soil in each pot was sliced at intervals of 4.8 cm to measure root density distribution. The soil was sieved through a 0.8-mm screen in water and the root segments were scanned at 400 dpi to obtain TIFF images. The total length of the root segments in each layer was automatically calculated in RhizoVision Explorer v. 2.0.3 software [32] in “broken roots” mode. The soil water content and the EC of the entire soil profile were determined by the oven drying method and by the EC meter (LAQUAtwin EC-33, Horiba, Kyoto, Japan), respectively. The data were also used for calibrating the sensors.
The dry aboveground biomass in each pot was measured after drying at 72 °C for 3 days. The crop water use efficiency (WUE) was determined as the amount of dry aboveground biomass produced per unit of water used by the crop (i.e., transpiration) [33]. The WUE was measured at the plant scale.
All statistical analyses were performed in SPSS v. 27 software (SPSS Inc., Chicago, IL, USA). Following analysis of variance, differences between treatments were tested by the LSD post hoc multiple comparison test.

2.3. Estimation Methods

We used the bulk method and the inverse method to determine the parameters of the stress response function (Equation (2)).

2.3.1. Bulk Method

We fitted the daily average values of the reduction coefficient, α, under drought and salinity stresses to the stress response functions to determine h50, ho50, and p. Using the final stored water and salt contents and weight each morning, we back-calculated the average water content and salt concentration each morning. This method is theoretically valid when both the root and water contents or salinity are uniform, and it may be practically valid if the distribution of the water content or salinity is linear and the gradient is small. It does not require monitoring the VWC and EC at different depths by sensors or a root distribution survey. We considered the mean water content between two consecutive mornings as the representative water content of a day. Similarly, using the final stored salt and the content added at each irrigation event, we back-calculated the average salt concentration each morning and considered the mean concentration between two consecutive mornings as the representative salt concentration of a day. The soil water content each morning (θi) in the drought pots is calculated as:
θ i = W i W f V t + θ f
where Wi is the pot weight on day i (g), Wf is the pot weight on the final day of the experiment (g), Vt is the total soil volume (cm3), and θ f is the soil water content on the final day (cm3 cm−3).
The soil water content each morning (θi) in the salinity pots is calculated as:
θ i = θ b i + θ a i 2
θ b i = W b i W f V t + θ f
θ a i = W a i W f V t + θ f
where θ b i   and θ a i are the soil water contents before and after irrigation (cm3 cm−3), and W b i and W a i   are the pot weights before and after irrigation (g). Irrigation was applied just after 09:00. The soil salt concentration on the morning of day i (Ci) in the salinity pots is calculated as:
M i = M i + 1 w a i w b i ρ w C w
C i   = M i θ i
where Mi is mass of salts (g) in the soil at the morning of i-th day, ρ w is density of water (g cm−3), Ci is the soil salt concentration at the morning of ith day (g cm−3) and Cw is the salt concentration of the irrigation water, 0.002 g cm−3.
To fit the stress response function (Equation (2)) with the values of the relative transpiration (α), the matric and osmotic heads in Equation (2) must be determined. Therefore, we used two well-known and common equations to convert the soil water content to the matric head and the salt concentration to the osmotic head. The soil water retention curve (Figure 1) was used to convert the soil water content to the matric head via van Genuchten’s (1980) equation:
h = 1 A θ θ r θ s θ r 1 n 1 1 n
where h is the matric head (cm), θ   is the soil water content (cm3 cm−3), θs is the saturated soil water content (cm3 cm−3), θr is the residual soil water content (cm3 cm−3), A is the inverse of the air-entry value (cm−1), and n is the pore-size distribution index (dimensionless).
The modified van’t Hoff’s equation was used to convert the salt concentration to the osmotic head:
h o = 2 ω c M x R T
where ho is the osmotic head (cm), ω is the unit sensing element (10.2 cm kg J−1), M is the molecular mass of NaCl (58.5 g mol−1), c is the salt concentration (g kg−1), x is the osmotic coefficient (dimensionless), R is the gas constant (8.31 J mol−1 K−1), and T is the temperature (K). Finally, the matric and osmotic heads were used for the curve fitting in Equation (2) to determine h50, ho50, and p.

2.3.2. Inverse Method

This method needs at least two observation points of the VWC and EC and a root distribution survey [13]. Both the matric and osmotic head distributions were estimated by linearly interpolating/extrapolating the values at the observation points. The parameter values in the response function were inversely estimated by Levenberg–Marquardt’s maximum neighborhood method [34]. The required data include the daily relative transpiration and hourly solar radiation, in addition to the root length density, hourly soil water content, and bulk EC at the two depths. We converted the values of the bulk EC to those of the soil solution using a relationship between the water content and the relative concentration for sand. The values of the EC of the soil solution were then converted to the NaCl concentration and the osmotic head using Equation (11). In this method, the hourly relative transpiration is estimated by assuming that the pattern of transpiration is the same as that of the short-wave radiation [12]. The matric head at each depth was calculated by using the retention function of each soil (Figure 1). The osmotic head at each depth was calculated with Equation (11).
The objective function is set as the root mean square error (RMSE) between the measured and calculated daily transpiration (τ and τcal, respectively), which should be minimized to optimize the crop parameters:
R M S E B = 1 N τ = 1 N τ c a l ( B ) τ 2 0.5
where B is the vector of the optimized parameter. More details of the inverse method are provided by Yanagawa and Fujimaki [13].
As described above, the bulk method is a simplified method that needs a minimum of measurement data and simple calculations, while the inverse method needs not only much more measurement data but also more complicated computations to determine the crop parameter values. In both methods, the relative transpiration is calculated via Equation (2) using the estimated values of the crop parameters (i.e., h50, ho50, and p) and the calculated matric and osmotic heads equivalent to the soil water content (Equation (10)) and salt concentration (Equation (11)), respectively.

3. Results and Discussion

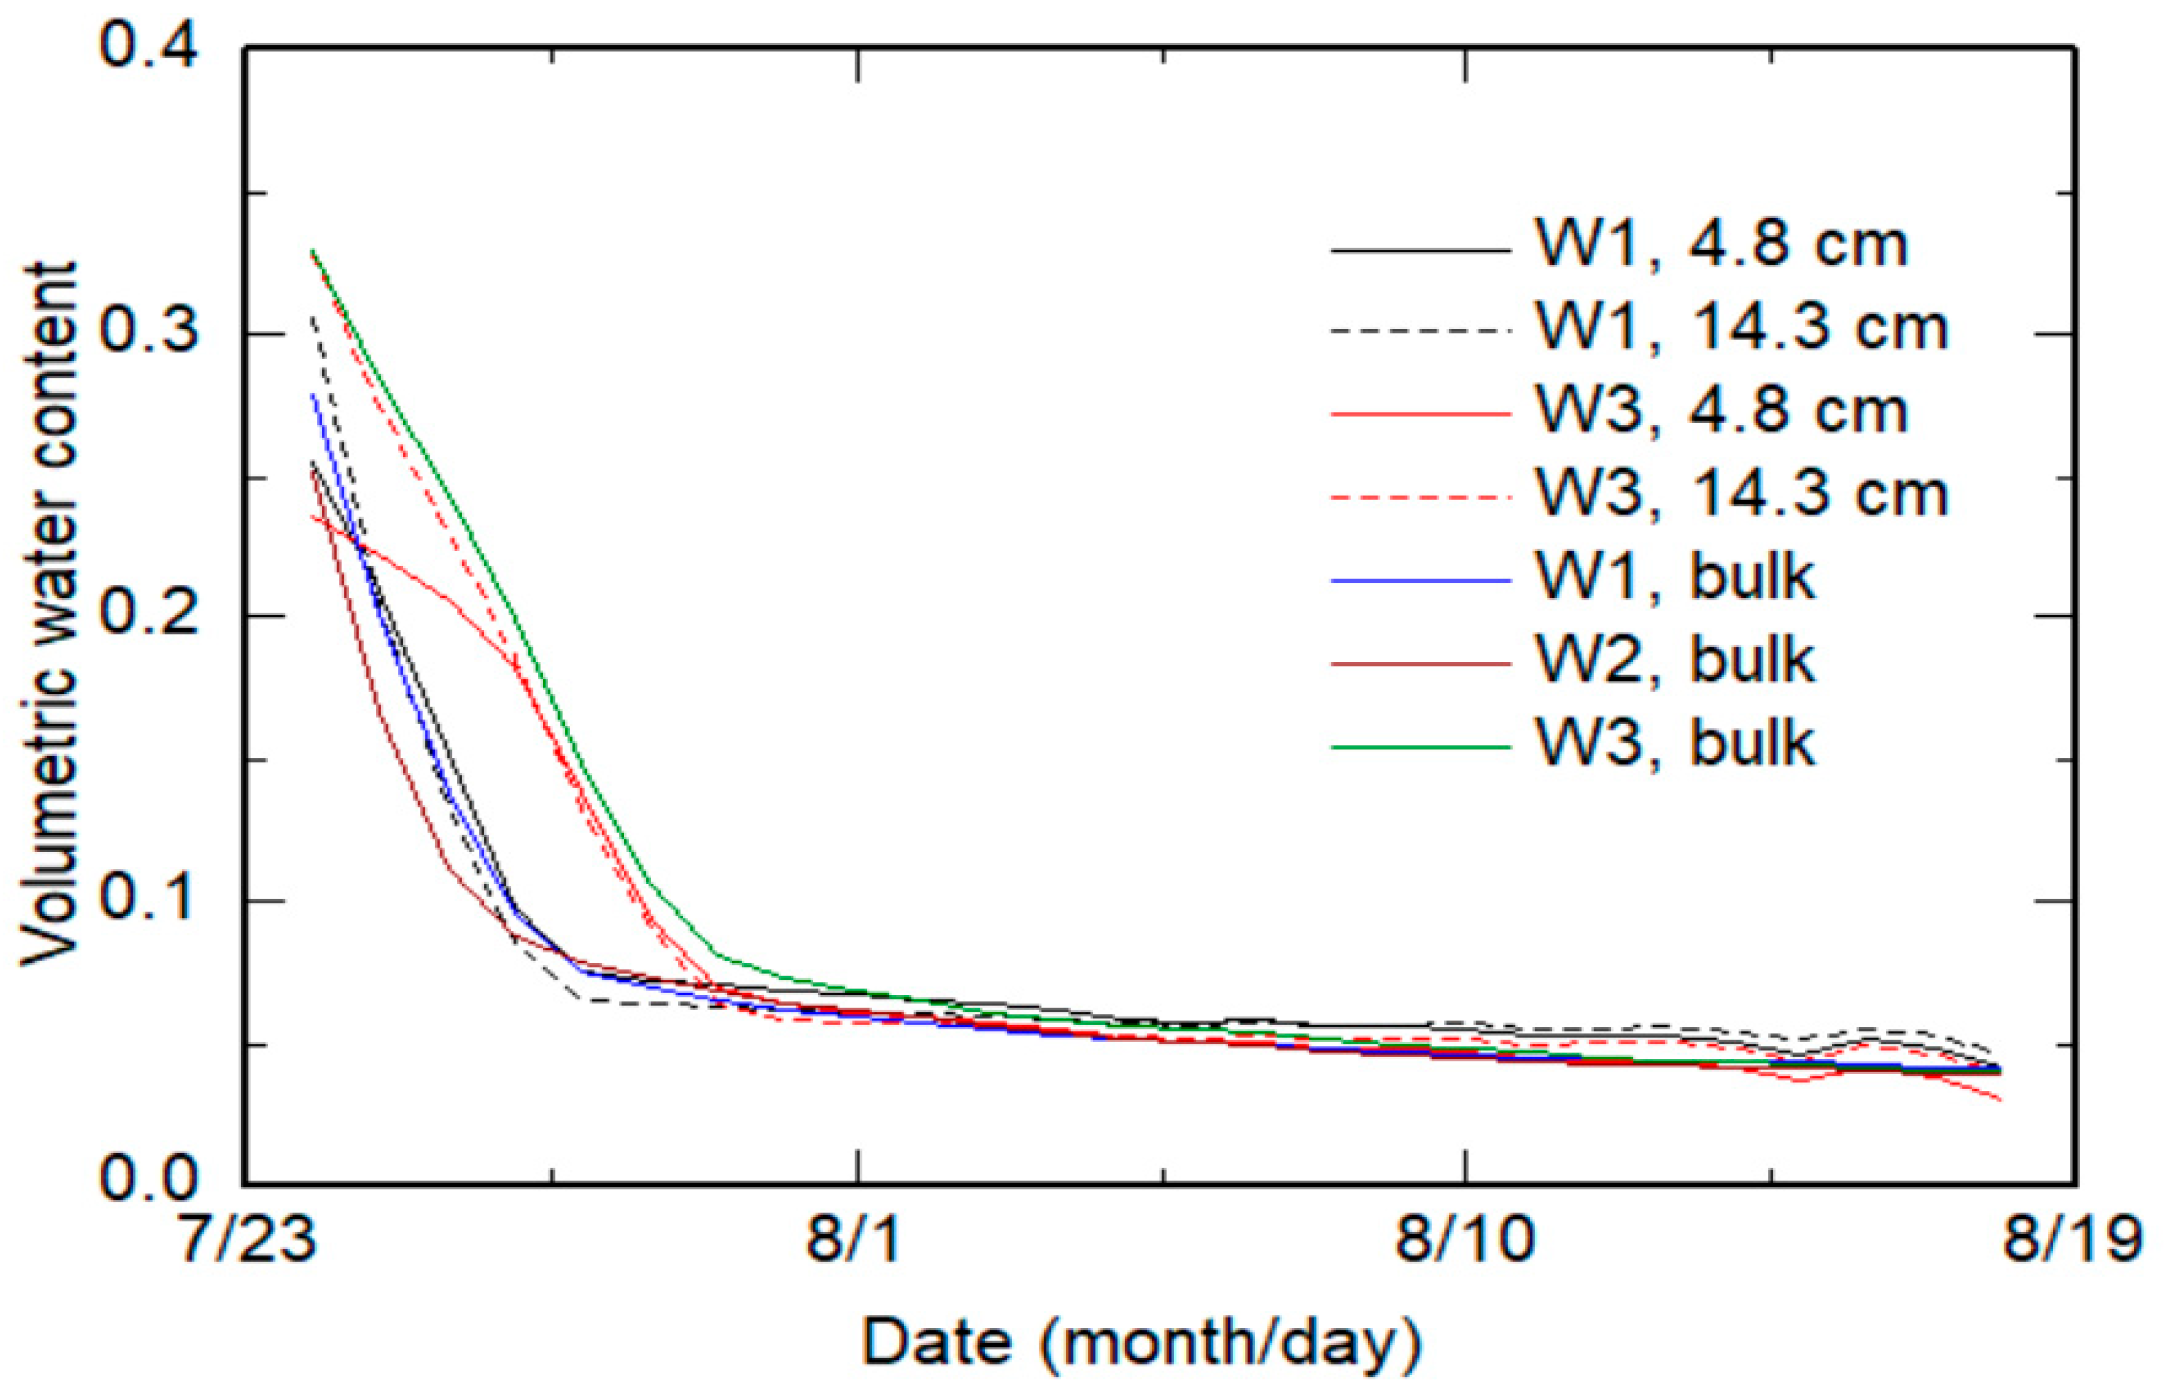
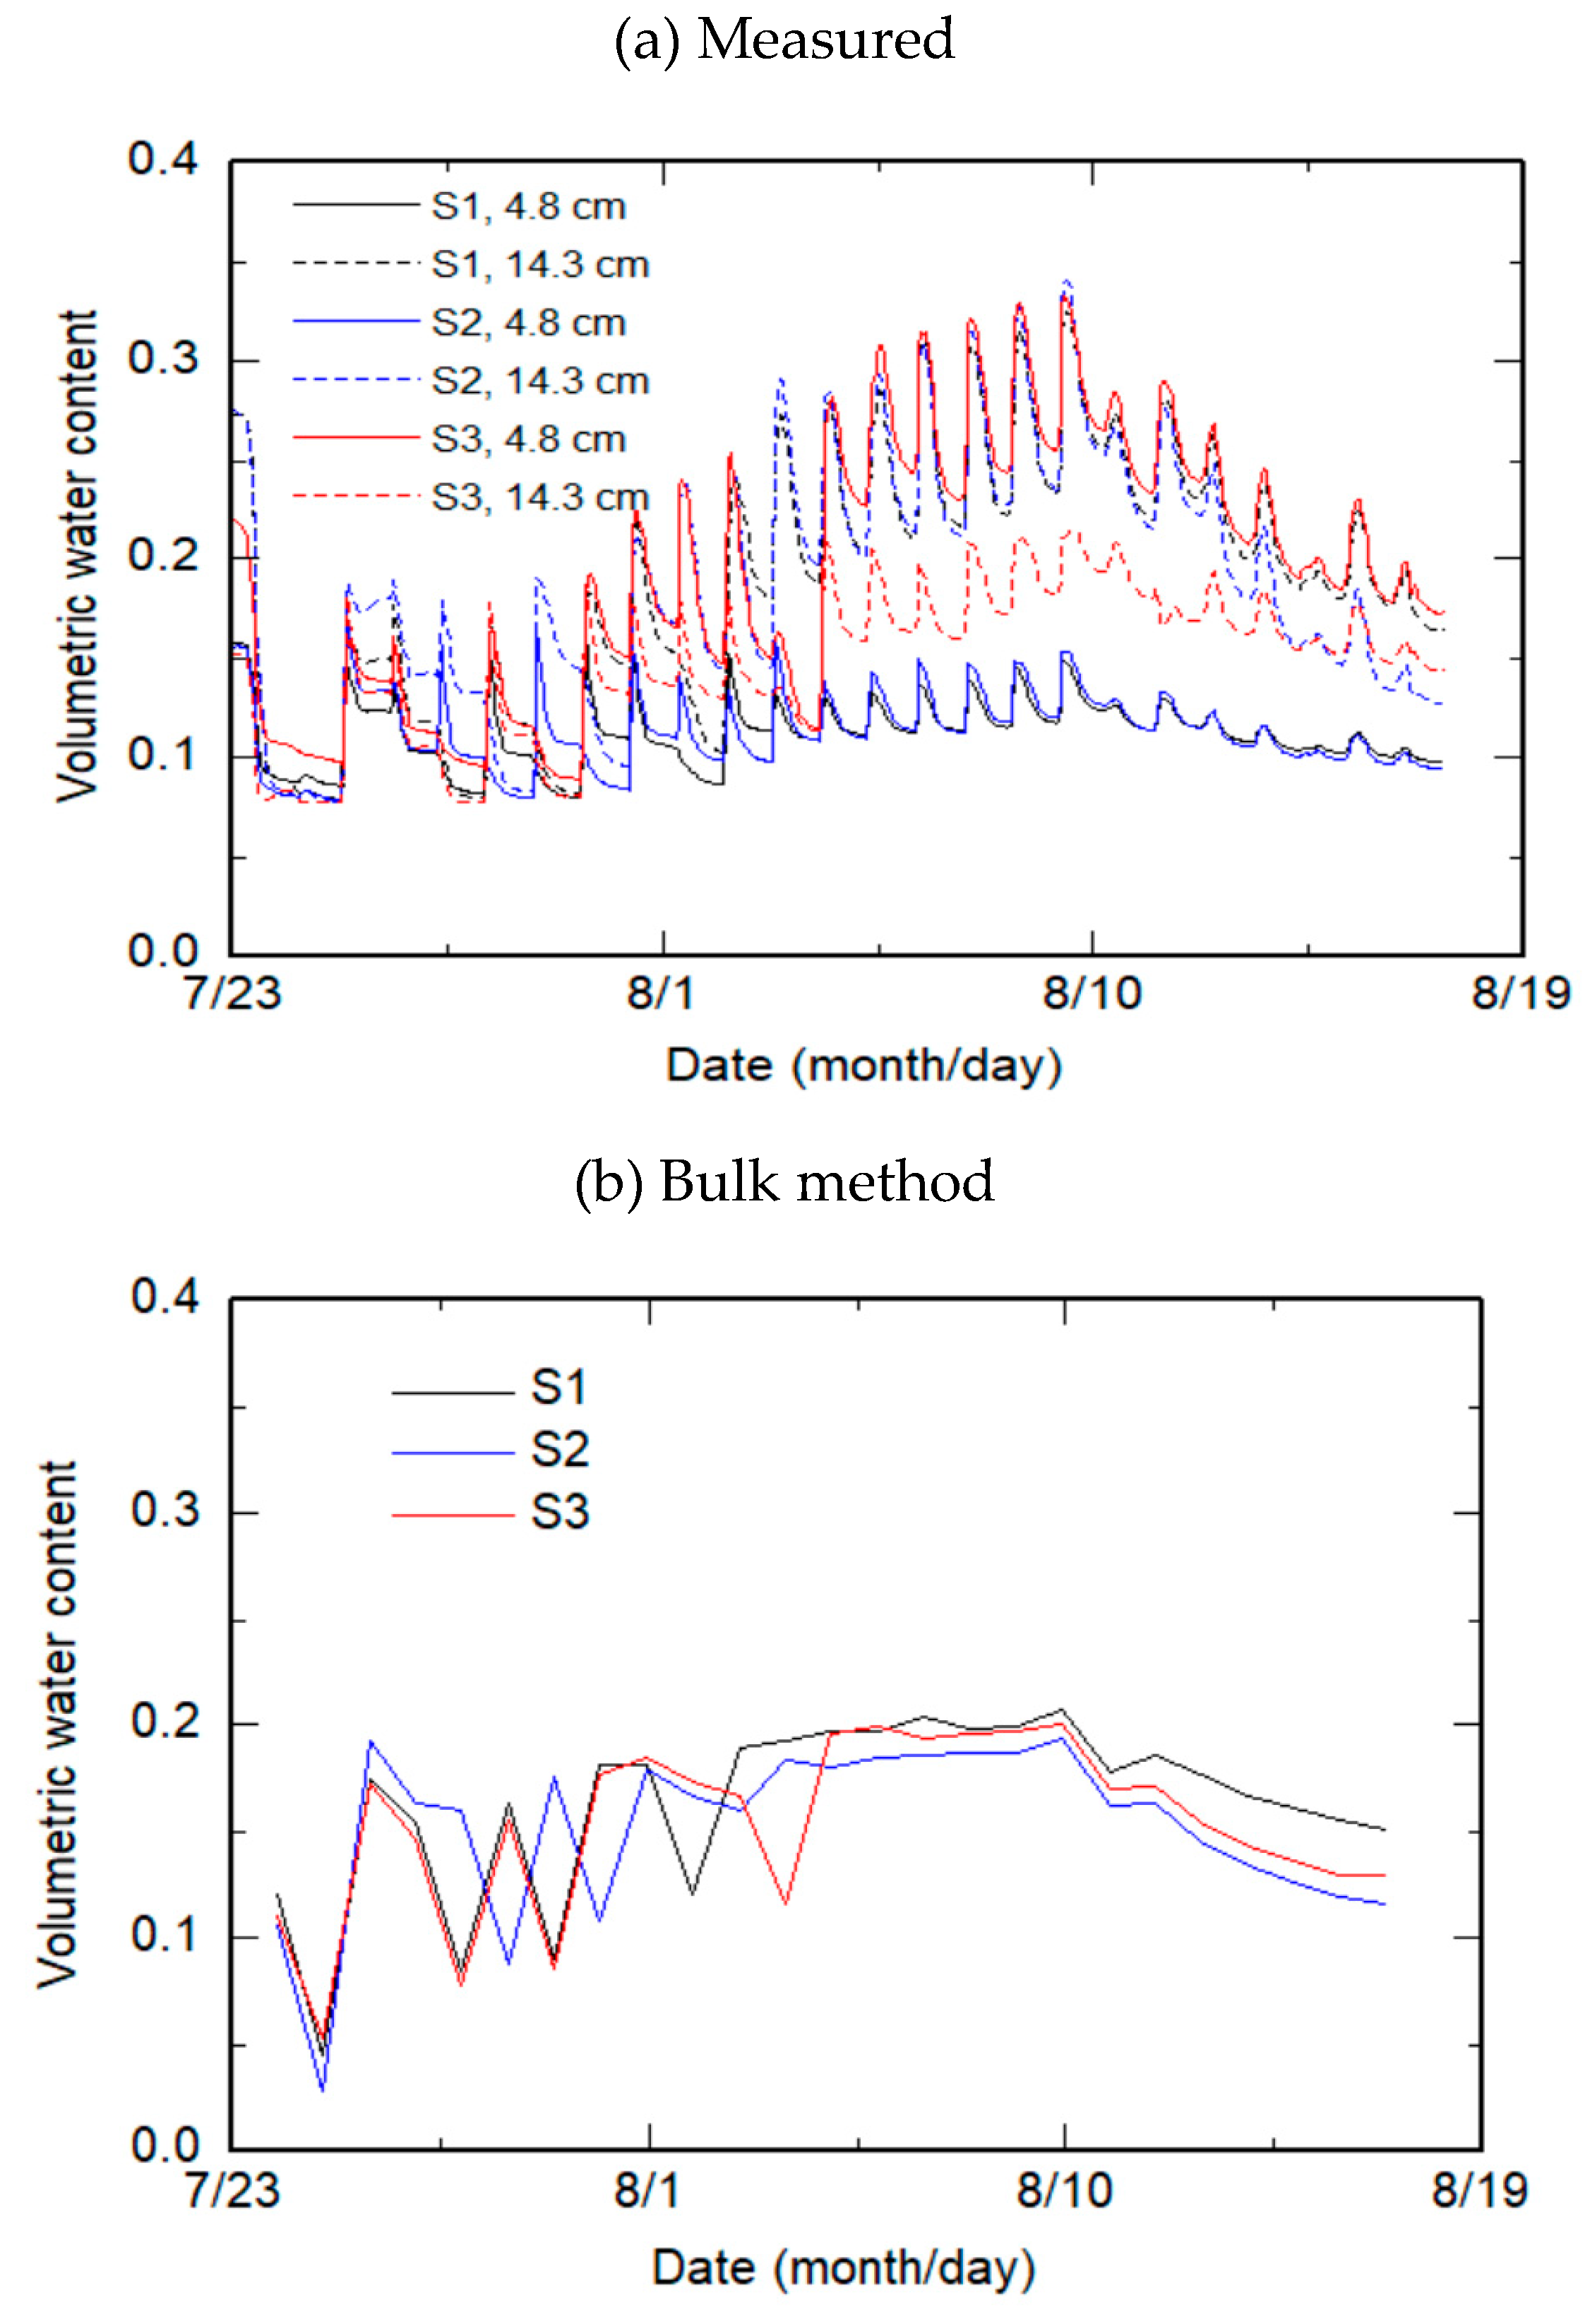
During the experiment, the mean daily values of the air temperature, relative humidity, and radiation ranged from 26 to 35 °C, 61% to 91%, and 0.11 to 0.63 MJ m−2 h−2, indicating hot and humid conditions. The bulk method successfully estimated the decrease in the soil moisture under drought stress (Figure 2). The soil water content decreased quickly owing to the high crop transpiration and then gradually from 5 days to almost stable. The mean values of the VWC during the experiment estimated by the bulk method were 0.072 cm3 cm−3 in W1, 0.068 cm3 cm−3 in W2, and 0.093 cm3 cm−3 in W3, and 0.163, 0.152 and 0.153 cm3 cm−3, respectively, in S1, S2, and S3. The mean values of the VWC measured by the sensors during the experiment were 0.077 cm3 cm−3 in W1 and 0.080 cm3 cm−3 in W3 in the top layer and 0.077 and 0.088 cm3 cm−3, respectively, in the bottom layer; and 0.112 cm3 cm−3 in S1, 0.113 cm3 cm−3 in S2, and 0.193 cm3 cm−3 in S3 in the top layer, and 0.189, 0.188, and 0.147 cm3 cm−3, respectively, in the bottom layer. In general, the bottom layer had greater soil moisture than the top layer, but the values were close enough to neglect the difference or assume that the water capacity was constant within each profile. The average values of the VWC at the top and bottom layers in each pot were close to the values estimated by the bulk method, indicating the reliability of the equation for the calibration of the soil sensor. The VWC fluctuations in the salinity pots during the experiment were due to transpiration and irrigation (Figure 3). The values of the VWC ranged from 0.077 to 0.341 by the sensor measurements and from 0.027 to 0.207 by the bulk method under salinity stress. It is worth noting that the wide range of the VWC measured by the sensors is related to the hourly measurements in the two soil layers, while the values calculated by the bulk method are the mean daily values for the whole soil profile. To simulate the root water uptake by oil crops on the semiarid Loess Plateau of China, He et al. [35] evaluated a model based on the inverse modeling of the Richards equation and parameter optimization algorithms, and the Feddes function implemented in HYDRUS 1-D. Both models reliably simulated the soil water content, although the first model had better accuracy.
Time variation of the soil salt concentration under salinity stress is illustrated in Figure 4. The soil salinity in all pots increased substantially owing to the addition of saline water during the experiment. Salt concentrations decreased after each the irrigation event and then increased with the transpiration. There was fair agreement between the concentrations by the bulk method and the sensor values of the S3 pot. The mean values of ECsw estimated by the bulk method were 11.8 dS m−1 in S1, 13.5 dS m−1 in S2, and 12.6 dS m−1 in S3. The mean value measured by the sensors in S3 during the experiment was 12.5 dS m−1.
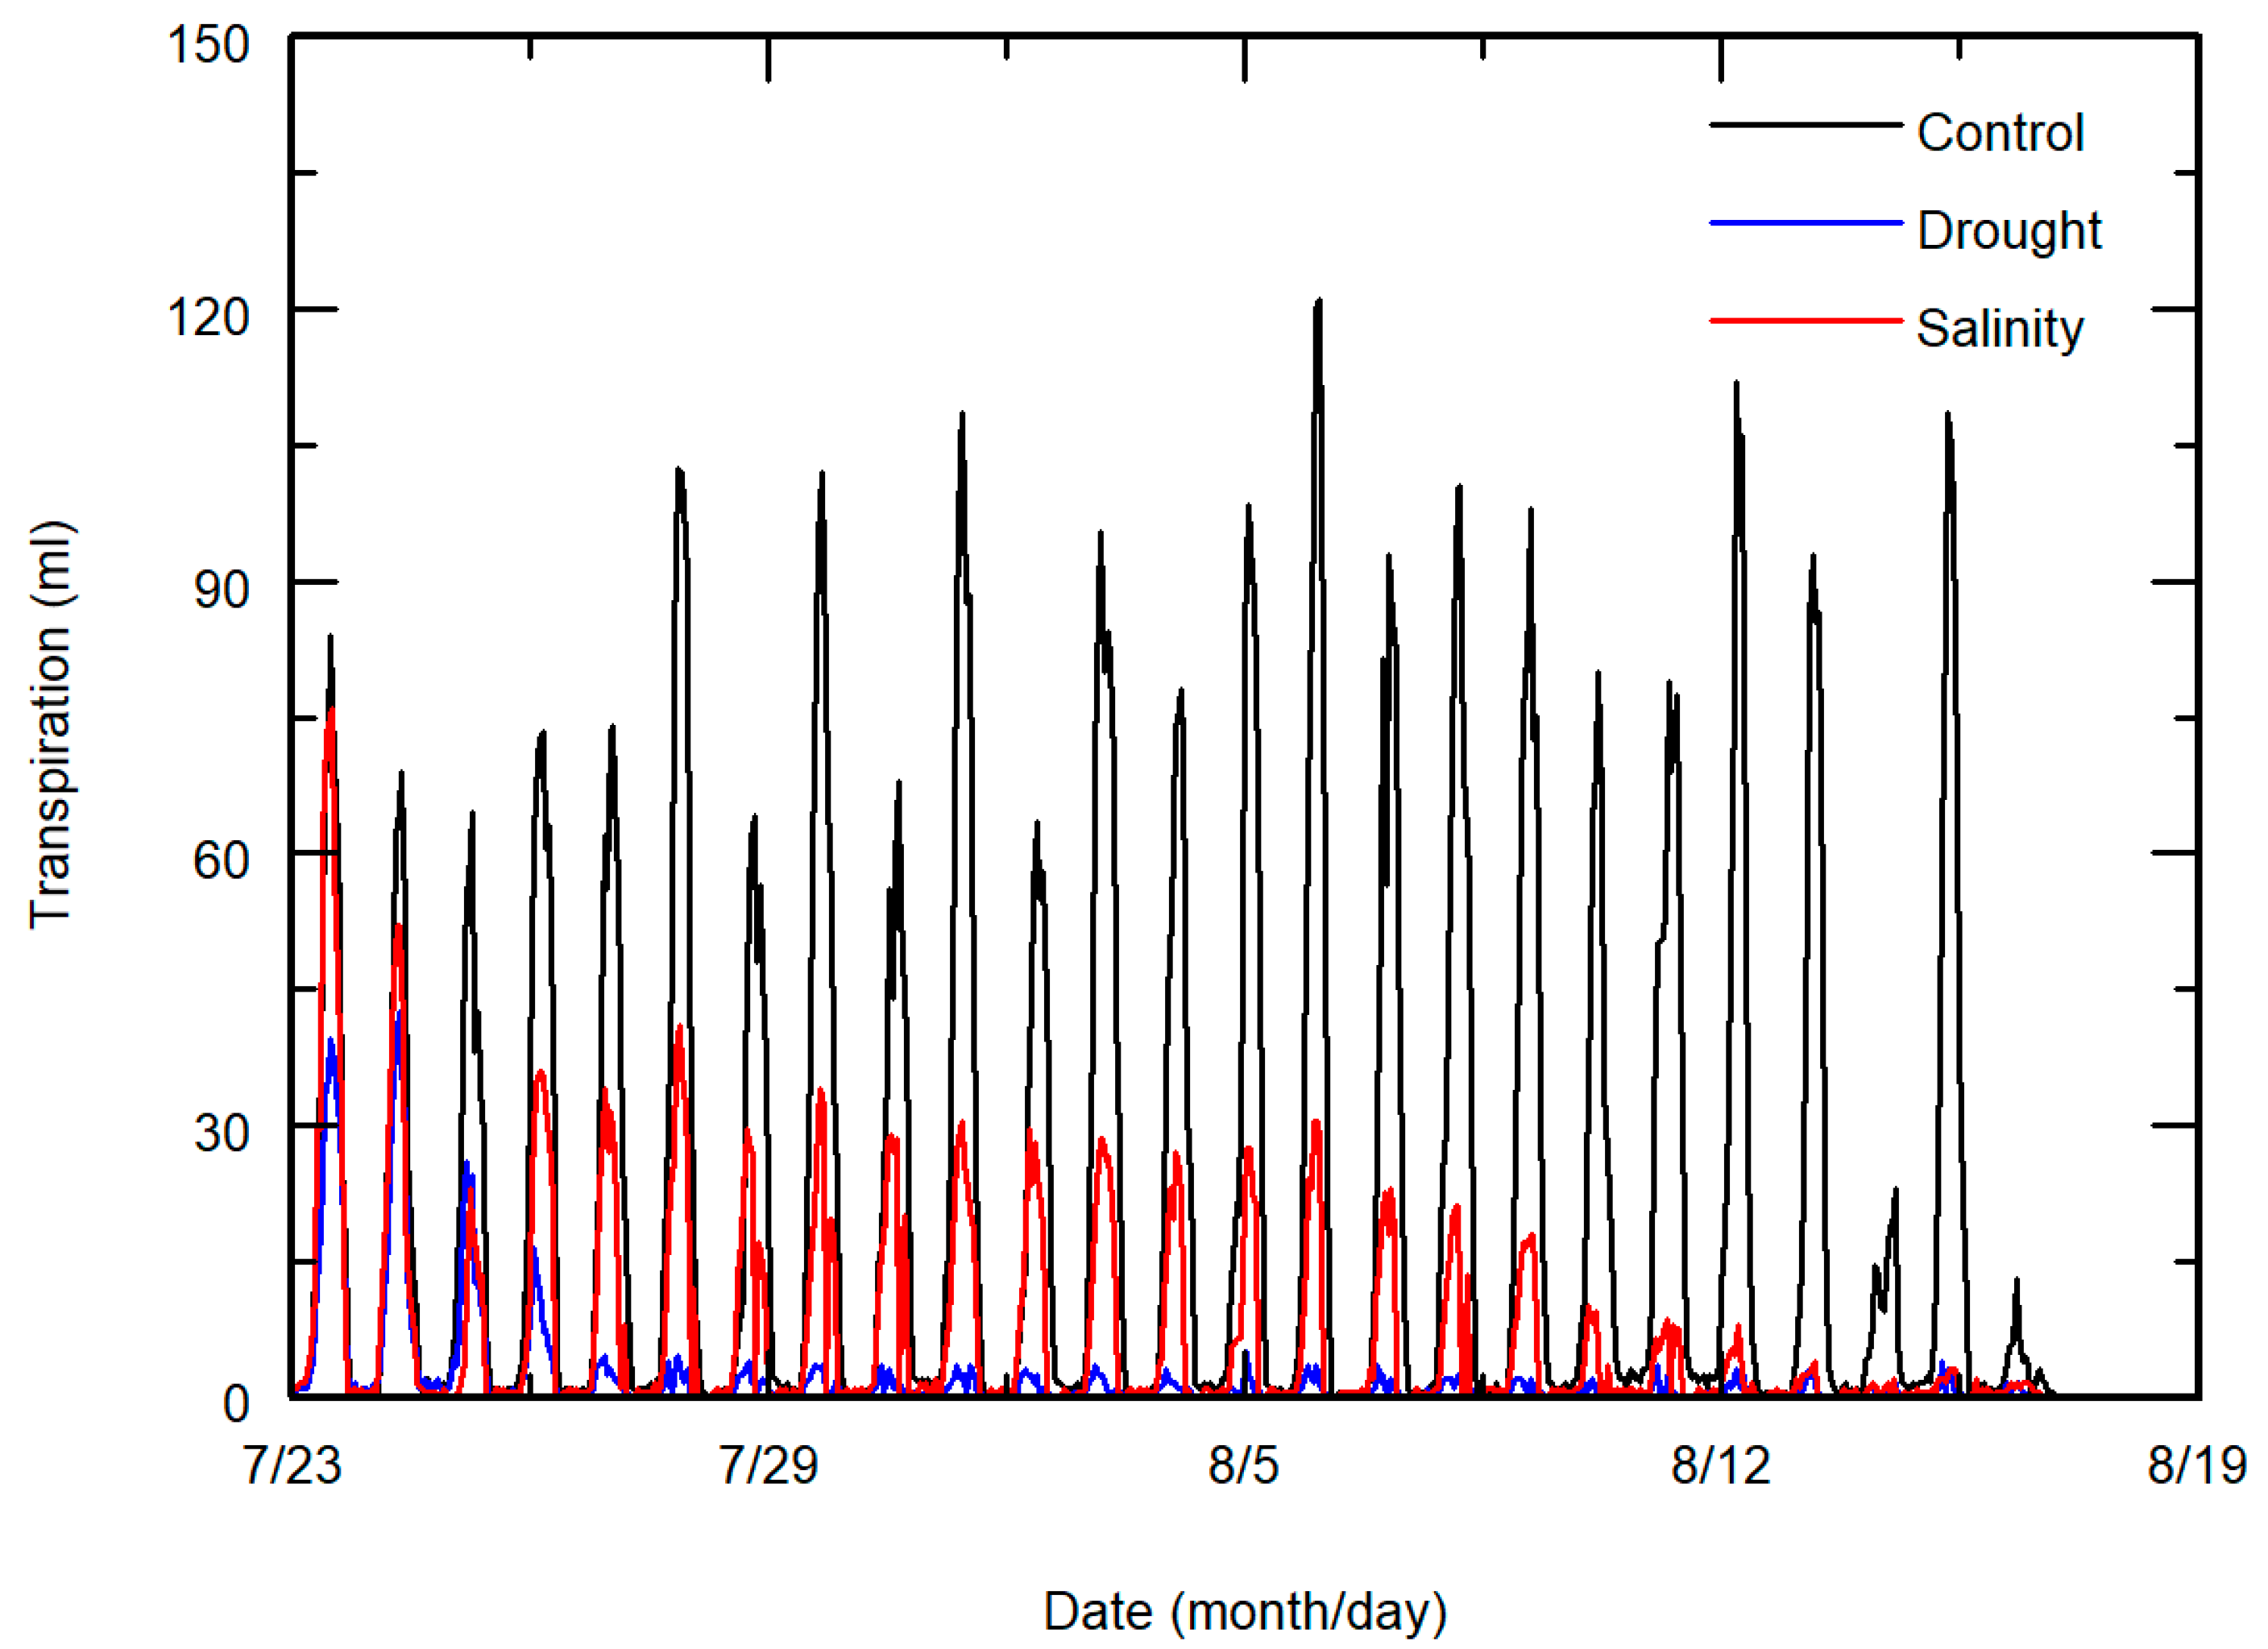
The transpiration in the drought treatment started decreasing after only 1 day because of the reduced soil water content resulting from the high temperature (Figure 5). The hourly transpiration may be approximated as a function of solar radiation (Figure 5) [12].
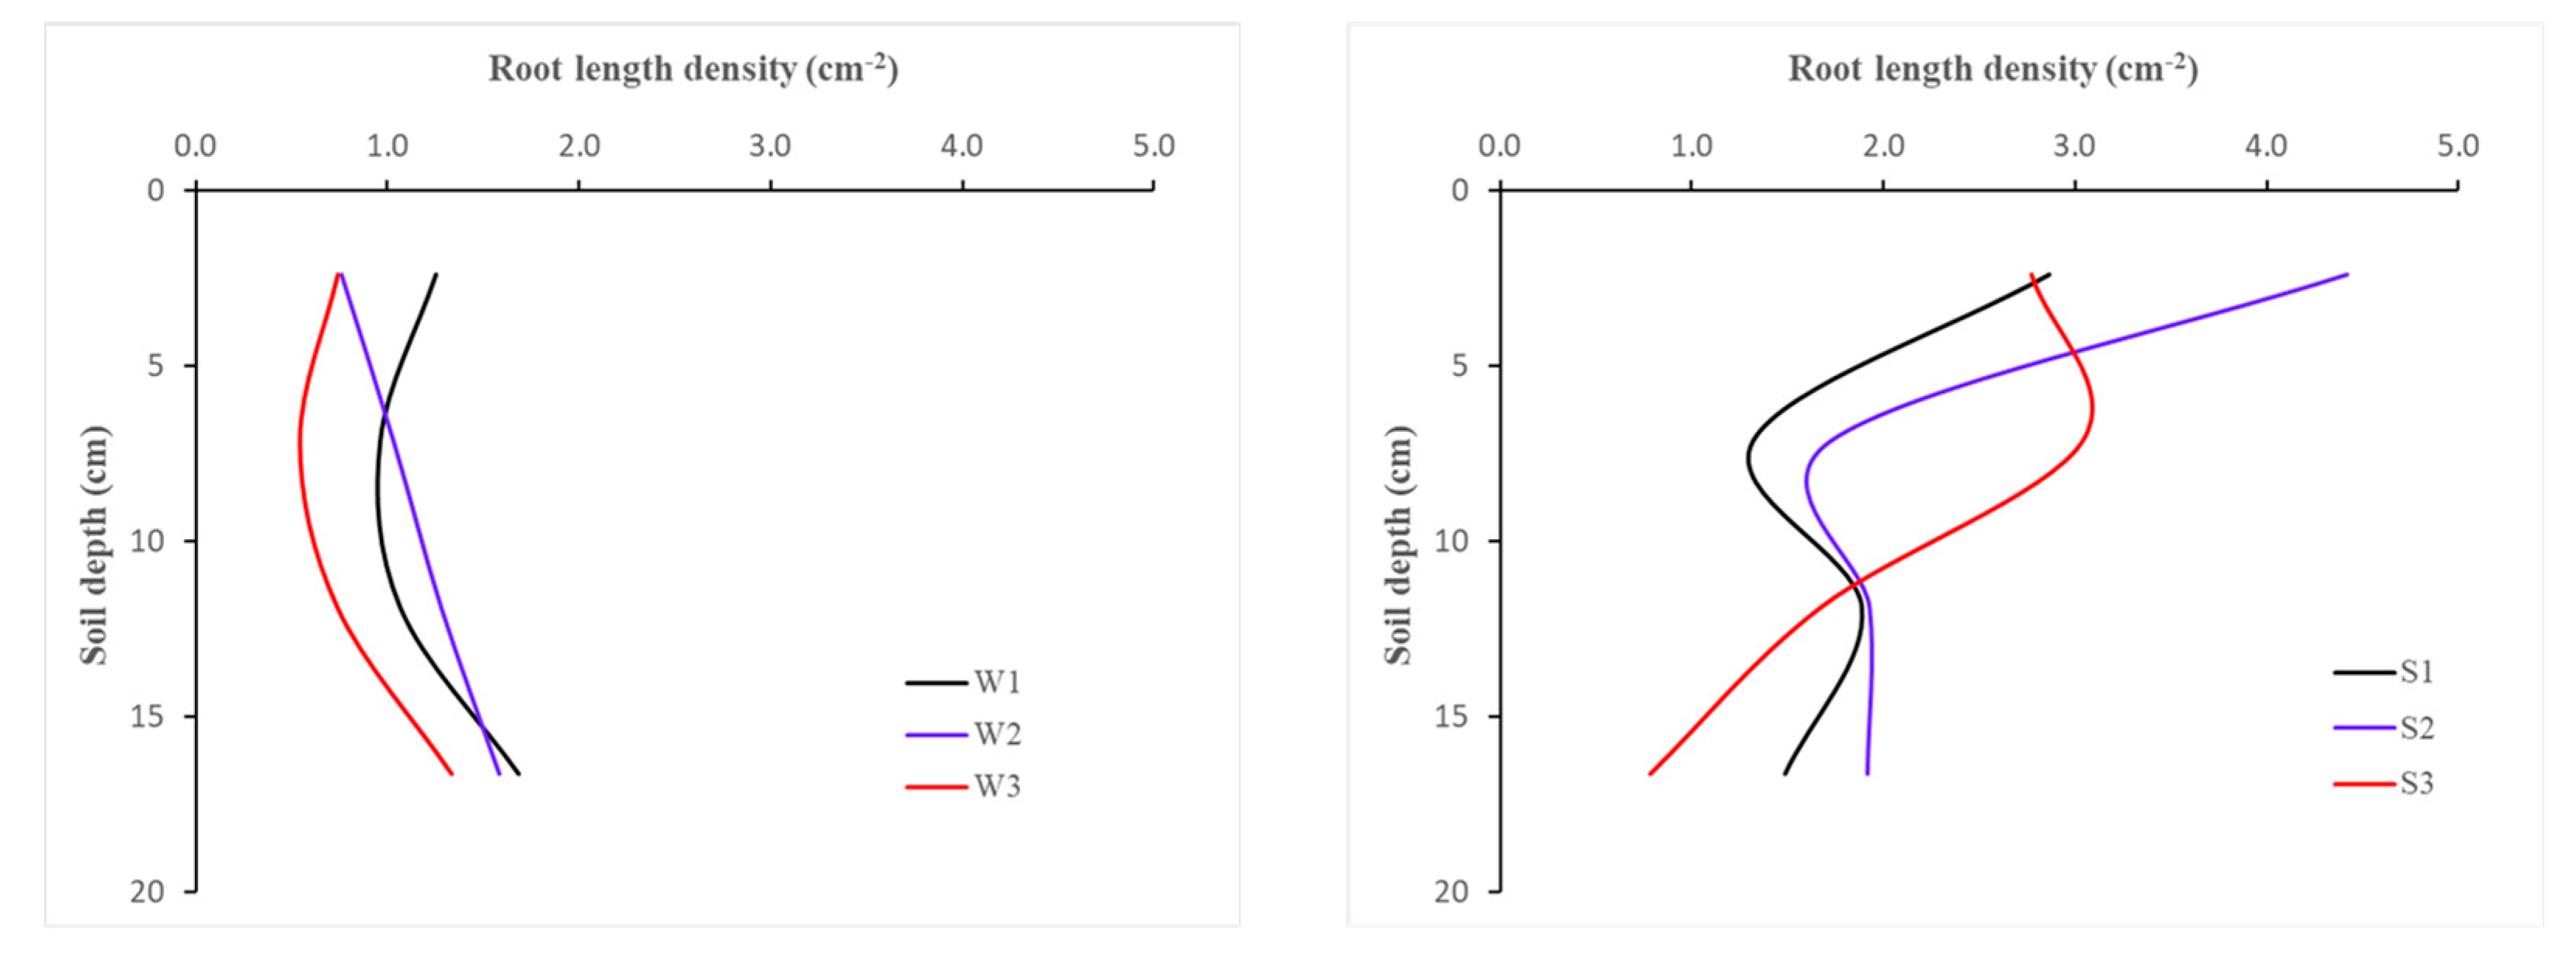
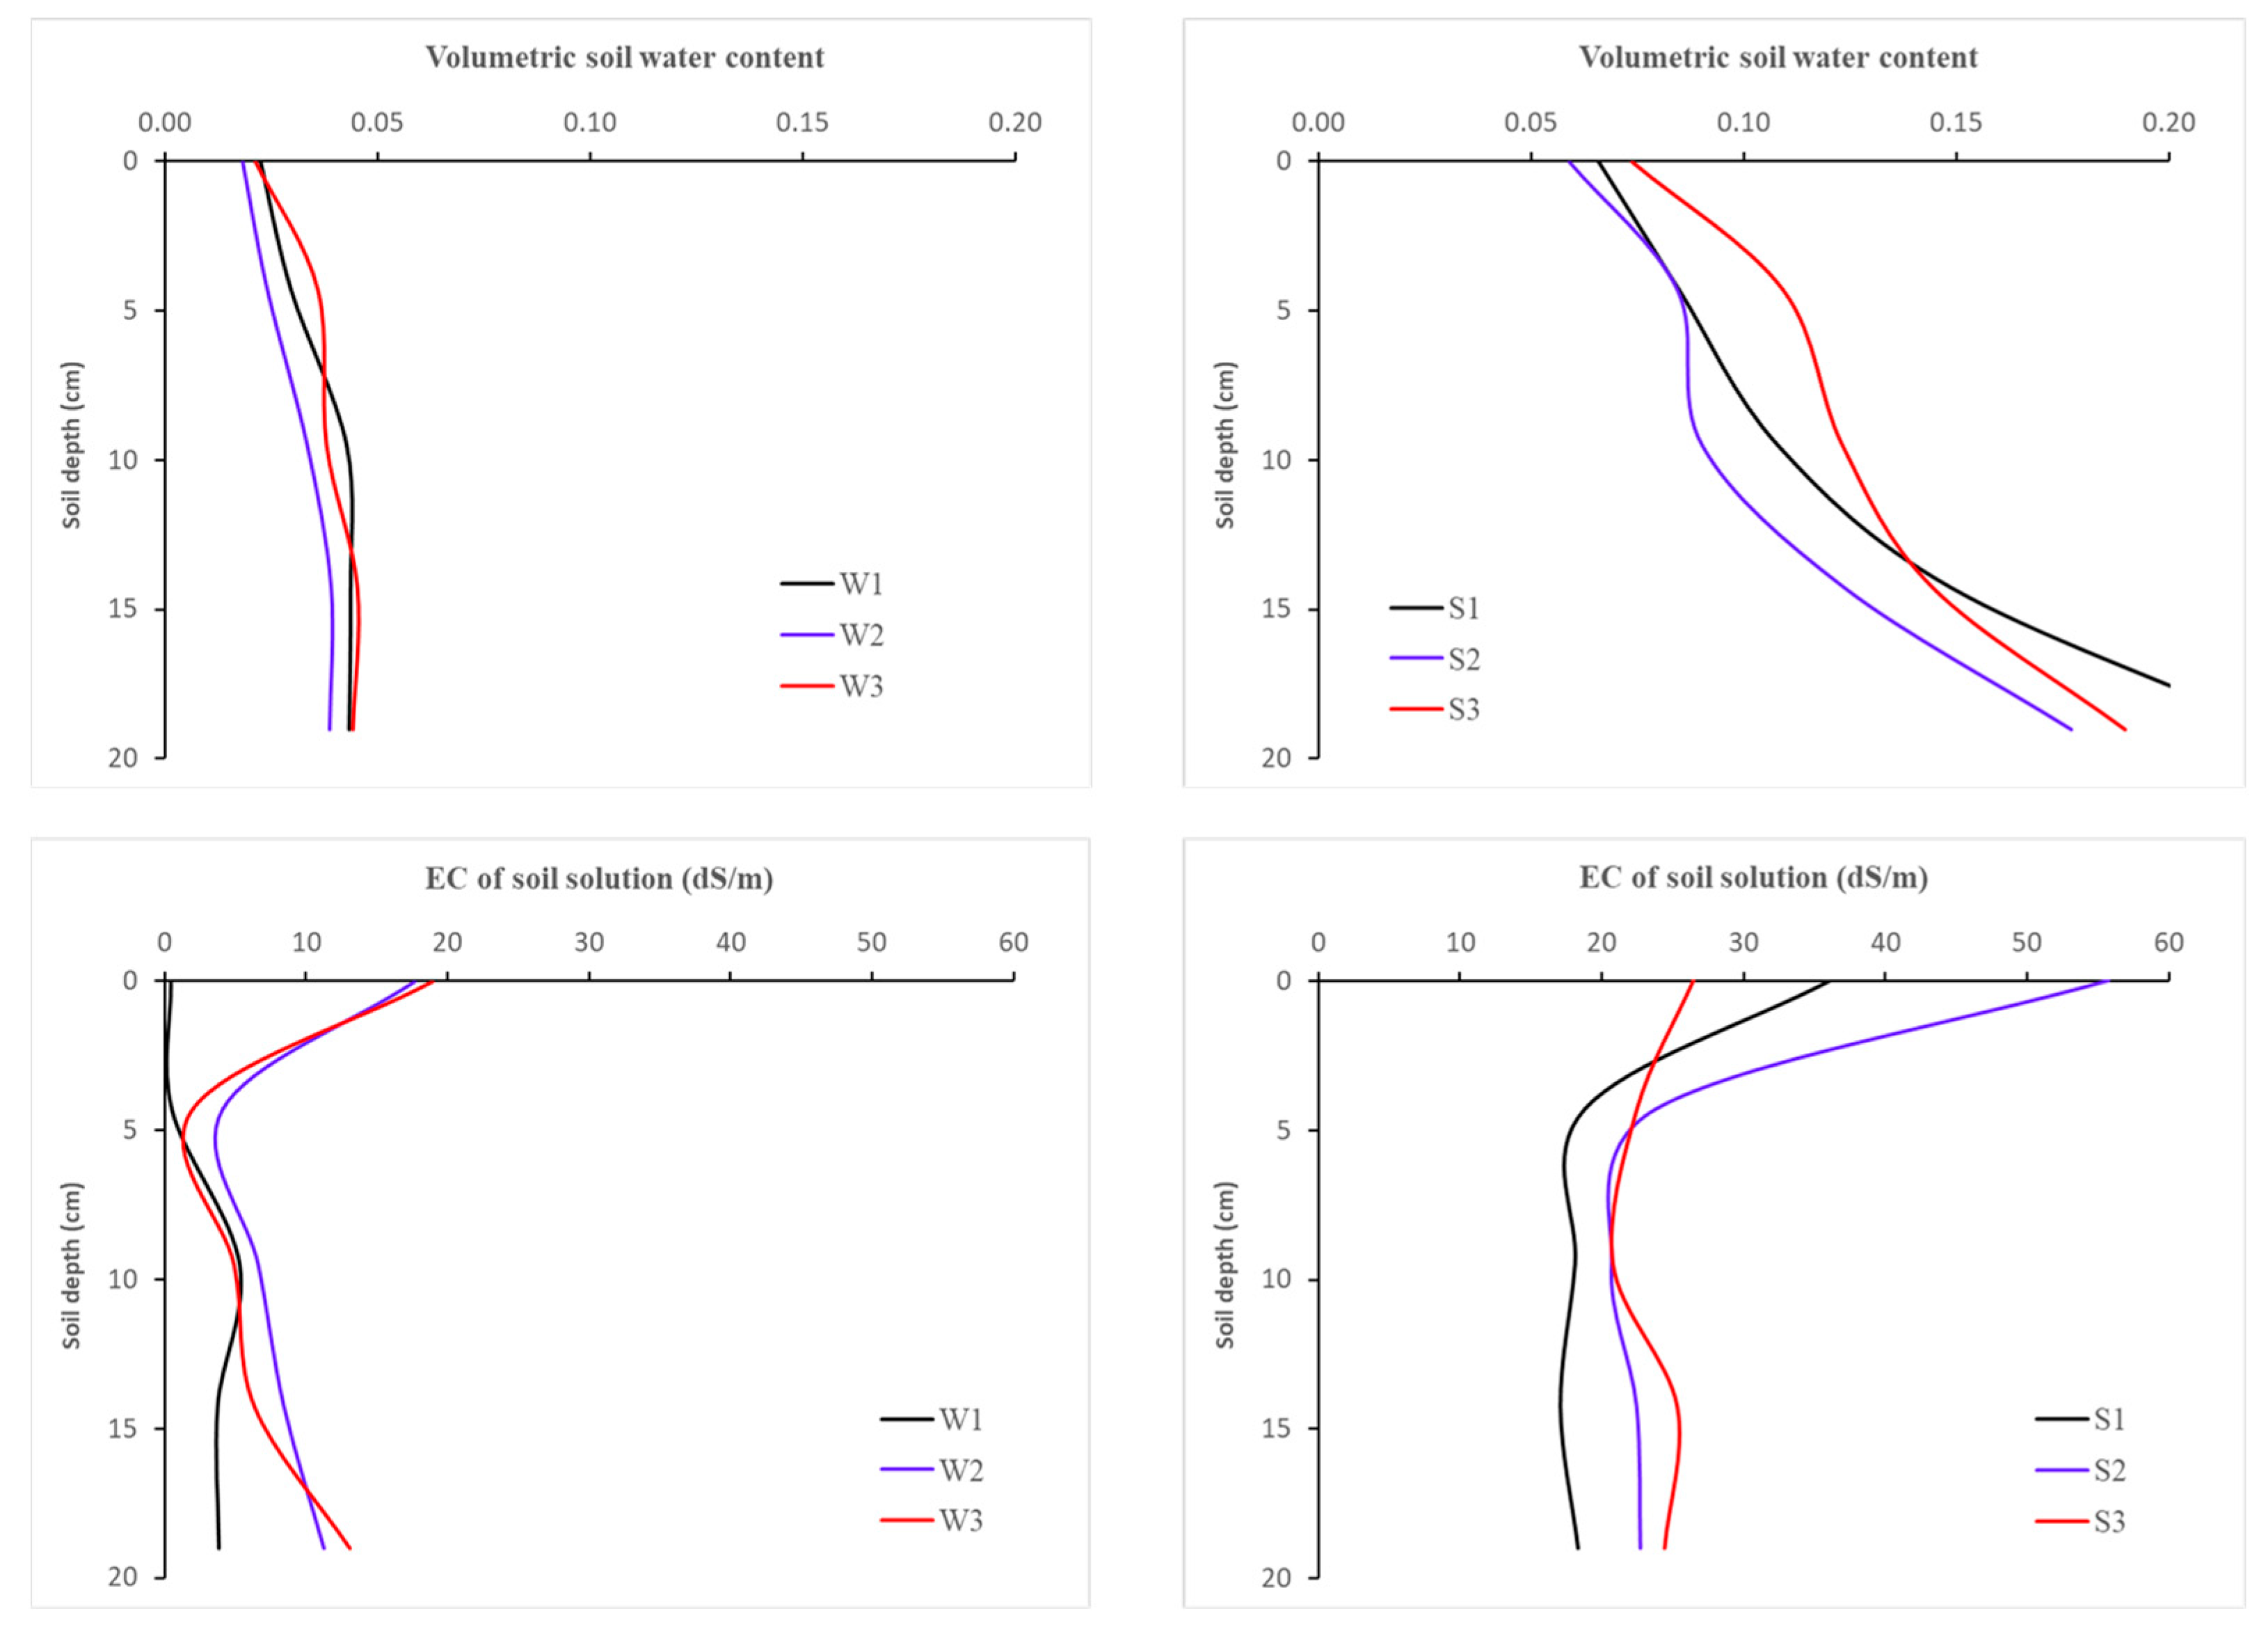
The root length density was significantly greater (p < 0.05) in the salinity treatment (Figure 6). Because of the presence of water in the soil under salinity stress, those plants had better growing conditions than those under drought stress. The root length density was greater in the top layer than in the bottom layer under salinity stress. The root length density usually decreases with depth [36,37,38]. But more roots accumulated in the bottom layer under drought stress, probably owing to its greater soil water content. Sainju and Good [39] also found higher root density in the soil layer above the water table than in higher layers. The soil water content was greater in the bottom layer of all pots in both treatments (Figure 7). The soil salinity decreased with increasing the soil depth in all salinity pots (Figure 7).
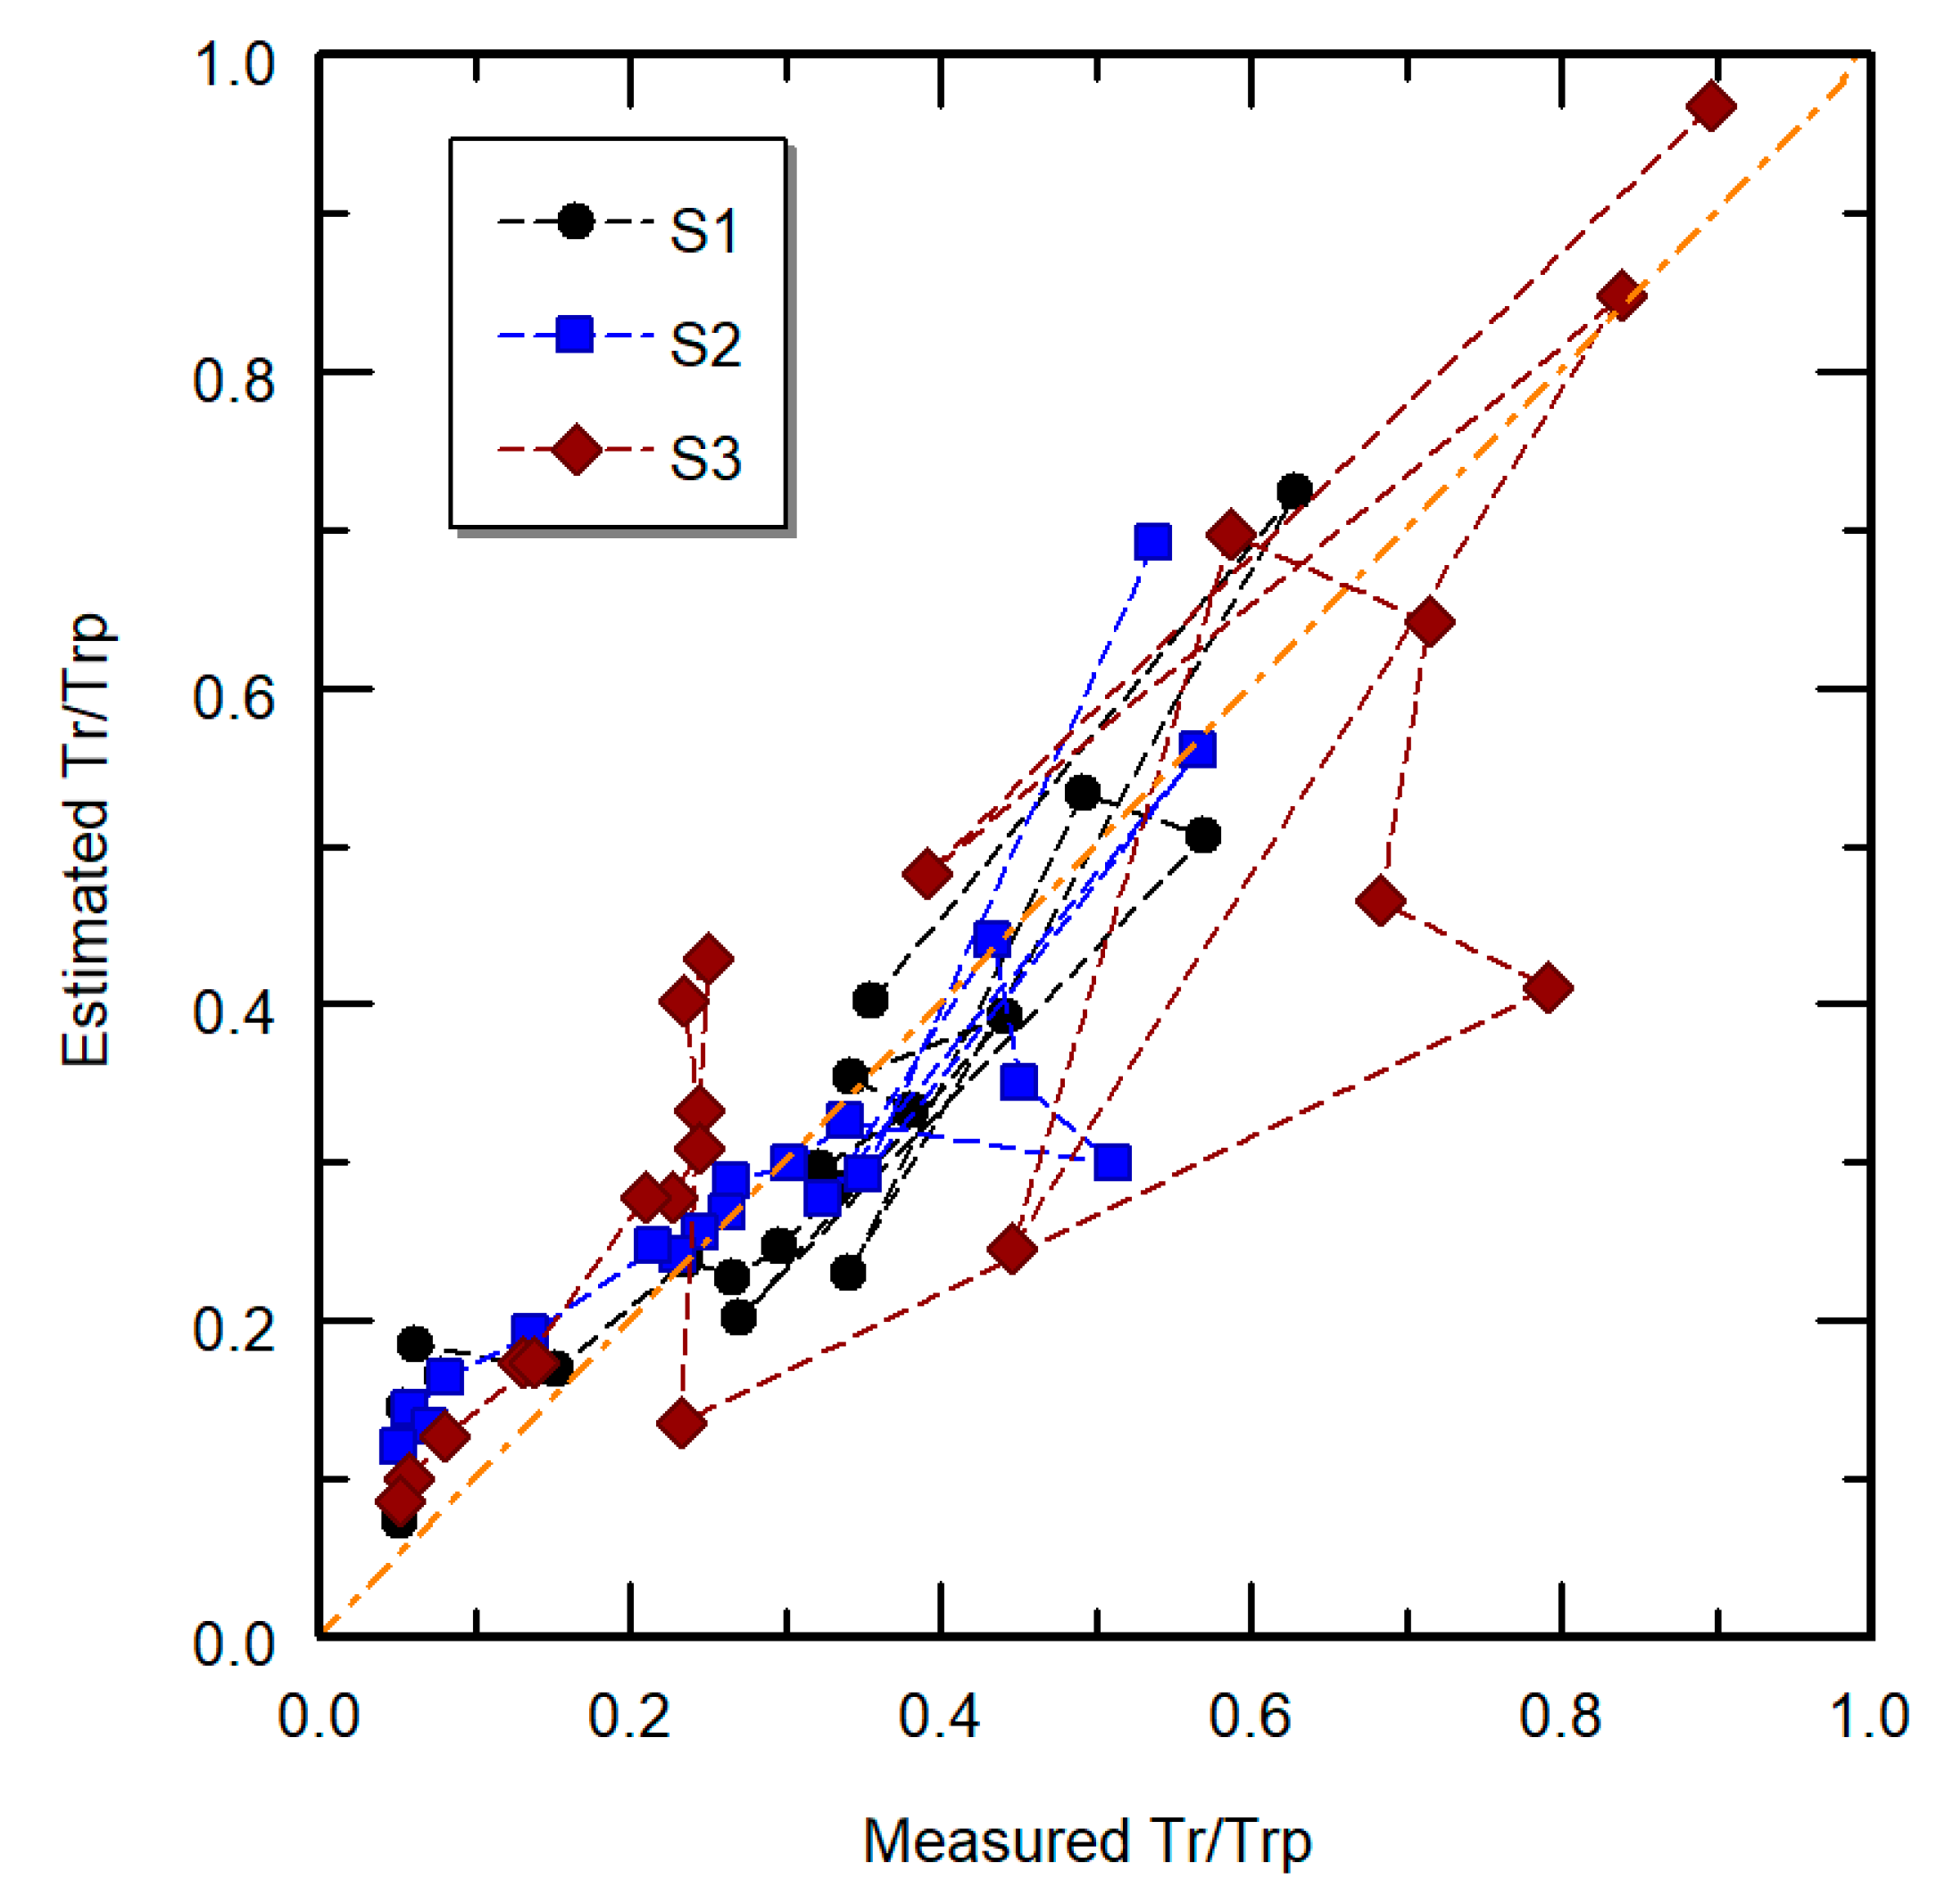
Both methods successfully estimated the relative transpiration under drought stress (Figure 8). However, the inverse method was not as good as the bulk method in estimating it under salinity stress (Figure 9).
The bulk method was as accurate as the inverse method under drought stress. The mean values of the RMSE in estimating the relative transpiration were 0.067 by the bulk method and 0.047 by the inverse method. The bulk method had satisfactory performance in estimating the relative daily transpiration under salinity stress (RMSE = 0.096), but the inverse method had poor performance (RMSE = 0.182; S3 pot only).
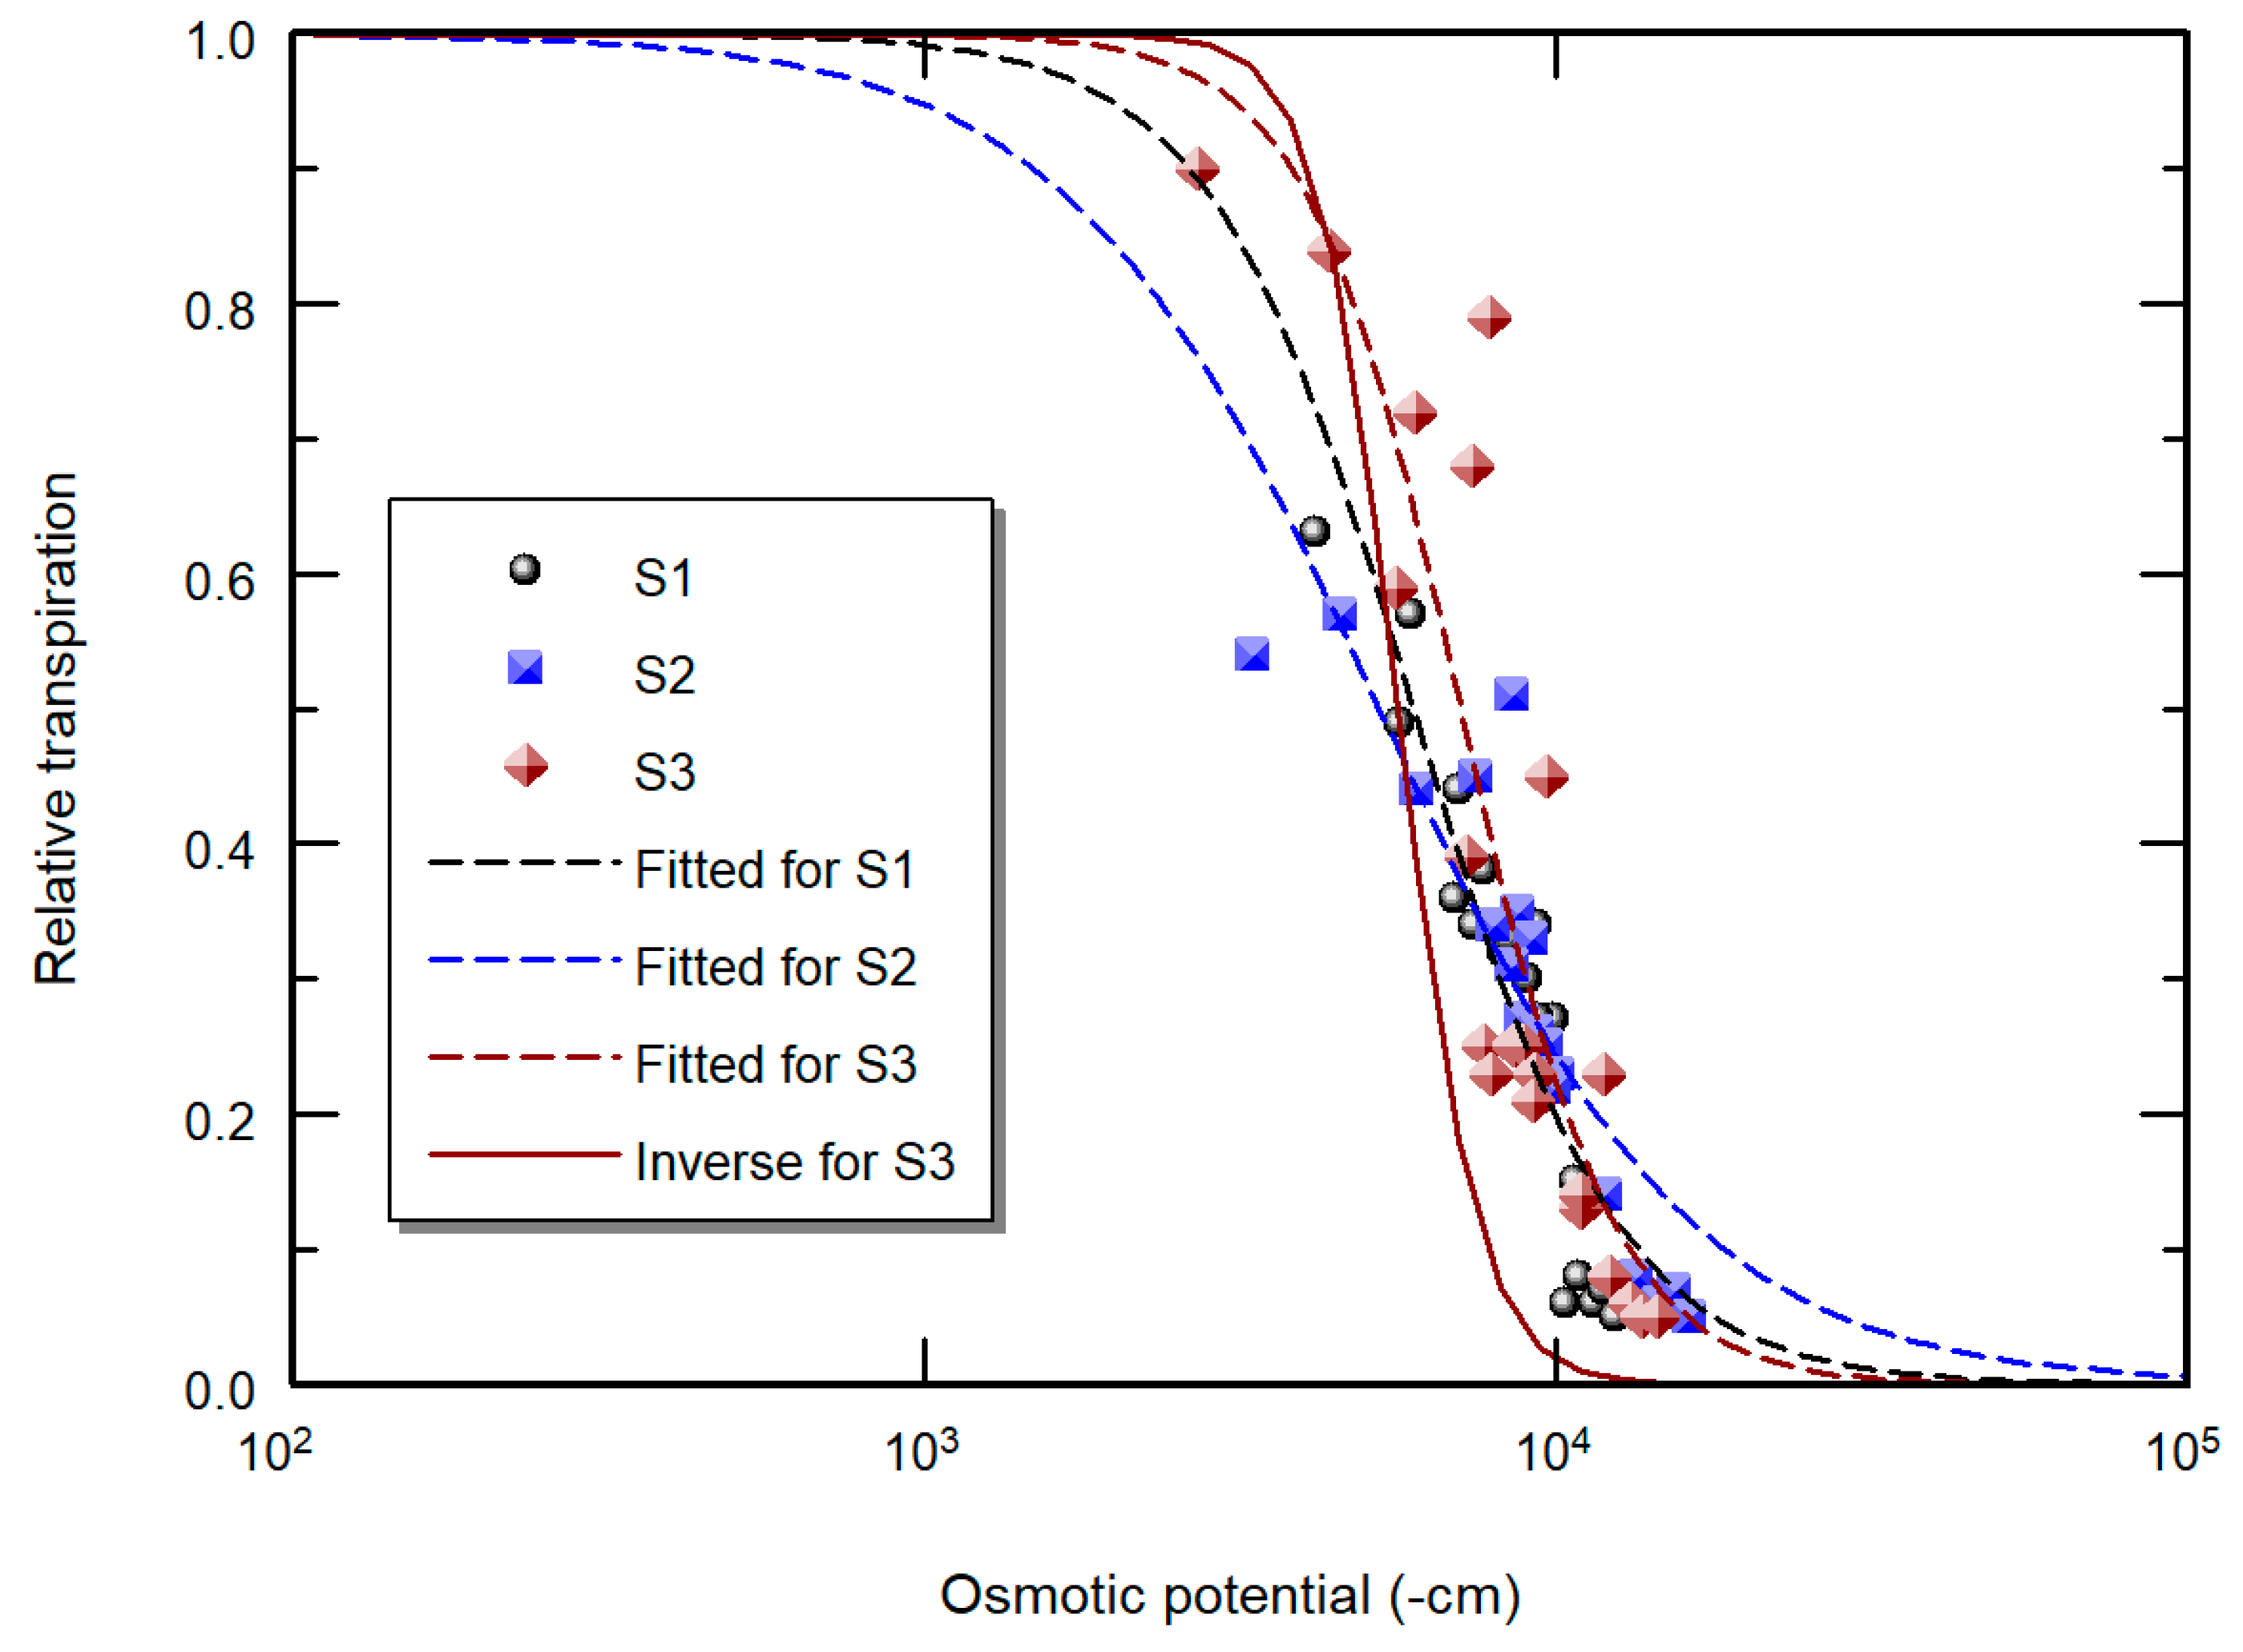
Figure 10 and Figure 11 illustrate the stress response functions fitted by the bulk method and optimized by the inverse method for each treatment. The salinity stress data are more scattered around the curve fitted by the bulk method than the drought stress data, implying that the assumption of a uniform or fairly linear distribution was incorrect.
The absolute value of h50 was estimated as 1558 cm by the bulk method and as 1642 cm by the inverse method (Table 1). The mean absolute value of ho50 was estimated as 6128 cm by the bulk method and as 5659 cm by the inverse method in the S3 pot. Both methods gave similar results. The inverse method estimated a larger value of p for both stresses than the bulk method, maybe owing to the lower slope of the more scattered data in the curve fitting. The absolute value of ho50 was twice that of h50 by both methods, meaning that sesame is more tolerant to salinity stress than to drought stress. The values of the soil water content equivalent to h50 are 0.104 cm3 cm−3 by the bulk method and 0.102 cm3 cm−3 by the inverse method. The mean values of ECsw equivalent to ho50 are 15.0 dS m−1 by the bulk method and 13.9 dS m−1 by the inverse method (ho [MPa] ≈ 0.04 ECsw [dS m−1] [40]). ECsw ≈ 3.2 × the EC of irrigation water (ECw) [41]. Therefore, the mean value of ECsw by both methods (14.5 dS m−1) is equivalent to ECw = 4.5 dS m−1, by which the relative crop yield would be 0.5 owing to salinity stress. Lebap-55 is moderately sensitive to salinity stress [41]. The biomass was greatest in the control treatment and was significantly reduced by both stresses (Table 2). There were significant differences between all treatments in the fresh and dry biomass (p < 0.05). The mean value of the WUE was 2.2 kg/m3 in the control, 4.0 kg/m3 in the salinity treatment, and 3.1 kg/m3 in the drought treatment. There was a significant difference between the salinity and control treatments in the WUE, but not between the drought treatment and the other treatments.

4. Conclusions

We determined the values of the parameters (h50, ho50, and p) of the stress response function of sesame under salinity and drought stresses by the bulk and inverse estimation methods. Both methods successfully estimated the parameter values under both stresses. The bulk method had acceptable performance under drought stress, despite not using the measured soil water content or root distribution. It also had satisfactory accuracy in estimating the values under salinity stress. Both methods performed better under drought stress than under salinity stress. Lebap-55 is moderately sensitive to salinity stress but is more tolerant to salinity stress than to drought stress. The root length density was greater in the salinity treatment than in the drought treatment. These findings could be used for optimizing the irrigation and salinity management of sesame in arid and semi-arid regions. The values of h50, ho50, and p can also be used for the crop growth simulation models to improve the sesame yield and the WUE under drought and salinity conditions. Further studies are recommended to determine the response parameters of various sesame cultivars under abiotic stresses. It is also recommended to evaluate the bulk method, proposed here, under different conditions (e.g., soil and crop) to complement the findings of this study.

Author Contributions

Conceptualization, H.E., H.F. and K.T.; methodology, H.E., H.F. and K.T.; pot experiments, H.E.; data analysis, H.E., H.F. and K.T.; writing—original draft preparation, H.E.; writing—review and editing, H.E., H.F. and K.T. All authors have read and agreed to the published version of the manuscript.

Funding

This research was funded by the Arid Land Research Center, Tottori University, Japan.

Institutional Review Board Statement

Not applicable.

Informed Consent Statement

Not applicable.

Data Availability Statement

Not applicable.

Acknowledgments

K. Toderich acknowledges the Science and Technology Research Partnership for Sustainable Development (SATREPS), in collaboration with the Japan Science and Technology Agency (JST, JPMJSA2001) project.

Conflicts of Interest

The authors declare no conflict of interest.

References

  1. Fujimaki, H.; Abd El Baki, H.M.; Mohamad Mahdavi, S.; Ebrahimian, H. Optimization of Irrigation and Leaching Depths Considering the Cost of Water Using WASH_1D/2D Models. Water 2020, 12, 2549. [Google Scholar] [CrossRef]
  2. Hassanli, M.; Ebrahimian, H. Cyclic use of saline and non-saline water to increase water use efficiency and soil sustainability on drip irrigated maize in a semi-arid region. Span. J. Agric. Res. 2016, 14, e1204. [Google Scholar] [CrossRef]
  3. Teklu, D.H.; Shimelis, H.; Abady, S. Genetic improvement in sesame (Sesamum indicum L.): Progress and outlook: A review. Agronomy 2022, 12, 2144. [Google Scholar] [CrossRef]
  4. Raes, D.; Steduto, P.; Hsiao, T.C.; Fereres, E. AquaCrop—The FAO crop model to simulate yield response to water: II. Main algorithms and software description. Agron. J. 2009, 101, 438–447. [Google Scholar] [CrossRef] [Green Version]
  5. Fujimaki, H.; Tokumoto, I.; Saito, T.; Inoue, M.; Shibata, M.; Okazaki, M.; Nagaz, K.; El-Mokh, F. Determination of irrigation depths using a numerical model and quantitative weather forecasts and comparison with an experiment. In Practical Applications of Agricultural System Models to Optimize the Use of Limited Water; Ahuja, L.R., Ma, L., Lascano, R.J., Eds.; ACSESS: Madison, WI, USA, 2014; Volume 5, pp. 209–235. [Google Scholar]
  6. Šimůnek, J.; van Genuchten, M.T.; Šejna, M. The HYDRUS Software Package for Simulating the Two- and Three Dimensional Movement of Water, Heat, and Multiple Solutes in Variably-Saturated Media; PC Progress: Prague, Czech Republic, 2006. [Google Scholar]
  7. van Dam, J.C.; Huygen, J.; Wesseling, J.G.; Feddes, R.A.; Kabat, P.; van Walsum, P.E.V.; Groenendijk, P.; van Diepen, C.A. Theory of SWAP, Version 2.0: Simulation of Water Flow, Solute Transport and Plant Growth in the Soil-Water-Atmosphere-Plant Environment; Rep. No. 71; Department of Water Resources, Wageningen Agricultural University: Wageningen, The Netherlands, 1997. [Google Scholar]
  8. Holzworth, D.P.; Huth, N.I.; deVoil, P.G.; Zurcher, E.J.; Herrmann, N.I.; McLean, G.; Chenu, K.; van Oosterom, E.J.; Snow, V.; Murphy, C.; et al. APSIM–evolution towards a new generation of agricultural systems simulation. Environ. Model. Softw. 2014, 62, 327–350. [Google Scholar] [CrossRef]
  9. Feddes, R.A.; Kowalic, P.J.; Zaradny, H. Simulation of Field Water Use and Crop Yield; John Wiley & Sons: New York, NY, USA, 1978. [Google Scholar]
  10. Homaee, M.; Feddes, R.A.; Dirksen, C. A macroscopic water extraction model for nonuniform transient salinity and water stress. Soil Sci. Soc. Am. J. 2002, 66, 1764–1772. [Google Scholar] [CrossRef]
  11. Fujimaki, H.; Ando, Y.; Cui, Y.; Inoue, M. Parameter estimation of a root water uptake model under salinity stress. Vadose Zone J. 2008, 7, 31–38. [Google Scholar] [CrossRef]
  12. Fujimaki, H.; Kikuchi, N. Drought and salinity tolerances of young Jatropha. Int. Agrophys. 2010, 24, 121–127. [Google Scholar]
  13. Yanagawa, A.; Fujimaki, H. Tolerance of canola to drought and salinity stresses in terms of root water uptake model parameters. J. Hydrol. Hydromech. 2013, 61, 73–80. [Google Scholar] [CrossRef] [Green Version]
  14. Wang, Q.; Huo, Z.; Feng, S.; Yuan, C.; Wang, J. Comparison of spring maize root water uptake models under water and salinity stress validated with field experiment data. Irrig. Drain. 2015, 64, 669–682. [Google Scholar] [CrossRef]
  15. Cai, G.; Vanderborght, J.; Couvreur, V.; Mboh, C.M.; Vereecken, H. Parameterization of root water uptake models considering dynamic root distributions and water uptake compensation. Vadose Zone J. 2018, 17, 1–21. [Google Scholar] [CrossRef] [Green Version]
  16. Massoud, E.C.; Purdy, A.J.; Christoffersen, B.O.; Santiago, L.S.; Xu, C. Bayesian inference of hydraulic properties in and around a white fir using a process-based ecohydrologic model. Environ. Model. Softw. 2019, 115, 76–85. [Google Scholar] [CrossRef] [Green Version]
  17. Dainese, R.; Tarantino, A. Measurement of plant xylem water pressure using the high-capacity tensiometer and implications for the modelling of soil–atmosphere interaction. Géotechnique 2021, 71, 441–454. [Google Scholar] [CrossRef]
  18. Rabbel, I.; Bogena, H.; Neuwirth, B.; Diekkrüger, B. Using sap flow data to parameterize the Feddes water stress model for Norway spruce. Water 2018, 10, 279. [Google Scholar] [CrossRef] [Green Version]
  19. de Melo, M.L.A.; van Lier, Q.D.J. Revisiting the Feddes reduction function for modeling root water uptake and crop transpiration. J. Hydrol. 2021, 603, 126952. [Google Scholar] [CrossRef]
  20. Zech-Matterne, V.; Tengberg, M.; Van Andringa, W. Sesamum indicum L. (sesame) in 2nd century BC Pompeii, southwest Italy, and a review of early sesame finds in Asia and Europe. Veg. Hist. Archaeobotany 2015, 24, 673–681. [Google Scholar] [CrossRef]
  21. De Lima, G.S.; De Lacerda, C.N.; Dos Anjos Soares, L.A.; Gheyi, H.R.; Araújo, R.H.C.R. Production characteristics of sesame genotypes under different strategies of saline water application. Rev. Caatinga 2020, 33, 490–499. [Google Scholar] [CrossRef]
  22. Hamedani, N.G.; Gholamhoseini, M.; Bazrafshan, F.; Habibzadeh, F.; Amiri, B. Yield, irrigation water productivity and nutrient uptake of arbuscular mycorrhiza inoculated sesame under drought stress conditions. Agric. Water Manag. 2022, 266, 107569. [Google Scholar] [CrossRef]
  23. Sun, J.; Rao, Y.; Yan, T.; Yan, X.; Zhou, H. Effects of drought stress on sesame growth and yield characteristics and comprehensive evaluation of drought tolerance. Chin. J. Oil Crop Sci. 2010, 32, 525–533. [Google Scholar]
  24. Bahrami, H.; Razmjoo, J. Effect of salinity stress (NaCl) on germination and early seedling growth of ten sesame cultivars (Sesamum indicum L.). Int. J. AgriSci. 2012, 2, 529–537. [Google Scholar]
  25. El Harfi, M.; Hanine, H.; Rizki, H.; Latrache, H.; Nabloussi, A. Effect of drought and salt stresses on germination and early seedling growth of different color-seeds of sesame (Sesamum indicum). Int. J. Agric. Biol. 2016, 18, 1088–1094. [Google Scholar] [CrossRef]
  26. Suassuna, J.F.; Fernandes, P.D.; Brito, M.E.B.; Arriel, N.H.C.; de Melo, A.S.; Fernandes, J.D. Tolerance to Salinity of Sesame Genotypes in Different Phenological Stages. Am. J. Plant Sci. 2017, 8, 1904–1920. [Google Scholar] [CrossRef] [Green Version]
  27. Wei, P.; Zhao, F.; Wang, Z.; Wang, Q.; Chai, X.; Hou, G.; Meng, Q. Sesame (Sesamum indicum L.): A comprehensive review of nutritional value, phytochemical composition, health benefits, development of food, and industrial applications. Nutrients 2022, 14, 4079. [Google Scholar] [CrossRef] [PubMed]
  28. Rhoades, J.D.; Kandiah, A.; Mashali, A.M. The Use of Saline Waters for Crop Production; Irrigation and Drainage Paper 48; Food and Agriculture Organization of the United Nations: Rome, Italy, 1992; p. 133. [Google Scholar]
  29. Li, D.; Dossa, K.; Zhang, Y.; Wei, X.; Wang, L.; Zhang, Y.; Liu, A.; Zhou, R.; Zhang, X. GWAS uncovers differential genetic bases for drought and salt tolerances in sesame at the germination stage. Genes 2018, 9, 87. [Google Scholar] [CrossRef] [PubMed] [Green Version]
  30. Dossa, K.; Li, D.; Zhou, R.; Yu, J.; Wang, L.; Zhang, Y.; You, J.; Liu, A.; Mmadi, M.A.; Fonceka, D.; et al. The genetic basis of drought tolerance in the high oil crop Sesamum indicum. Plant Biotechnol. J. 2019, 17, 1788–1803. [Google Scholar] [CrossRef] [Green Version]
  31. van Genuchten, M.T. A Numerical Model for Water and Solute Movement in and below the Root Zone; Research Report; US Salinity Lab: Riverside, CA, USA, 1987. [Google Scholar]
  32. Seethepalli, A.; Dhakal, K.; Griffiths, M.; Guo, H.; Freschet, G.T.; York, L.M. RhizoVision Explorer: Open-source software for root image analysis and measurement standardization. AoB Plants 2021, 13, plab056. [Google Scholar] [CrossRef]
  33. Stewart, B.A.; Steiner, J.L. Water-use efficiency. In Advances in Soil Science; Springer: New York, NY, USA, 1990; pp. 151–173. [Google Scholar]
  34. Marquardt, D.W. An algorithm for least-squares estimation of nonlinear parameters. J. Soc. Ind. Appl. Math. 1963, 11, 431–441. [Google Scholar] [CrossRef]
  35. He, N.; Gao, X.; Zhao, L.; Hu, P.; Zhao, X. Modeling root water uptake patterns of oil crops grown on semiarid loess. Agric. For. Meteorol. 2023, 330, 109306. [Google Scholar] [CrossRef]
  36. Svoboda, P.; Kurešová, G.; Raimanová, I.; Kunzová, E.; Haberle, J. The effect of different fertilization treatments on wheat root depth and length density distribution in a long-term experiment. Agronomy 2020, 10, 1355. [Google Scholar] [CrossRef]
  37. Metselaar, K.; Pinheiro, E.A.R.; de Jong van Lier, Q. Mathematical Description of Rooting Profiles of Agricultural Crops and its Effect on Transpiration Prediction by a Hydrological Model. Soil Syst. 2019, 3, 44. [Google Scholar] [CrossRef] [Green Version]
  38. Fan, J.; McConkey, B.; Wang, H.; Janzen, H. Root distribution by depth for temperate agricultural crops. Field Crop. Res. 2016, 189, 68–74. [Google Scholar] [CrossRef] [Green Version]
  39. Sainju, U.M.; Good, R.E. Vertical root distribution in relation to soil properties in New Jersey Pinelands forests. Plant Soil 1993, 150, 87–97. [Google Scholar] [CrossRef]
  40. Rhoades, J.D.; Chanduvi, F.; Lesch, S.M. Soil Salinity Assessment: Methods and Interpretation of Electrical Conductivity Measurements; Irrigation and Drainage Paper 57; Food and Agriculture Organization of the United Nations: Rome, Italy, 1999; pp. 1–150. [Google Scholar]
  41. Ayers, R.S.; Westcot, D.W. Water Quality for Agriculture; Irrigation and Drainage Paper 29 (Rev. 1); Food and Agriculture Organization of the United Nations: Rome, Italy, 1985; p. 186. [Google Scholar]
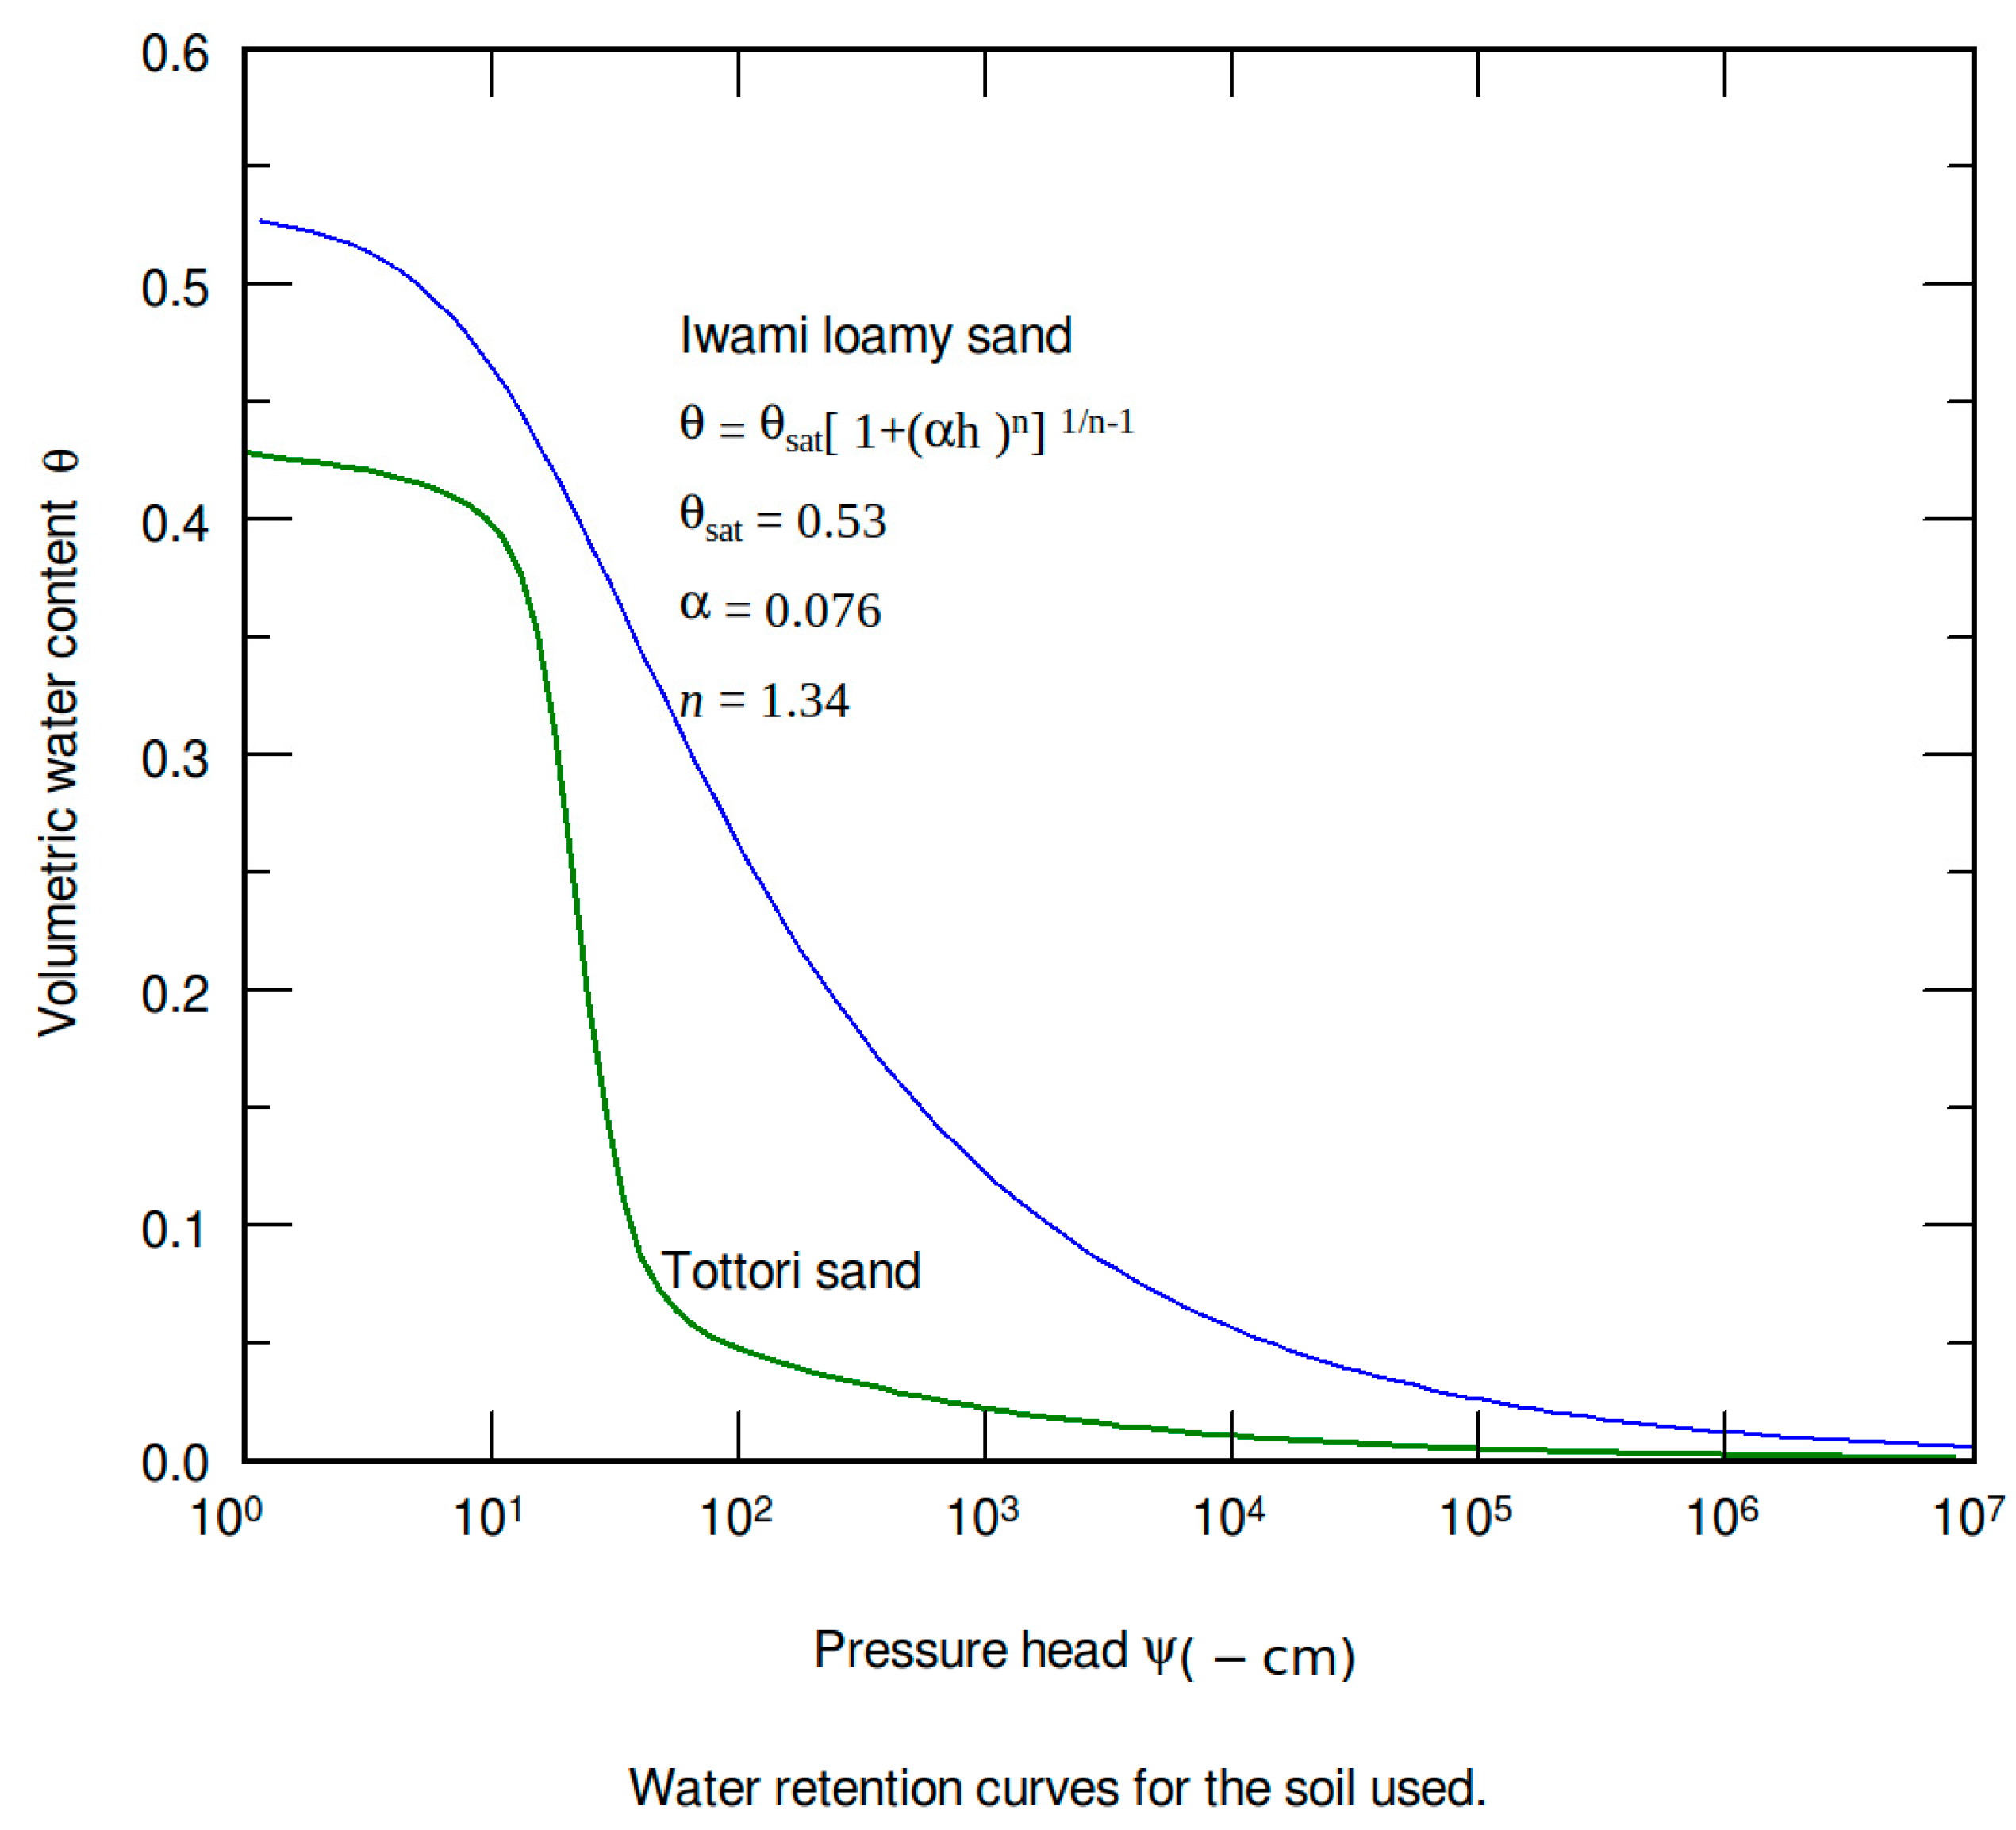
Figure 1. Soil water retention curves of the loamy sand and the sand.
Agriculture 13 01516 g001
Figure 2. Time evolution of measured (sensor output) and estimated (bulk method) soil water contents in the drought pots.
Agriculture 13 01516 g002
Figure 3. Time evolution of soil water content in the salinity pots: (a) measured (sensor output) and (b) estimated (bulk method).
Agriculture 13 01516 g003
Figure 4. Time evolution of soil salt concentration in the salinity pots.
Agriculture 13 01516 g004
Figure 5. Hourly transpiration in the control, drought, and salinity treatments.
Agriculture 13 01516 g005
Figure 6. Root length distribution and density in different soil layers in all pots.
Agriculture 13 01516 g006
Figure 7. Profiles of soil water content and salinity in all pots at the end of the experiment.
Agriculture 13 01516 g007
Figure 8. Comparison of measured and estimated (optimized) relative daily transpiration in the drought pots by (a) bulk method; (b) inverse method.
Agriculture 13 01516 g008
Figure 9. Comparison of measured and estimated relative daily transpiration in the salinity pots.
Agriculture 13 01516 g009
Figure 10. Drought stress response functions for sesame by the bulk and inverse methods.
Agriculture 13 01516 g010
Figure 11. Salinity stress response functions for sesame by the bulk and inverse methods.
Agriculture 13 01516 g011
Table 1. Crop parameter values for drought and salinity stresses estimated by the bulk and inverse methods.
StressMethodPotParameter
ho50 (cm)h50 (cm)p
DroughtBulkW11539.02.29
W21533.13.27
W31601.01.85
Mean1557.72.47
DroughtInverseW11537.06.89
W2– *– *
W31747.03.34
Mean1642.05.12
SalinityBulkS15986.52.68
S25281.51.75
S37115.13.56
Mean6127.72.66
SalinityInverseS35659.06.89
* Soil water content in W2 was not recorded.
Table 2. Water use efficiency (WUE) of sesame under the control, salinity, and drought treatments.
TreatmentPot (Replication)Aboveground Biomass (g)WUE (kg/m3)
FreshDry
ControlC1155.031.12.30
C2193.031.62.35
C3177.028.02.08
Mean175.0 a30.2 a2.24 a
SalinityS188.015.33.74
S2100.017.24.06
S3107.016.54.15
Mean98.3 b16.3 b3.99 b
DroughtW133.03.53.54
W247.03.23.46
W328.02.52.27
Mean36.0 c3.1 c3.09 ab
Values with the same letter are not significantly different (p = 0.05).
Disclaimer/Publisher’s Note: The statements, opinions and data contained in all publications are solely those of the individual author(s) and contributor(s) and not of MDPI and/or the editor(s). MDPI and/or the editor(s) disclaim responsibility for any injury to people or property resulting from any ideas, methods, instructions or products referred to in the content.