Abstract
Management based on sustainable approaches increases the resilience of systems in which they are implemented. The following study explores the sustainability and efficiency of water management in the regions of Ukraine and the role of these factors in its resilient development. The study conducts a bibliometric analysis of sources on sustainable water management, a comprehensive assessment of water resource efficiency in the regions of Ukraine, identifies and maps regional differences, and analyzes their dynamics over the period 2016–2020. The assessment shows that almost half of the regions (48.3%) have sufficient water management efficiency, 40.8% are very high, and 10.9% are average. Most regions (79.2%) maintained the same level of water resource efficiency. The Kharkiv region was examined in-depth, revealing higher water losses during transport and municipal/household sectors than the national average. Based on the assessment’s results, a differentiated approach to sustainable water management should be taken, depending on the type of regions. For regions with a very high and sufficient level of water efficiency, strategies to maintain the achieved positions should be implemented, while for regions with an average level of efficiency, strategies to improve the respective indices should be implemented. These research findings and policy recommendations can be utilized to guide policy-makers aiming to enhance the economic mechanism of sustainable water management at regional and national levels and improve their resilience to face the intensifying challenges.
1. Introduction
Around 75% of the Earth’s surface is covered with water, making the continents appear as small islands in the vast oceans. Despite this, less than 3% of the Earth’s water is freshwater and not all of it is suitable for human consumption [1]. Out of the freshwater available, only 1% can be used as drinking water. Most of the freshwater on the planet, around 69%, exists as ice caps and glaciers in places such as the Antarctic and Greenland ice sheets. However, even if all the ice caps and glaciers melted, the amount of available drinking water would still only increase by 1% [1].
The availability of water resources can have a significant impact on human life, health, and the environment, particularly in the context of climate change [2,3]. As a key strategic resource, water resources are becoming increasingly important for future sustainable development. However, water scarcity is currently the greatest threat to destabilizing various regions and making them more vulnerable.
The management and availability of freshwater are fundamental to human civilization, but humans cannot increase the amount of water available to them. In fact, increased human activity may actually reduce the amount of available freshwater [4]. Although various cultures have developed effective methods for regulating and distributing freshwater [5], human activity is exceeding the sustainable capacity of the water supply, causing changes in water usage patterns.
Sustainable and efficient water management on a national and regional level is among the key factors of resilience, which could be perceived as an ability to ensure the provision of the system functions in the face of increasingly complex and accumulating economic, social, environmental and institutional shocks and stresses [6]. Water availability is among the increasing challenges, minimization of which is highly limited, thus, efficient approaches to the management of this resource are necessary. As the production systems influence the availability of ecosystem services, to the same extent some of the latter are crucial for efficient functioning of these systems.
Resilience can be analyzed and managed at the level of production systems or regions, both of which are interrelated complex structures with core entities and the enabling environment. While the resilience capacities defined for the agricultural systems [6] include stability, adaptability and transformability, for regional resilience among the proposed approaches [7] are the resistance, reorientation and recoverability. Regional resilience is a more complex phenomenon, as, compared to production systems, its disappearance is nearly impossible, while long-term recession or decline in key functions is. The latest scientific searches on regional resilience are useful for disentangling the structure-agency relations behind the resilience concept, in which regard looking at this phenomena through the prism of resilience of its elements/subsystems seems promising [8]. Regional resilience plays an important role in sustainable development, the latter being one of the most globally-beneficial development scenarios for the upcoming decades, defined as the SSP1 (Shared Socio-economic Pathway)–“Taking the Green Road” [9].
The majority of water usage comes from agricultural, industrial, and household activities. Agricultural irrigation, which is crucial for food production and the economy, accounts for 70% of total water usage [10]. Agricultural systems with their ability to improve farming practices through more efficient and sustainable use of resources are among the leaders of potential change. Industrial water usage makes up 19% of the total, necessitating the development of strategies that balance economic development with sustainable water resources [11]. Domestic water usage makes up 11% of the total [12], with water consumption increasing by 600% from 1960 to 2014, according to WRI’s Aqueduct [13]. Common household water use includes showering, washing machines, toilet flushing, and swimming pools [14]. It should be noted that these are averaged data; in each country of the world, the pattern of water consumption depends on the nature of the country: in some, households use more than industry; in others, they use less. Urbanization, population growth, and higher living standards are major factors contributing to domestic water consumption, but other factors such as price, incentives [15], socioeconomic factors, housing and outdoor space size, and house typology [16] are also relevant. However, there are few publications on sustainable water use and management, especially in agriculture. The Brundtland report defines sustainability as meeting present needs without compromising the ability of future generations to meet their own needs [17]. Therefore, sustainable water management involves using and managing water resources in a manner that ensures that future generations will not suffer from water shortages. Proper allocation of water resources, optimization of management, analysis of climate change and its effects on water, and management of natural disasters and their effects on water resources are all part of sustainable water management [18], and are focused upon in the following article.
The management of water resources is becoming more complex due to factors such as climate change, population growth, and competition between different sectors for water usage, including agriculture, industry, and energy [19,20,21,22,23]. Integrated water resources management (IWRM) is an approach that seeks to balance water demand and supply to support sustainable development. IWRM is crucial for supporting social and operational functions that depend on water. It is necessary to address water shortages, climate change, and increasing demand for water [24]. The success of collective action involving multiple stakeholders depends on local factors such as water resource characteristics and stakeholder resources, knowledge, trust, and social capital, as well as national and EU water and agricultural policy frameworks [25]. To accurately assess drought risk for agricultural fields, a nationwide drought risk assessment must take into account complex risk interactions and the varying levels of drought risk in irrigated versus rainfed agricultural systems [26]. Agricultural water management can be improved through measures such as diversifying crops, managing crop patterns, and using a combination of surface and groundwater resources [27,28].
Efficient regional water management is essential for the economic growth of a country. Sustainable development principles should underpin any economic strategy, which means that water resources should be used economically and rationally to ensure their preservation for future generations. The World Resources Institute predicts that by 2040, Ukraine will experience a shortage of water resources, with demand exceeding supply by 40–80% [29]. Therefore, the problem of water conservation and identifying opportunities for its optimization is currently a critical issue at the regional level.
Researchers [30,31] suggest that the percentage contribution of different economic sectors to the total Gross Domestic Product (GDP) of a country or region reflects its economic situation.
Analysis of Ukraine’s water resource efficiency using GDP water content showed that [32] the average water consumption in 2020 was 10,174 m3 per 1 thousand Ukrainian Hryvnia (UAH) of GDP (or according to our calculations 313,257 m3 per 1 thousand euros). The sectors with the highest water consumption were electricity, gas, steam, air conditioning, water supply, sewage, and waste disposal, with water consumption values of 235,379 and 104,385 m3 per 1 thousand UAH of GDP (or 7,247,319 and 3,214,014 m3 per 1 thousand EUR). In contrast, information and telecommunications had the lowest water consumption (0.002 m3 per 1 thousand UAH of GDP, or 0.616 m3 per 1 thousand euros), mainly due to the low water demand and cost-effective office water use. The irreversible use of water is a sign of inefficient water utilization [32]. Although the national water content of GDP decreased by 6.4% in 2015 compared to the previous year, it still remained high [33].
Scientists suggest that total catchment per capita, rather than domestic renewable water resources, impacts GDP [34]. According to experts, the economic activities in most parts of Ukraine require significant amounts of water and are imbalanced, failing to replenish water supplies in accordance with environmental standards. As a result, infrastructure projects are necessary to redistribute water across regions for economic purposes [35]. Researchers are investigating sustainable water management issues, such as the application of sustainable water management practices among Saudi Arabian farmers [36], the impact of sustainable water management on the business performance of the Brazilian mining industry [37], the environmental and economic efficiency of irrigation projects in the face of climate change [38], and smart solutions for sustainable water management [39]. Recent studies and publications have not provided a comprehensive evaluation of water resource conservation at different levels of government.
As demand for water continues to grow, it is crucial to optimize the limited water supply to meet this demand [40]. Modeling and optimization are potential strategies for achieving this, and with the help of computer technology, they have become increasingly important for the sustainable development of water management systems.
In conclusion, experts agree that a large proportion of permanent water usage is an indication of inefficient water resource management. The existence of domestic renewable water resources in a nation does not have a significant effect on GDP, while the total water extraction per person has a significant impact. Modeling and optimization approaches are also potential solutions for advancing the sustainable development of the water industry.
The objective of the following study is to conduct an all-encompassing evaluation of water use management in the regions of Ukraine and understanding its role in achievement of resilient regional development. This includes identifying and mapping out the regional differences and analyzing their changes between 2016 and 2020. Additionally, the aim was to forecast the resource efficiency of water usage in the Kharkiv region, which could serve as the foundation for future sustainable water management.
2. Materials and Methods
In the initial phase of our research, we conducted a bibliometric analysis to gather relevant sources on sustainable water management for a comprehensive review. The VOSviewer software was used to visualize the outcomes of this bibliometric analysis.
The sustainable management of natural resources, especially water, is crucial for achieving sustainable economic development, balancing the relationship between society and the environment, and utilizing natural resources in a rational manner. There has been a significant increase in scientific research regarding sustainable water management over the past twenty years, as shown by the rise in publication rates (Figure 1). The search for the phrase “sustainable water management” in the Scopus and Web of Science databases was performed using the field “Title”.
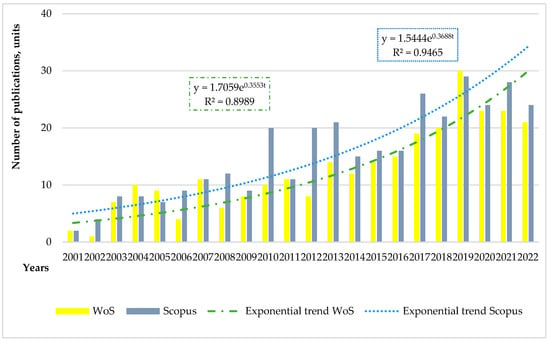
Figure 1.
Trends in the number of publications on “sustainable water management” in journals indexed by Scopus and Web of Science between 2001 and 2022. Source: own compilation based on Scopus and Web of Science databases.
As of 15 November 2022, there are 360 and 292 documents that contain the phrase “sustainable water management” in their titles and are indexed in the Scopus and Web of Science databases, respectively. The earliest indexed article on sustainable water management was in 1995, and the highest number of articles was published in 2019, with the lowest number published in 2001 and 2002. Over the past five years, both databases have recorded more than 20 articles annually. However, if the search is expanded to include the phrase “sustainable water management” in the title, abstract, and keywords, the number of indexed articles significantly increases. For example, as of 15 November 2022, the Scopus database has indexed 1692 documents with the expanded search field.
When examining the top 10 countries with the most publications related to sustainable water management (Figure 2), it can be observed that the United States has the highest number of papers, with 61 articles (16.9%). The other countries on the top 10 list have also made significant contributions, albeit less than the United States. These countries are Australia (40 papers, 6.6%), United Kingdom (35 papers, 9.7%), Germany (29 papers, 8.1%), Netherlands (24 papers, 6.7%), Spain (21 papers, 5.8%), India (20 papers, 5.6%), Italy (19 papers, 5.3%), China (18 papers, 5.0%), and Mexico (13 papers, 3.6%). However, only one article published by scientists affiliated with Ukraine has been indexed in Scopus.
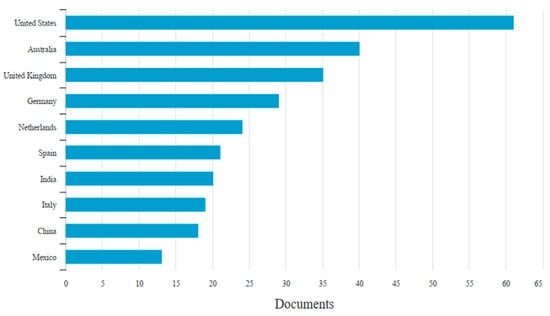
Figure 2.
Top 10 countries by number of publications on sustainable water management in Scopus-indexed journals, 1995–2022. Source: own compilation based on Scopus database.
The ranking of countries contributing to sustainable water management research is similar in the Web of Science database. The top 10 countries with the highest number of publications are the United States (42 papers, 14.4%), Australia (29 papers, 9.9%), Germany (29 papers, 9.9%), United Kingdom (28 papers, 9.6%), China (18 papers, 6.2%), India (20 papers, 6.8%), Netherlands (18 papers, 6.2%), Spain (18 papers, 6.2%), Italy (14 papers, 4.8%), and Greece (13 papers, 4.5%). It is unfortunate that Ukrainian scientists have not yet had any publications indexed in the Web of Science database on sustainable water management, which highlights the gaps that this research aims to address.
In the second stage, we utilized a comprehensive assessment methodology to evaluate the efficiency of water resource usage in the Ukrainian regions. This methodology is considered one of the components of resource-efficient nature utilization, and it was applied to our study.
The method for evaluating the efficiency of water usage as part of efficient use of natural resources [41] is based on previous research by one of the co-authors of this study [41,42]. The methodology involves standardizing 12 indicators (listed in Table 1), which are then used to determine the integrated indicators for water usage efficiency. The data used to calculate these indicators are taken from the State Statistics Service of Ukraine for the years 2016–2020, as well as other official publications and websites. This information is available in the statistical collection “Environment of Ukraine”.

Table 1.
The system of indicators for comprehensive assessment of water resource efficiency in the regions of Ukraine.
The formed indicators reflect social (X1, X2, X6, X7), ecological (X3, X4, X5, X11) and economic (X8, X9, X10, X12) criteria of sustainable water management, their combination indicates a comprehensive assessment of water resource efficiency. Since the content and methods of calculating these indicators are mostly clear, we will note the methodological provisions for calculating only some indicators [41]. For example, the level of water loss during transportation is calculated as the ratio of water loss during transportation to water intake from natural water bodies.
The level of discharge of contaminated return water is calculated as the ratio of the volume of polluted return water discharged into surface water bodies to the total volume of return water discharged into surface water bodies.
The level of pollution of consumed water is calculated as the ratio of the volume of polluted return water discharged into surface water bodies to the volume of fresh water used.
The water capacity in the manufacturing sector is calculated as the ratio of the volume of fresh water used for production needs to the population of the region.
The water capacity in the utility sector is calculated as the ratio of the volume of water used for drinking and sanitary-and-hygienic needs of the population of the region to the population of the region.
The water capacity of the economy is calculated as the ratio of the volume of fresh water used to the volume of the produced gross regional product.
The coefficient of water capacity of the economy is calculated as the ratio of the total economic value of the region’s water resources to the volume of the produced gross regional product.
The relative water capacity according to the natural assessment of water resources is calculated as the ratio of the specific weight of the region (specific size in % to the total of Ukraine) in the total intake of water from natural water bodies of the country to the specific weight (specific size in % of the total of Ukraine) of the gross regional product in the country’s gross domestic product.
The relative water capacity according to the economic (cost) assessment of water resources is calculated as the ratio of the specific weight of the region (specific size in % of the total of Ukraine) in the total economic value of the water resources of the country to the specific weight (specific size in % of the total of Ukraine) of the gross regional product in the gross domestic product of the country.
The formula below (1) was used to calculate the standardized value (S) of an indicator that has a positive effect on growth (max) [Kucher 2019] [41]:
where Xi is the actual value of the indicator, Xmin is the minimum value of the indicator, and Xmax is the maximum value of the indicator.
To calculate the standardized value of an indicator (S) that has a negative impact (min) when it increases, the following Formula (2) was used [Kucher 2019] [41]:
The Formula (3) for determining the integrated indicator of the degree of water resource efficiency involves calculating the average value of the sum of standardized indicators (ΣS) for a given region (R) [41]:
where n is the number of indicators on which the calculation was performed.
Based on the calculation results, the ranking of each region can be determined. The region with the lowest average value of standardized indicator sums (R) is considered to have the best estimate of water resource efficiency [41,42].
The stem scale expresses the integrated estimate of the degree of water resource efficiency (Irw) in points, as determined by Formula (4):
The study utilized a scale derived from the generalized Harrington desirability function to interpret the results of the assessment of water resource efficiency in the regions. The scale was transformed into a percentage scale of 100 points, where the highest result is 100 and the lowest is 0. The researchers identified five levels of water resource efficiency in the study, as they did in a previous study [41,43]:
80.0 ≤ li.n < 100.0—very high level of water resource efficiency;
63.0 ≤ li.n < 80.0—sufficient level of water resource efficiency;
37.0 ≤ li.n < 63.0—average (satisfactory) level of water resource efficiency;
20.0 ≤ li.n < 37.0—low level of water resource efficiency;
0.0 ≤ li.n < 20.0—very low level of water resource efficiency.
3. Results
3.1. Bibliometric Landscape of Sustainable Water Management
The study carried out a bibliometric and cluster analysis on the data of 360 publications indexed in Scopus. The results of this analysis allowed for the creation of bibliographic maps, as seen in Figure 3 and Figure 4.
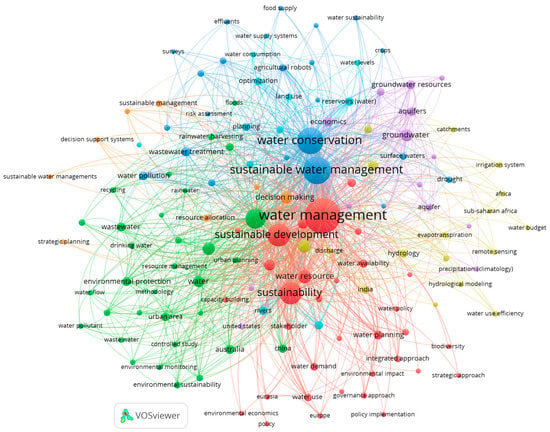
Figure 3.
Co-occurrence network map of frequently used keywords related to sustainable water management in Scopus-indexed journal publications, 1995–2022. Source: own analysis of the Scopus database with the use of the VOSviewer software.
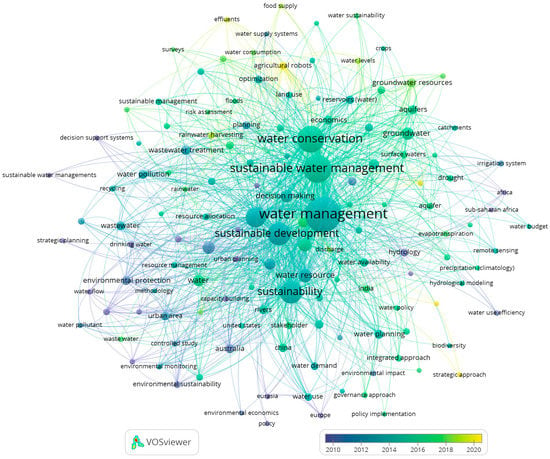
Figure 4.
Chronological map of keywords related to sustainable water management in Scopus-indexed journals, 1995–2022. Source: own analysis of the Scopus database with the use of the VOSviewer software.
The keyword co-occurrence network map (Figure 3) displays the most commonly used keywords related to sustainable water management. The various colors indicate the existence of distinct clusters and the relationships between them. The size of each circle reflects the frequency of keyword use, while the distance between elements indicates the degree of their association.
After conducting the bibliometric analysis, seven clusters of research on sustainable water management were identified. The clusters are marked with different colors, and the size of the words within each cluster represents their frequency of occurrence. The clusters are as follows:
(1) Cluster 1 (33 words) in red, focuses on adaptive management, agriculture, biodiversity, capacity building, and desalination.
(2) Cluster 2 (32 words) in green, focuses on conservation of natural resources, controlled study, drinking water, economic and social effects, and environmental monitoring.
(3) Cluster 3 (23 words) in blue, focuses on agricultural robots, cost-benefit analysis, costs, crops, and drought.
(4) Cluster 4 (17 words) in yellow, focuses on catchments, climate change, discharge, evapotranspiration, and groundwater resource.
(5) Cluster 5 (14 words) in purple, focuses on aquifer, economics, GIS, groundwater, and groundwater resources.
(6) Cluster 6 (11 words) in light blue, focuses on environmental management, information management, land use, optimization, and reservoirs (water).
(7) Cluster 7 (8 words) in orange, focuses on decision making, decision support systems, management, resource allocation, and strategic planning.
Therefore, the clusters’ keywords suggest that they cover a wide range of disciplines, indicating the interdisciplinary nature of sustainable water management. This is further supported by analyzing the distribution of publications across various industries (spheres) using the Scopus database. The analysis revealed that the majority of publications are related to environmental sciences (35.7%), followed by social sciences (12.7%), engineering (9.8%), energy (7.2%), earth and planetary sciences (6.5%), and agricultural and biological sciences (5.8%). Economics and management sciences (business, management and accounting–2.9%; economics, econometrics and finance–2.5%) together constitute 5.4% of the total number of publications.
According to the analysis of Figure 4, the research on sustainable water management from 2018 to 2022 is mainly focused on sustainable water resources, agricultural robots, water storage, and spatiotemporal analysis. In contrast, during the period of 2014–2018, the term “sustainable water management” and its meaning were the most frequently researched topics. Additionally, general issues related to water management, sustainable development, sustainability, and environmental protection were commonly discussed in scientific papers from 2010–2014.
The bibliometric landscape provides a theoretical foundation for empirical research on water resource efficiency in Ukrainian regions as a basis for sustainable water management.
3.2. Evaluation of Water Resource Efficiency in Ukrainian Regions through Comprehensive Assessment
The study carried out a thorough evaluation of the water resource efficiency in Ukrainian regions between 2016 and 2020. Outcomes of the calculation, which present the integrated evaluations of water conservation in each region using a 100-point scale, are shown in Figure 5. This section is divided into subsections and provides a brief summary of the experimental findings, their analysis, and the inferences that can be made.
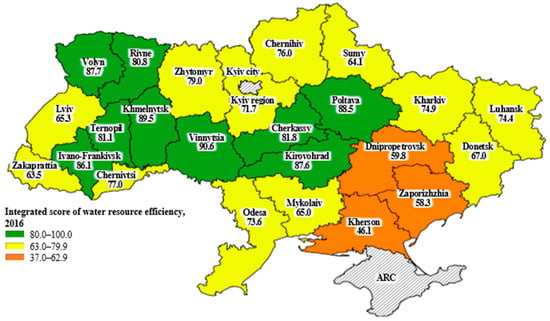
Figure 5.
Regions of Ukraine according to their water resource efficiency in 2016. Source: own research based on the data of the State Statistics Service of Ukraine.
Therefore, based on data from 2016, Vinnytsia region had the most efficient use of water resources with the lowest integrated indicator value for the degree of water savings (0.094), indicating that they used 90.6% of the theoretically possible level of water. Khmelnytskyi region ranked second with a value of 0.105, and Poltava region ranked third with a value of 0.115. The lowest ranking region was Kherson, with the highest value for the degree of water resource efficiency (0.539). The range of this indicator is 0.445, and the average value is 0.254.
Therefore, based on the data collected for 2016, the regions can be categorized into three groups according to the degree of water resource efficiency:
- Regions with a very high level of water resource efficiency, which are Vinnytsia, Khmelnytskyi, Poltava, Volyn, Kirovohrad, Ivano-Frankivsk, Cherkasy, Ternopil, and Rivne;
- Regions with a sufficient level of water resource efficiency, which are Zhytomyr, Chernivtsi, Chernihiv, Kharkiv, Luhansk, Odesa, Kyiv, Donetsk, Lviv, Mykolaiv, Sumy, and Zakarpattia;
- Regions with an average (satisfactory) level of water resource efficiency, which are Dnipropetrovsk, Zaporizhzhia, and Kherson.
- The next figure, Figure 6, displays the computed integrated measures of the degree of water resource efficiency in the regions for the year 2017, represented on a 100-point (%) scale.
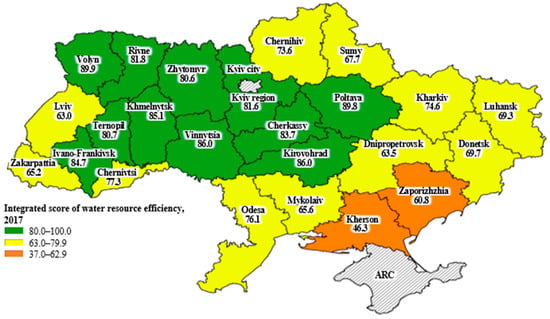 Figure 6. Regions of Ukraine according to their water resource efficiency in 2017. Source: own research based on the data of the State Statistics Service of Ukraine.
The results of the 2017 assessment of resource efficiency of water use showed that the Volyn region had the lowest value of the integrated indicator of water resource efficiency (0.101), indicating that this region used 89.9% of the theoretically possible level of water resources. The Poltava region ranked second (with a value of 0.102) and the Kirovohrad region ranked third (with a corresponding indicator value of 0.136). As in the previous year, the Kherson region had the highest value of the indicator of water resource efficiency (0.537). However, the value decreased by 0.002 (0.4%) compared to the previous year. The range of this indicator was 0.436, and the average value was 0.249.
According to the 2017 data on the degree water resource efficiency, all regions can be classified into three categories:
- Very high level of water resource efficiency, including Volyn, Poltava, Kirovohrad, Vinnytsia, Khmelnytskyi, Ivano-Frankivsk, Cherkasy, Rivne, Kyiv, Ternopil, and Zhytomyr;
- Sufficient level of water resource efficiency, such as Chernivtsi, Odesa, Kharkiv, Chernihiv, Donetsk, Luhansk, Sumy, Mykolaiv, Zakarpattia, Dnipropetrovsk, and Lviv;
- Average (satisfactory) level water resource efficiency, namely Zaporizhzhia and Kherson.
It should be noted that the Zaporizhzhia and Kherson regions have significant opportunities for enhancing their water resource efficiency.
The next step was to analyze the calculated integrated indicators for 2018 presented in Figure 7.
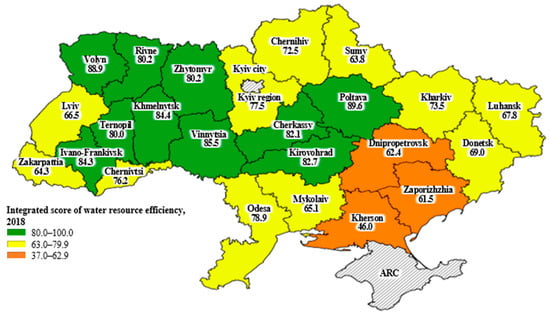
Figure 7.
Regions of Ukraine according to their water resource efficiency in 2018. Source: own research based on the data of the State Statistics Service of Ukraine.
Based on the 2018 data, the integrated indicator of the degree water resource efficiency reveals that Poltava region had the lowest value (0.104), indicating the most efficient water usage. Volyn region ranked second with a value of 0.111 and Vinnytsia region ranked third with a value of 0.145. On the other hand, Kherson region ranked last for the third consecutive year, with the highest value of the indicator (0.540). The indicator value increased by 0.003 (0.6%) compared to the previous year. The range of the indicator remains the same as in the previous year, which is 0.436, while the average value is 0.257.
Thus, according to the 2018 data on the degree water resource efficiency, all regions can be classified into three categories:
- Very high level: Poltava, Volyn, Vinnytsia, Khmelnytskyi, Ivano-Frankivsk, Kirovohrad, Cherkasy, Rivne, Zhytomyr, Ternopil reions;
- Sufficient level: Odesa, Kyiv, Chernivtsi, Kharkiv, Chernihiv, Donetsk, Luhansk, Lviv, Mykolaiv, Zakarpattia, Sumy regions;
- Average (satisfactory) level: Dnipropetrovsk, Zaporizhzhia, Kherson regions.
The next step involved examining the standardized indicators of water resource efficiency in the regions of Ukraine for 2019. The findings of this analysis are presented in Figure 8.
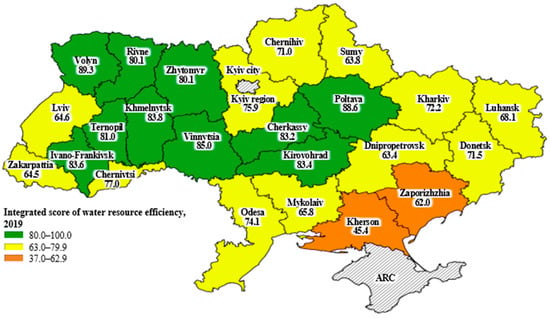
Figure 8.
Regions of Ukraine according to their water resource efficiency in 2019. Source: own research based on the data of the State Statistics Service of Ukraine.
As for the 2019 data, the integrated indicator of the water resource efficiency was analyzed, and as a result, the Volyn region had the best value (0.107) similar to the previous year. The Poltava region ranked second (0.114), and the Vinnytsia region ranked third (0.150). Unfortunately, for the fourth consecutive year, the Kherson region had the worst performance with the highest value of the indicator (0.546), which increased by 0.006 (1.1%) compared to the previous year, indicating the most significant rise in value for the region in the years under consideration. Thus, the range of the indicator was 0.439, with an average value of 0.259. The standardized indicators analysis results for 2019 are presented in Figure 8.
According to the data for 2019 data on the degree water resource efficiency, all regions can be classified into three categories:
- Very high level: Volyn, Poltava, Vinnytsia, Khmelnytskyi, Ivano-Frankivsk, Kirovohrad, Cherkasy, Ternopil, Rivne, Zhytomyr regions;
- Sufficient level: Chernivtsi, Kyiv, Odesa, Kharkiv, Donetsk, Chernihiv, Luhansk, Mykolaiv, Lviv, Zakarpattia, Sumy, Dnipropetrovsk regions;
- Average (satisfactory) level: Zaporizhzhia, Kherson regions.
The standardized indicators, both partial and integrated, for the regions of Ukraine in 2020 were computed, and the results are displayed in Figure 9.
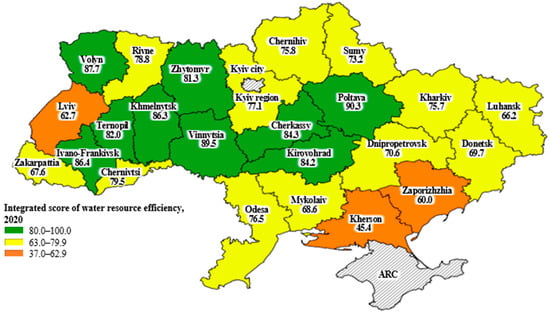
Figure 9.
Regions of Ukraine according to their water resource efficiency in 2020. Source: own research based on the data of the State Statistics Service of Ukraine.
Based on the 2020 data, it was found that Poltava region had the lowest value of the integrated indicator of water use efficiency (0.097), which was also the case in 2018. Vinnytsia region was ranked second (with a value of 0.105), and Volyn region ranked third (with a value of 0.123). On the other hand, Kherson region was again found to have the highest value of the indicator of water use efficiency (0.546), as it did in all previous years. The value of this indicator remained unchanged in comparison to 2019. Therefore, the range of the indicator was 0.449, and the average value was 0.242.
Therefore, according to the data for 2020 data on the degree water resource efficiency, regions of Ukraine can be classified into three categories:
- Very high level: Poltava, Vinnytsia, Volyn, Ivano-Frankivsk, Khmelnytskyi, Cherkasy, Kirovohrad, Ternopil, Zhytomyr regions;
- Sufficient level: Chernivtsi, Rivne, Kyiv, Odesa, Chernihiv, Kharkiv, Sumy, Dnipropetrovsk, Donetsk, Mykolaiv, Zakarpattia, Luhansk regions;
- Average (satisfactory) level: Lviv, Zaporizhzhia, Kherson regions.
The values of the integrated indicator of the degree of water resource efficiency for the first (2016) and the last (2020) years of the study period are compared in Figure 10.
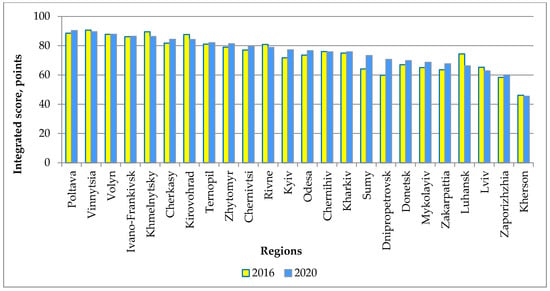
Figure 10.
The ranking of Ukrainian regions based on the integrated indicator of water resource efficiency in 2016 and 2020. Source: own research based on the data of the State Statistics Service of Ukraine.
Therefore, when compared to 2016, the integrated indicator of water resource efficiency has risen for Vinnytsia, Kirovohrad, Luhansk, Lviv, Rivne, Kherson, Khmelnytsky, and Chernihiv regions in 2020. In contrast, for the remaining regions, this indicator has decreased in 2020 compared to 2016. In summary, there was an enhancement in water resource management based on this indicator in 16 regions (two-thirds) of Ukraine.
During the study period, different regions of Ukraine took the first place in the ranking for the integrated indicator of the degree of water resource efficiency. The Vinnytsia region was in first place in 2016, while the Volyn and Poltava regions each held the position twice in 2017–2019 and 2018–2020. However, the Kherson region consistently had the lowest ranking throughout the period. It is worth noting that the absolute best value for the integrated indicator decreased from 0.094 in 2016 to 0.107 in 2019, but showed significant improvement to 0.097 in 2020. Conversely, the absolute worst value showed a negative trend, decreasing from 0.537 in 2017 to 0.546 in 2019–2020.
In regard to the generalized Harrington’s desirability function, it was found that 48.3% of the cases showed an acceptable level of water resource efficiency, while 40.8% exhibited a remarkably high level, and 10.9% demonstrated an average (adequate) level of water resource efficiency.
The level of water resource efficiency remained the same for 19 of the 24 analyzed regions (79.2%) as shown in the figures above. The remaining five areas (20.8%) had varying levels of water resource efficiency between 2016 and 2020. Rivne oblast had a very high level from 2016–2019 but was only sufficient in 2020. Kyiv oblast had a sufficient level every year except 2017 when it was very high. Zhytomyr region had a sufficient level in 2016 but was very high from 2017–2020. Dnipropetrovsk region had an average level in 2016 and 2018 but was sufficient for the other years of the study period. Finally, Lviv region had a sufficient level from 2016–2019 but was only average in 2020. In our opinion, different rates and directions of changes in the water resource efficiency in the regions are primarily related to the management decisions made at the regional level, as well as to other anthropogenic factors, because natural factors did not undergo significant changes during the analyzed period.
3.3. Dynamics of the Water Resource Efficiency in the Kharkiv Region
The examination of changes in water use in the Kharkiv region during the study period (2016–2020) was conducted by analyzing the integrated estimates of water resource efficiency computed in the second part. The main reason for choosing the Kharkiv region for an in-depth study was due to the fact that, according to its ranking positions, it can be considered a typical average among the regions of Ukraine. Therefore, the reserves for improving water efficiency determined for this region can be similarly calculated for other regions.
The changes in the integrated estimate were analyzed visually using Figure 11. To model the trend line of this indicator until 2022, we used a second-order polynomial approximation as it provides the best level of reliability compared to other functions (0.5381, or 53.81%). Although the third-order polynomial has a better level of reliability (0.9626, or 96.26%), its approximation is an overly optimistic scenario, which, taking into account current realities, is unlikely.
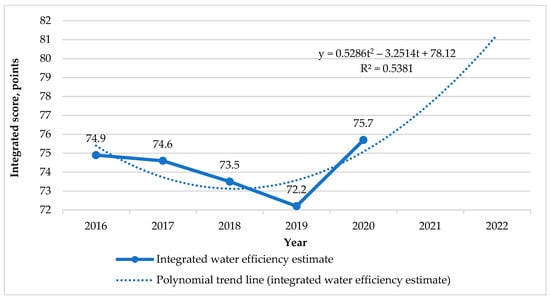
Figure 11.
Changes in integrated water resource efficiency in the Kharkiv region between 2016 and 2020. Source: own research based on the data of the State Statistics Service of Ukraine.
The integrated score in Figure 11 demonstrates a decrease from 74.9 to 72.2 from 2016 to 2019, representing a total reduction of 2.7 values (3.6%) and an annual average reduction of 0.7 values (0.9%). However, in 2020, the score improved (increased) by 3.5 values (4.8%) compared to 2019. In general, the second-degree polynomial equation indicates an acceleration of the rate of change of the integral indicator (y) by an average of 0.5286 points every year (t).
According to the model used, the integrated score is predicted to increase to approximately 81.2 in 2022. However, it’s important to note that 2020 was an exceptional year for the study period, with a significant increase in this indicator. Additionally, the estimated value of gross regional product (GRP) was used to calculate the integrated indicators of the degree of water resource savings. Therefore, the current forecasts for an improvement in this indicator in 2021 and beyond lack sufficient evidence to support them.
The Kharkiv region ranked 14th in terms of water resource efficiency during the study period, except for 2016 and 2020 when it ranked 13th and 15th respectively. This is shown in Figure 12, which provides an overview of the ranking of regions in Ukraine.
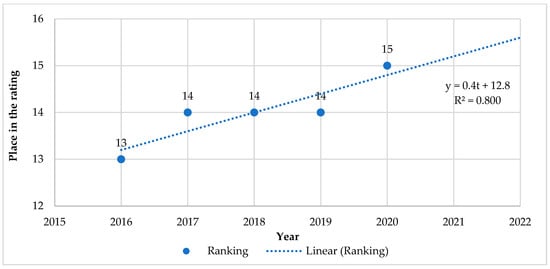
Figure 12.
Dynamics of changes in Kharkiv region’s position in the overall ranking of regions of Ukraine on water resource efficiency for 2016–2020. Source: own research based on the data of the State Statistics Service of Ukraine.
3.4. Optimizing Water Resource Efficiency in the Kharkiv Region: Proposed Directions
As mentioned earlier, official statistics are used to calculate the extent of water savings in the region through various standardized indicators, as explained in the second section. The reference value for water savings is zero, and therefore, efforts to increase water resource efficiency in the region should aim to decrease the values of relevant indicators to achieve a zero degree of savings.
Based on the results of our investigation [43], the Kharkiv region had higher average values compared to the national average for key indicators such as water loss during transportation and water capacity in the utility sector over the study period. These indicators had the most significant impact on the integrated degree of water resource efficiency in the region, which, in turn, influenced the region’s overall ranking.
Therefore, in 2016, the standardized indicator for water loss during transportation was 0.851, while the standardized indicator for water capacity in the utility sector was 0.8, resulting in a savings degree of 0.251. In 2020, the standardized indicator for water loss during transportation decreased to 0.644, while the water capacity in the utility sector increased to 1 million m3 (making the Kharkiv region the leader in Ukraine in this indicator).
The graph in Figure 13 shows that there was a considerable decrease in the water loss level during transportation from 2017 to 2020, reducing from 38.1% to 21%, which is 1.8 times lower. Despite this improvement, the value of 21% in 2020 is still one and a half times higher than the average value of this indicator in Ukraine and 14 times higher than the minimum value observed that year in the Kyiv region.
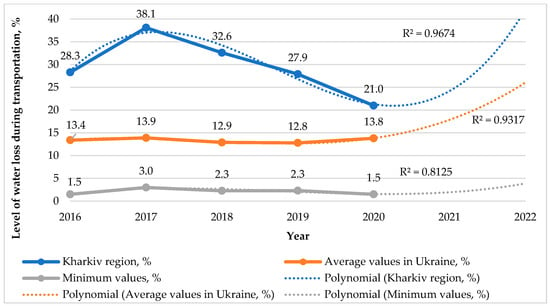
Figure 13.
Dynamics of changes in the level of water loss during transportation in the Kharkiv region in 2016–2020. Source: own research based on the data of the State Statistics Service of Ukraine.
The capacity of water use in the utility sector in the Kharkiv region did not show any significant changes during the study period (Figure 14). The lowest value of this indicator was observed in 2017, which was 38.1 m3 per capita, 1.6 times higher than the average value in Ukraine that year, and six times higher than the highest value in Luhansk region. In 2020, the capacity was 42.1 m3 per capita, 1.9 times higher than the average value in Ukraine, and 8.3 times lower than the lowest value in Luhansk region.
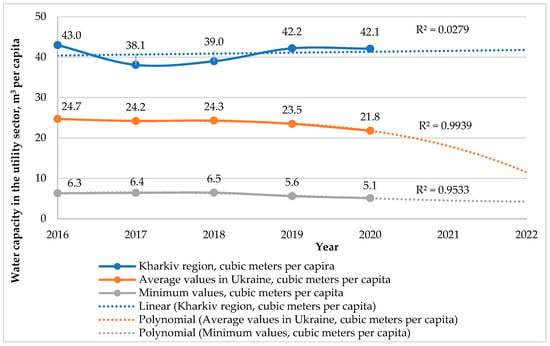
Figure 14.
Dynamics of changes in water capacity in the utility sector in the Kharkiv region for 2016–2020. Source: own research based on the data of the State Statistics Service of Ukraine.
Thus, based on the resource efficiency issues identified in the Kharkiv region, there are two primary areas for optimizing water resource management: (i) technological measures, including monitoring the condition of water supply systems, improving water resource accounting, updating infrastructure, and maintaining water quality; and (ii) organizational measures, including implementing a multilevel water tariff system and conducting educational campaigns to encourage responsible and conscientious use of water resources by consumers.
4. Discussion
The present study makes a contribution to the development of a sustainable water management mechanism and helps fill the gap caused by the insufficient representation of Ukrainian scientific works [44] in the Scopus and Web of Science databases. This gap was identified through bibliometric analysis.
In recent years, many studies have focused on sustainable water management, which includes diagnosing challenges, opportunities, and priorities for implementing sustainable water resource management under climate change [45,46,47], planning and evaluating sustainable solutions using multiple criteria [48,49], and applying various technologies and management tools [50,51,52,53,54] at different hierarchical levels and in different industries and countries. Our findings can be used in Ukraine to diagnose and plan sustainable water management measures in order to improve the resilience (both of particular production systems and entire regions), while the comprehensive assessment methodology of water resource efficiency can be applied in other regions and countries as well. Quantification of the impact of efficient water resource management on the resilient regional development is still in progress, yet presented results already show the differences in the water resource efficiency and point out the benefits of sustainable approaches.
It should be pointed out the limitations of the methodology of this study, which are largely determined by the available information base for its conduct. It is clear that in the case of using other indicators, different research results may be obtained, however, we believe that the proposed indicators at the current stage thoroughly reflect the ecological and economic state of water use.
The indicators that we have created are primarily intended for use at the regional level and are based on official statistical data available in Ukraine. However, when considering water use at the international level, it is important to take into account other indicators that reflect the unique water use characteristics of different countries. One such indicator is the water footprint, which allows us to link water consumption with the consumption of goods. For example, due to the different climate conditions in Ukraine and Poland, Ukrainian agriculture requires more water. As a result, Ukraine’s green footprint is twice as large as Poland’s. Therefore, Ukraine’s total water footprint is higher than Poland’s [55].
According to the evaluation results, a varied approach should be taken to increase the water resource efficiency in different areas. For regions with a high or adequate level of efficiency, strategies to maintain the current level should be implemented. However, for regions with an average or satisfactory level of efficiency, strategies to improve the corresponding indicators should be implemented aiming for a more sustainable use.
The practical significance of this study lies in its potential to identify areas for improving the water resource efficiency in Ukrainian regions. Furthermore, it can aid in the evaluation and prediction of the level of resource efficiency in water usage, making it one of the most promising research areas. In terms of resilience, which is crucial in face of increasing challenges (primarily environmental due to the climate change processes), the regional resilience seems to be a highly complex phenomena, as compared to the resilience of production systems (including the agri-food value chains) it is more difficult to manage and includes a multitude of elements, while the interconnection between them is not direct. This creates the necessity to address the water resource efficiency issue on the level of consumers of this resource – production systems, municipal and household sectors.
The in-depth complimentary study on water resource efficiency in the Kharkiv region has found that two indicators – water losses during transportation and water capacity in the utility sector – have exceeded the national average values in Ukraine. Therefore, to improve the resource efficiency of water usage in the Kharkiv region, regional management needs to focus on improving these indicators (i.e., reducing their values).
Efforts to improve the current condition of water resource efficiency should focus on two main areas: technological and organizational. Examples of technological measures include monitoring the technical condition of water communications, accounting for the use of water resources, upgrading communications, and maintaining water quality. Organizational strategies include implementing a multi-level tariff structure for water usage and providing educational programs to encourage consumers to use water resources responsibly. Additionally, it is important to continue researching the dynamics and forecasting of water efficiency in the Kharkiv region, taking into account the current realities of 2021–2022 and the future.
5. Conclusions
A bibliometric analysis was conducted on peer-reviewed literature on sustainable water management obtained from the Scopus and Web of Science databases. The analysis showed that the number of peer-reviewed papers on this topic is increasing, which confirms international policies aimed at adopting sustainable water management practices. The United States is the country with the greatest influence in this research field. However, there is a gap in research as scientists with Ukrainian affiliation have only one published article indexed in Scopus, and none in Web of Science. This study aims to fill this gap and makes a scientific contribution as part of a comprehensive ecological-and-economic assessment of the use of water resources for a better understanding of the current state, problems and prospects of sustainable and efficient water management for resilient regional development. It was also found that sustainable water management is an interdisciplinary field, and seven interdisciplinary clusters of research have been identified and characterized. The bibliometric analysis provides a theoretical foundation for empirical research on water resource efficiency in Ukrainian regions as a basis for sustainable water management.
The research methodology was successfully tested, leading to a thorough evaluation of the effectiveness of water resource use across Ukraine’s regions. The resulting cartograms illustrate the regional disparities in efficiency. A set of 12 indicators was developed to measure the extent of water conservation efforts. Integrated indicators were then computed and standardized to assess water consumption savings in each region of Ukraine for each year of the study period.
According to the analysis of water resource efficiency, a comprehensive assessment was conducted at the regional level, which showed that in 2020, all regions could be classified into three groups based on their level of resource efficiency. The first group had a very high level of resource efficiency and included the Poltava, Vinnytsia, Volyn, Ivano-Frankivsk, Khmelnytsky, Cherkasy, Kirovohrad, Ternopil, and Zhytomyr regions. The second group had a sufficient level of resource efficiency and included the Chernivtsi, Rivne, Kyiv, Odesa, Chernihiv, Kharkiv, Sumy, Dnipropetrovsk, Donetsk, Mykolaiv, Zakarpattia, and Luhansk regions. The third group had an average (satisfactory) level of resource efficiency and included the Lviv, Zaporizhzhia, and Kherson regions.
The following are the key policy recommendations aimed at sustainable and efficient water management, which could positively impact the resilience of regional development:
- (i)
- When setting the fee for special water use for the next reporting year, it is recommended to introduce an additional integral index of water resource efficiency for the previous year, determined annually by region, to strengthen the incentive mechanisms for water efficiency through differentiated fiscal regulation of water use.
- (ii)
- Develop regional and local programs for efficient water use and determine implementation mechanisms based on the best practices of leading regions, guided by the results of the assessment.
- (iii)
- Introduce a set of economic measures, including rewards for successful leaders, penalties for outsiders, and implementation of agreements similar to “performance contracting”, to encourage the use of resource-saving processes in water transportation, use, and consumption by heads of regional departments of ecology and natural resources and heads of territorial (regional) bodies of the State Agency of Water Resources of Ukraine.
- (iv)
- Price stimulation can be implemented through differentiated pricing for the use of water by the population, based on the principle of “the more used per person, the higher the price”.
- (v)
- Encourage the development of regional infrastructure for water conservation, particularly by stimulating capital investments and current costs for treatment of return water and reducing water losses during transportation.
- (vi)
- Intensify environmental education and awareness-raising to improve the public’s understanding of the possibilities and necessity of efficient water use in communal and domestic spheres, through training programs, publications in mass media and social networks.
The following are general recommendations that follow from the results of empirical research and can be applied at both the national and regional levels. However, specific regions may need to prioritize certain proposals related to the ecological and economic mechanism of sustainable water management if they have low ratings in those areas. In order to develop specific measures (including rewards for successful leaders, penalties for outsiders, and price stimulation), it is necessary to conduct separate studies, the promise of which has been shown in our work.
As agriculture is among the key water users, the sustainable development of Ukraine’s agricultural sector is a crucial economic prospect, and restoring irrigation is seen as an important tool in achieving this, given the changing climate conditions. This would not only help maintain and increase Ukraine’s export potential, but also have a positive impact on both national and global food security. However, another area that requires more attention is the assessment of the potential for improving the water resource efficiency in various regions and forecasting through development of scenarios, ranging from pessimistic to optimistic. Resilience of regions and production systems can be achieved only if the use of available resources is carried out responsibly, with aim to be both efficient and sustainable.
Author Contributions
Conceptualization, A.K., V.K., D.R. and L.K.; methodology, A.K., L.K. and V.K.; software, D.R. and L.K.; validation, A.K., D.R., L.K. and V.K.; formal analysis, A.K., D.R., L.K., M.S. and V.K.; investigation, A.K., D.R., L.K., M.S. and P.G.; resources, A.K. and D.R.; data curation, A.K., D.R., M.S. and P.G.; writing—original draft preparation, A.K., V.K., D.R., L.K., M.S. and P.G.; writing—review and editing, A.K., V.K. and P.G.; visualization, D.R. and L.K.; supervision, A.K. and V.K.; project administration, A.K., L.K., M.S. and V.K.; funding acquisition, V.K. and P.G. All authors have read and agreed to the published version of the manuscript.
Funding
Parts of this research are a follow-up to the project entitled “Towards SUstainable and REsilient EU FARMing systems” (SURE-Farm), which has received funds from the European Union’s Horizon 2020 research and innovation programme under Grant Agreement No 727520.
Institutional Review Board Statement
Not applicable.
Data Availability Statement
Not applicable.
Conflicts of Interest
The authors declare no conflict of interest.
References
- Misachi, J. What Percentage of the Earth’s Water Is Drinkable? 2018. Available online: https://www.worldatlas.com/articles/what-percentage-of-the-earth-s-water-is-drinkable.html (accessed on 10 October 2022).
- Downing, T.E.; Butterfield, R.E.; Edmonds, B.; Knox, J.W.; Moss, S.; Piper, B.S.; Weatherhead, E.K. CCDeW Project Team. In Climate Change and the Demand for Water; Research Report; Stockholm Environment Institute, Oxford Office: Oxford, UK, 2003. [Google Scholar]
- Arnell, N.W. Climate change and global water resources: SRES emissions and socio-economic scenarios. Glob. Environ. Chang. 2004, 14, 31–52. [Google Scholar] [CrossRef]
- Durán-Sánchez, A.; Álvarez-García, J.; De la Cruz Del Río-Rama, M. Sustainable Water Resources Management: A Bibliometric Overview. Water 2018, 10, 1191. [Google Scholar] [CrossRef]
- Gleick, P.H. Water use. Annu. Rev. Environ. Resour. 2003, 28, 275–314. [Google Scholar] [CrossRef]
- Meuwissen, M.P.M.; Feindt, P.H.; Spiegel, A.; Termeer, C.J.A.M.; Mathijs, E.; de Mey, Y.; Finger, E.; Balmann, A.; Wauters, E.; Urquhart, J.; et al. A framework to assess the resilience of farming systems. Agric. Syst. 2019, 176, 102656. [Google Scholar] [CrossRef]
- Martin, R.; Sunley, P.; Gardiner, B.; Tyler, P. How regions react to recessions: Resilience and the role of economic structure. Reg. Stud. 2016, 50, 561–585. [Google Scholar] [CrossRef]
- Hassink, R.; Gong, H. Regional Resilience. In International Encyclopedia of Human Geography, 2nd ed.; Elsevier: Oxford, UK, 2019. [Google Scholar]
- Schandl, H.; Lu, Y.; Che, N.; Newth, D.; West, J.; Frank, S.; Obersteiner, M.; Rendall, A.; Hatfield-Dodds, S. Shared socio-economic pathways and their implications for global materials use. Resour. Conserv. Recycl. 2020, 160, 104866. [Google Scholar] [CrossRef]
- Evans, R.G.; Sadler, E.J. Methods and technologies to improve efficiency of water use. Water Resour. Res. 2008, 44, W00E04. [Google Scholar] [CrossRef]
- Shi, Q.; Chen, S.; Shi, C.; Wang, Z.; Deng, X. The Impact of Industrial Transformation on Water Use Efficiency in Northwest Region of China. Sustainability 2014, 7, 56–74. [Google Scholar] [CrossRef]
- Flörke, M.; Kynast, E.; Bärlund, I.; Eisner, S.; Wimmer, F.; Alcamo, J. Domestic and industrial water uses of the past 60 years as a mirror of socio-economic development: A global simulation study. Glob. Environ. Chang. 2013, 23, 144–156. [Google Scholar] [CrossRef]
- Otto, B.; Schleifer, L. Domestic Water Use Grew 600% over the Past 50 Years; World Resources Institute: Washington, DC, USA, 2020; Available online: https://www.wri.org/insights/domestic-water-use-grew-600-over-past-50-years (accessed on 10 October 2022).
- Fonseca-Santos, B.; Corrêa, M.A.C.; Chorilli, M. Sustainability, natural and organic cosmetics: Consumer, products, efficacy, toxicological and regulatory considerations. Braz. J. Pharm. Sci. 2015, 51, 17–26. [Google Scholar] [CrossRef]
- Rajapaksa, D.; Gifford, R.; Torgler, B.; Garcia-Valiñas, M.; Athukorala, W.; Managi, S.; Wilson, C. Do monetary and non-monetary incentives influence environmental attitudes and behavior? Evidence from an experimental analysis. Resour. Conserv. Recycl. 2019, 149, 168–176. [Google Scholar] [CrossRef]
- Bich-Ngoc, N.; Teller, J.A. Review of Residential Water Consumption Determinants. In International Conference on Computational Science and Its Applications—ICCSA 2018: Computational Science and Its Applications; Lecture Notes in Computer Science; Springer: Cham, Switzerland, 2018; Volume 10964. [Google Scholar]
- UN. Our Common Future (‘The Brundtland Report’): World Commission on Environment and Development; Routledge: London, UK, 1987; pp. 52–55.
- Maiolo, M.; Pantusa, D. Sustainable Water Management Index, SWaM_Index. Cogent Eng. 2019, 6, 1603817. [Google Scholar] [CrossRef]
- Akbari-Alashti, H.; Bozorg-Haddad, O.; Fallah-Mehdipour, E.; Mariño, M.A. Multi-reservoir real-time operation rules: A new genetic programming approach. Proc. Instit. Civil Eng. Water Manag. 2014, 167, 561–576. [Google Scholar] [CrossRef]
- Bozorg-Haddad, O.; Moradi-Jalal, M.; Mirmomeni, M.; Kholghi, M.K.H.; Mariño, M.A. Optimal cultivation rules in multi-crop irrigation areas. J. Irrig. Drain. 2009, 58, 38–49. [Google Scholar] [CrossRef]
- Fallah-Mehdipour, E.; Bozorg-Haddad, O.; Beygi, S.; Mariño, M.A. Effect of utility function curvature of Young’s bargaining method on the design of WDNs. J. Water Resour. Manag. 2011, 25, 2197–2218. [Google Scholar] [CrossRef]
- Gosling, S.N.; Arnell, N.W. A global assessment of the impact of climate change on water scarcity. J. Clim. Chang. 2016, 134, 371–385. [Google Scholar] [CrossRef]
- Soltanjalili, M.; Bozorg-Haddad, O.; Mariño, M.A. Effect of breakage level one in design of water distribution networks. J. Water Resour. Manag. 2011, 25, 311–337. [Google Scholar] [CrossRef]
- Hamdy, A.; Trisorio-Liuzzi, G. Water management strategies to combat drought in the semiarid regions. In Proceedings of the Water Management for Drought Mitigation in the Mediterranean at the Regional Conference on Arab Water, Cairo, Egypt, 2–16 April 2004. [Google Scholar]
- Amblard, L.; Mann, C. Understanding collective action for the achievement of EU water policy objectives in agricultural landscapes: Insights from the institutional design principles and integrated landscape management approaches. J. Environ. Sci. Policy 2021, 125, 76–86. [Google Scholar] [CrossRef]
- Meza, I.; Rezaei, E.E.; Siebert, S.; Ghazaryan, G.; Nouri, H.; Dubovyk, O.; Gerdener, H.; Herbert, C.; Kusche, J.; Popat, E.; et al. Drought risk for agricultural systems in South Africa: Drivers, spatial patterns, and implications for drought risk management. J. Sci. Total Environ. 2021, 799, 149505. [Google Scholar] [CrossRef]
- Conrad, C.; Usman, M.; Morper-Bush, L.; Schönbrodt-Stitt, S. Remote sensing-based assessments of land use, soil and vegetation status, crop production and water use in irrigation systems of the Aral Sea Basin. J. Water Secur. 2020, 11, 100078. [Google Scholar] [CrossRef]
- Portoghese, I.; Giannoccaro, G.; Giordano, R.; Pagano, A. Modeling the impact of volumetric water pricing in irrigation districts with conjunctive use of water of surface and groundwater resources. J. Agric. Water Manag. 2020, 244, 106561. [Google Scholar] [CrossRef]
- Maddocks, A.; Samuel, R.Y.; Reig, P. Ranking the World’s Most Water-Stressed Countries in 2040. 2015. Available online: https://www.wri.org/insights/ranking-worlds-most-water-stressed-countries-2040 (accessed on 10 October 2022).
- Vörösmarty, C.J.; McIntyre, P.B.; Gessner, M.O.; Dudgeon, D.; Prusevich, A.; Green, P.; Glidden, S.; Bunn, S.E.; Sullivan, C.A.; Liermann, C.R.; et al. Global threats to human water security and river biodiversity. Nature 2010, 467, 555–561. [Google Scholar] [CrossRef] [PubMed]
- Hoekstra, A.Y. Human appropriation of natural capital: Acomparison of ecological footprint and water footprint analysis. Ecol. Econ. 2009, 68, 1963–1974. [Google Scholar] [CrossRef]
- Zhuk, V. Water capacity as an indicator of rational use of water resources. Collect. Sci. Pap. SCIENTIA 2021, 1, 85–87. [Google Scholar]
- Yarotska, O.V. Directions of reduction of water consumption of production in Ukraine. Econ. Nat. Manag. Environ. Prot. 2016, 2016, 127–136. [Google Scholar]
- Fedulova, S.; Dubnytsky, V.; Myachyn, V.; Yudina, O.; Kholod, O. Assessment of the impact of water resources on economic growth. Agric. Resour. Econ. 2021, 7, 200–217. [Google Scholar] [CrossRef]
- Fedulova, S.; Dubnytskyi, S.; Naumenko, N.; Komirna, V.; Melnikova, I.; Agabekov, B. Effective economic growth under conditions of regional water management dependence. Agric. Resour. Econ. 2021, 7, 22–43. [Google Scholar] [CrossRef]
- Alotaibi, B.A.; Kassem, H.S. Adoption of Sustainable Water Management Practices among Farmers in Saudi Arabia. Sustainability 2021, 13, 11260. [Google Scholar] [CrossRef]
- Bichueti, R.S.; Gomes, C.M.; Kruglianskas, I.; Kneipp, J.M.; Rosa, L.A.B.D.; Frizzo, K. Does sustainable water management affect business performance in the Brazilian mining industry? Environ. Qual. Manag. 2021, 31, 9–41. [Google Scholar] [CrossRef]
- Kucher, L.; Drokin, S.; Ulko, Y. Ecological and economic efficiency of irrigation projects in the context of climate change. Agric. Resour. Econ. 2020, 6, 57–77. [Google Scholar] [CrossRef]
- Dutt, S.; Punniakotty, P. Sustainable Water Management: Smart Solutions for Equity in Vellore Municipal Corporation. In Sustainable Urban Architecture; Lecture Notes in Civil Engineering; Thirumaran, K., Balaji, G., Prasad, N., Eds.; Springer: Singapore, 2021; Volume 144, pp. 67–82. [Google Scholar] [CrossRef]
- Saputra, A.W.W.; Zakaria, N.A.; Weng, C.N. Water resources management sustainability: Review of the simulation and optimization approaches. AIP Conf. Proc. 2021, 2018, 030001. [Google Scholar] [CrossRef]
- Kucher, A.V. Resource-Saving Nature Management: Workshop; Stylish Printing House: Kharkiv, Ukraine, 2019; p. 40. [Google Scholar]
- Kucher, A.; Hrechko, A. Assessment and analysis of regional features of resource-saving land use for sustainable management. Sci. Pap. Ser. Manag. Econ. Eng. Agric. Rural. Dev. 2021, 21, 431–441. [Google Scholar] [CrossRef]
- Rudenko, D.; Kucher, A. Assessment and analysis of resource efficiency of water use in the regions of Ukraine. J. Innov. Sustain. 2021, 5, 2. [Google Scholar] [CrossRef]
- Sheptak, K.; Karpenko, I.; Seredynskyy, D. Feasibility of sustainable water management in prospect of the development of oil and gas industry in the Kharkiv and Donetsk regions of Ukraine by 2040. Prz. Geol. 2016, 64, 925–928. Available online: https://geojournals.pgi.gov.pl/pg/article/view/27481 (accessed on 10 October 2022).
- Mohammed, I.N.; Bolten, J.D.; Souter, N.J.; Shaad, K.; Vollmer, D. Diagnosing challenges and setting priorities for sustainable water resource management under climate change. Sci. Rep. 2022, 12, 796. [Google Scholar] [CrossRef] [PubMed]
- Ajroudi, N.H.; Dhehibi, B.; Lasram, A.; Dellagi, H.; Frija, A. Toward sustainable water resources management in the Tunisian citrus sector: Impact of pricing policies on water resources reallocation. Water 2022, 14, 1791. [Google Scholar] [CrossRef]
- Shams, A.K.; Muhammad, N.S. Toward sustainable water resources management: Critical assessment on the implementation of integrated water resources management and water-energy-food nexus in Afghanistan. Water Policy 2022, 24, 1–18. [Google Scholar] [CrossRef]
- Radmehr, A.; Bozorg-Haddad, O.; Loáiciga, H.A. Integrated strategic planning and multi-criteria decision-making framework with its application to agricultural water management. Sci. Rep. 2022, 12, 8406. [Google Scholar] [CrossRef]
- Valdés-Pineda, R.; Garcia-Chevesich, P.A.; Alaniz, A.J.; Venegas-Quiñonez, H.; Valdés, J.B.; Pizarro, R. The impact of a lack of government strategies for sustainable water management and land use planning on the hydrology of water bodies: Lessons learned from the disappearance of the aculeo lagoon in central chile. Sustainability 2022, 14, 413. [Google Scholar] [CrossRef]
- Mathetsa, S.M.; Simatele, M.D.; Rampedi, I.T. A water-centric approach in the assessment and governance of the water-energy-climate change nexus in south Africa. Front. Sustain. Food Syst. 2022, 6, 691704. [Google Scholar] [CrossRef]
- Passaretti, S.; Mineo, C.; Varriale, A.; Cosentino, C. A technical note on the application of a water budget model at regional scale: A water Manager’s approach towards a sustainable water resources management. Water 2022, 14, 712. [Google Scholar] [CrossRef]
- Stoyanova, Z.; Harizanova, H. Impact of agriculture on water pollution. AGROFOR Int. J. 2019, 4, 111–118. [Google Scholar] [CrossRef]
- Tsiropoulos, Z.; Skoubris, E.; Fountas, S.; Gravalos, I.; Gemtos, T. Development of an energy efficient and fully autonomous low-cost IoT system for irrigation scheduling in water-scarce areas using different water sources. Agriculture 2022, 12, 1044. [Google Scholar] [CrossRef]
- Wang, W.; Straffelini, E.; Pijl, A.; Tarolli, P. Sustainable water resource management in steep-slope agriculture. Geogr. Sustain. 2022, 3, 214–219. [Google Scholar] [CrossRef]
- Panasiuk, D.; Suduk, O.; Miłaszewski, R.; Skrypchuk, P. Comparison of the water footprint in Poland and Ukraine. Econ. Environ. 2018, 67, 112–123. Available online: https://ekonomiaisrodowisko.pl/journal/article/view/121 (accessed on 10 October 2022).
Disclaimer/Publisher’s Note: The statements, opinions and data contained in all publications are solely those of the individual author(s) and contributor(s) and not of MDPI and/or the editor(s). MDPI and/or the editor(s) disclaim responsibility for any injury to people or property resulting from any ideas, methods, instructions or products referred to in the content. |
© 2023 by the authors. Licensee MDPI, Basel, Switzerland. This article is an open access article distributed under the terms and conditions of the Creative Commons Attribution (CC BY) license (https://creativecommons.org/licenses/by/4.0/).