Abstract
Drought is an environmental abiotic stress that diminishes wheat production worldwide. In the present study, we evaluated fifty bread wheat genotypes (arranged in alpha lattice design) under two main water regimes, water-deficit (two surface irrigations) and well-watered (four irrigations), at different sites in two consecutive cropping seasons, 2019/20 and 2020/21. To identify the drought-tolerant genotypes, utilized several selection/phenotyping criteria, including agronomic traits, e.g., grain yield (GY) and yield components (SM); physiological parameters such as canopy temperature (CT), leaf transpiration rate (TRN), intercellular CO2 concentration (INCO); spectral reflectance indices, e.g., Leaf Chlorophyll Index (LCI), curvature index (CI), and normalized difference vegetation index (NDVI); and stress tolerance indices (STI) were determined concurrently with the grain yield. The results revealed significant differences (p ≤ 0.01) among the environments, genotypes, and their interaction for grain yield (GY), days to heading (DH), days to maturity (DM), grain filling period (GFP), grain filling rate (GFR), Normalized difference vegetation index (NDVI), plant height (PH), and spikes per square meter (SM). The genotype plus genotype by environment (GGE) and genotype by yield*trait (GYT) biplot techniques indicated that Genotype 37 (Sakha 95) and Genotype 45 performed best under well-watered and water-deficit environments. Furthermore, the same genotypes were the best from the genotype by stress tolerance indices (GSTI) approach view. Genotype 37 (Sakha 95) was superior to the GYT selection method, with physiological parameters and spectral reflectance indices. Likewise, we can identify this genotype as low-water-tolerant based on GSTI, GYT, and SRI results and recommend involving it in the drought breeding program.
1. Introduction
Drought is the most detrimental environmental abiotic stress to wheat growth, yield productivity, and physiological processes such as photosynthesis rate and efficiency [1,2]. This effect is related to climate change, specifically global warming, and decreased rainfall events. As a result, food security and sustainability suffered globally [1,2,3,4]. Whether confounding other abiotic stresses (e.g., heat stress), drought challenges can be coping by the major breeding sustainable approach, resilience wheat cultivars with drought tolerance [2,4,5]. Additionally, wheat genotypes possessed proper physiological properties to assist phenotyping processes [3]. Wheat growth stages, including tillering, flowering, grain filling period, and characters such as plant height and leaf area index, were extremely impacted by water deficit, which reduces most stages and associated traits [1,6]. Limited water during the critical stage, e.g., the flowering and continued to the grain filling, interrupts photosynthesis and accelerates plant senesces [2,3,7]. Photosynthesis is the vital process supplying crop growth and is related directly to crop yield [4,8,9], and many devices and methods can determine it.
Remote sensing technologies provide valuable and informative data, such as spectral reflectance indices were used intensively in crop phenotyping and management to improve water use and nutrient efficiency [7]. Morphological, structural, and physiological parameters could be identified as specific spectral bands (index), significantly correlated with chlorophyll content (pigment abundance), nutrition status, and water status [7,10]. Wheat phenotyping based on spectrometry is a key component of crop breeding and improvement [11,12]. These techniques facilitate screening hundreds of genotypes in a few hours with high-throughput data and select superior wheat genotypes [11,12]. Furthermore, the spectral reflectance indices (SRIs) or vegetation indices (VIs) estimated by the apparatus measured spectrum from 400 to 2500 wavelengths around solar noon of a sunny day of crop canopy to calculate SRIs. Combining one or more spectral regions generated the index; for example, the Normalized difference vegetation index [NDVI] [13]] and desirable selection value were the maxima and indicated plant vigor [14,15,16]. Modified chlorophyll absorption reflectance index (MCARI) [17] and Leaf Chlorophyll Index (LCI) [18] are other examples of SRI indicating the leaf chlorophyll functions [19]. Moreover, the leaf area index, biomass, and water content traits could be predicted based on the SRIs recorded spectrum data [19,20].
Physiological and photosynthetic parameters provided other criteria for phenotyping and selection detecting stress-tolerant wheat genotypes [21,22]. For example, drought inhibits photosynthetic machinery, efficiency, enzyme activity, and chlorophyll content [1]. Moreover, screening for photosynthetic rate and chlorophyll content could be performed for drought-tolerance breeding [1,23]. Screening maize genotypes for drought tolerance through physiological traits such as net CO2 assimilation rate, leaf transpiration rate, leaf temperature, and intercellular CO2 concentration was determined by [21]. The effect of low soil moisture on traits of internal CO2 content, photosynthesis, and stomatal conductance in soybean was described by [24,25]. Many investigations [26,27] stated a significant correlation between captured canopy temperature (CT) by an infrared thermometer and measured NDVI by a Green Seeker sensor simultaneously with wheat grain yield. These measurements considered phenotyping approaches with low estimation casts and can be applied several times during growth stages [28]. Furthermore, physio-morphological trait, reflecting the photosynthetic capacity, the soil plant analysis development (SPAD) meter was considered as a rapid assessment of chlorophyll content index (CCI), which positively correlated with grain yield [28] and facilitated the phenotyping at different growth stages.
Many breeding programs performed stress tolerance/sensitive indices (STI) for several decades as selection criteria for wheat selection of drought tolerance [16,29,30,31]. Wheat screening methods provided the mathematical computation to compare grain yield of water-stressed and non-water-stressed environments. The iPASTIC [32] online tool kit available calculated many STI parameters. For example, the desired value was minimum in the Tolerance Index (TOL) [33]. In contrast, the minimum value was desirable for Mean Productivity (MP) [33], Stress Tolerance Index (STI) [34], geometric mean productivity (GMP) [34], harmonic mean (HM) [35], stress susceptibility index (SSI) [36] yield index (YI) [37], yield stability index (YSI) [38], and relative stress index (RSI) [39]. These indices can be categorized into two groups; the first group, GMP, MP, HM, and STI, possessed the potential to identify tolerant genotypes [16,40]. The second group has SSI and YSI used to distinguish genotypes’ performance and stability under irrigated and water-deficit environments [16,41]. Wheat breeders acquired these parameters for selecting the drought tolerance genotypes, specifically, such subjected to generate principal component analysis (PCA) biplot [42], genotype by trait (GT) technique, and genotype by yield*trait (GYT) approaches [30,31,43] in several crops.
Genotype selection relies on multiple traits crucial in crop breeding. The genotype by trait (GT) is the graphical illustration of grain yield with associated traits as weight points, e.g., agronomic attributes, physiological traits [44,45], and STI indices [31,42]. As a selection index, genotype by yield*trait (GYT) biplots were utilized to identify the elite varieties based on multiple trait combinations, such as grain yield by plant height (GY*PH) [44]. In this technique, grain yield was multiplicative by traits (GY*PH) if the desired values were maxima, while traits were divided by grain yield into lower values selected, such as lodging (GY/LOG) or disease resistance. Researchers [31] reported the selection of wheat salinity-tolerant genotypes using the GT biplots of STI parameters. Concurrently, they were subjected to GYT biplots of agronomic, physiological traits, and SRI combinations over multi-season data. In addition, the genotype by yield*STI (GYSI) method was used in the barley breeding program to select drought tolerance genotypes [43,46,47], rice breeding for drought [30], barley [43,48], and common bean [49]. Moreover, using the GT model with SRIs was used to identify trait relationships of nitrogen treatments in corn [50]. Principal component analysis (PCA) was used for phenotyping the wheat heat and drought-tolerant genotypes [51]. However, identifying drought-tolerant wheat genotypes in arid regions using hyperspectral reflectance and physiological parameters requires more research, particularly with recent genotypes introduced by breeding programs.
In the current investigation, we selected fifty elite genotypes from evaluation in the previous season in multi-location trails. The genotypes were evaluated under contrasting well-watered and water-deficit regimes. The measured traits were agronomic characters, physiological parameters, and spectral reflectance indices (SRI). This study aimed to (i) evaluate and characterize 50 genotypes under contrasting environments to select the drought-tolerant genotypes and (ii) estimate GYT graphically, using spectral reflectance indices to assist wheat breeders in selecting genotypes associated positively with grain yield.
2. Materials and Methods
2.1. Genotypes and Experimental Design
The plant material used in the current study comprised fifty elite bread wheat genotypes that were selected from the national breeding program, including the Earliness breeding program (line 2), the A bread wheat yield trial (A-BWYT), and local breeding program (Giza 171 and Sids 14) as bread wheat cultivars. Parallel superior genotypes were selected based on multi-environment yield trials, annually applied, e.g., elite spring bread wheat trial under conditions of water stress (A-ESWST), which is considered a prerequisite to advanced yield trial and elite spring bread wheat trial favorable conditions (D-ESWFT). Moreover, CIMMYT exotic yield trials, e.g., semi-arid wheat yield trial (26th SAWYT) and stress adaptive trait yield N (8th SATYN), introduced and evaluated in multi-location in Egypt; more details of all selected materials were presented in Table S1.
The fifty genotypes were arranged in an alpha lattice (alpha designs) as an experimental design, with three replicates in ten blocks; each block had five genotypes generated by GenStat 19th Edition (VSN International Ltd., Hemel Hempstead, UK). The plot area was 4.2 m2, involved six rows, 3.5 m long, and 20 cm apart. Furthermore, the phosphorus fertilizer rate was applied by 35 kg P h−1 during the wheat sowing processing. At the same time, nitrogen fertilizer was added as 180 kg N h−1 in two to three doses at each environment at the sowing prosses and tillering stage. The sowing date was in the third week of November in the consecutive seasons.
The study area is located in Sakha Agriculture research station Egypt (Latitude 31°5′ N and Longitude 30°56′ E). The site has an arid Mediterranean climate with an annual temperature of 11.7–30.9 °C and an annual mean of precipitation of 7.3 mm Table S2. The abundant sunshine and low rainfall season, as well as four distinct seasons, provide suitable places for agricultural production. The soil properties are mainly used for the production of wheat, clover, beans, sugar beet, and vegetables. The soil type is heavy clay (had a large water-holding capacity). The study was investigated in two wheat seasons (2019/2020 and 2020/2021); four distinctive environmental effects with two contrasting irrigation open-field experiments were carried out using a surface irrigation system and two irrigations (water-stressed), the applied water was in sowing date, the second was one month after sowing (during tillering stage). The second site trial was treated by four irrigations (well-watered regime) starting from sowing date with 25–30 days intervals. As the experimental procedures followed in the water deficit environment, particularly, were separated near the main ditcher (drainage channel) to reduce the water table as could as possible and were surrounded by a deep doubled ditcher (channel to assist the water drainage) and a wide wheat border of 7–10 m sur-rounded the whole water deficit site. The alpha Lattice design was used with 50 bread wheat Geno-types in three replicates. The experiment was designed and analyzed by Genstat.
2.2. Evlauted Agronomic and Physiological Parameters during the 2019/20 Season
The recorded agronomic characteristics were days to heading (DH), days to maturity (DM), DH and DM from the sowing date at November’s third week, plant height cm (PH), grain filling period (GFP), number of days between DH to DM, grain filling rate (GFR) estimated as the ratio of grain yield per grain filing period kg per day, number of spikes m−1 (SM), biomass or biological yield kg h−1 (BY), and grain yield kg h−1 (GY). The physiological parameters, e.g., canopy temperature °C (CT) obtained by a near-infrared temperature device (CEM DT 8835 Infrared & K-type Thermometer) at the completed flowering stage of each plot from 1:00 p.m. to 2:00 p.m. cloudless day. The normalized difference vegetation index (NDVI) was measured by a field portable NDVI instrument (GreenSeeker® Handheld Crop Sensor, Trimble Navigation Limited, Westminster, CO, USA). Between 11:30 a.m. and 2:00 p.m., the desired value was the maximum. The chlorophyll content index (CCI), using CCM 200 plus chlorophyll content meter (Opti-Sciences, Inc., Hudson, NH, USA) of the blade flag leaf; three readings per plot at a completed flowering stage around solar noon on a sunny day was estimated. Photosynthetic parameters were obtained by a portable porometer (steady-state porometer, LICOR, LI-1600, Lincoln, NE, USA) and designed for assessing wheat leaves’ gaseous exchange of the CO2 and H2O vapor. This apparatus was utilized to measure traits such as leaf transpiration rate μg cm−2 S−1 (TRN), leaf temperature °C (LTM), leaf diffusive resistance (LDI), carbon dioxide concentration (COCN), cuvette temperature °C (CUV), intercellular CO2 concentration (INCO), quantum sensor μmol m–2 s–1 (QUN) and calculated. These traits were measured at the completed flowering stage in a day cloudless sky and around solar noon. The ruler determined the flag leaf area (FLA).
2.3. The Evaluated Agronomic and Remote Sensing Measurements in the 2020/21 Second Season
The agronomic traits that were measured were DH, DM, GFP, GFR, SM, PH, and GY. Furthermore, the physiological parameters were determined by studying the relationship between NDVI Green Seeker device and CT. These traits were detected under the same conditions and procedures in the first season.
Remote sensing measurements, such as the wheat canopy’s spectral reflectance indices (SRI), were determined using a portable backpack ASD spectroradiometer (Analytical Spectral Devices Inc., Boulder, CO, USA). Its measurement reflectance wavelength ranged from 350 to 2500 through an optical fiber probe. The measurement time was around solar noon under cloudless conditions at the completed flowering and middle grain filling stage. The names, abbreviations, and calculation equations of spectral reflectance indices are shown in Table 1. In addition, the Ceptometer (Model AccuPAR LP-80, Decagon Devices, Pullman, WA, USA) was utilized to determine the canopy leaf area index (LAI) at the flowering and the middle of stages of grain filling within ±2 h of solar noon on a sunny day.

Table 1.
The Spectral reflectance indices information.
2.4. Stress Tolerance/Sensitive Indices
The grain yield means of the fifty genotypes in both well-irrigated/seasons (Yp) and water-stressed/seasons (Ys) subjected to calculate the stress tolerance/sensitive indices (STI) using iPASTIC online software [32]. The name, abbreviation, stress tolerance/sensitive indices, equations, and selected value Table 2. In addition, grain yield means well-watered (Yp) and water-stressed (Ys) and grain yield over two sites-years GYE of fifty genotypes, and computed indices represented in Table S3.
Table 2.
Stress tolerance/sensitive indices detailed information.
2.5. Statistical Analyses
The agronomic characteristics included DH, DM, GFP, GFR, SM, PH, and GY, and the physiological parameters determined that CT and NDVI (GreenSeeker) performed for the analysis of variance (ANOVA) of four environments (two seasons and two sites). However, the remaining traits, such as photosynthetic parameters and BY of season 2019/20, were analyzed over two sites (well-watered and water-deficit), and season 2020/21 traits, including SRIs and LAI, combined data separately.
The graphical analysis of genotype plus genotype×environment (GGE) biplots for grain yield over four environments was conducted according to [53,54] by GenStat 19th Edition (VSN International Ltd., Hemel Hempstead, UK).
The numeric values of stress tolerance indices (Table S3) as the output of the iPASTIC online tool kit were used to depict genotype by stress tolerance indices (GSTI) biplots according to [45] as a genotype by trait (GT) technique. This table before analysis was normalized as follows:
where Yij standardized genotype i for trait j, Tij is the original genotype value i for trait j, genotype mean i for trait j, and Sj is the standard deviation for trait j.
Additionally, the genotype by yield*traits (GYT) figures of agronomic and physiological characteristics such as DH, DM, GFP, GFR, SM, PH, CT, NDVI, and GY (averaged four environments). The physiological traits determined during season 2019/20, e.g., QUN, CCI, and LTM, averaged over contrasting two sites. The same computing process was established for SRIs, in season 2020/21 of fifty genotypes.
Consequently, the GYT combinations (GY*NDVI) were computed by multiplying GY by traits because the high values are desirable, except for DH and DM, GFP, and CT are divided [44]. At the same time, the second season GY and spectral reflectance indices (SRI, e.g., TVI and MCARI) as traits were occupied to produce the yield by traits combinations (GY*MCARI).
The Origin(Pro), Version 2021 (OriginLab Corporation, Northampton, MA, USA) was used to illustrate the radar chart for the traits and normalization equation as follows:
where XN is the normalized value, XO is the original value, and XMAX and XMIN are the minimum and maximum values of the trait, respectively. This method converts the traits unitless.
The Seabon function in Python prepared a visualization of pair-plot.
3. Results
3.1. Analyses of Variance over the Four Environments and GGE Biplots
The combined data (ANOVA) for agronomic and physiological traits, e.g., grain yield (GY), canopy temperature (CT), days to heading (DH), days to maturity (DM), period grain filling (GFP), grain filling rate (GFR), Normalized difference vegetation index (NDVI), plant height (PH), spikes per square meter (SM), were shown in Table 3, along with the coefficient of variation (CV%). These shared/mutual characteristics of fifty genotypes were evaluated under contrasting water regimes sites and seasons (four environments). The results revealed that environments, genotypes, and their interaction significantly varied (p ≤ 0.001) for all mentioned traits except for the interaction of CT and PH. In addition, The CV% ranged from 2.27 for DM to 17.46 for SM as an agronomic trait.
Table 3.
Analysis of variance (mean square) of agronomic and physiological parameters of fifty genotypes evaluated under well-watered and low-watered sites in the seasons 2019/20 and 2020/21 (four environments).
Figure 1 depicts which won where for genotype plus genotype by environment (GGE) biplot view of fifty genotypes treated by four irrigations (well-watered) and two irrigations (water-deficit) in the two studied seasons 2019/20 and 2020/21 (four environments). The principal components were reported as 85.94% of the total environment variation, genotypes, and their interaction. Likewise, Genotypes 37 and 42, situated on the polygon’s vertices in the sector, contain a well-watered environment in the first season. The other biplot sector stressed site season 2019/20 (environment), with genotypes 22 and 12 as the winners.
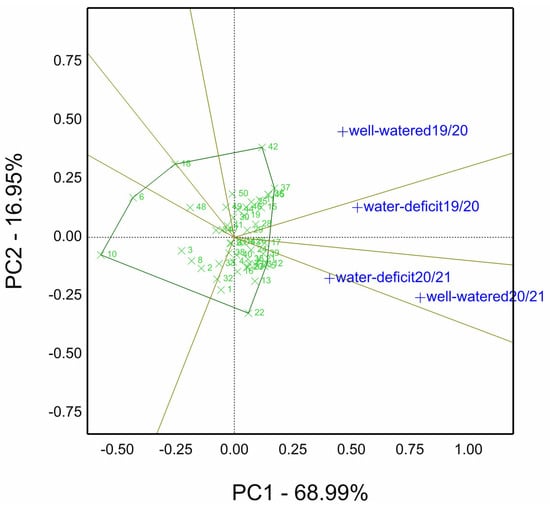
Figure 1.
“which-won-where” biplot for grain yield kg ha−1 (GY) of fifty wheat genotypes evaluated under well-watered and water-deficit (low-watered) sites in 2019/20 and 2020/21 seasons (four environments).
The mean vs. stability of GGE in Figure 2 was depicted. Fifty genotypes were evaluated in two water-regimes sites and two seasons (four environments). The genotypes top-ranked 37, followed by 45, 25, 42, and 17; the lowest genotype was 10. The most stable genotypes possessed a short projection and position close to the average tester coordination (ATC), i.e., an arrowed line perpendicularly on the grand mean line. For example, genotype 17 was more stable than 42, and 37 high yielding and stable.
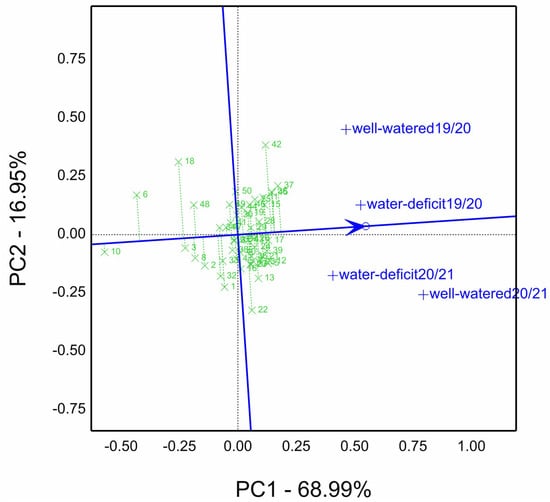
Figure 2.
Means vs. stability biplot for grain yield kg ha−1 (GY) of fifty wheat genotypes evaluated under well-watered and water-deficit (low-watered) sites in 2019/20 and 2020/21 seasons (four environments).
3.2. Analyses of Variance Sites per Season and Contrasting Sites Comparison
Based on the analysis of variance (Table 4) the environments were significantly varied for these studied traits BY, CUV, INCO, LDI, LTM, QUN, and TRN. In comparison, there were significant differences among the genotype for traits, e.g., BY, CCI, HI, FLA, and QUN. However, genotype by environment interaction recorded no significant difference in all traits except for CCI and FLA for the 2019/20 season.
Table 4.
Analysis of variance (mean square) of agronomic traits, physiological parameters, and spectral reflectance indices of fifty genotypes evaluated under well-watered and water deficit sites (two environments) in the 2019/20 and 2020/21 seasons.
The data in Table 4 showed the combined ANOVA for spectral reflectance indices of fifty genotypes under well-watered and water-deficit sites in season 2020/21. The environments significantly varied from site to site for all spectral indices and canopy leaf area index (LAI) except for the leaf chlorophyll index (LCI). In contrast, there were significant differences among genotypes for all spectral indices and LAI except for curvature index (CI) and modified chlorophyll absorption reflectance index (MCARI). Furthermore, the interaction of LCI and normalized difference vegetation index NDVI2 (estimated by spectral device) varied significantly for the environment by genotypes.
Figure 3 depicts the mean performance of fifty genotypes evaluated in season 2019/20 under well-watered and low-watered regimes as a radar chart. DH, GFP, GFR, CCI, BY, TRN, LTM, and INCO estimated traits all recorded the same point of contrasting water regimes. Furthermore, the well-watered site has higher DM, PH, CUV, and QUN values than the water-stressed site. Water-limited traits such as NDVI, CT, SM, GY, HI, FLA, COCN, and LDI, on the other hand, had mean performance greater than the well-watered site for site. Except for HI, COCN, TRN, LDI, LTM, CUV, and INCO, the genotypes of all traits differed significantly (p ≤ 0.01).
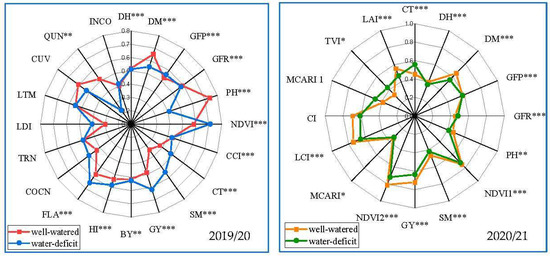
Figure 3.
Radar chart for the mean performance of agronomic traits, e.g., GY, grain yield kg ha−1; DH, days to heading; DM, days to maturity; GFP, grain filling period PH, plant height cm; SM, spikes per square meter; BY, biomass kg ha−1; CCI, chlorophyll content index; HI%, harvest index; GFR, grain filling rate; physiological parameters, such as CT, canopy temperature; NDVI, Normalized difference vegetation index; FLA, flag leaf area; COCN, carbon dioxide concentration; CUV, cuvette temperature °C; INCO, intercellular CO2 concentration; LDI, leaf diffusive resistance; LTM, leaf temperature °C; QUN, quantum sensor μmol m–2 s–1; TRN, leaf transpiration rate μg cm−2 s−1, and spectral reflectance indices, e.g., CI, Curvature Index; LCI, Leaf Chlorophyll Index; MCARI, Modified chlorophyll absorption reflectance index; TVI, Triangular Vegetation Index; LAI, canopy leaf area index estimated for 50 genotypes well-watered and stressed-water conditions in 2019/20–2020/21 seasons. *, **, and *** Significant level of p ≤ 0.05, p ≤ 0.01, and p ≤ 0.001, respectively.
The agronomic and physiological characteristics and spectral reflectance indices of fifty genotypes were averaged over water-treated sites in seasons 2020/21 (Figure 3). Additionally, for traits DH, GFP, GFR, NDVI1, and MCARI recorded the same average for both sites. On the other hand, the well-watered site outperformed the stressed site in the DM, PH, GY, NDVI2, LCI, CI, and LAI. On the contrary, they were considering the traits CT, TVI, and MCARI1. Furthermore, the genotypes varied significantly for all traits except MCARI1 and CI.
3.3. Genotype by Stress Tolerance Indices (GSTI) as Genotype by Index Biplots
The data in Supplementary Table S3 demonstrated the grain yield means of fifty genotypes evaluated under well-watered (Yp) and low-watered (Ys) sites in both seasons, combined means over sites-years (four environments) (GYE), and drought tolerance/sensitive indices. Accordingly, genotype 37, followed by 45, recorded the top-ranked genotypes based on the combined data of four environments. Moreover, genotype 10 demonstrated the poorest performance. These results confirmed the findings in Figure 5.
The data in Supplementary Table S4 revealed that Genotypes’ rank was based on grain yield estimated from well-watered (Yp) and low-watered (Ys) sites and drought tolerance/susceptible indices. Genotype 20 possessed top-ranked for Ys, TOL, SSI (sensitive indices), YI, YSI, and RSI (yield stability). However, genotype 37 recorded the top rank for STIs such as MP, GMP, HM, STI, and, followed by genotype 45 for the same STIs. These findings were approved, with results shown in Figure 4. According to the STIs sum and average of ranks, genotype 15 recorded 56 and 5.1 as the best, respectively. In contrast, genotype 47 had 489 and 44.5 as the last genotype, respectively.
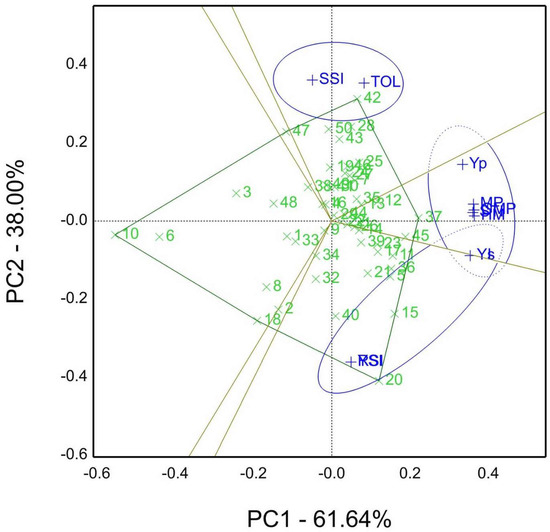
Figure 4.
The “which-won-where” of genotype by stress tolerance indices (GSTI) biplot view of grain yield (Yp) estimated for well-watered sites and stress sites (Ys) and stress tolerance indices viz TOL, Tolerance index; SSI, stress susceptibility index; MP, mean productivity; STI, stress tolerance index; GMP, geometric mean productivity; HM, harmonic mean; YI, yield index; YSI, yield stability index; RSI, relative stress index; of fifty genotypes in both seasons 2019/20 and 2020/21 (averaged seasons).
Figure 4 Showed that the which-own-where biplot of the genotype by stress tolerance indices (GSTI) view. The sector of genotype 42 was the winner based on TOL and SSI susceptible indices, and genotype 37 (genotype 45 close to 37) was situated on the polygon’s peak with tolerance indices such as HM, STI, MP, GMP, as well as well-watered mean Yp, while the yield stability indices, e.g., RSI, YSI, YI, and Ys, pointed to the third sector with genotypes 20 and 15 as winners. Furthermore, PC1 61.64% and PC2 38% accounted for 99.66% of the total variation, which means that STI parameters were computed from each other.
The average tester coordination view of GSTI Figure 5. The genotype rank commencing from 37 > 45 > 11 > 36 > 5 > 12 > … > 10 (lowest value), while the best genotypes were 37 and 45, located at the first rank and near the arrowed line, which means high yield, more tolerance, and stability close to the coordinator line.
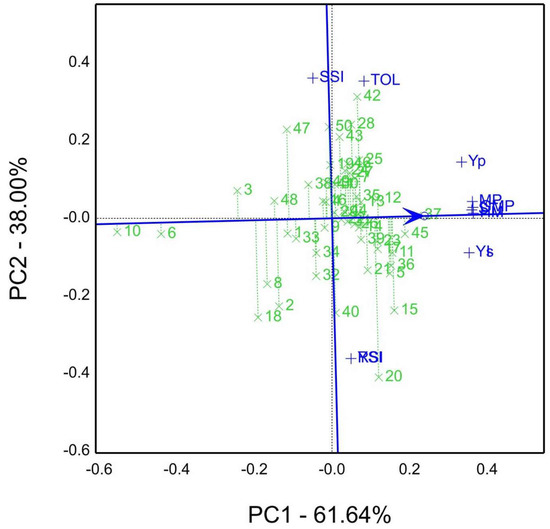
Figure 5.
The average tester coordination, genotype by stress tolerance indices (GSTI) biplot view of grain yield (Yp) estimated for well-watered sites and stress sites (Ys) and stress tolerance indices, e.g., TOL, Tolerance index; SSI, stress susceptibility index; MP, mean productivity; STI, stress tolerance index; GMP, geometric mean productivity; HM, harmonic mean; YI, yield index; YSI, yield stability index; RSI, relative stress index; of fifty genotypes in both seasons 2019/20 and 2020/21 (averaged seasons).
Supplementary Figure S1 shows the tester victor’s view of the GSTI biplot. The sensitive index SSI situated in the position made a cute angle with the TOL parameter, indicating a strongly correlated relationship. However, the wide angle between SSI and YSI indicated no correlation, reflecting the magnitude of negative correlation and vice versa. To confirm these relations, numerically represented Pearson correlation coefficients are in Figure S2. SSI and TOL positively correlated r = 0.92 value, whereas SSI and YSI represented negatively correlated r = −0.92 value. In addition, the relationship between RSI and YSI indices was positioned identically at the same point on the biplot and recorded r = 1.0 value.
3.4. Genotype by Yield*Trait (GYT) for Each Season
According to the view of genotype by yield*trait (GYT) model, the which-won-where biplot of the yield traits combinations, fifty genotypes, were evaluated in contrasting water regimes in season 2019/20 Figure 6. These combinations were generated from the two-way genotype table by trait (GT); hence, they were normalized and computed graphically by biplots. The plot into five sectors was divided; sector one had genotype 7 as a winner based on GY*BY and GY*CCI combinations. The second sector of genotype 37 included the most combinations with agronomic traits and physiological parameters. Genotype 45 was the winner in the last section with GY*GFP and GY*HI combinations. The PC1% and PC2% sum was 85.62% of the total variation.
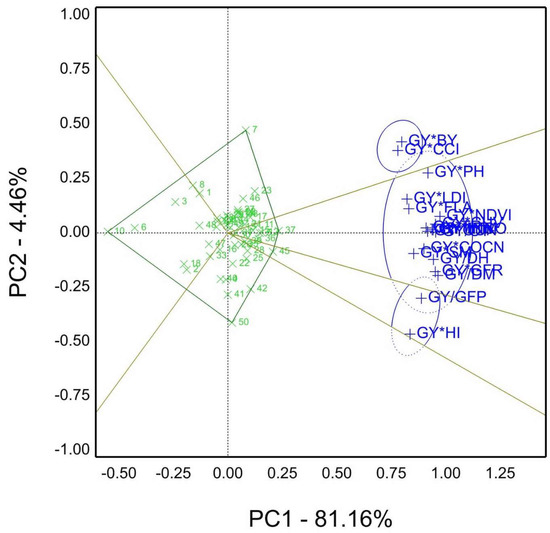
Figure 6.
The “which-won-where” of GYT view for agronomic and physiological traits combinations, e.g., GY, grain yield kg ha−1; CT, canopy temperature °C; DH, days to heading; DM, days to maturity; GFP, grain filling period days; GFR, grain filling rate; NDVI, Normalized difference vegetation index (measured by GreenSeeker); PH, plant height cm; SM, spikes per square meter; BY, biomass; CCI, chlorophyll content index; HI%, harvest index; FLA, flag leaf area; COCN, carbon dioxide concentration; CUV, cuvette temperature °C; INCO, intercellular CO2 concentration; LDI, leaf diffusive resistance; LTM, leaf temperature °C; QUN, quantum sensor μmol m–2 s–1; TRN, leaf transpiration rate μg cm−2 s−1; of 50 genotypes under well-watered and water-limited conditions 2019/20 season.
The data of GYT were illustrated in Figure 7, depict the genotypes ranking relying on the yield traits combination in season 2020/21. Consequently, the top-ranked genotype was 37, followed by 45, 36, 12, 11, and the lowest genotype10. Moreover, the genotype had a short projection, tended to be stable, and desired to select from these combinations in the first season. Accordingly, genotypes 37, 45, 12, and 11 recorded high-performance stability upon the GYT combinations.
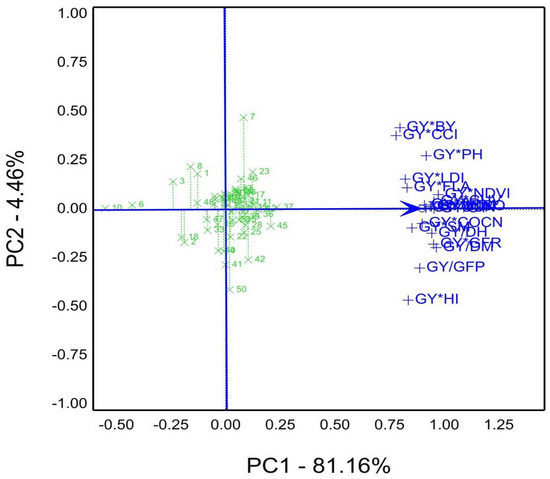
Figure 7.
Genotype ranking based on GYT view for agronomic and physiological traits combinations, e.g., GY, grain yield kg ha−1; CT, canopy temperature °C; DH, days to heading; DM, days to maturity; GFP, grain filling period days; GFR, grain filling rate; NDVI, Normalized difference vegetation index (measured by GreenSeeker); PH, plant height cm; SM, spikes per square meter; BY, biomass; CCI, chlorophyll content index; HI%, harvest index; FLA, flag leaf area; COCN, carbon dioxide concentration; CUV, cuvette temperature °C; INCO, intercellular CO2 concentration; LDI, leaf diffusive resistance; LTM, leaf temperature °C; QUN, quantum sensor μmol m–2 s–1; TRN, leaf transpiration rate μg cm−2 s−1; of 50 genotypes under well-watered and water-limited conditions 2019/20 season.
Figure 8 shows the which-won-where of the GYT approach of agronomic traits and spectral reflectance indices (SRI) combinations in season 2020/21. Genotypes 37 and 45 were the winners for most of the combinations. However, genotypes 36 and 11 scored the best for combinations of GY*TVI and GY*MCARI. Furthermore, the remaining combination was GY*CI with genotype 10. In addition, PC1 82.38% and PC2 6.63% accounted for about 89.01% of total variations.
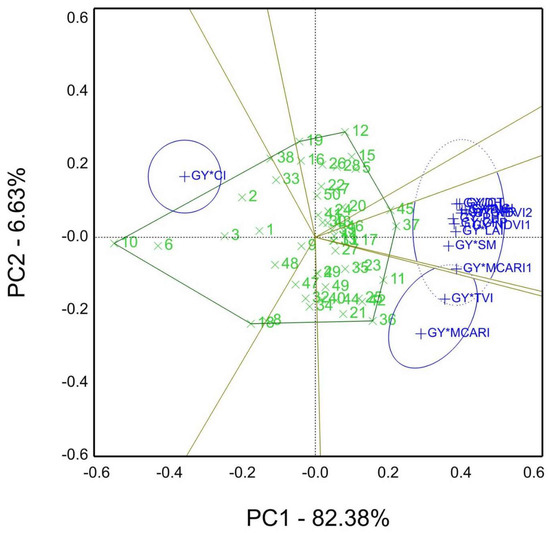
Figure 8.
The “which-won-where” of GYT view for agronomic traits and spectral reflectance indices, namely GY, grain yield kg ha−1; CT, canopy temperature °C; DH, days to heading; DM, days to maturity; GFP, grain filling period days; GFR, grain filling rate; NDVI, Normalized difference vegetation index (NDVI1 measured by GreenSeeker; NDVI2, by spectral devices); PH, plant height cm; SM, spikes per square meter; CI, Curvature Index; LCI, Leaf Chlorophyll Index; MCARI, Modified chlorophyll absorption reflectance index; TVI, Triangular Vegetation Index; LAI, canopy leaf area index (Ceptometer).
In the GYT view results of the 2020/21 season Figure 9, the average tester coordination (ATC) exhibited the top-ranked genotypes, e.g., genotype 37 > 45 > 11 > 36. On the contrary, genotype 10 recorded the poorest (least) performance of the GYT combinations of agronomic, physiological, and spectral reflectance indices, and genotypes 37 and 45 tend to be superior (stable) more than genotype 12. Thus, the ATC arrowed line referred to the closeness and farness of the genotype situation.
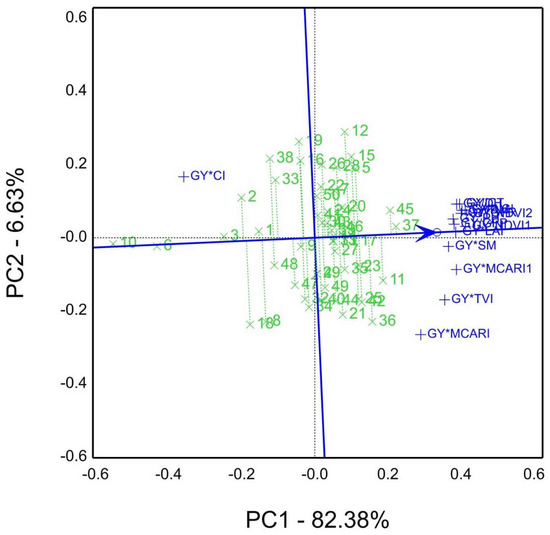
Figure 9.
The average tester coordination (ATC) view of genotypes by yield*traits GYT biplot view for agronomic traits and spectral reflectance indices, namely GY, grain yield kg ha−1; CT, canopy temperature °C; DH, days to heading; DM, days to maturity; GFP, grain filling period days; GFR, grain filling rate; NDVI, Normalized difference vegetation index (NDVI1 measured by GreenSeeker; NDVI2, by spectral devices); PH, plant height cm; SM, spikes per square meter; CI, Curvature Index; LCI, Leaf Chlorophyll Index; MCARI, Modified chlorophyll absorption reflectance index; TVI, Triangular Vegetation Index; LAI, canopy leaf area index (Ceptometer).
Under two irrigation regimes, pair plot analysis (Figure 10) revealed correlations between various indices such as NDVI, MCARI, LCI, CI, MCARI, TVI, and LAI (i.e., normal and stress).
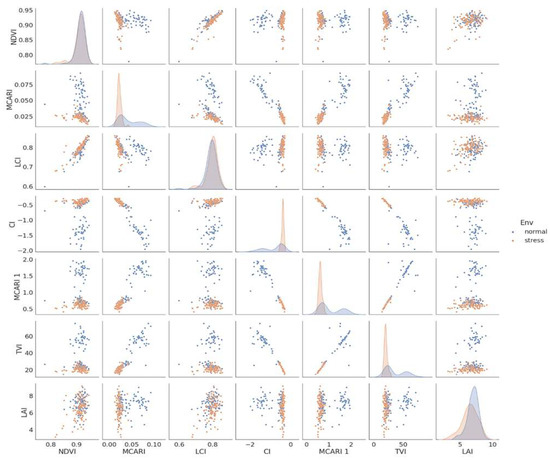
Figure 10.
Pairplot of correlations between NDVI, MCARI, LCI, MCARI, TVI, and LAI under two irrigation regimes (normal and stress).
4. Discussion
In the present investigation, fifty bread wheat genotypes were collected and subjected to different water regimes in two consecutive seasons for the evaluation of these materials for drought tolerance. Some genotypes were remarked as drought-tolerant genotypes, e.g., Sokoll, Veroby, and Westonia, and their improved offspring (advanced breeding lines) [26,51]. In addition, the newly released Egyptian cultivars, such as Sakha 95 and Misr 4, along with several advanced breeding lines, showed in Table S1. The fifty wheat genotypes were grown under well-watered (four surface irrigations) and water-deficit (two surface irrigations) sites in two successive seasons. Furthermore, the multidisciplinary collaboration to estimate traits, such as physiological characteristics and spectral reflectance indices, in addition to the essential agronomic attributes, which generated data sets, could be performed to select superior genotypes. In general, genotypes 37 and 45 were the superior genotypes based on most statistical techniques’ views that were used in this research.
The data visualization by GGE, GT, and GYT biplots proposed in many studies [44,45,53,54] facilitated the breeders’ selection (phenotyping) of the wheat genotypes. These graphical approaches relied on physiological parameters, hyperspectral reflectance measurements, and stress tolerance indices (STI) concurrently with agronomic traits. In this investigation, we performed the genotype by trait (GT) biplots to identify the water-deficit tolerant genotypes after calculating the STI from the iPASTIC online software [32]. Hence, the normalized STI data were performed to depict the biplots (GSTI). As a result, genotypes 37 and 45 were recorded as the best-tolerant genotypes in Figure 4 and Figure 5. These results were aligned with [30,31,49,50,55]. At the same time, from the GGE view, the same genotypes had the top-ranked genotypes along with genotype 36 Figure 2, similar findings reported by authors [21,56,57].
Genotypes 37 and 45, additionally, recorded the top-ranked genotypes based on the genotype by yield*trait (GYT) view for all combinations in both seasons, was shown in Figure 6, Figure 7, Figure 8 and Figure 9. As the interpretation of these results, the selection was performed not only for the grain yield and yield components but also with the assistance of associated traits, e.g., physiological, agronomic traits, and spectral reflectance indices combinations. These results agreed with the findings of other reports [31,43,44,46,49]. Therefore, it can be concluded that genotypes 37 (Sakha 95), and 45 were superior from several diminutions of statistical analyses of biplot techniques for tolerance of water-shortage stress Figure 2, Figure 5, Figure 7 and Figure 9.
Despite the experimentation procedures applied in the water-deficit site to control the surface irrigation system, there was a reduction in the water table as possible and facilitated the water drainage. Furthermore, the well-watered site in the first season had a problem in the germination stage, i.e., the first-time irrigation water was increased, causing the irregular distribution of plants per plot. Hence, causing a large amount of variation among genotypes that appeared in CV 24% for BY as a result was shown in Table 4, and CV 23% for SM. Moreover, the genotypes’ grain yield varied from one replicate to another despite using the appropriate design. Based on the low amount of rain per year and irregular distribution of the season’s period in our region (Table S2), we applied the four trials without rain shelters. It may improve the plant vigor state, particularly in water-deficit sites, in addition to the closeness of the water table. As a promising result, two satisfied irrigations per season (five-six months) in the northern Egyptian region may produce a proper amount of bread wheat.
The alpha lattice design was utilized to reduce the experimental error as a local control to apply genotypes evaluation under contrasting water regimes acquiring an appropriate statistical design. The generating and analyses processes by GenStat statistical package for this purpose, specifically in the case of fifty genotypes, i.e., overall combined ANOVA for agronomic traits such as grain yield and physiological parameters (mutual traits both seasons), e.g., NDVI and CT was shown in Table 3. over four tested environments, the environments, genotypes, and their interaction were varied significantly, which the similar trend in other reports [47,57,58]. And the same row data of grain yield is used to generate the GGE biplot [21,56,57]. In addition, Table 4 shows the significant differences in environments, genotypes, and their interactions for most studied traits over 21 the season by season separately. These findings agreed with the results of agronomic traits [51,57], canopy temperature (CT), and chlorophyll content index (CCI) [22,51] in the selection of wheat and quinoa, drought and heat-tolerant genotypes, respectively. However, maize drought tolerance by photosynthesis parameters, e.g., transpiration rate, was reported in [21]. Other researchers [59,60,61] reported that wheat phenotyping is based on spectral reflectance indices (SRI), such as CI and NDVI.
Wheat phenotyping based on spectrometry is critical for wheat resilience breeding and improvement [11,12]. Remote sensing techniques involving measurements facilitate the screening of hundreds of genotypes in a few hours with high-throughput data that can rely on in selecting superior wheat genotypes [11,12]. Spectral reflectance indices related to morphological, structural, and physiological parameters can identify as specific spectral bands (index), significantly correlated with chlorophyll content (pigment abundance), nutrition status, and water status [7,10]. Authors [17,27,51,62,63] reported that using NDVI and canopy temperature (CT) for phenotyping wheat genotypes for heat and drought stresses is beneficial and significantly correlated with grain yield. Accordingly, genotypes 37 and 45 recorded the superior genotypes from the several criteria of agronomical, physiological, and spectroscopy parameters combinations in Figure 7 and Figure 9. Similar findings were reported about utilizing the many different traits (agronomic, physiological traits, SRI) and using the GYT approach to identify and select the resilience genotype with a salinity tolerance ability pointed out by researchers [31,64].
To compare the mean performance between well-watered and low-watered sites in both seasons separately in the radar/spider chart, the minimum and the maximum units of traits are used to convert the traits into unitless values for normalized data. The GY and SM traits in the well-watered site recorded a lower average than the water-deficit site, which may reflect the high variation among genotypes evaluated in this site Figure 3. However, the same characters’ average is in a logical order (control higher than stress) in the second season Figure 3. These findings agreed with the results of several agronomic and physiological traits reported by [31,65,66,67,68,69,70]. However, many investigations used the radar chart to compare two different sites, such as the evaluation of maize genotypes for drought tolerance [21].
5. Conclusions
Finally, we used a variety of selection criteria, agronomic traits, physiological parameters, spectral reflectance indices, and drought tolerance indices that were determined simultaneously with the grain yield. In addition, fifty genotypes were evaluated under contrasting water regimes. In this study, based on the GGE and GYT approach, genotypes 37 and 45 performed the best under well-watered and water-deficit environments. Furthermore, the same genotypes were the best from the GSTI biplot view. In addition, Genotype 37 was the best from the GYT method, with physiological parameters and spectral reflectance indices. Therefore, we could identify genotype 37 as low-water-tolerant based on GSTI, GYT, and SRI results and recommend involving it in the drought breeding program.
Supplementary Materials
The following supporting information can be downloaded at: https://www.mdpi.com/article/10.3390/agriculture13071338/s1, Figure S1. The tester vector view of genotype by stress tolerance indices (GSTI) biplot view of grain yield (Yp) estimated for well-watered sites and sites of limited-water (Ys) and stress tolerance indices viz TOL, Tolerance index; SSI, stress susceptibility index; MP, mean productivity; STI, stress tolerance index; GMP, geometric mean productivity; HM, harmonic mean; YI, yield index; YSI, yield stability index; RSI, relative stress index; of fifty genotypes in both seasons 2019/20 and 2020/21 (averaged seasons); Figure S2. diagram of correlation coefficient and grain yield in well-watered sites (Yp) and limited-water sites (Ys), averaged across 2019/20 and 2020/21 seasons, with stress tolerance/sensitive indices STI, i.e., TOL, Tolerance index; SSI, stress susceptibility index; MP, mean productivity; STI, stress tolerance index; GMP, geometric mean productivity; HM, harmonic mean; YI, yield index; YSI, yield stability index; RSI, relative stress index; Table S1. Genotype name, source, yield trail name, pedigree, and selection history of fifty elite selected genotypes evaluated under contrasting water regimes (well-watered and water-deficit treatments) in the 2019/20 and 2020/21 seasons; Table S2. The Environmental parameters at Sakha Agricultural Research Station during the two seasons 2019/20 and 2020/21; Table S3. Grain yield means of fifty genotypes evaluated under well-watered (Yp) and low-watered (Ys) sites in both seasons, and combined means over sites-years (four environments) (GYE), and drought tolerance/sensitive indices; Table S4. Genotypes’ rank based on grain yield under well-watered (Yp), low-watered (Ys) sites, and drought tolerance/susceptible indices in both seasons 2019/20 and 2020/21.
Author Contributions
Methodology, M.A.D., A.F.E., M.A.E.-M. and A.M.A.; software, A.M.S.E. and M.M.M.Y.; validation, E.A.A., M.A.E.-M. and N.Y.R.; formal analysis, A.I.S., M.M.M.Y., N.Y.R. and A.M.A.; investigation, M.A.D., M.M.M.Y. and E.A.A.; resources, A.F.E. and M.M.M.Y.; data curation, M.A.D., A.M.S.E., A.I.S., N.Y.R. and A.M.A.; writing—original draft, M.A.D. and A.M.S.E.; writing—review and editing, M.A.E.-M. and A.M.A.; visualization, A.F.E. and E.A.A. All authors have read and agreed to the published version of the manuscript.
Funding
This research received no external funding.
Institutional Review Board Statement
Not applicable.
Informed Consent Statement
Not applicable.
Data Availability Statement
The authors state that all data generated or analyzed during this study are included in this article. The full data used to support the findings of this study are available from the corresponding author upon request.
Acknowledgments
The authors would like to thank Wheat Research Department, Field Crops Research Institute, Agricultural Research Center, Giza, Egypt. “This publication has been supported by the RUDN University Scientific Projects Grant System, project No. <202724-2-000>”. The authors would like to extend their sincere appreciation to the National Authority of Remote Sensing and Space Science (NARSS), Cairo, Egypt.
Conflicts of Interest
The authors declare no conflict of interest.
References
- Mondal, S.; Sallam, A.; Sehgal, D.; Sukumaran, S.; Farhad, M.; Navaneetha Krishnan, J.; Kumar, U.; Biswal, A. Advances in Breeding for Abiotic Stress Tolerance in Wheat. In Genomic Designing for Abiotic Stress Resistant Cereal Crops; Springer International Publishing: Berlin/Heidelberg, Germany, 2021; pp. 71–103. [Google Scholar]
- Kang, Z.; Babar, M.A.; Khan, N.; Guo, J.; Khan, J.; Islam, S.; Shrestha, S.; Shahi, D. Comparative Metabolomic Profiling in the Roots and Leaves in Contrasting Genotypes Reveals Complex Mechanisms Involved in Post-Anthesis Drought Tolerance in Wheat. PLoS ONE 2019, 14, e0213502. [Google Scholar] [CrossRef] [PubMed]
- Li, Y.; Li, H.; Li, Y.; Zhang, S. Improving Water-Use Efficiency by Decreasing Stomatal Conductance and Transpiration Rate to Maintain Higher Ear Photosynthetic Rate in Drought-Resistant Wheat. Crop J. 2017, 5, 231–239. [Google Scholar] [CrossRef]
- Mu, Q.; Xu, J.; Yu, M.; Guo, Z.; Dong, M.; Cao, Y.; Zhang, S.; Sun, S.; Cai, H. Physiological Response of Winter Wheat (Triticum Aestivum L.) during Vegetative Growth to Gradual, Persistent and Intermittent Drought. Agric. Water Manag. 2022, 274, 107911. [Google Scholar] [CrossRef]
- Obata, T.; Witt, S.; Lisec, J.; Palacios-Rojas, N.; Florez-Sarasa, I.; Yousfi, S.; Araus, J.L.; Cairns, J.E.; Fernie, A.R. Metabolite Profiles of Maize Leaves in Drought, Heat, and Combined Stress Field Trials Reveal the Relationship between Metabolism and Grain Yield. Plant Physiol. 2015, 169, 2665–2683. [Google Scholar] [CrossRef]
- Farooq, M.; Hussain, M.; Siddique, K.H.M. Drought Stress in Wheat during Flowering and Grain-Filling Periods. Crit. Rev. Plant Sci. 2014, 33, 331–349. [Google Scholar] [CrossRef]
- Klem, K.; Záhora, J.; Zemek, F.; Trunda, P.; Tůma, I.; Novotná, K.; Hodaňová, P.; Rapantová, B.; Hanuš, J.; Vavříková, J.; et al. Interactive Effects of Water Deficit and Nitrogen Nutrition on Winter Wheat. Remote Sensing Methods for Their Detection. Agric. Water Manag. 2018, 210, 171–184. [Google Scholar] [CrossRef]
- Liu, Q.; Zhang, F.; Chen, J.; Li, Y. Water Stress Altered Photosynthesis-Vegetation Index Relationships for Winter Wheat. Agron. J. 2020, 112, 2944–2955. [Google Scholar] [CrossRef]
- Cui, Y.; Tian, Z.; Hu, J.; Shao, Y.; Liu, R.; Jiang, D.; Yuan, J.; Dai, T. Drought Priming during the Vegetative Stage Can Enhance Post-Anthesis Drought Tolerance by Improving Photosynthetic Capacity in Winter Wheat. Arid. Land Res. Manag. 2019, 33, 183–199. [Google Scholar] [CrossRef]
- Hatfield, J.L.; Gitelson, A.A.; Schepers, J.S.; Walthall, C.L. Application of Spectral Remote Sensing for Agronomic Decisions. Agron. J. 2008, 100, S-117–S-131. [Google Scholar] [CrossRef]
- Gizaw, S.A.; Godoy, J.G.V.; Garland-Campbell, K.; Carter, A.H. Using Spectral Reflectance Indices as Proxy Phenotypes for Genome-Wide Association Studies of Yield and Yield Stability in Pacific Northwest Winter Wheat. Crop. Sci. 2018, 58, 1232–1241. [Google Scholar] [CrossRef]
- Garriga, M.; Romero-Bravo, S.; Estrada, F.; Escobar, A.; Matus, I.A.; del Pozo, A.; Astudillo, C.A.; Lobos, G.A. Assessing Wheat Traits by Spectral Reflectance: Do We Really Need to Focus on Predicted Trait-Values or Directly Identify the Elite Genotypes Group? Front. Plant Sci. 2017, 8, 280. [Google Scholar] [CrossRef]
- Rouse, J.W., Jr.; Haas, R.H.; Deering, D.W.; Schell, J.A.; Harlan, J.C.; Haas, R.H.; Deering, D.W.; Schell, J.A.; Harlan, J.C. Monitoring the Vernal Advancement and Retrogradation (Green Wave Effect) of Natural Vegetation; Remote Sensing Center Texas A&M University: College Station, TX, USA, 1974. [Google Scholar]
- Sobejano-Paz, V.; Mikkelsen, T.N.; Baum, A.; Mo, X.; Liu, S.; Köppl, C.J.; Johnson, M.S.; Gulyas, L.; García, M. Hyperspectral and Thermal Sensing of Stomatal Conductance, Transpiration, and Photosynthesis for Soybean and Maize under Drought. Remote Sens. 2020, 12, 3182. [Google Scholar] [CrossRef]
- Damm, A.; Paul-Limoges, E.; Haghighi, E.; Simmer, C.; Morsdorf, F.; Schneider, F.D.; van der Tol, C.; Migliavacca, M.; Rascher, U. Remote Sensing of Plant-Water Relations: An Overview and Future Perspectives. J. Plant Physiol. 2018, 227, 3–19. [Google Scholar] [CrossRef] [PubMed]
- Li, J.; Schachtman, D.P.; Creech, C.F.; Wang, L.; Ge, Y.; Shi, Y. Evaluation of UAV-Derived Multimodal Remote Sensing Data for Biomass Prediction and Drought Tolerance Assessment in Bioenergy Sorghum. Crop J. 2022, 10, 1363–1375. [Google Scholar] [CrossRef]
- Gamon, J.A.; Surfus, J.S. Assessing Leaf Pigment Content and Activity with a Reflectometer. New Phytol. 1999, 143, 105–117. [Google Scholar] [CrossRef]
- Pu, R.; Gong, P.; Yu, Q. Comparative Analysis of EO-1 ALI and Hyperion, and Landsat ETM+ Data for Mapping Forest Crown Closure and Leaf Area Index. Sensors 2008, 8, 3744–3766. [Google Scholar] [CrossRef]
- Aguate, F.M.; Trachsel, S.; González Pérez, L.; Burgueño, J.; Crossa, J.; Balzarini, M.; Gouache, D.; Bogard, M.; de los Campos, G. Use of Hyperspectral Image Data Outperforms Vegetation Indices in Prediction of Maize Yield. Crop Sci. 2017, 57, 2517–2524. [Google Scholar] [CrossRef]
- Thorp, K.R.; Gore, M.A.; Andrade-Sanchez, P.; Carmo-Silva, A.E.; Welch, S.M.; White, J.W.; French, A.N. Proximal Hyperspectral Sensing and Data Analysis Approaches for Field-Based Plant Phenomics. Comput. Electron. Agric. 2015, 118, 225–236. [Google Scholar] [CrossRef]
- Sedhom, S.A.; El-Badawy, M.E.M.; Hosary, A.A.A.E.; Abd El-Latif, M.S.; Rady, A.M.S.; Moustafa, M.M.A.; Mohamed, S.A.; Badr, O.A.M.; Abo-Marzoka, S.A.; Baiumy, K.A.; et al. Molecular Markers and GGE Biplot Analysis for Selecting Higher-Yield and Drought-Tolerant Maize Hybrids. Agron. J. 2021, 113, 3871–3885. [Google Scholar] [CrossRef]
- Hinojosa, L.; Kumar, N.; Gill, K.S.; Murphy, K.M.; Crop, D. Spectral Reflectance Indices and Physiological Parameters in Quinoa under Contrasting Irrigation Regimes. Crop Sci. 2019, 59, 1927–1944. [Google Scholar] [CrossRef]
- Dawood, M.F.A.; Abeed, A.H.A.; Aldaby, E.E.S. Titanium Dioxide Nanoparticles Model Growth Kinetic Traits of Some Wheat Cultivars under Different Water Regimes. Plant Physiol. Rep. 2019, 24, 129–140. [Google Scholar] [CrossRef]
- Wijewardana, C.; Alsajri, F.A.; Irby, J.T.; Krutz, L.J.; Golden, B.; Henry, W.B.; Gao, W.; Reddy, K.R. Physiological Assessment of Water Deficit in Soybean Using Midday Leaf Water Potential and Spectral Features. J. Plant Interact. 2019, 14, 533–543. [Google Scholar] [CrossRef]
- Crusiol, L.G.T.; Nanni, M.R.; Furlanetto, R.H.; Sibaldelli, R.N.R.; Sun, L.; Gonçalves, S.L.; Foloni, J.S.S.; Mertz-Henning, L.M.; Nepomuceno, A.L.; Neumaier, N.; et al. Assessing the Sensitive Spectral Bands for Soybean Water Status Monitoring and Soil Moisture Prediction Using Leaf-Based Hyperspectral Reflectance. Agric. Water Manag. 2023, 277, 108089. [Google Scholar] [CrossRef]
- Crain, J.; Reynolds, M.; Poland, J. Utilizing High-Throughput Phenotypic Data for Improved Phenotypic Selection of Stress-Adaptive Traits in Wheat. Crop Sci. 2017, 57, 648–659. [Google Scholar] [CrossRef]
- Yousfi, S.; Kellas, N.; Saidi, L.; Benlakehal, Z.; Chaou, L.; Siad, D.; Herda, F.; Karrou, M.; Vergara, O.; Gracia, A.; et al. Comparative Performance of Remote Sensing Methods in Assessing Wheat Performance under Mediterranean Conditions. Agric. Water Manag. 2016, 164, 137–147. [Google Scholar] [CrossRef]
- Khadka, K.; Earl, H.J.; Raizada, M.N.; Navabi, A. A Physio-Morphological Trait-Based Approach for Breeding Drought Tolerant Wheat. Front. Plant Sci. 2020, 11, 715. [Google Scholar] [CrossRef]
- Negisho, K.; Shibru, S.; Matros, A.; Pillen, K.; Ordon, F.; Wehner, G. Association Mapping of Drought Tolerance Indices in Ethiopian Durum Wheat (Triticum Turgidum ssp. Durum). Front. Plant Sci. 2022, 13, 838088. [Google Scholar] [CrossRef]
- Sabouri, A.; Dadras, A.R.; Azari, M.; Saberi Kouchesfahani, A.; Taslimi, M.; Jalalifar, R. Screening of Rice Drought-Tolerant Lines by Introducing a New Composite Selection Index and Competitive with Multivariate Methods. Sci. Rep. 2022, 12, 2163. [Google Scholar] [CrossRef]
- Elfanah, A.M.S.; Darwish, M.A.; Selim, A.E.; Shabana, M.M.A.; Elmoselhy, O.M.A.; Khedr, R.A.; Ali, A.M.; Abdelhamid, M.T. Spectral Reflectance Indices’ Performance to Identify Seawater Salinity Tolerance in Bread Wheat Genotypes Using Genotype by Yield*Trait Biplot Approach. Agronomy 2023, 13, 353. [Google Scholar] [CrossRef]
- Pour-Aboughadareh, A.; Yousefian, M.; Moradkhani, H.; Moghaddam Vahed, M.; Poczai, P.; Siddique, K.H.M. IPASTIC: An Online Toolkit to Estimate Plant Abiotic Stress Indices. Appl. Plant Sci. 2019, 7, e11278. [Google Scholar] [CrossRef]
- Rosielle, A.A.; Hamblin, J. Theoretical Aspects of Selection for Yield in Stress and Non-Stress Environment1. Crop Sci. 1981, 21, 943–946. [Google Scholar] [CrossRef]
- Fernadez, G. Effective Selection Criteria for Assessing Plant Stress Tolerance. In Proceedings of the Effective Selection Criteria for Assessing Plant Stress Tolerance, Shanhua, Taiwan, 13–16 August 1992; pp. 257–270. [Google Scholar]
- Bidinger, F.R.; Mahalakshmi, V.; Rao, G.D.P. Assessment of Drought Resistance in Pearl Millet (Pennisetum Americanum L. Leeke). II. Estimation of Genotype Response to Stress. Aust. J. Agric. Res. 1987, 38, 49–59. [Google Scholar] [CrossRef]
- Fischer, R.A.; Maurer, R. Drought Resistance in Spring Wheat Cultivars. I. Grain Yield Responses. Aust. J. Agric. Res. 1978, 29, 897–912. [Google Scholar] [CrossRef]
- Gavuzzi, P.; Rizza, F.; Palumbo, M.; Campanile, R.G.; Ricciardi, G.L.; Borghi, B. Evaluation of Field and Laboratory Predictors of Drought and Heat Tolerance in Winter Cereals. Can. J. Plant Sci. 2011, 77, 523–531. [Google Scholar] [CrossRef]
- Bouslama, M.; Schapaugh, W.T. Stress Tolerance in Soybeans. I. Evaluation of Three Screening Techniques for Heat and Drought Tolerance1. Crop Sci. 1984, 24, 933–937. [Google Scholar] [CrossRef]
- Fischer, R.A.; Wood, J.T. Drought Resistance in Spring Wheat Cultivars. III.* Yield Associations with Morpho-Physiological Traits. Aust. J. Agric. Res. 1979, 30, 1001–1020. [Google Scholar] [CrossRef]
- Cabello, R.; Monneveux, P.; de Mendiburu, F.; Bonierbale, M. Comparison of Yield Based Drought Tolerance Indices in Improved Varieties, Genetic Stocks and Landraces of Potato (Solanum Tuberosum L.). Euphytica 2013, 193, 147–156. [Google Scholar] [CrossRef]
- Singh, C.; Kumar, V.; Prasad, I.; Patil, V.R.; Rajkumar, B.K. Response of Upland Cotton (G. Hirsutum L.) Genotypes to Drought Stress Using Drought Tolerance Indices. J. Crop Sci. Biotechnol. 2016, 19, 53–59. [Google Scholar] [CrossRef]
- Sardouie-Nasab, S.; Nejad, M.G.; Nakhoda, B. Field Screening of Salinity Tolerance in Iranian Bread Wheat Lines. Crop Sci. 2014, 54, 1489–1496. [Google Scholar] [CrossRef]
- Bakhshi, B.; Shahmoradi, S.S. Simultaneous Selection of High-Yielding and Drought-Tolerant Barley Landraces Using GT, GYT and GYSI Methodologies. Cereal Res. Commun. 2022, 51, 237–248. [Google Scholar] [CrossRef]
- Yan, W.; Frégeau-Reid, J. Genotype by Yield*Trait (GYT) Biplot: A Novel Approach for Genotype Selection Based on Multiple Traits. Sci. Rep. 2018, 8, 8242. [Google Scholar] [CrossRef]
- Yan, W.; Frégeau-Reid, J. Breeding Line Selection Based on Multiple Traits. Crop Sci. 2008, 48, 417–423. [Google Scholar] [CrossRef]
- Mohammadi, R. Genotype by Yield*trait Biplot for Genotype Evaluation and Trait Profiles in Durum Wheat. Cereal Res. Commun. 2019, 47, 541–551. [Google Scholar] [CrossRef]
- Msundi, E.A.; Owuoche, J.O.; Oyoo, M.E.; Macharia, G.; Singh, R.P.; Randhawa, M.S. Identification of Bread Wheat Genotypes with Superior Grain Yield and Agronomic Traits through Evaluation under Rust Epiphytotic Conditions in Kenya. Sci. Rep. 2021, 11, 21415. [Google Scholar] [CrossRef] [PubMed]
- Kendal, E. Evaluation of Some Barley Genotypes with Geotype by Yield* Trait (Gyt) Biplot Method. Agric. For. 2020, 66, 137–150. [Google Scholar] [CrossRef]
- Sofi, P.A.; Saba, I.; Ara, A.; Rehman, K. Comparative Efficiency of GY*T Approach Over GT Approach in Genotypic Selection in Multiple Trait Evaluations: Case Study of Common Bean (Phaseolus Vulgaris) Grown Under Temperate Himalayan Conditions. Agric. Res. 2022, 11, 373–381. [Google Scholar] [CrossRef]
- Santana, D.C.; Flores, M.d.S.; Cotrim, M.F.; Rodrigues, E.V.; Santos, A.d.; Teodoro, L.P.R.; Baio, F.H.R.; da Silva Junior, C.A.; Teodoro, P.E. Genotype × Trait Biplot and Canonical Correlations for Spectral and Agronomic Traits in Corn. Agron. J. 2021, 113, 1197–1204. [Google Scholar] [CrossRef]
- Cossani, C.M.; Reynolds, M.P. Heat Stress Adaptation in Elite Lines Derived from Synthetic Hexaploid Wheat. Crop Sci. 2015, 55, 2719–2735. [Google Scholar] [CrossRef]
- Zarco-Tejada, P.J.; Pushnik, J.C.; Dobrowski, S.; Ustin, S.L. Steady-State Chlorophyll a Fluorescence Detection from Canopy Derivative Reflectance and Double-Peak Red-Edge Effects. Remote Sens. Environ. 2003, 84, 283–294. [Google Scholar] [CrossRef]
- Yan, W.; Hunt, L.A.; Sheng, Q.; Szlavnics, Z. Cultivar Evaluation and Mega-Environment Investigation Based on the GGE Biplot. Crop Sci. 2000, 40, 597–605. [Google Scholar] [CrossRef]
- Yan, W.; Kang, M.S.; Ma, B.; Woods, S.; Cornelius, P.L. GGE Biplot vs. AMMI Analysis of Genotype-by-Environment Data. Crop Sci. 2007, 47, 643–655. [Google Scholar] [CrossRef]
- Zulfiqar, S.; Ishfaq, S.; Ikram, M.; Nawaz, M.A.; Rahman, M.U. Characterization of Gamma-Rays-Induced Spring Wheat Mutants for Morphological and Quality Traits through Multivariate and Gt Bi-Plot Analysis. Agronomy 2021, 11, 2288. [Google Scholar] [CrossRef]
- Darwish, M.A.; Abd El-Rady, A.G.; Mohamed, M.; Ghalab, E.; Elfanah, A.M. Estimation of AMMI and GGE Biplots for Some Bread and Durum Wheat Genotypes. J. Plant Prod. 2022, 13, 75–83. [Google Scholar] [CrossRef]
- Enyew, M.; Feyissa, T.; Geleta, M.; Tesfaye, K.; Hammenhag, C.; Carlsson, A.S. Genotype by Environment Interaction, Correlation, AMMI, GGE Biplot and Cluster Analysis for Grain Yield and Other Agronomic Traits in Sorghum (Sorghum Bicolor L. Moench). PLoS ONE 2021, 16, e0258211. [Google Scholar] [CrossRef] [PubMed]
- El-Hendawy, S.; Al-suhaibani, N.; Mubushar, M.; Tahir, M.U.; Marey, S.; Refay, Y.; Tola, E. Combining Hyperspectral Reflectance and Multivariate Regression Models to Estimate Plant Biomass of Advanced Spring Wheat Lines in Diverse Phenological Stages under Salinity Conditions. Appl. Sci. 2022, 12, 1983. [Google Scholar] [CrossRef]
- El-Hendawy, S.; Al-Suhaibani, N.; Elsayed, S.; Alotaibi, M.; Hassan, W.; Schmidhalter, U. Performance of Optimized Hyperspectral Reflectance Indices and Partial Least Squares Regression for Estimating the Chlorophyll Fluorescence and Grain Yield of Wheat Grown in Simulated Saline Field Conditions. Plant Physiol. Biochem. 2019, 144, 300–311. [Google Scholar] [CrossRef] [PubMed]
- Prasad, B.; Carver, B.F.; Stone, M.L.; Babar, M.A.; Raun, W.R.; Klatt, A.R. Genetic Analysis of Indirect Selection for Winter Wheat Grain Yield Using Spectral Reflectance Indices. Crop Sci. 2007, 47, 1416–1425. [Google Scholar] [CrossRef]
- Sun, H.; Feng, M.; Xiao, L.; Id, W.Y.; Wang, C.; Jia, X.; Zhao, Y.; Zhao, C.; Muhammad, S.K.; Li, D. Assessment of Plant Water Status in Winter Wheat (Triticum Aestivum L.) Based on Canopy Spectral Indices. PLoS ONE 2019, 10, e0216890. [Google Scholar] [CrossRef]
- Li, Y.; Tao, F.; Hao, Y.; Tong, J.; Xiao, Y.; He, Z.; Reynolds, M. Variations in Phenological, Physiological, Plant Architectural and Yield-Related Traits, Their Associations with Grain Yield and Genetic Basis. Ann. Bot. 2023, 131, 503–519. [Google Scholar] [CrossRef]
- Temirbekova, S.K.; Kulikov, I.M.; Afanasyeva, Y.V.; Beloshapkina, O.O.; Kalashnikova, E.A.; Kirakosyan, R.N.; Dokukin, P.A.; Kucher, D.E.; Latati, M.; Rebouh, N.Y. The Evaluation of Winter Wheat Adaptation to Climate Change in the Central Non-Black Region of Russia: Study of the Gene Pool Resistance of Wheat from the N.I. Vavilov Institute of Plant Industry (VIR) World Collection to Abiotic Stress Factors. Plants 2021, 10, 2337. [Google Scholar] [CrossRef]
- Zargar, M.; Rebouh, N.Y.; Pakina, E.; Gadzhikurbanov, A.; Lyashko, M.; Ortskhanov, B. Impact of climate change on cereal production in the highlands of eastern Algeria. Res. Crops 2017, 18, 575–582. [Google Scholar] [CrossRef]
- Mohan, A.; Grant, N.P.; Schillinger, W.F.; Gill, K.S. Characterizing Reduced Height Wheat Mutants for Traits Affecting Abiotic Stress and Photosynthesis during Seedling Growth. Physiol. Plant. 2021, 172, 233–246. [Google Scholar] [CrossRef]
- Yang, Y.; Li, N.; Wu, Y.; Liu, B.; Li, S.; Tao, L.; Zhan, Y.; Yang, Y.; Ni, X. Key Phenotypes Related to Wheat Grain Yield in a Two-Site Multicultivar Test. Agron. J. 2022, 114, 2874–2885. [Google Scholar] [CrossRef]
- Lotfi, R.; Abbasi, A.; Kalaji, H.M.; Eskandari, I.; Sedghieh, V.; Khorsandi, H.; Sadeghian, N.; Yadav, S.; Rastogi, A. The Role of Potassium on Drought Resistance of Winter Wheat Cultivars under Cold Dryland Conditions: Probed by Chlorophyll a Fluorescence. Plant Physiol. Biochem. 2022, 182, 45–54. [Google Scholar] [CrossRef] [PubMed]
- Yang, M.d.; Leghari, S.J.; Guan, X.K.; Ma, S.C.; Ding, C.M.; Mei, F.J.; Wei, L.; Wang, T.C. Deficit Subsurface Drip Irrigation Improves Water Use Efficiency and Stabilizes Yield by Enhancing Subsoil Water Extraction in Winter Wheat. Front. Plant Sci. 2020, 11, 508. [Google Scholar] [CrossRef]
- Ould Amer, S.; Aliat, T.; Kucher, D.E.; Bensaci, O.A.; Rebouh, N.Y. Investigating the Potential of Arbuscular Mycorrhizal Fungi in Mitigating Water Deficit Effects on Durum Wheat (Triticum durum Desf.). Agriculture 2023, 13, 552. [Google Scholar] [CrossRef]
- Ali, A.M.; Abouelghar, M.; Belal, A.A.; Saleh, N.; Yones, M.; Selim, A.I.; Amin, M.E.; Elwesemy, A.; Kucher, D.E.; Maginan, S.; et al. Crop Yield Prediction Using Multi Sensors Remote Sensing (Review Article). Egypt. J. Remote Sens. Space Sci. 2022, 25, 711–716. [Google Scholar] [CrossRef]
Disclaimer/Publisher’s Note: The statements, opinions and data contained in all publications are solely those of the individual author(s) and contributor(s) and not of MDPI and/or the editor(s). MDPI and/or the editor(s) disclaim responsibility for any injury to people or property resulting from any ideas, methods, instructions or products referred to in the content. |
© 2023 by the authors. Licensee MDPI, Basel, Switzerland. This article is an open access article distributed under the terms and conditions of the Creative Commons Attribution (CC BY) license (https://creativecommons.org/licenses/by/4.0/).