
A Comprehensive Analysis of Machine Learning-Based Assessment and Prediction of Soil Enzyme Activity

 , , , ,
  and
and 
Abstract
1. Introduction
- Predict the activity of soil enzymes based on chemical and physical soil parameters.
- Evaluate the optimal performance model by correlating all factors.
- Select and determine the optimal artificial approach algorithm for estimating enzyme activity.
- Compare the performance model-finding algorithm (PSEA-ML and PSEA–ANN).
2. Materials and Methods
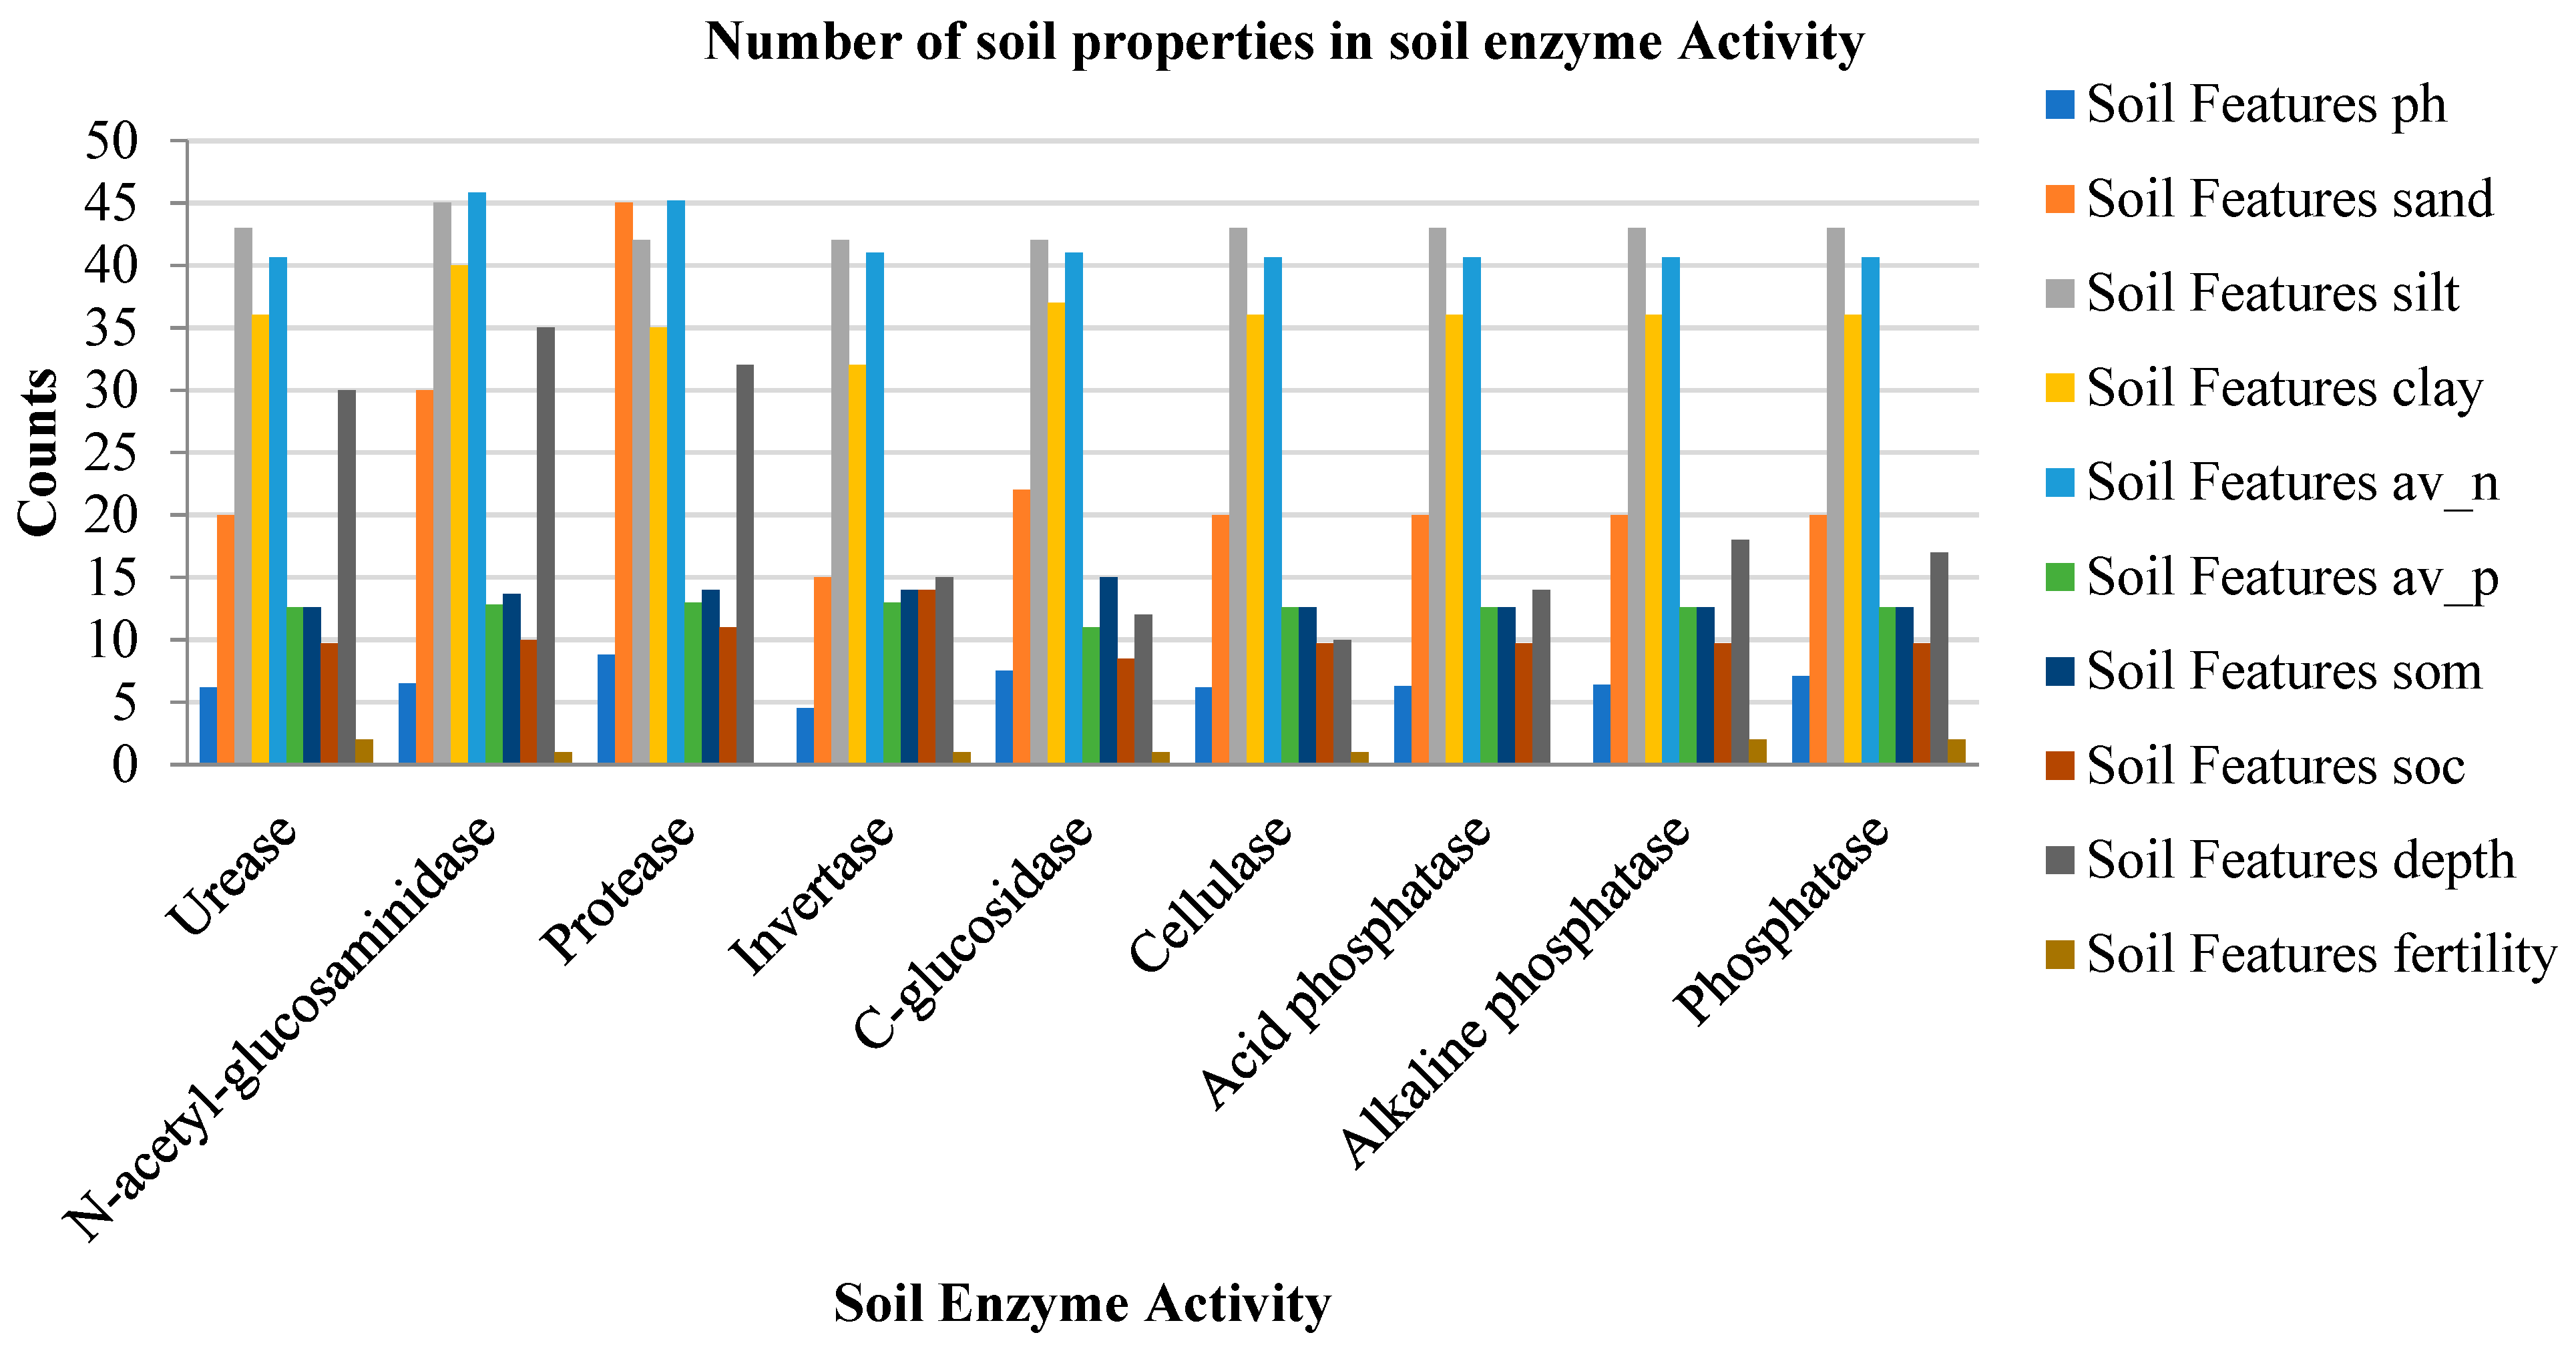
2.1. Soil Dataset
2.2. Pre-Processing of Soil Dataset
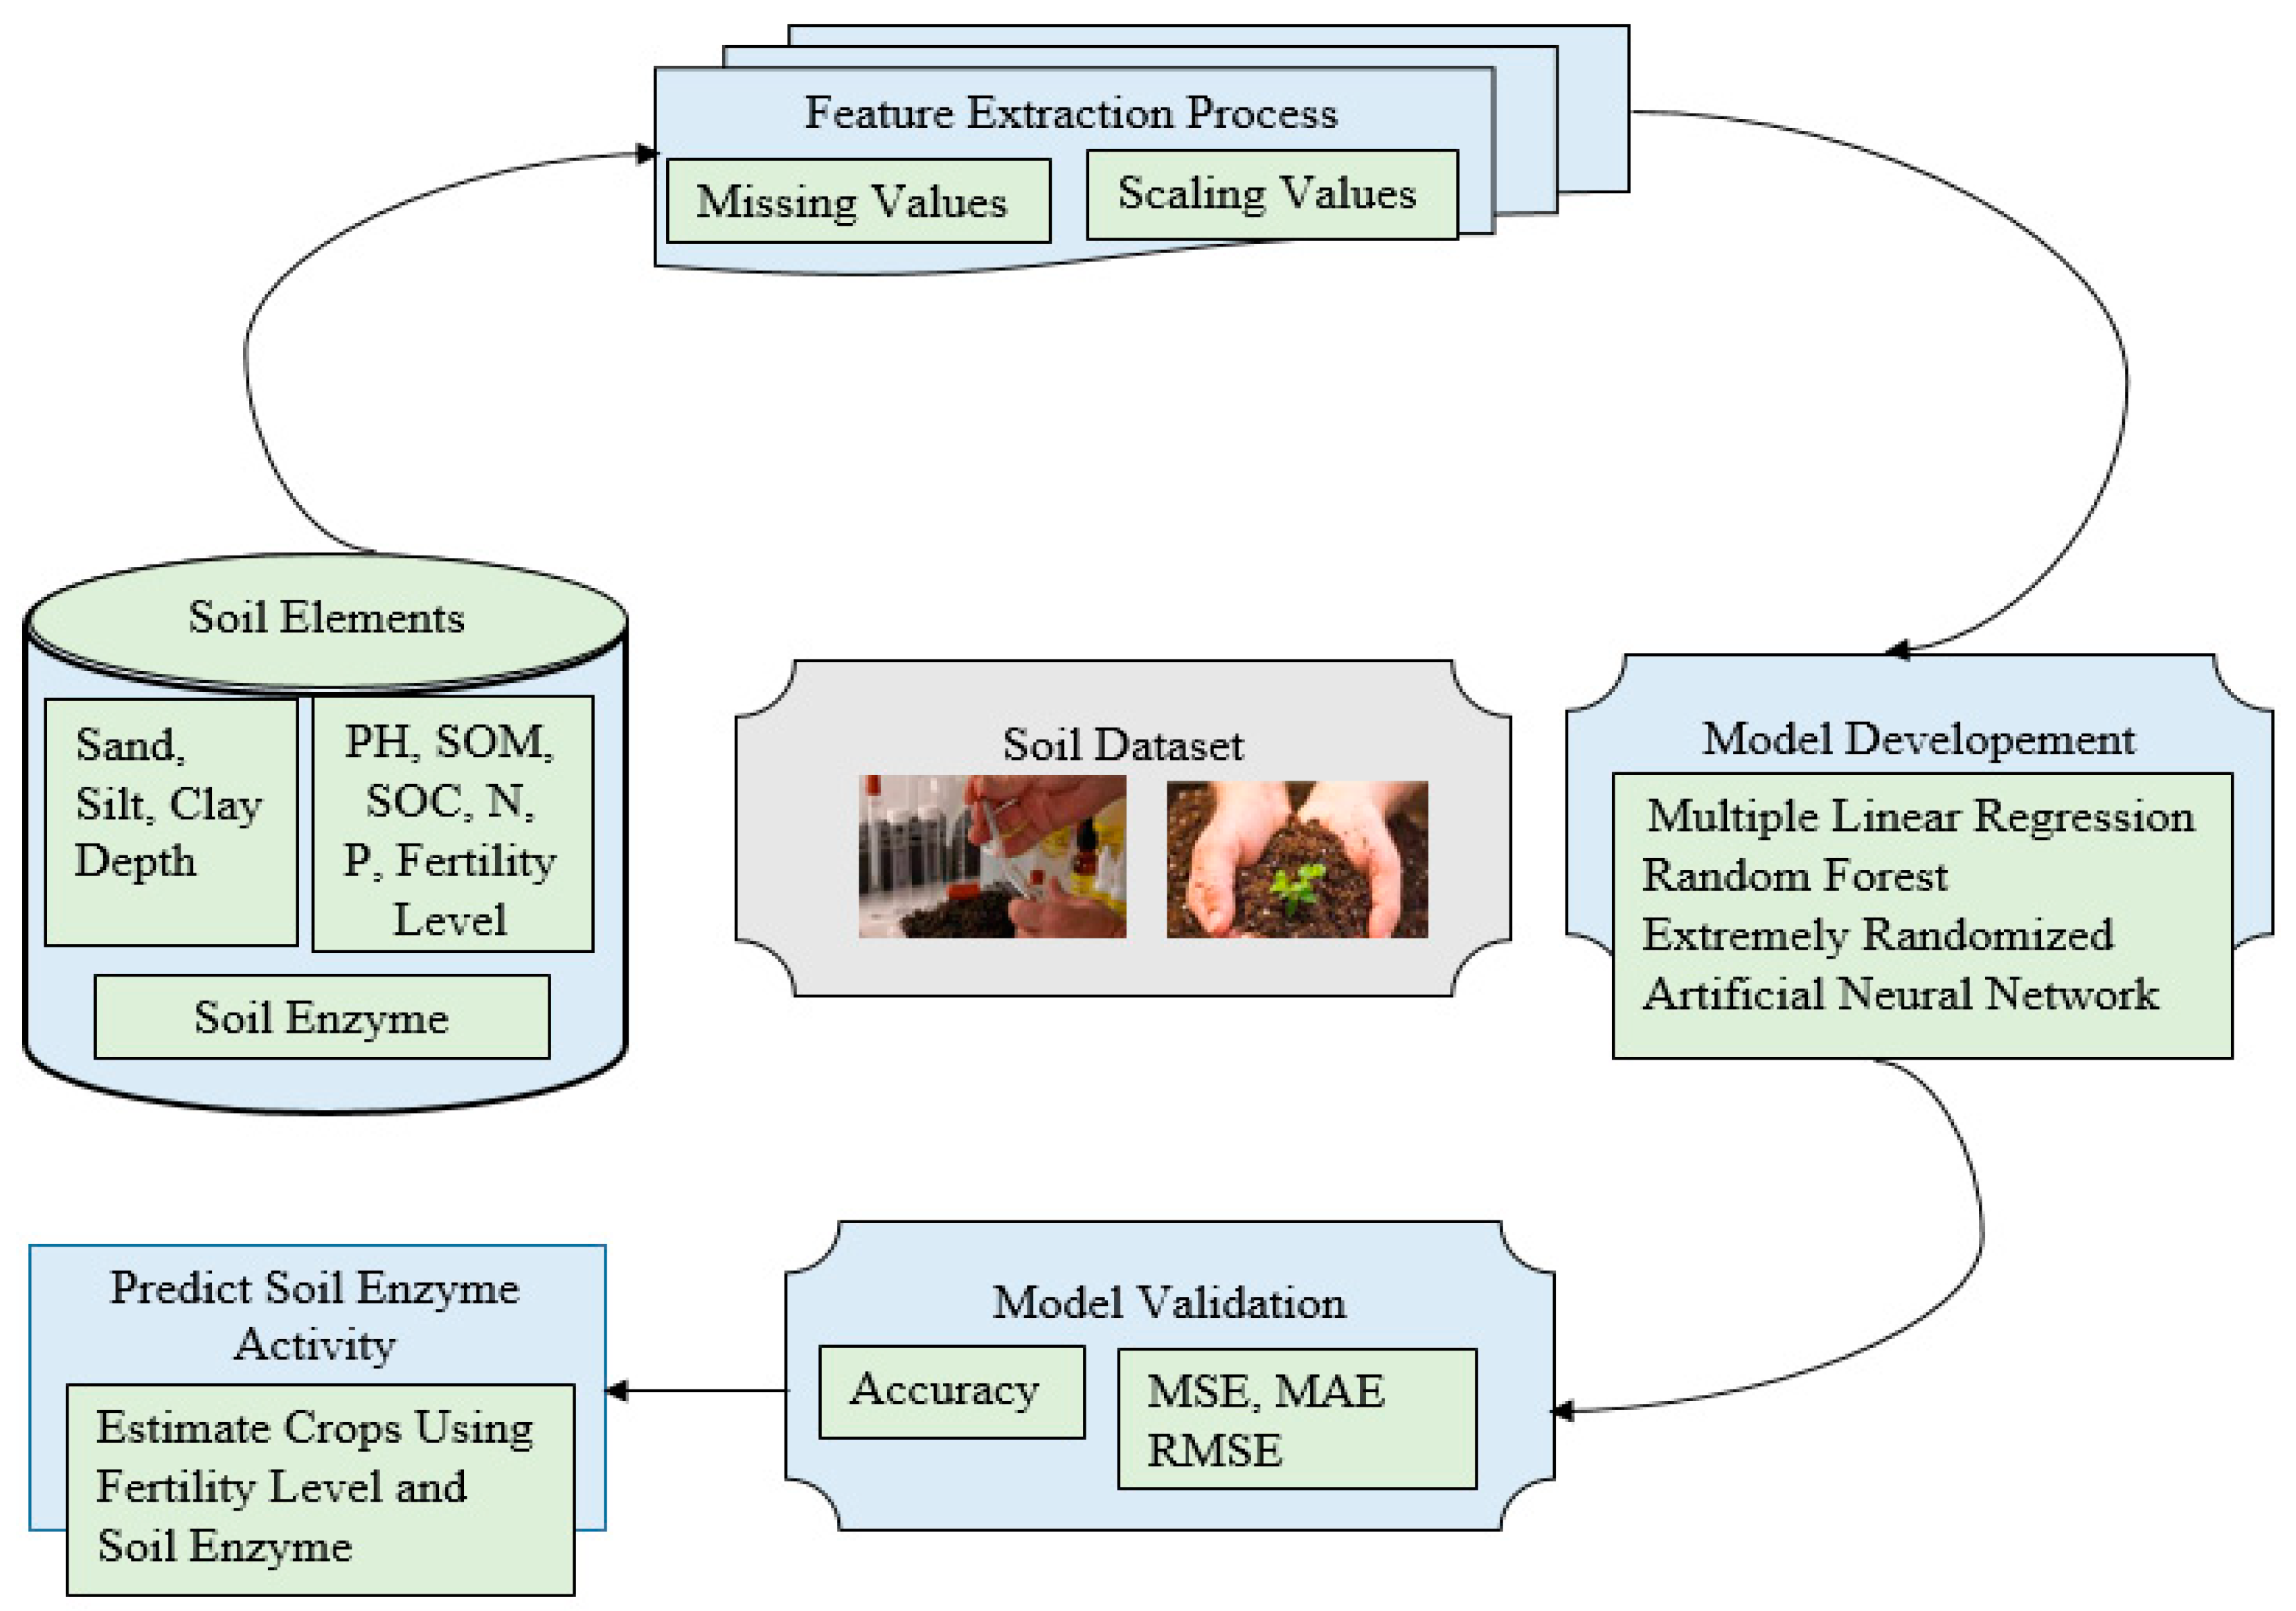
2.3. Proposed Methodology
2.3.1. Development of the ML Model
- A.
- Multiple linear regressions for soil enzyme activity
| Algorithm 1 PSEA–MLR-I (Predict the soil enzyme activity using Multiple Linear Regression) |
| Target: Optimal combination of response variables and enzyme activity in the soil Input: N = (PH, Sand, Silt, Clay, N, P, SOM, SOC, Fertility level, and Depth) Output: K = (Predict soil enzyme activity) |
| 1: Initialization of all N and K soil data parameters 2: Pre-processing of the soil dataset with N and K parameters 3: Randomly select 80% soil dataset for training and 20% soil dataset for testing purposes 4: Apply MLR-supervised ML algorithms on a given data set 5: Compute the Accuracy, MSE, RMSE, and MAE of the model 6: Predict soil enzyme activity 7: End |
- B.
- Random Forest for soil enzyme activity
| Algorithm 2 PSEA–RF-II (Predict soil enzyme activity using Random Forest algorithms) |
| Target: Optimal combination of response variables and enzyme activity in the soil Input: N = (PH, Sand, Silt, Clay, N, P, SOM, SOC, Fertility level, and Depth) Output: K = (Predict soil enzyme activity) |
| 1: Initialization of all N and K soil data parameters 2: Pre-processing of the soil dataset with N and K parameters 3: Randomly select 80% soil dataset for training and 20% soil dataset for testing purposes 4: Apply RF-supervised ML algorithms on a given data set 5: Compute the Accuracy, MSE, RMSE, and MAE of the Model 6: Predict soil enzyme activity 7: End |
- C.
- Extremely Randomized Trees Classifiers for soil enzyme activity
| Algorithm 3 PSEA–ERT-III (Predict soil enzyme activity using extremely randomized tree classifiers) |
| Target: Optimal combination of response variables and enzyme activity in the soil Input: N = (PH, Sand, Silt, Clay, N, P, SOM, SOC, Fertility level, and Depth) Output: K = (Predict soil enzyme activity) |
| 1: Initialization of all N and K soil parameters 2: Pre-processing of the soil dataset with N and K parameters 3: Randomly select 80% soil dataset for training and 20% soil dataset for testing purposes 4: Apply ERT-supervised ML algorithms on a given data set 5: Compute the Accuracy, MSE, RMSE, and MAE of the Model 6: Predict soil enzyme activity 7: End |
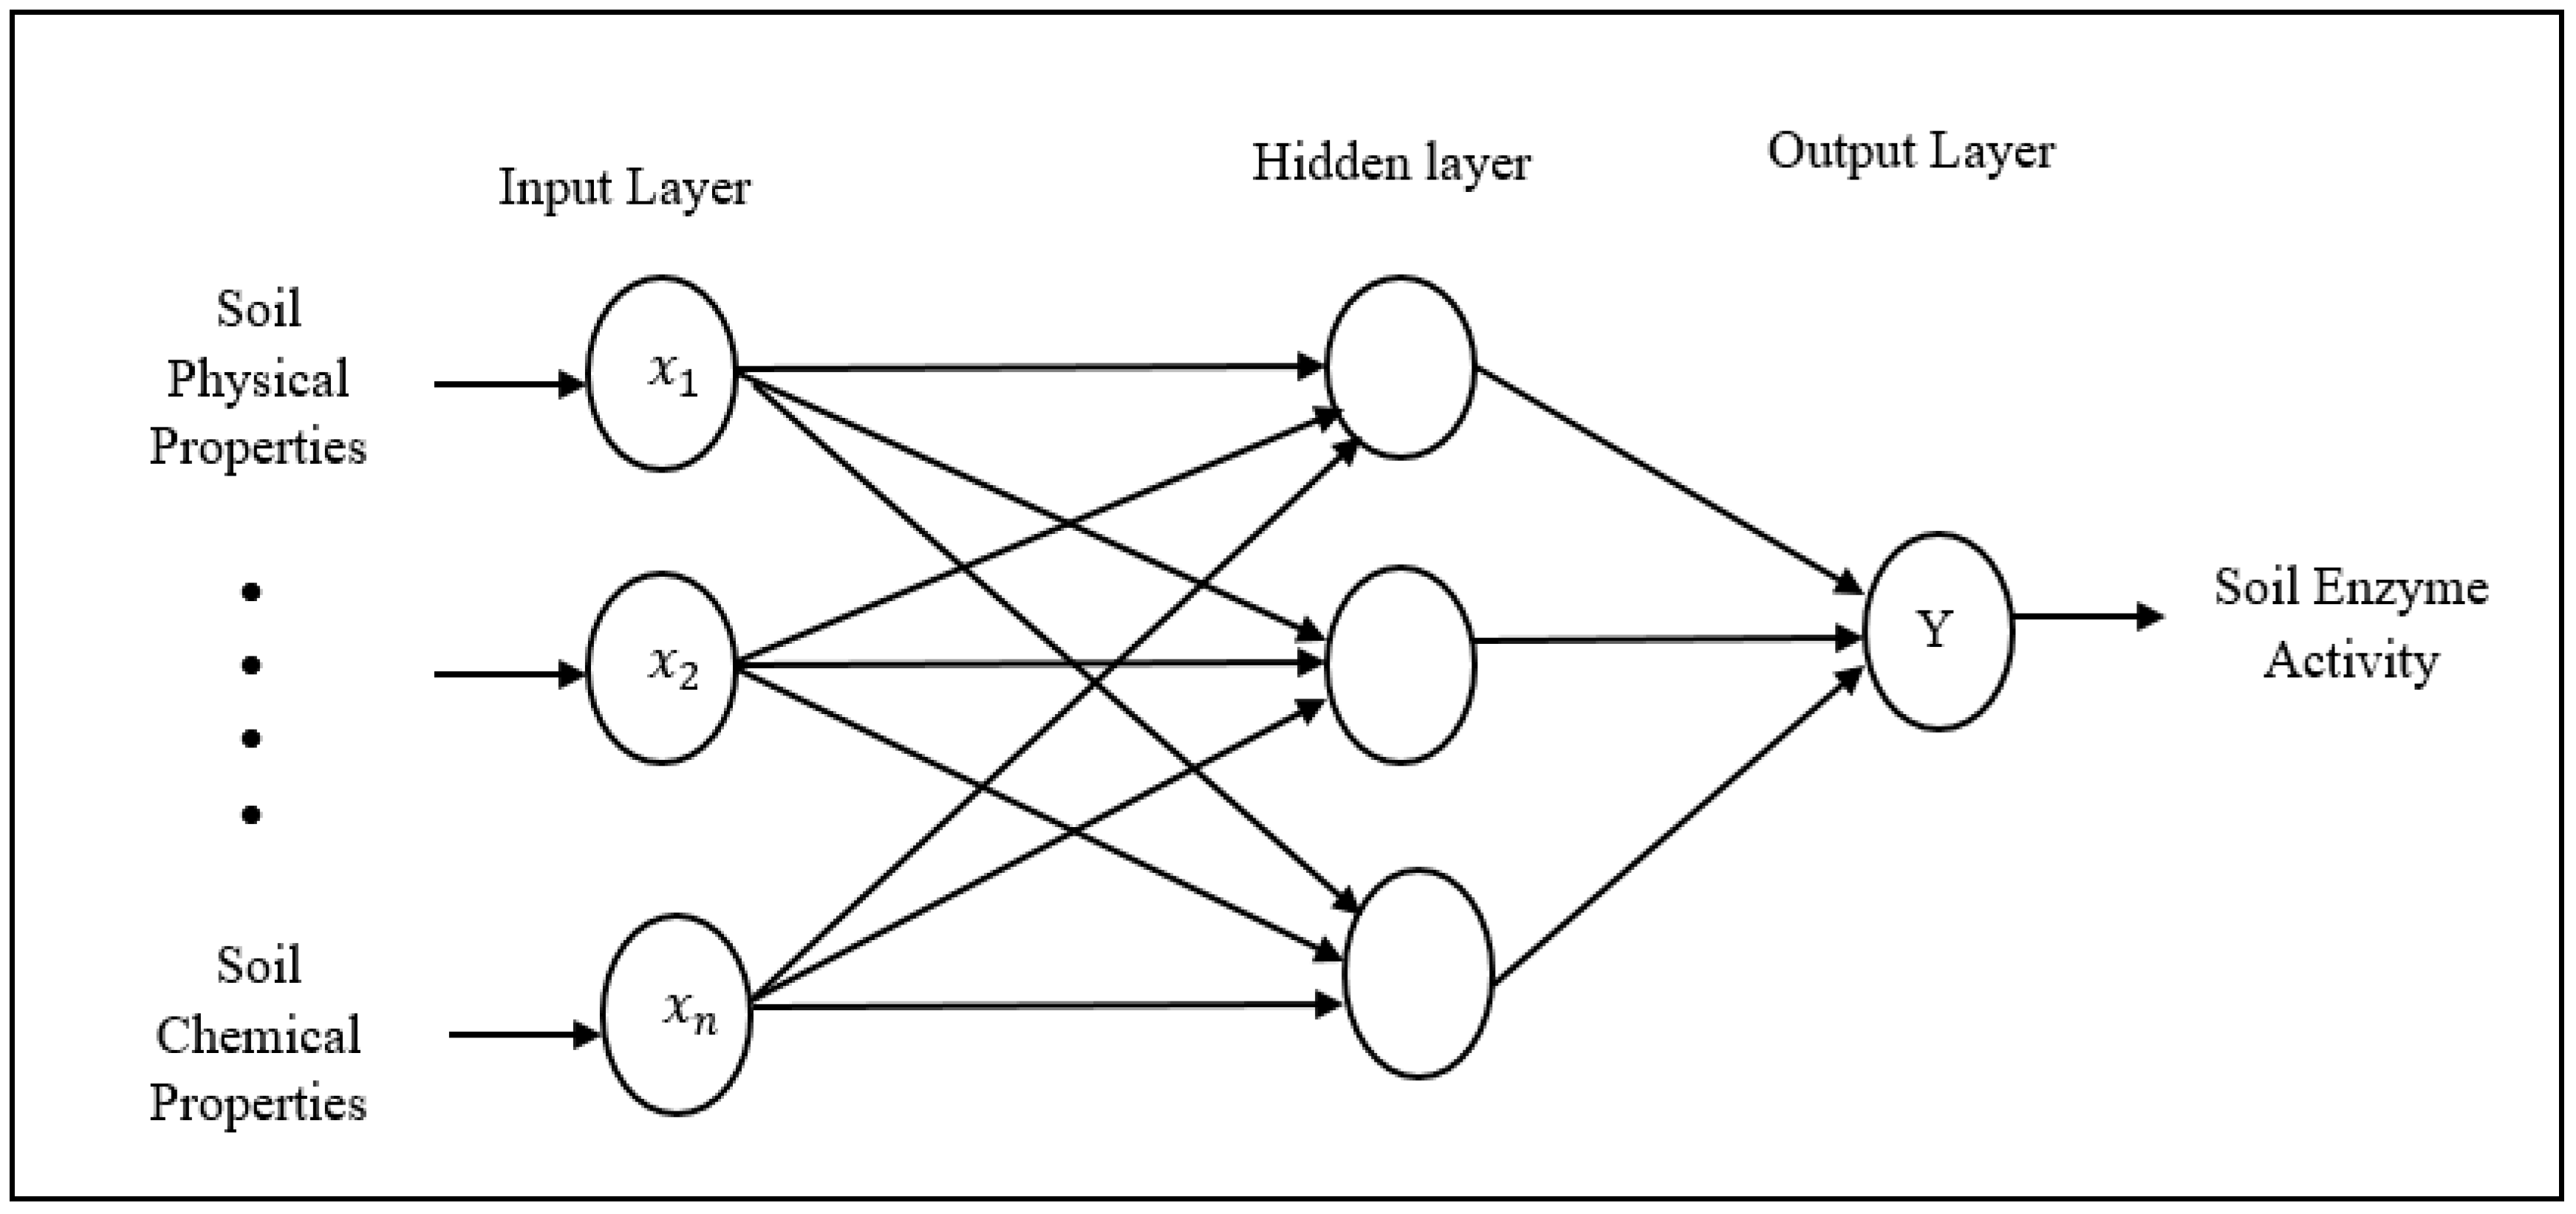
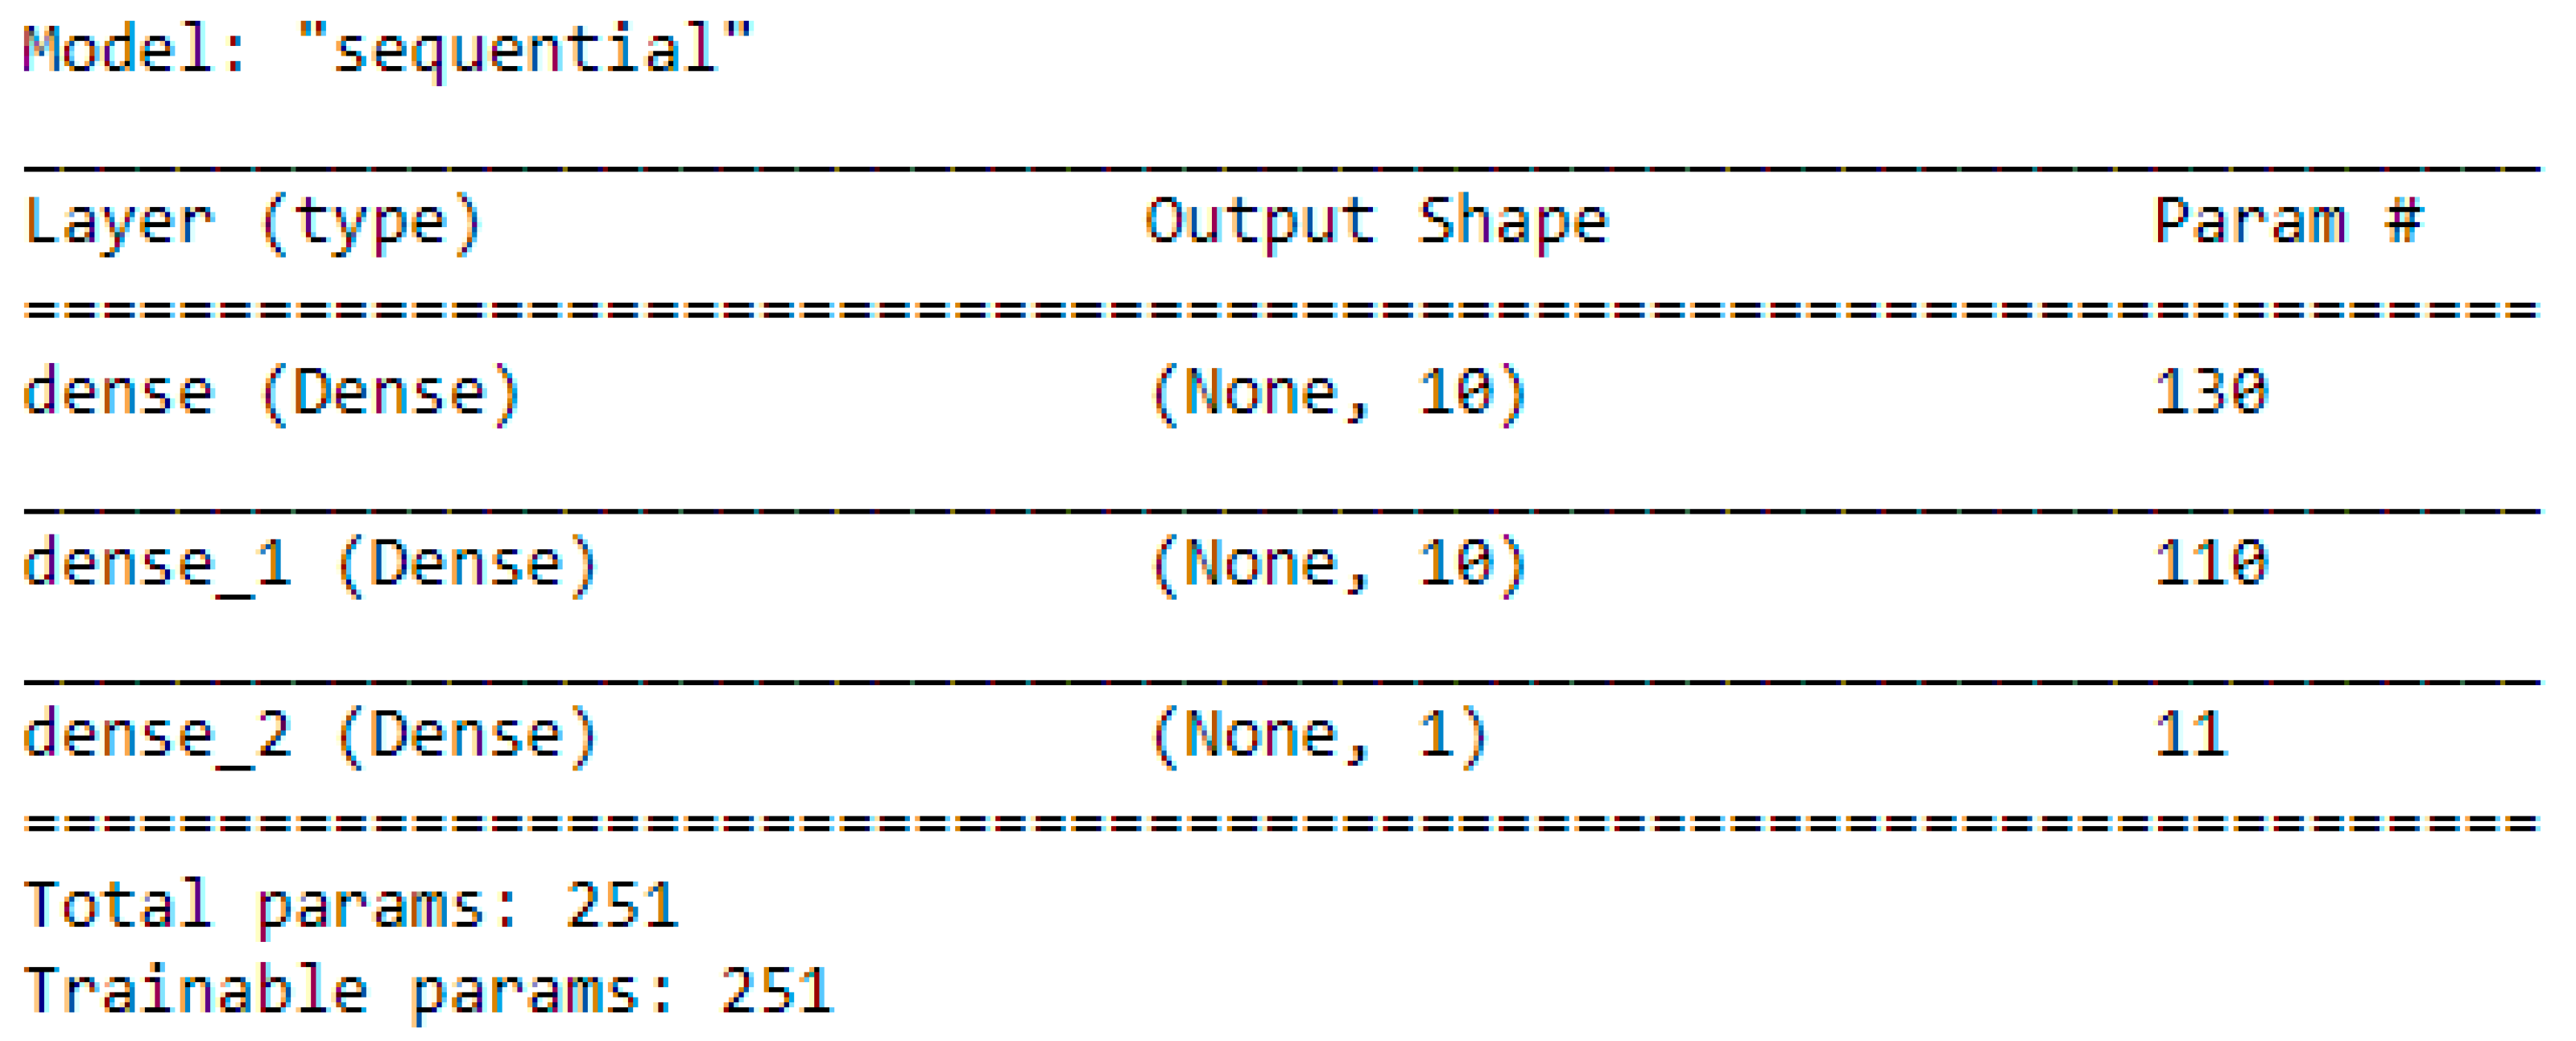
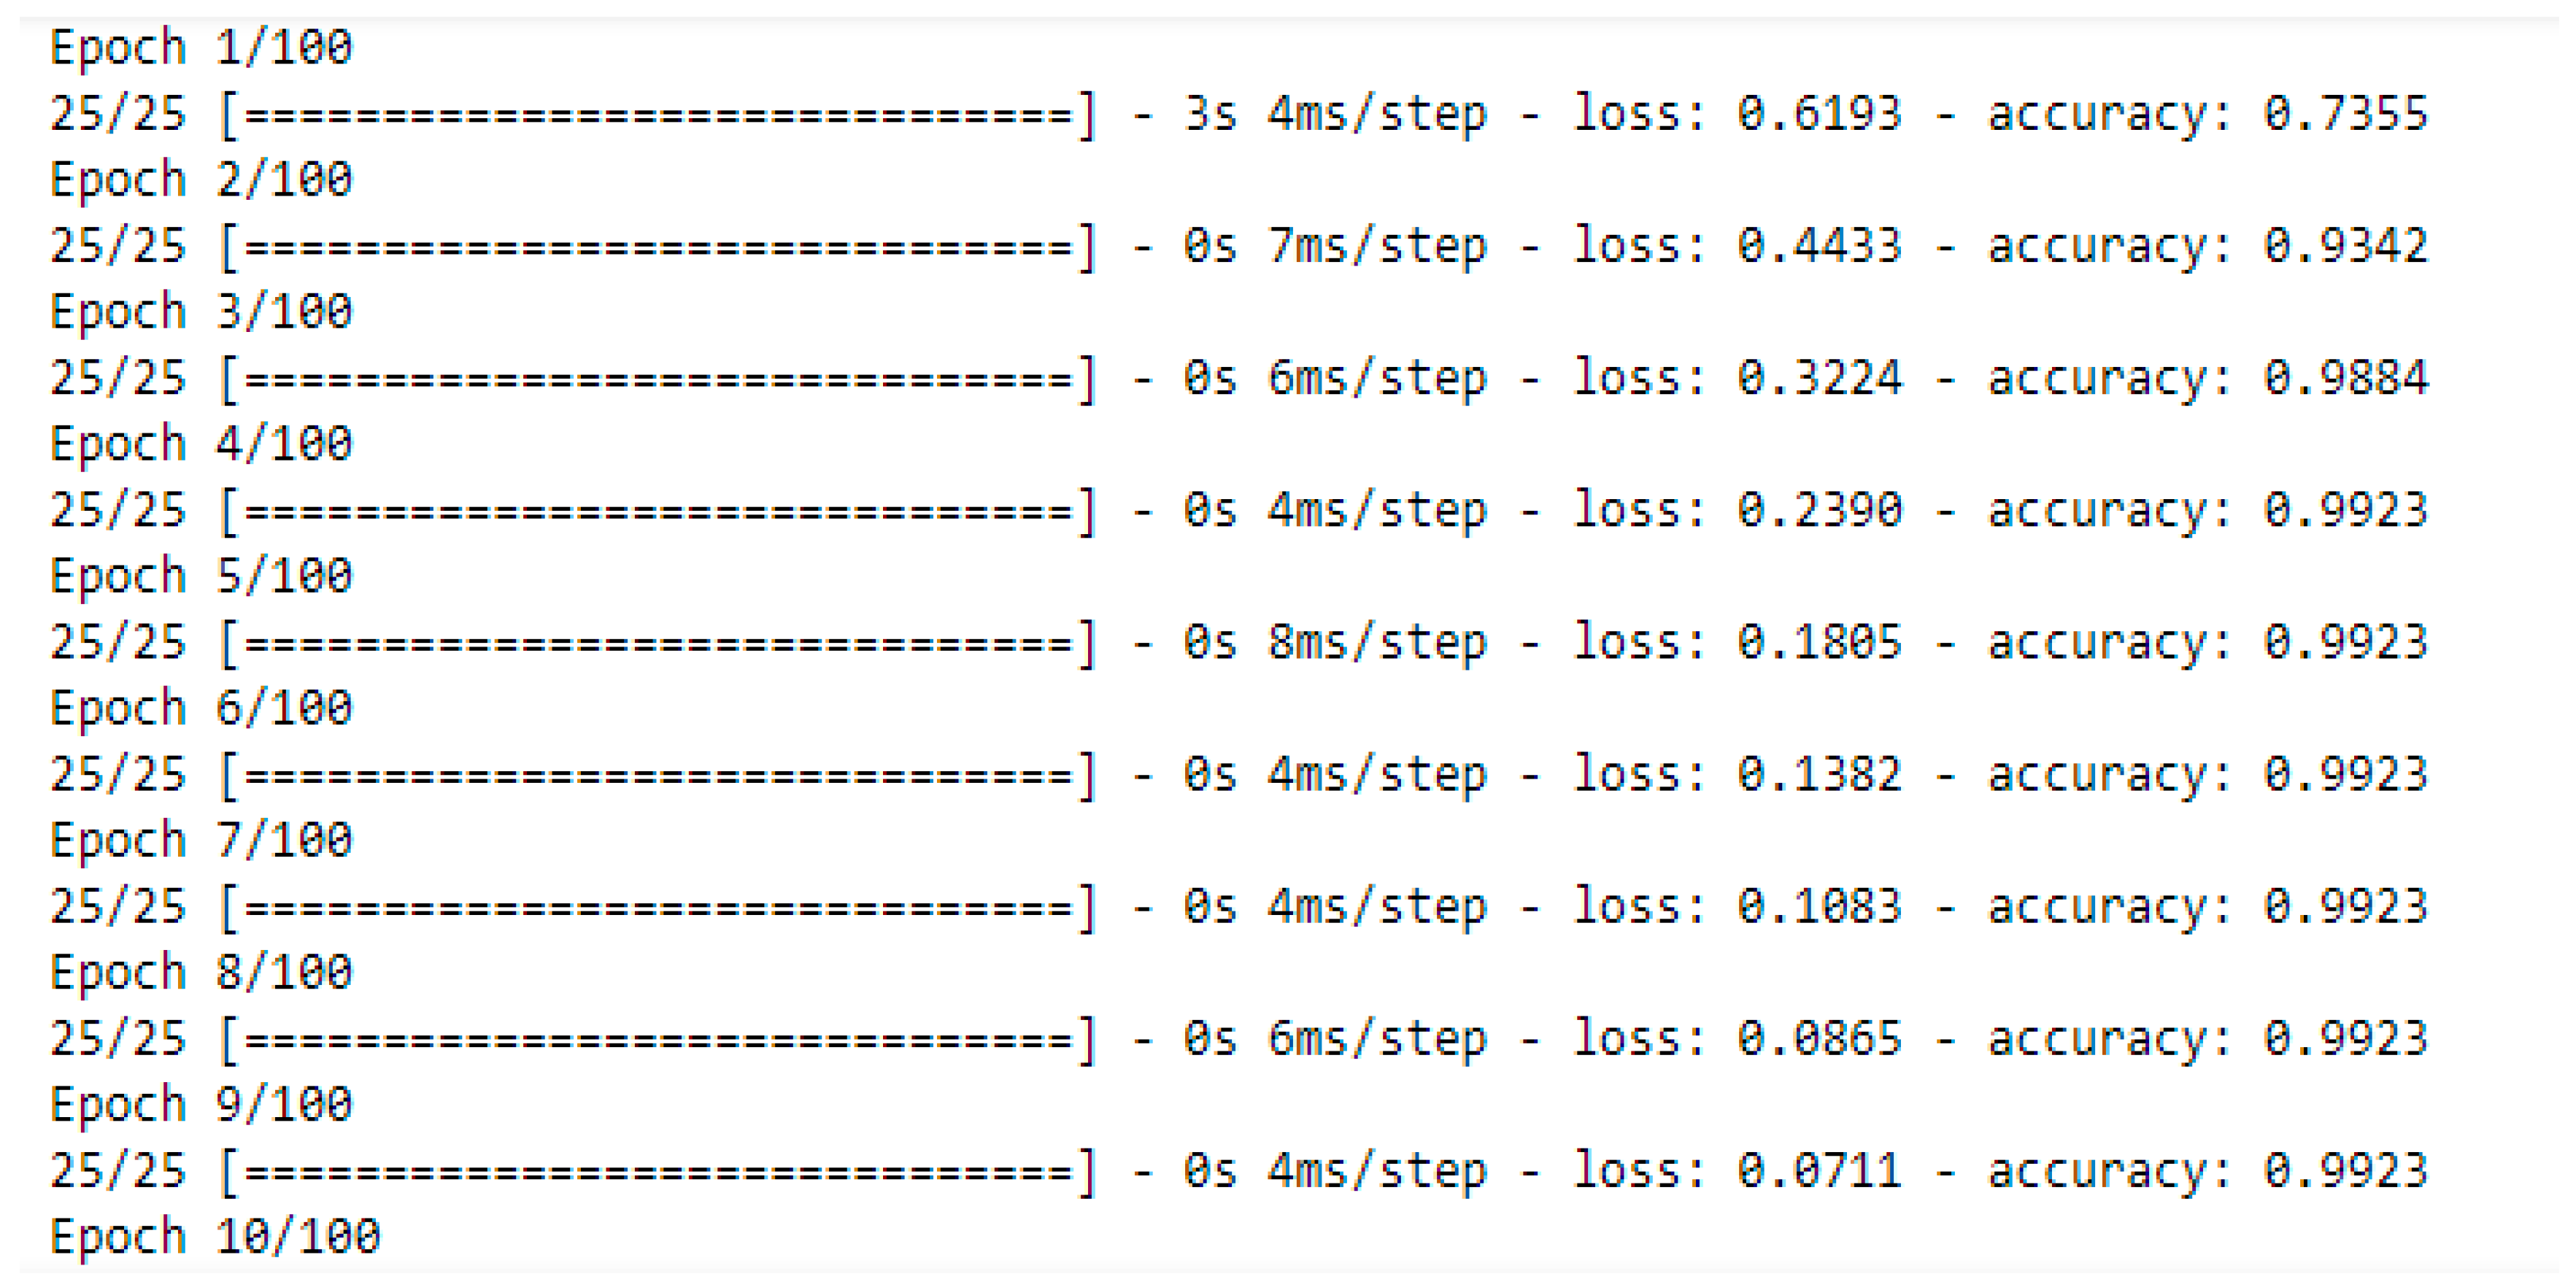
2.3.2. Artificial Neural Network for Soil Enzyme Activity
| Algorithm 4 PSEA–ANN-IV (Predict soil enzyme activity using ANN) |
| Target: Optimal combination of response variables and enzyme activity in the soil Input: N = (Sand, Silt, Clay, PH, SOM, SOC, Available Nitrogen, Available Phosphorus, Depth) Output: K = (Predict soil enzyme activity) |
| 1: Initialization of all N and K parameters 2: If (Sn ! = Sc) 3: Then pre-process and scale the data 4: Otherwise, go to step 5 5: Choose and select x and y variable 6: Split 80% data for training and 20% data for testing 7: Add first and second hidden layer (activation function = relu) 8: Add output hidden layer (activation function = sigmoid) 9: Compile and validate data 10: Select the epoch and calculate the accuracy 11: Predict soil enzyme activity 12: End (Where Sn = scale features from soil dataset, Sc = scale soil enzyme features of the dataset) |
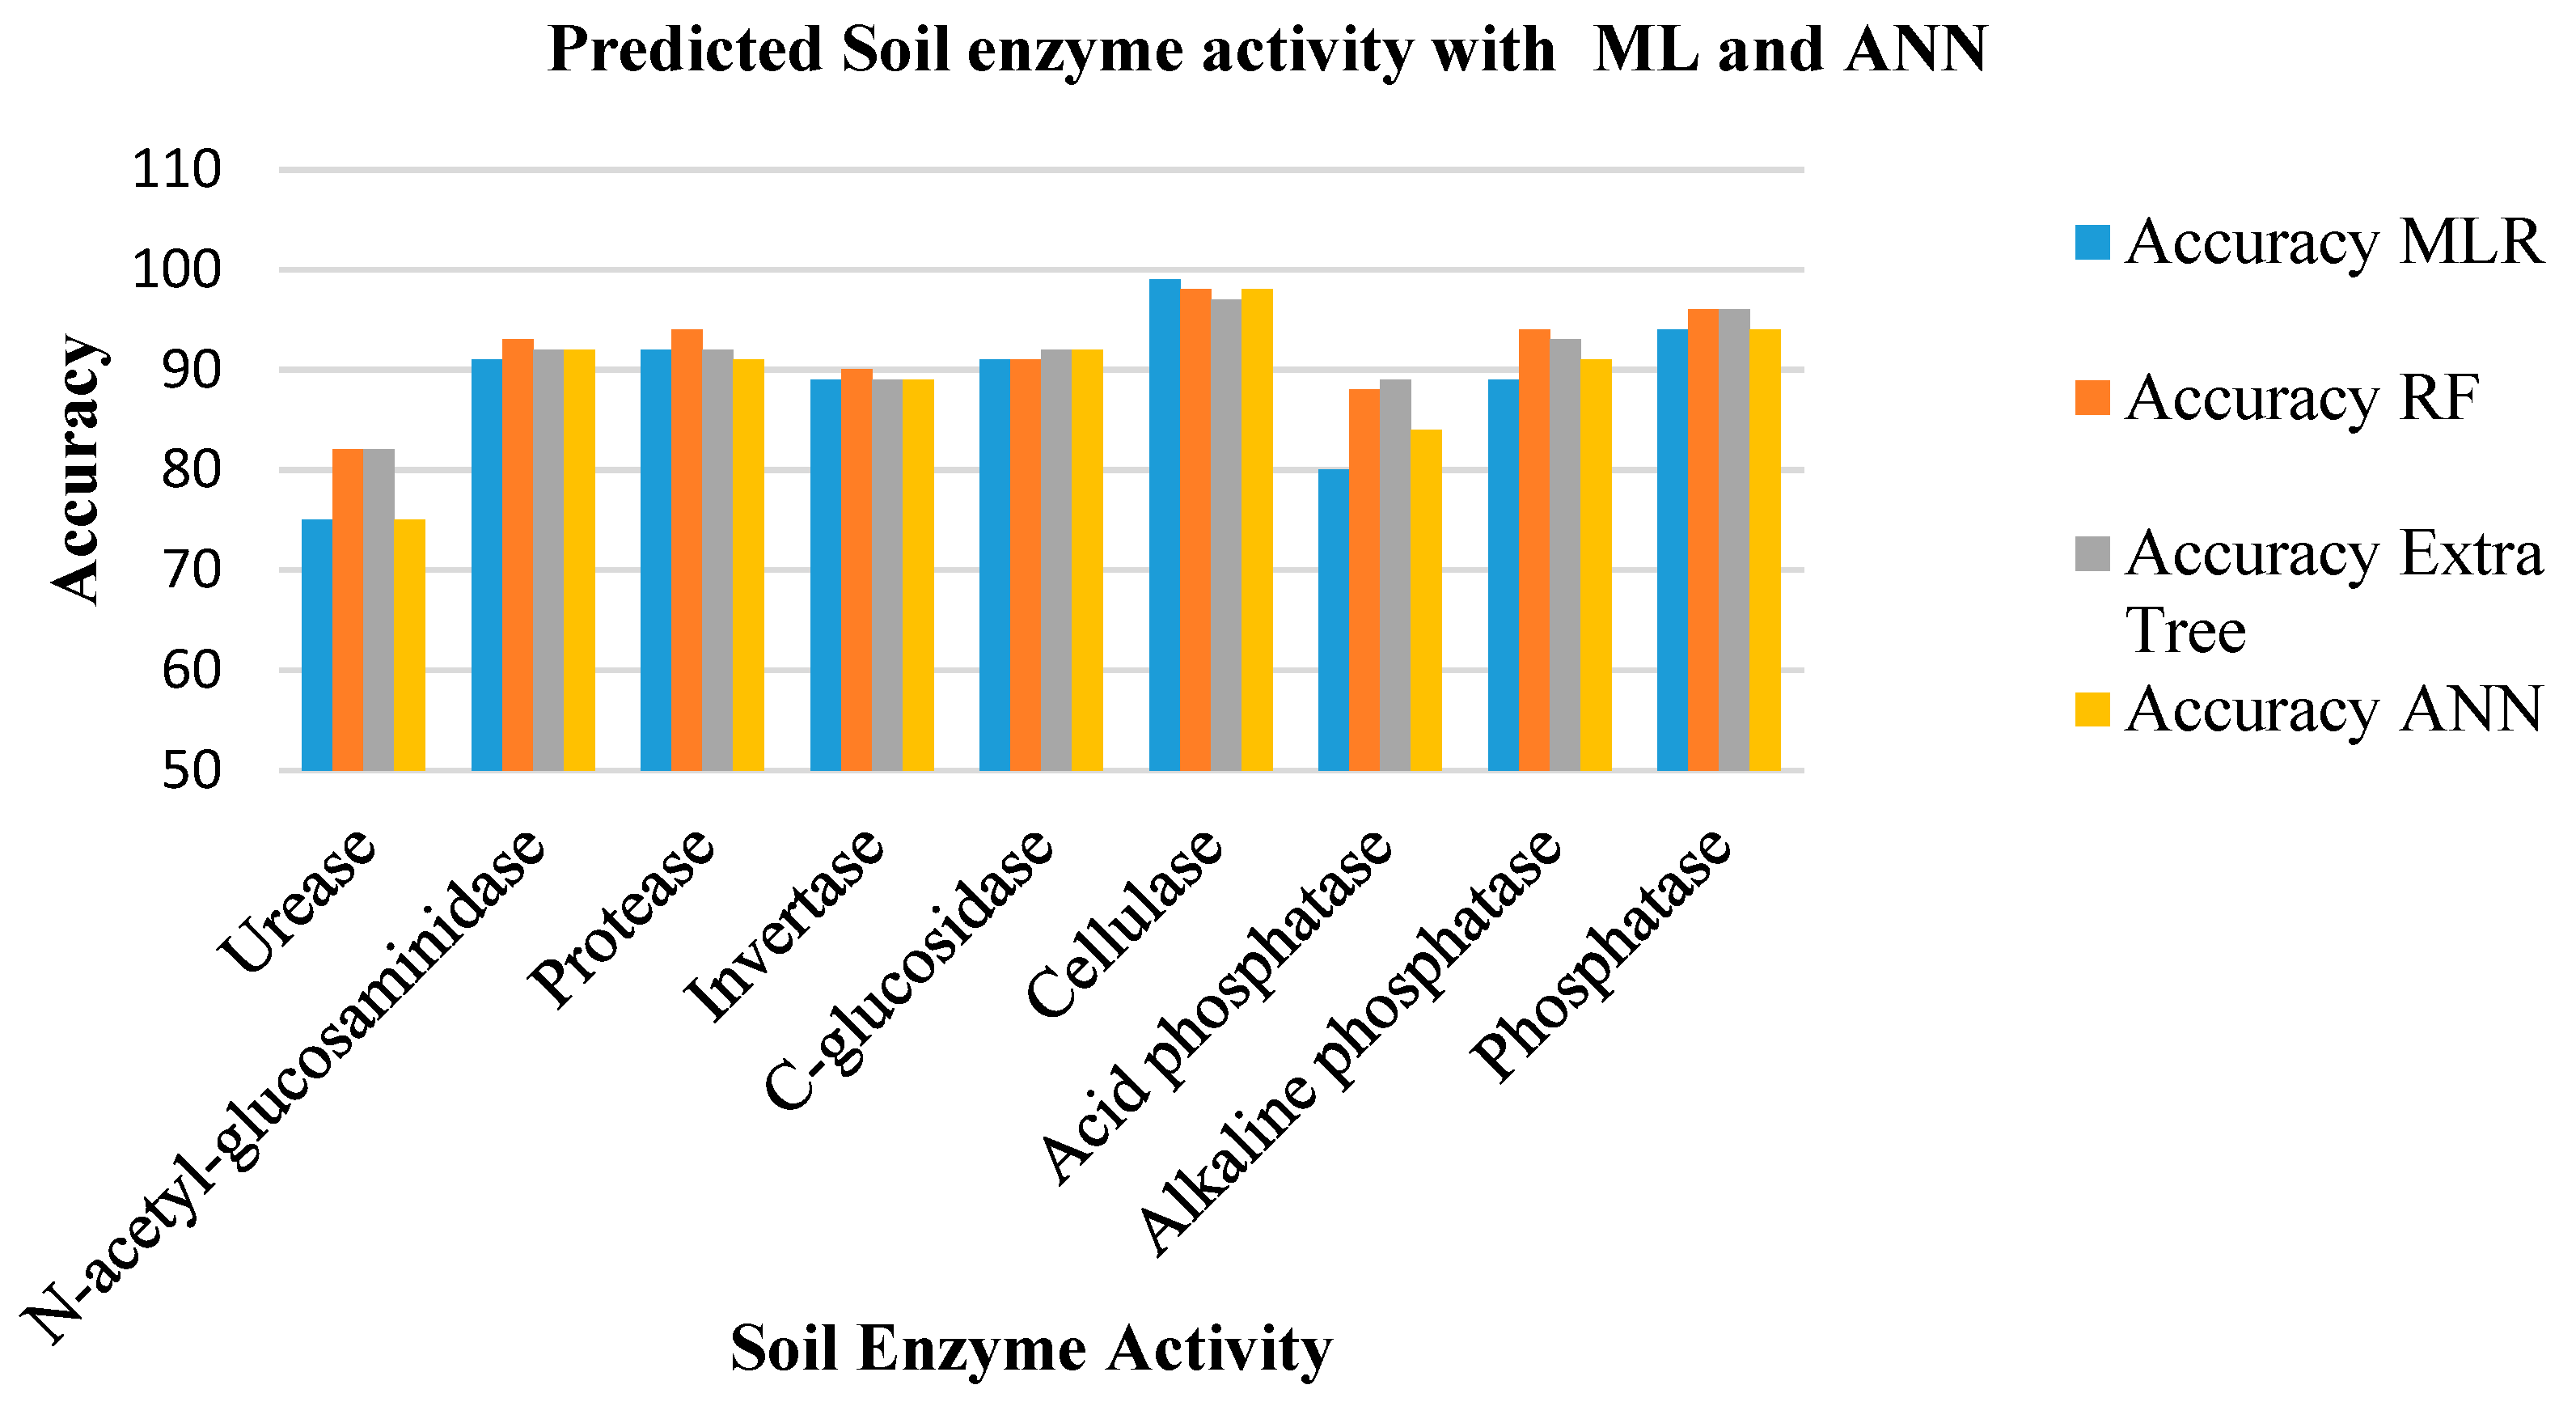
3. Result and Discussion
Model Validation
4. Conclusions
Author Contributions
Funding
Institutional Review Board Statement
Data Availability Statement
Conflicts of Interest
References
- Luis Moreno, J.; Bastida, F.; Díaz-López, M.; Li, Y.; Zhou, Y.; López-Mondéjar, R.; Benavente-Ferraces, I.; Rojas, R.; Rey, A.; García-Gil, J.C.; et al. Response of soil chemical properties, enzyme activities and microbial communities to biochar application and climate change in a Mediterranean agroecosystem. Geoderma 2022, 407, 115536. [Google Scholar] [CrossRef]
- Tajik, S.; Ayoubi, S.; Lorenz, N. Soil microbial communities affected by vegetation, topography and soil properties in a forest ecosystem. Appl. Soil Ecol. 2020, 149, 103514. [Google Scholar] [CrossRef]
- Xie, X.; Wu, T.; Zhu, M.; Jiang, G.; Xu, Y.; Wang, X.; Pu, L. Comparison of random forest and multiple linear regression models for estimation of soil extracellular enzyme activities in agricultural reclaimed coastal saline land. Ecol. Indic. 2021, 120, 106925. [Google Scholar] [CrossRef]
- Pukalchik, M.A.; Katrutsa, A.M.; Shadrin, D.; Terekhova, V.A.; Oseledets, I.V. Machine learning methods for estimation the indicators of phosphogypsum influence in soil. J. Soils Sediments 2019, 19, 2265–2276. [Google Scholar] [CrossRef]
- Zhang, L.; Chen, X.; Xu, Y.; Jin, M.; Ye, X.; Gao, H.; Chu, W.; Mao, J.; Thompson, M.L. Soil labile organic carbon fractions and soil enzyme activities after 10 years of continuous fertilization and wheat residue incorporation. Sci. Rep. 2020, 10, 11318. [Google Scholar] [CrossRef]
- Jha, S.K.; Ahmad, Z. Soil microbial dynamics prediction using machine learning regression methods. Comput. Electr. Agric. 2018, 147, 158–165. [Google Scholar] [CrossRef]
- Archana, K.; Saranya, K.G. Crop Yield Prediction, Forecasting and Fertilizer Recommendation using Voting Based Ensemble Classifier. SSRG Int. J. Comput. Sci. Eng. 2020, 7, 5–8. [Google Scholar]
- Aponte, H.; Meli, P.; Butler, B.; Paolini, J.; Matus, F.; Merino, C.; Cornejo, P.; Kuzyakov, Y. Meta-analysis of heavy metal effects on soil enzyme activities. Sci. Total Environ. 2020, 737, 139744. [Google Scholar] [CrossRef]
- dos Santos Teixeira, A.F.; Silva, S.H.G.; de Carvalho, T.S.; Silva, A.O.; Guimarães, A.A.; de Souza, F.M. Soil physicochemical properties and terrain information predict soil enzymes activity in phytophysiognomies of the Quadrilátero Ferrífero region in Brazil. Catena 2021, 199, 105083. [Google Scholar] [CrossRef]
- Curtright, A.J.; Tiemann, L.K. Meta-analysis dataset of soil extracellular enzyme activities in intercropping systems. Data Brief 2021, 38, 107284. [Google Scholar] [CrossRef]
- Jian, S.; Li, J.; Chen, J.; Wang, G.; Mayes, M.A.; Dzantor, K.E.; Hui, D.; Luo, Y. Soil extracellular enzyme activities, soil carbon and nitrogen storage under nitrogen fertilization: A meta-analysis. Soil Biol. Biochem. 2016, 101, 32–43. [Google Scholar] [CrossRef]
- Piotrowska-Długosz, A.; Kobierski, M.; Długosz, J. Enzymatic activity and physicochemical properties of soil profiles of luvisols. Materials 2021, 14, 6364. [Google Scholar] [CrossRef] [PubMed]
- Tajik, S.; Ayoubi, S.; Nourbakhsh, F. Prediction of soil enzymes activity by digital terrain analysis: Comparing artificial neural network and multiple linear regression models. Environ. Eng. Sci. 2012, 29, 798–806. [Google Scholar] [CrossRef]
- Zhang, H.; Wu, P.; Yin, A.; Yang, X.; Zhang, M.; Gao, C. Prediction of soil organic carbon in an intensively managed reclamation zone of eastern China: A comparison of multiple linear regressions and the random forest model. Sci. Total Environ. 2017, 592, 704–713. [Google Scholar] [CrossRef]
- Karthigadevi, K. Random Forest Classification Algorithm for Agricultural Data Analysis in Tirunelveli District. J. Xi’an Univ. Archit. Technol. 2020, 12, 418–432. [Google Scholar]
- Hemageetha, N.; Nagalakshmi, N. Classification Techniques in Analysis of Salem District Soil condition for Cultivation of Sunflower. Int. J. Comput. Sci. Eng. 2018, 6, 642–646. [Google Scholar] [CrossRef]
- Rajamanickam, J.; Savitha, D.M. Predictive model construction for prediction of soil fertility using decision tree machine learning algorithm. Kongunadu Res. J. 2021, 8, 30–35. [Google Scholar]
- Zhao, D.; Arshad, M.; Li, N.; Triantafilis, J. Predicting soil physical and chemical properties using Vis-NIR in Australian cotton areas. Catena 2021, 196, 104938. [Google Scholar] [CrossRef]
- Kashiwar, S.R.; Kundu, D.M.C.; Dongarwar, U.R. Soil fertility appraisal of Bhandara block of Maharashtra using geospatial techniques. Int. J. Chem. Stud. 2020, 8, 2570–2576. [Google Scholar] [CrossRef]
- Geng, X.; Zhu, C.; Zhang, J.; Xiong, Z. Prediction of Soil Fertility Change Trend Using a Stochastic Petri Net. J. Sign. Process. Syst. 2021, 93, 285–297. [Google Scholar] [CrossRef]
- Pinheiro, H.S.K.; de Carvalho, W., Jr.; da Silva Chages, C.; dos Anjos, L.H.C.; Owens, P.R. Prediction of topsoil texture through regression trees and multiple linear regressions. Rev. Bras. Cienc. Solo 2018, 42, e0170167. [Google Scholar] [CrossRef]
- Zhang, H.; Yin, S.; Chen, Y.; Shao, S.; Wu, J.; Fan, M.; Chen, F.; Gao, C. Machine learning-based source identification and spatial prediction of heavy metals in soil in a rapid urbanization area, eastern China. J. Clean. Prod. 2020, 273, 122858. [Google Scholar] [CrossRef]
- Deng, X.; Ma, W.; Ren, Z.; Zhang, M.; Grieneisen, M.L.; Chen, X.; Fei, X.; Qin, F.; Zhan, Y.; Lv, X. Spatial and temporal trends of soil total nitrogen and C/N ratio for croplands of East China. Geoderma 2020, 361, 114035. [Google Scholar] [CrossRef]
- Xu, Y.; Wang, X.; Bai, J.; Wang, D.; Wang, W.; Guan, Y. Estimating the spatial distribution of soil total nitrogen and available potassium in coastal wetland soils in the Yellow River Delta by incorporating multi-source data. Ecol. Indic. 2020, 111, 106002. [Google Scholar] [CrossRef]
- Sirsat, M.S.; Cernadas, E.; Fernández-Delgado, M.; Khan, R. Classification of agricultural soil parameters in India. Comput. Electr. Agric. 2017, 135, 269–279. [Google Scholar] [CrossRef]
- Kalkhajeh, Y.K.; Arshad, R.R.; Amerikhah, H.; Sami, M. Comparison of multiple linear regressions and artificial intelli-gence-based modeling techniques for prediction the soil cation exchange capacity of Aridisols and Entisols in a semi-arid region. Aust. J. Agric. Eng. 2012, 3, 39–46. [Google Scholar]
- Van Klompenburg, T.; Kassahun, A.; Catal, C. Crop yield prediction using machine learning: A systematic literature review. Comput. Electr. Agric. 2020, 177, 105709. [Google Scholar] [CrossRef]
- Were, K.; Bui, D.T.; Dick, Ø.B.; Singh, B.R. A comparative assessment of support vector regression, artificial neural networks, and random forests for predicting and mapping soil organic carbon stocks across an Afromontane landscape. Ecol. Indic. 2015, 52, 394–403. [Google Scholar] [CrossRef]
- Swapna, B.; Manivannan, S.; Nandhinidevi, R. Prediction of Soil Reaction (Ph) and Soil Nutrients Using Multivariate Statistics Techniques for Agricultural Crop and Soil Management. Int. J. Adv. Sci. Technol. 2020, 29, 1900–1912. [Google Scholar]
- Munawar, A.A.; Yunus, Y.; Devianti; Satriyo, P. Calibration models database of near-infrared spectroscopy to predict agricul-tural soil fertility properties. Data Brief 2020, 30, 105469. [Google Scholar] [CrossRef]
- Kivlin, S.N.; Treseder, K.K. Soil extracellular enzyme activities correspond with abiotic factors more than fungal community composition. Biogeochemistry 2014, 117, 23–37. [Google Scholar] [CrossRef]
- Weintraub, S.R.; Wieder, W.R.; Cleveland, C.C.; Townsend, A.R. Organic matter inputs shift soil enzyme activity and allocation patterns in a wet tropical forest. Biogeochemistry 2013, 114, 313–326. [Google Scholar] [CrossRef]
- Panchamurthi, S. Soil Analysis and Prediction of Suitable Crop for Agriculture using Machine Learning. Int. J. Res. Appl. Sci. Eng. Technol. 2019, 7, 2328–2335. [Google Scholar] [CrossRef]
- Priya, P.; Muthaiah, U.; Balamurugan, M. Predicting yield of the crop using machine learning algorithms. Int. J. Eng. Sci. Res. Technol. 2018, 7, 1–7. [Google Scholar]
- Sukhadia, K.; Chaudhari, M.B. A Survey on Rice Crop Yield Prediction in India Using Improved Classification Technique. Int. J. Sci. Res. Comput. Sci. Eng. Inf. Technol. 2019, 5, 501–507. [Google Scholar]


| S. No. | Ph | Sand (%) | Silt (%) | Clay (%) | N (ppm) | P (ppm) | SOM (ppm) | SOC (ppm) | Fertility Level | Depth (cm/mm) | Soil Enzyme |
|---|---|---|---|---|---|---|---|---|---|---|---|
| 1 | 7.70 | 20.00 | 43.00 | 36.00 | 40.60 | 12.60 | 12.60 | 9.70 | Medium | 30 | Urease |
| 2 | 6.58 | 20.00 | 43.00 | 36.00 | 40.60 | 12.60 | 12.60 | 9.70 | Medium | 30 | Urease |
| 3 | 6.12 | 20.00 | 43.00 | 36.00 | 40.60 | 12.60 | 12.60 | 9.70 | Medium | 30 | Invertase |
| 4 | 6.50 | 20.00 | 43.00 | 36.00 | 40.60 | 12.60 | 12.60 | 9.70 | Medium | 30 | Invertase |
| 5 | 6.12 | 20.00 | 43.00 | 36.00 | 40.60 | 12.60 | 12.60 | 9.70 | Medium | 30 | Acid phosphatase |
| 6 | 6.42 | 20.00 | 43.00 | 36.00 | 40.60 | 12.60 | 12.60 | 9.70 | Medium | 30 | Acid phosphatase |
| 7 | 6.24 | 20.00 | 43.00 | 36.00 | 36.15 | 8.23 | 8.23 | 9.70 | Low | 30 | Urease |
| 8 | 6.84 | 20.00 | 43.00 | 36.00 | 0.87 | 0.87 | 1.23 | 17.28 | Low | 20 | Protease |
| 9 | 6.84 | 20.00 | 43.00 | 36.00 | 1.20 | 1.20 | 1.23 | 17.28 | Medium | 20 | Protease |
| 10 | 6.84 | 33.00 | 21.00 | 46.00 | 1.37 | 1.37 | 1.23 | 17.28 | Medium | 20 | Protease |
| Soil Properties | Mean | Min | Max | SD |
|---|---|---|---|---|
| PH | 6.3314 | 3.8000 | 8.7900 | 0.7280 |
| Sand | 38.1617 | 8.0000 | 90.0000 | 19.3332 |
| Silt | 31.7412 | 4.0000 | 67.0000 | 14.5515 |
| Clay | 32.1268 | 11.0000 | 47.0000 | 10.5310 |
| Available Nitrogen | 19.1986 | 0.6900 | 317.0000 | 51.6195 |
| Available Phosphorus | 9.9923 | 0.6900 | 146.5000 | 23.0569 |
| SOM | 5.1652 | 0.6900 | 127.2000 | 11.1173 |
| SOC | 7.6628 | 0.6900 | 127.2000 | 14.1052 |
| Depth | 19.2412 | 10.0000 | 30.0000 | 5.4071 |
| Soil Fertility Level (Low, Medium, and High) | 1.2921 | 0.0000 | 2.0000 | 0.8235 |
| Soil Enzyme | 9.3529 | 0.0000 | 19.0000 | 18.0000 |
| Predicted Soil Enzyme Activity Data | ||||
|---|---|---|---|---|
| Positive | Negative | |||
| Actual Soil Enzyme Activity Data | Positive | True Positive (TP) | False Negative (FN) | Sensitivity |
| Negative | False Positive (FP) | True Negative (TN) | Specificity | |
| Classification Metrics | Precision | Negative Predictive Value | Accuracy | |
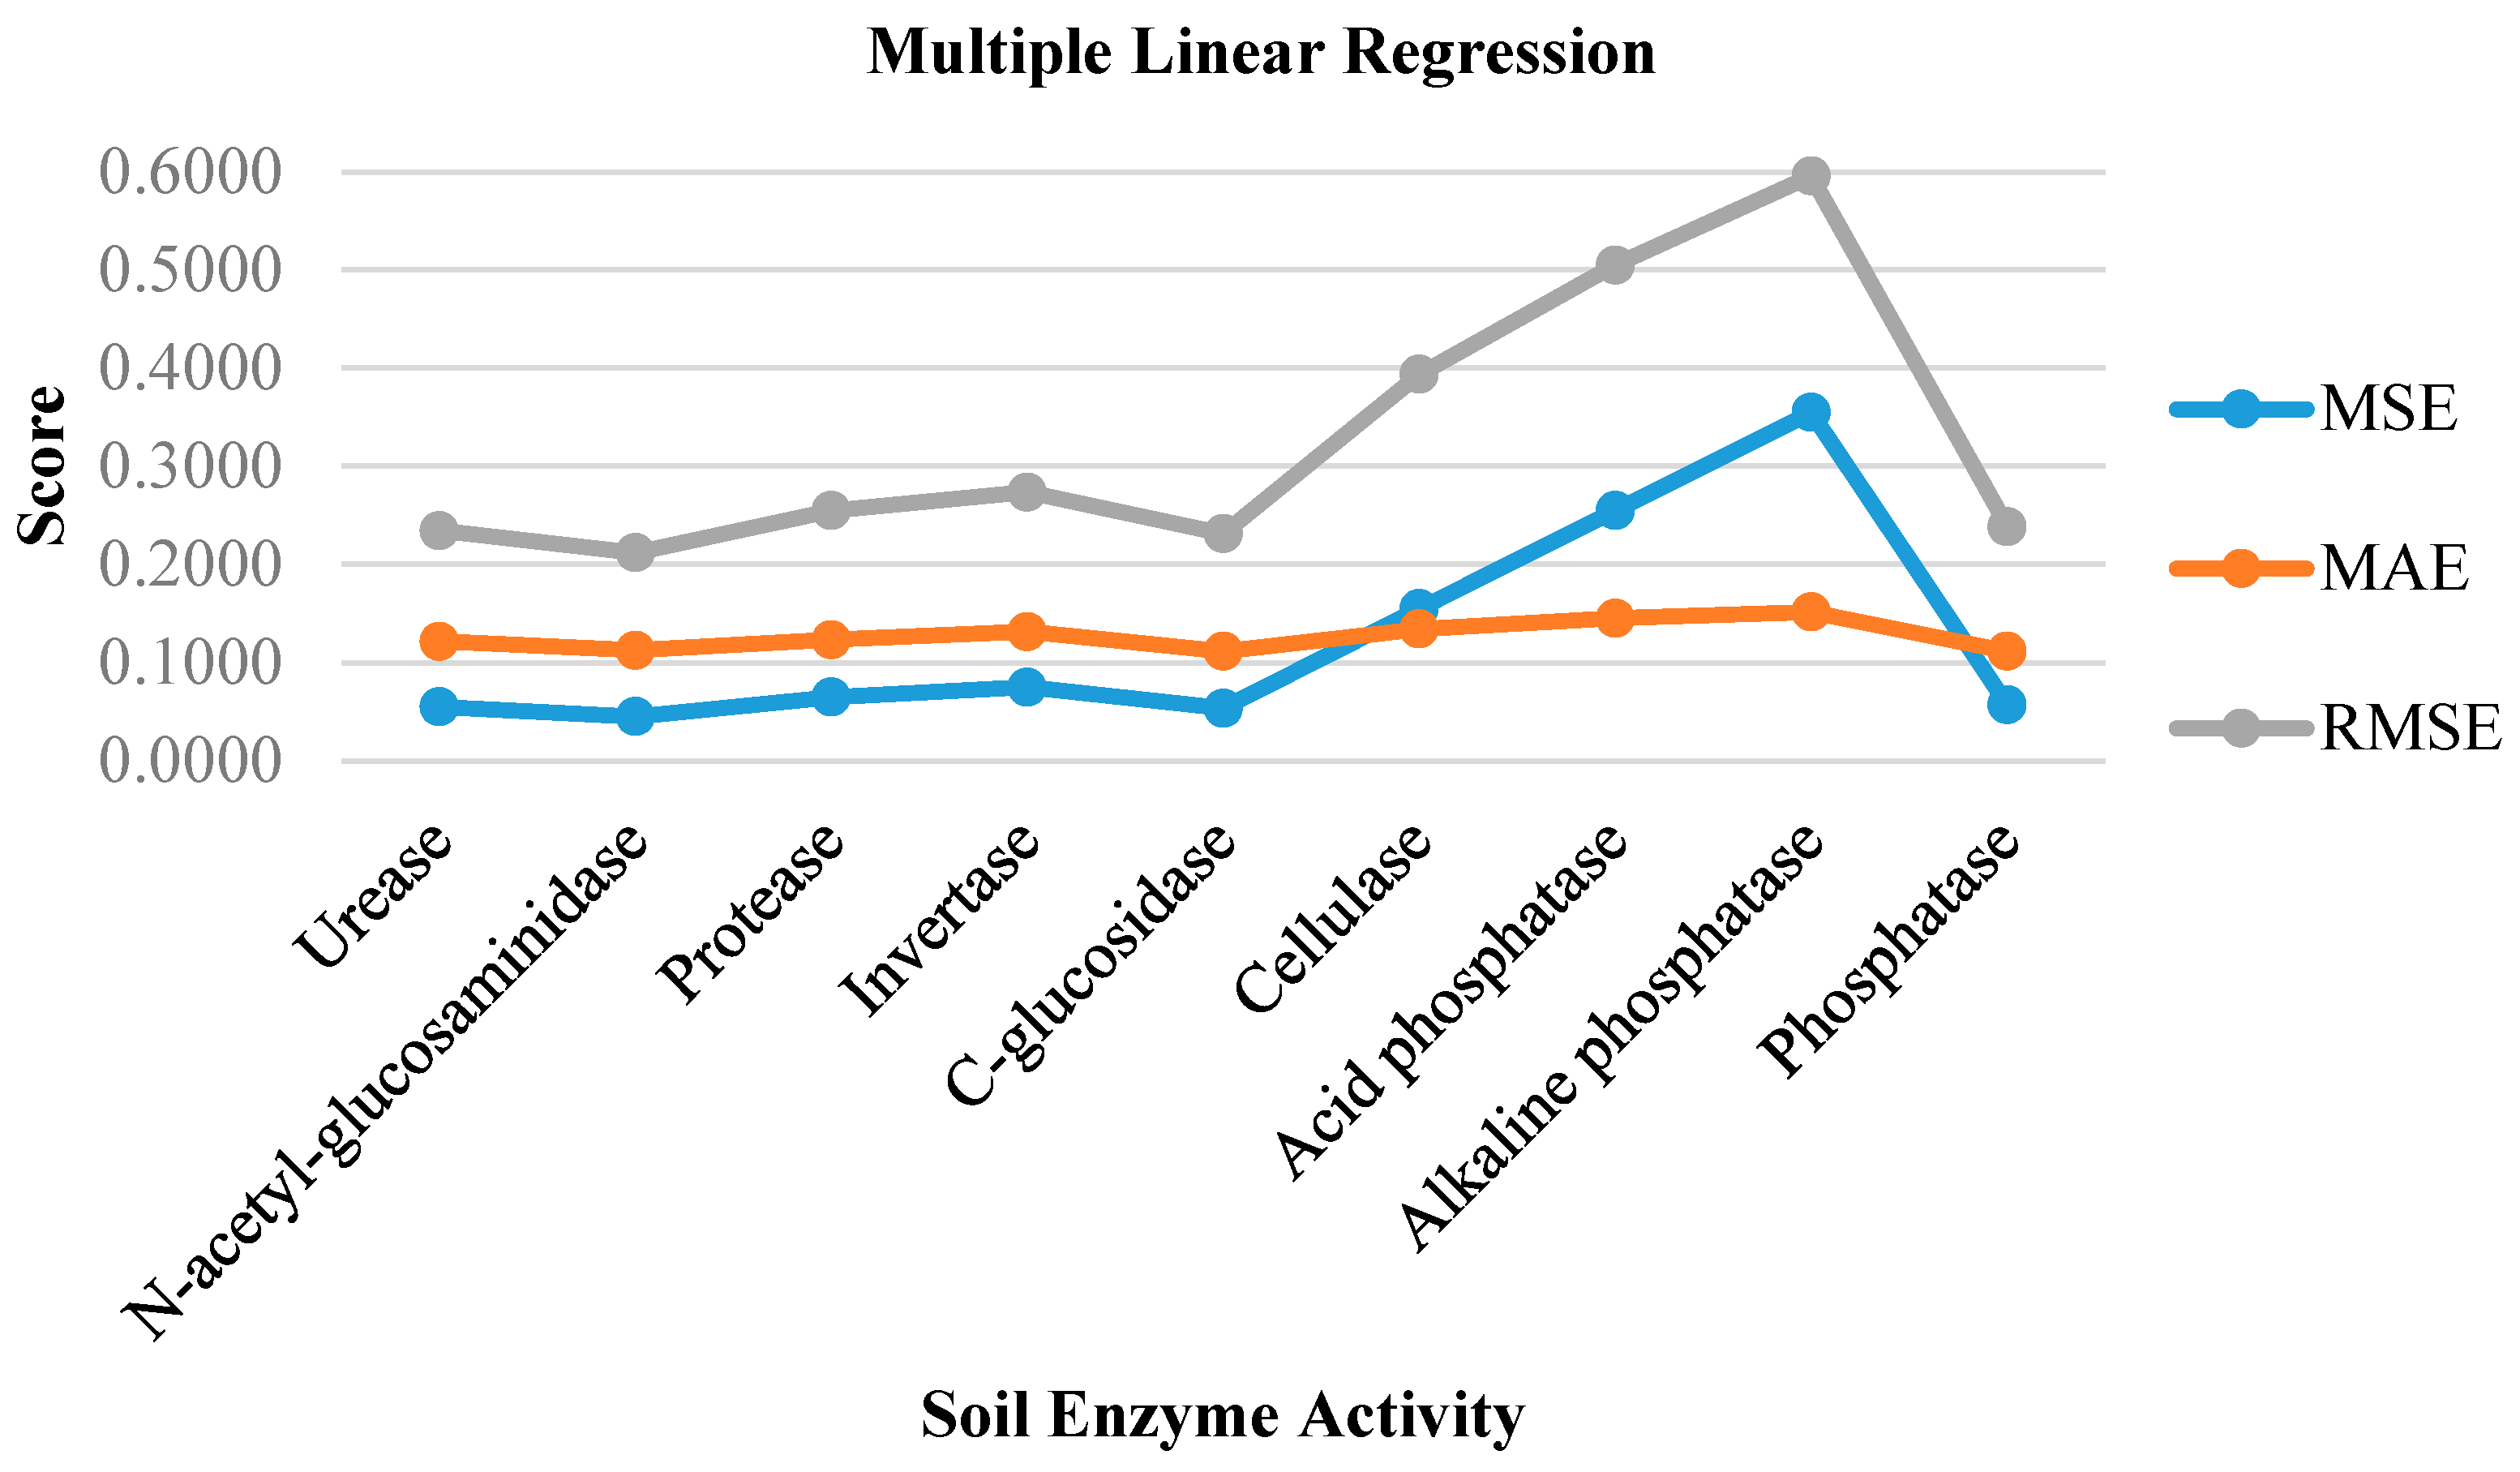
| Soil Enzyme | MSE | MAE | RMSE |
|---|---|---|---|
| Multiple Linear Regression | |||
| Urease | 0.0549 | 0.1216 | 0.2343 |
| N-acetyl-glucosaminidase | 0.0449 | 0.1126 | 0.2119 |
| Protease | 0.0649 | 0.1232 | 0.2547 |
| Invertase | 0.0749 | 0.1316 | 0.2737 |
| C-glucosidase | 0.0535 | 0.1116 | 0.2313 |
| Cellulase | 0.1549 | 0.1342 | 0.3936 |
| Acid phosphatase | 0.2549 | 0.1452 | 0.5049 |
| Alkaline phosphatase | 0.3549 | 0.1516 | 0.5957 |
| Phosphatase | 0.0569 | 0.1116 | 0.2385 |
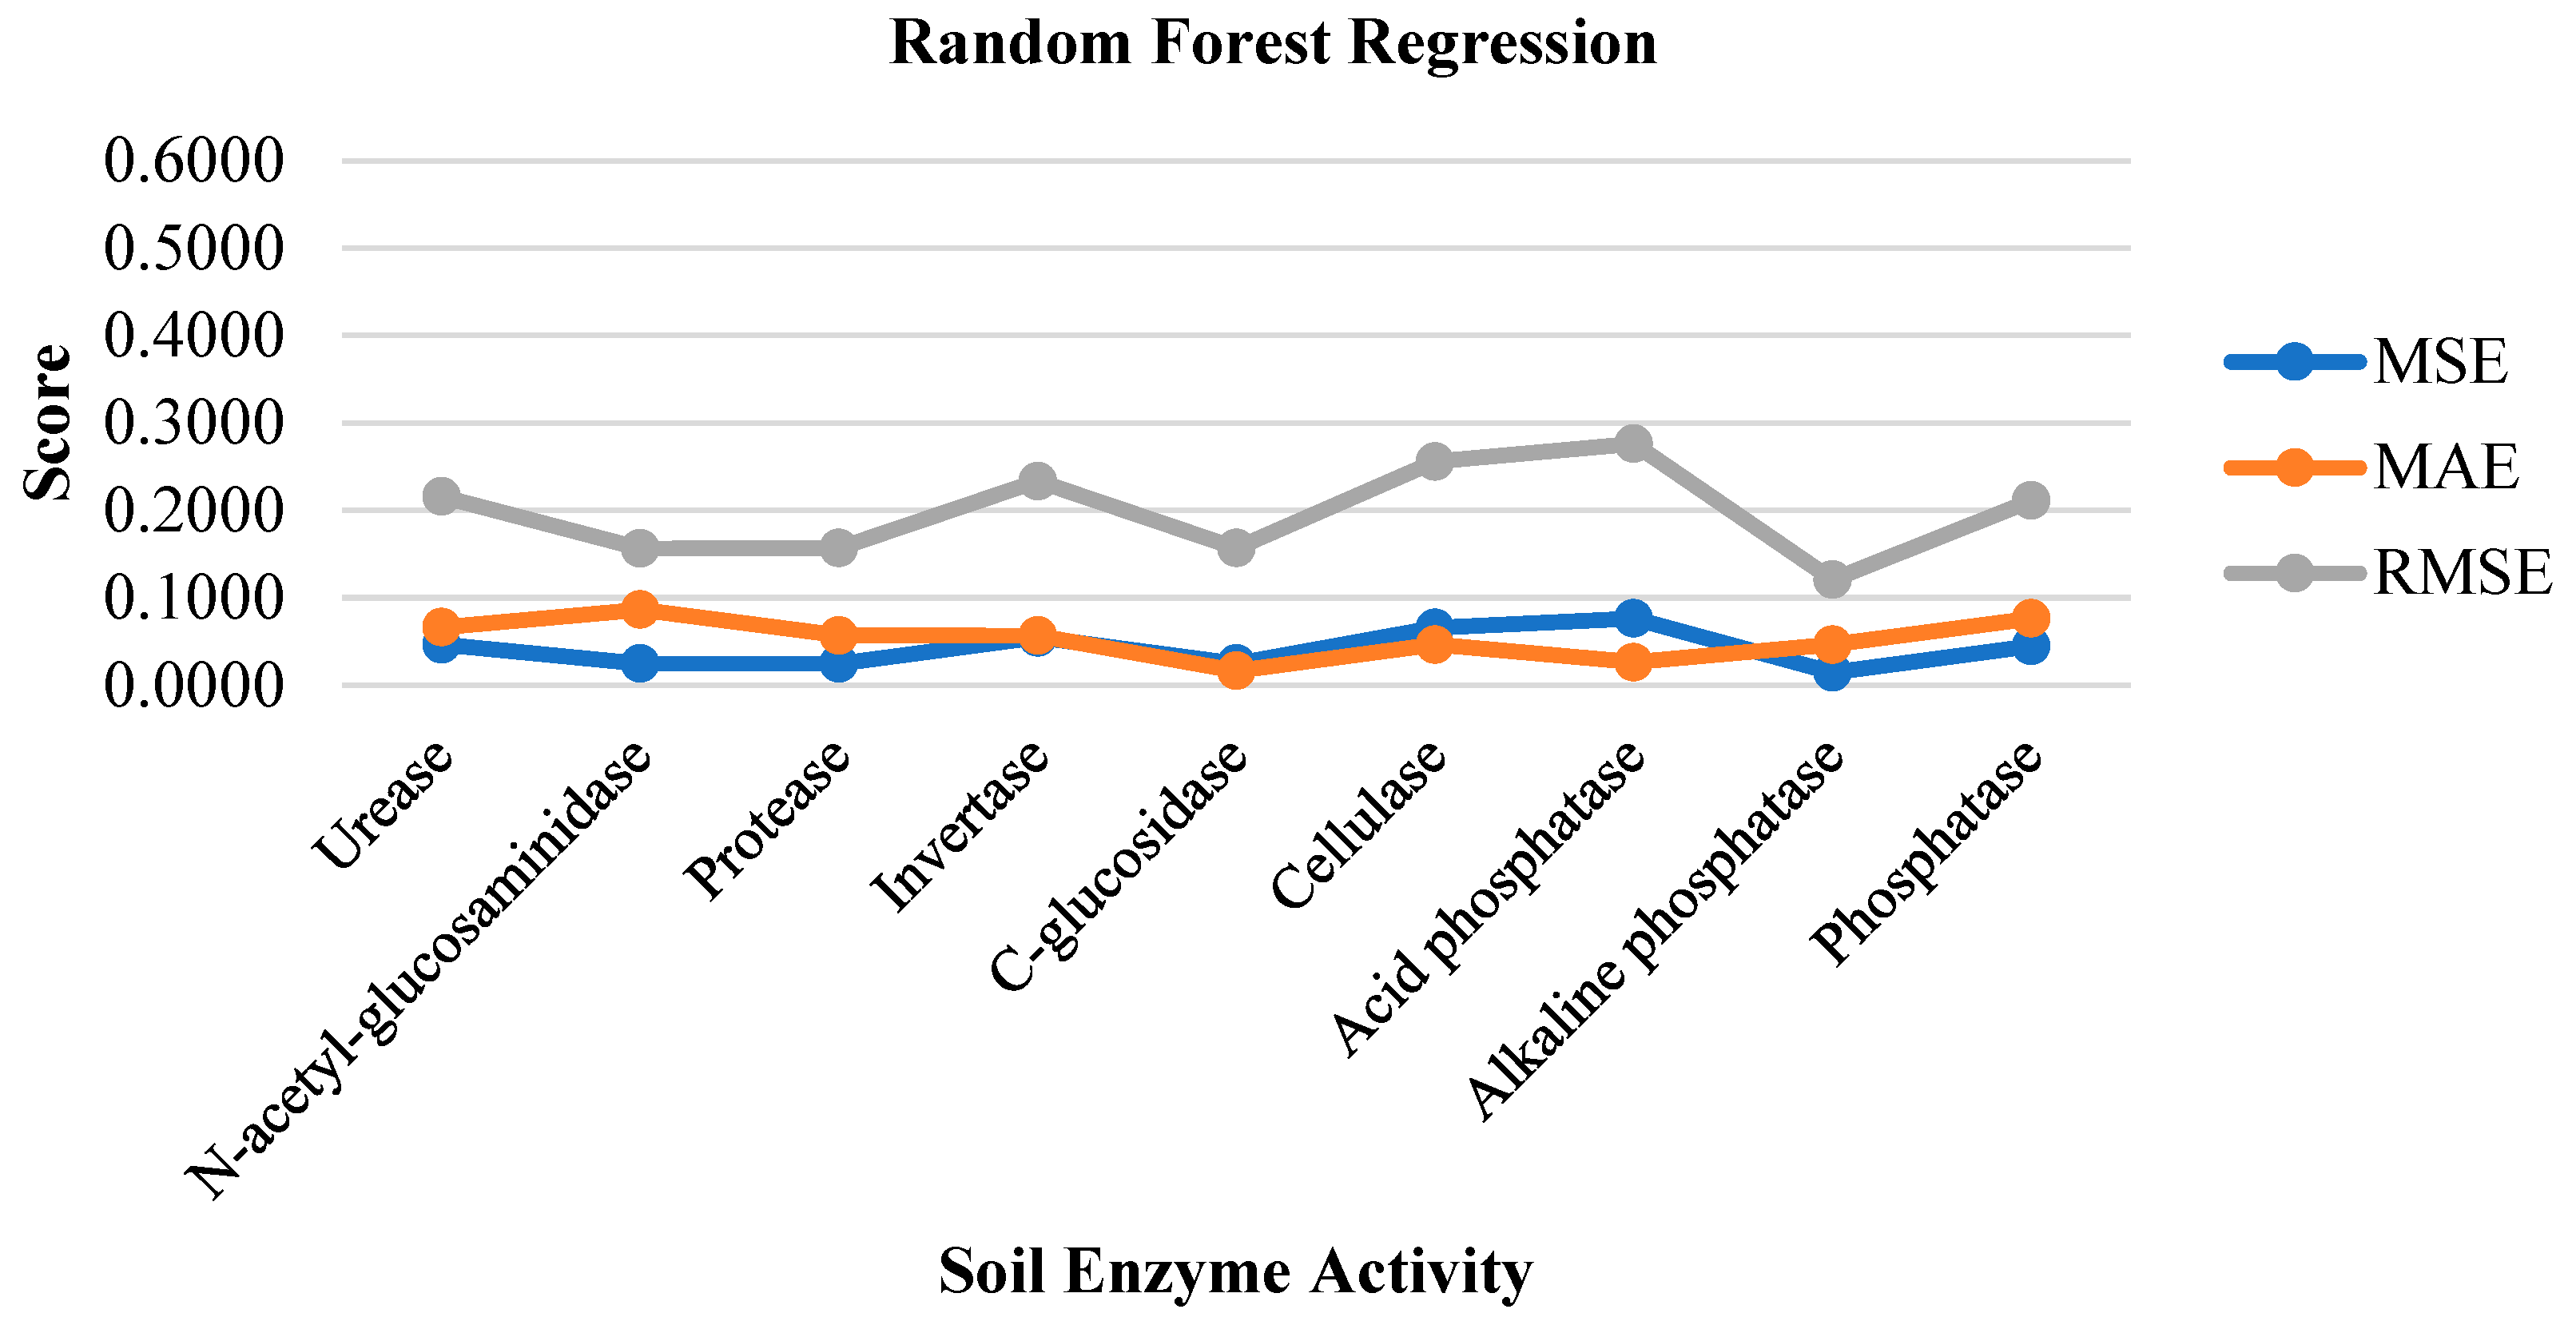
| Soil Enzyme | MSE | MAE | RMSE |
|---|---|---|---|
| RF | |||
| Urease | 0.0466 | 0.0662 | 0.2159 |
| N-acetyl-glucosaminidase | 0.0245 | 0.0862 | 0.1564 |
| Protease | 0.0246 | 0.0569 | 0.1569 |
| Invertase | 0.0545 | 0.0566 | 0.2334 |
| C-glucosidase | 0.0246 | 0.0162 | 0.1569 |
| Cellulase | 0.0655 | 0.0462 | 0.2559 |
| Acid phosphatase | 0.0765 | 0.0262 | 0.2765 |
| Alkaline phosphatase | 0.0146 | 0.0462 | 0.1209 |
| Phosphatase | 0.0446 | 0.0762 | 0.2112 |
| Soil Enzyme | MSE | MAE | RMSE |
|---|---|---|---|
| Extra Tree Regressor | |||
| Urease | 0.1761 | 0.7610 | 0.4196 |
| N-acetyl-glucosaminidase | 0.0622 | 0.2746 | 0.2493 |
| Protease | 0.0777 | 0.0777 | 0.2787 |
| Invertase | 0.1036 | 0.1036 | 0.3219 |
| C-glucosidase | 0.0829 | 0.0829 | 0.2879 |
| Cellulase | 0.0259 | 0.0752 | 0.1609 |
| Acid phosphatase | 0.0907 | 0.1473 | 0.3012 |
| Alkaline phosphatase | 0.0618 | 0.0999 | 0.2486 |
| Phosphatase | 0.0500 | 0.0814 | 0.2236 |
| Soil Enzyme | MSE | MAE | RMSE |
|---|---|---|---|
| ANN | |||
| Urease | 0.1818 | 0.3464 | 0.4263 |
| N-acetyl-glucosaminidase | 0.2353 | 0.4732 | 0.4850 |
| Protease | 0.1383 | 0.3421 | 0.3718 |
| Invertase | 0.3328 | 0.5687 | 0.5768 |
| C-glucosidase | 0.1443 | 0.1443 | 0.3798 |
| Cellulase | 0.3826 | 0.3826 | 0.6185 |
| Acid phosphatase | 0.1913 | 0.4138 | 0.4373 |
| Alkaline phosphatase | 0.3402 | 0.5735 | 0.5832 |
| Phosphatase | 0.4263 | 0.6417 | 0.6529 |
| Fertility Level | Soil Enzyme Activity | Crops | |||||
|---|---|---|---|---|---|---|---|
| Low | Urease | Cucumber | Maize | Peanut | Pepper | Soybean | Sugarcane |
| Medium | N-acetyl-glucosaminidase | Chickpea | Cotton | Rice | Wheat | Peanut | Soybean |
| High | Protease | Potato | Cotton | Sugarcane | Maize | Soybean | Pear |
| Low | Invertase | Cucumber | Maize | Peanut | Pepper | Soybean | Sugarcane |
| Low | C-glucosidase | Cucumber | Maize | Peanut | Pepper | Soybean | Sugarcane |
| Medium | Cellulase | Cucumber | Maize | Peanut | Pepper | Soybean | Sugarcane |
| Low | Acid phosphatase | Cucumber | Maize | Peanut | Pepper | Soybean | Sugarcane |
| Medium | Alkaline phosphatase | Cucumber | Maize | Peanut | Pepper | Soybean | Sugarcane |
| High | Phosphatase | Potato | Cotton | Sugarcane | Maize | Soybean | Pear |
Disclaimer/Publisher’s Note: The statements, opinions and data contained in all publications are solely those of the individual author(s) and contributor(s) and not of MDPI and/or the editor(s). MDPI and/or the editor(s) disclaim responsibility for any injury to people or property resulting from any ideas, methods, instructions or products referred to in the content. |
© 2023 by the authors. Licensee MDPI, Basel, Switzerland. This article is an open access article distributed under the terms and conditions of the Creative Commons Attribution (CC BY) license (https://creativecommons.org/licenses/by/4.0/).
Share and Cite
Shahare, Y.; Singh, M.P.; Singh, P.; Diwakar, M.; Singh, V.; Kadry, S.; Sevcik, L. A Comprehensive Analysis of Machine Learning-Based Assessment and Prediction of Soil Enzyme Activity. Agriculture 2023, 13, 1323. https://doi.org/10.3390/agriculture13071323
Shahare Y, Singh MP, Singh P, Diwakar M, Singh V, Kadry S, Sevcik L. A Comprehensive Analysis of Machine Learning-Based Assessment and Prediction of Soil Enzyme Activity. Agriculture. 2023; 13(7):1323. https://doi.org/10.3390/agriculture13071323
Chicago/Turabian StyleShahare, Yogesh, Mukund Partap Singh, Prabhishek Singh, Manoj Diwakar, Vijendra Singh, Seifedine Kadry, and Lukas Sevcik. 2023. "A Comprehensive Analysis of Machine Learning-Based Assessment and Prediction of Soil Enzyme Activity" Agriculture 13, no. 7: 1323. https://doi.org/10.3390/agriculture13071323
APA StyleShahare, Y., Singh, M. P., Singh, P., Diwakar, M., Singh, V., Kadry, S., & Sevcik, L. (2023). A Comprehensive Analysis of Machine Learning-Based Assessment and Prediction of Soil Enzyme Activity. Agriculture, 13(7), 1323. https://doi.org/10.3390/agriculture13071323