Article

Fine-Mapping of qECL7.1, a Quantitative Trait Locus Contributing to Epicotyl Length in Adzuki Bean (Vigna angularis)

1
Department of Agro-Environmental Science, Obihiro University of Agriculture and Veterinary Medicine, Nishi 2-11 Inada, Obihiro 080-8555, Hokkaido, Japan
2
Malawi Plant Genetic Resources Centre, Chitedze Research Station, Lilongwe P.O. Box 158, Malawi
3
Tokachi Agricultural Experiment Station, Agricultural Research Department, Hokkaido Research Organization, Memuro 082-0081, Hokkaido, Japan
4
Vegetable Crops Research Unit, USDA Agricultural Research Service, Madison, WI 53706, USA
5
Department of Horticulture, University of Wisconsin, Madison, WI 53706, USA
*
Author to whom correspondence should be addressed.
Agriculture 2023, 13(7), 1305; https://doi.org/10.3390/agriculture13071305
Submission received: 16 May 2023 / Revised: 21 June 2023 / Accepted: 22 June 2023 / Published: 26 June 2023
(This article belongs to the Special Issue Study on Genetic Factors Controlling Complex Traits in Crops)

Abstract

:
Increasing the epicotyl length (ECL) of adzuki bean cultivars enhances the suitability for mechanical weeding during the vegetative stages and harvesting at pod maturity. To explore the genetic control of ECL, and to identify molecular markers that could facilitate breeding for increased ECL, recombinant inbred lines (RILs) were developed from a cross between Toiku161 (long epicotyls) and Chihayahime (ordinary length epicotyls). In this study, four quantitative trait loci (QTLs) were identified for ECL by QTL-seq analysis, one each on chromosomes 2, 7, 10 and 11. Insertion and deletion (InDel)-based mapping also detected QTLs on chromosomes 7, qECL7.1, and 10, qECL10.1. Substitution mapping using InDel, cleaved amplified polymorphic sequence (CAPS), derived cleaved amplified polymorphic sequence (dCAPS), and single nucleotide polymorphism (SNP) markers narrowed the chromosomal location of qECL7.1 to a 418 kb region flanked by DNA markers TC99_10,211,134 bp and TC102_10,628,880 bp. A total of 35 genes were predicted within the qECL7.1 region. The ECL QTLs and molecular markers identified here will contribute towards marker-assisted selection of desirable long ECL genotypes that allow for increased mechanization and more efficient adzuki bean production.

1. Introduction

Epicotyl length (ECL) in legume crops is an important agronomic characteristic due to the trait’s effect on plant height. ECL influences productivity through plant density, competition for light and suitability for mechanization [1]. In adzuki bean (Vigna angularis (Willd.) Ohwi and Ohashi), ECL traits strongly influence the efficiency of cultivation with large machinery [2]. Adzuki bean seedlings are very small, hence, tilling and weeding with large machinery poses a risk of burying the seedlings in the soil [2]. Plants with long epicotyls, however, are less likely to be covered by soil or damaged by mechanical tillage or weeding. Long epicotyls are also advantageous at the pod harvesting stage. During mechanical harvesting, pods close to the soil surface are damaged by the cutting blade, resulting in harvest loss, which potentially reduces yield in adzuki bean [3]. Plants with long ECL have the capability to minimize harvest losses because they have few pods close to the soil surface. Current cultivars, however, have short epicotyls that are less than 5 cm long [3]. Thus, weeding at the seedling stage and harvesting at pod maturity are labor-intensive stages in the cultivation of adzuki bean, because the operations have not been efficiently mechanized. One of the main breeding goals is for improving adzuki bean productivity is to develop long ECL genotypes, that allow for enhanced mechanization efficiency [2,3]. Studies on the genetic mechanisms controlling ECL are needed to support that breeding goal.
Quantitative trait loci (QTLs) associated with ECL have been mapped in adzuki bean. In [4,5], the morphological and physiological traits were explored to understand the genetics related to the domestication of adzuki bean. ECL QTLs were detected on linkage groups 2 and 9 in research that used an adzuki bean landrace accession (JP81481) and closely-related wild species (V. nepalensis) accession (JP107881) [4]. Two QTLs associated with ECL were also detected on linkage groups 1 and 9 in a population derived from a cross between wild adzuki bean accession JP110658 and adzuki bean cultivar Kyoto dainagon [5]. The adzuki bean cultivar (V. angularis var. angularis) showed longer epicotyls than the wild species (V. nipponensis) due to ECL increasing effect from the cultivated parent allele [4,5]. Thus, the domestication led to increased ECL in cultivars. However, ECL in common cultivars is still not ideal for efficient mechanization.
In our prior research, ECL was evaluated in an F2 population derived from a cross between breeding line Tokei1121 (with longer epicotyls) and cultivar Erimo167 (with ordinary length epicotyls). The results showed that ECL is controlled by multiple genes. Four QTLs associated with differences in ECL in cultivated germplasm were detected on chromosomes 2 (qECL2), 4 (qECL4), 7 (qECL7) and 10 (qECL10). The results of segregation pattern analysis using residual heterozygous lines (RHLs) at qECL10 showed that a single recessive gene derived from Tokei1121 contributed to the longer ECL phenotype. This gene was mapped to a ~255 kb region near the end of chromosome 10 [3]. The chromosomal loci for the ECL QTLs detected in studies using wild species differed from those detected in studies using cultivated germplasm. This suggests that genetic variations for ECL among cultivars is governed by different QTL than those that contribute to variations in ECL between cultivars and wild species. However, the inadequate marker-saturation of the linkage map in [3] was a limiting factor in the identification of QTLs associated with ECL in that study. Hence, there is a need for more in-depth analysis of the genomic control mechanisms for ECL in cultivated adzuki bean.
In this study, a breeding line with longer epicotyls, Toiku161, and a cultivar with ordinary length epicotyls, Chihayahime, were re-sequenced to take advantage of the accurate and rapid QTL detection. Then, using a population of recombinant inbred lines (RILs) derived from a cross betweenToiku161 and Chihayahime, QTLs associated with ECL were identified by QTL-seq and linkage mapping. Finally, the QTL target region on chromosome 7 was narrowed down using substitution mapping.

2. Materials and Methods

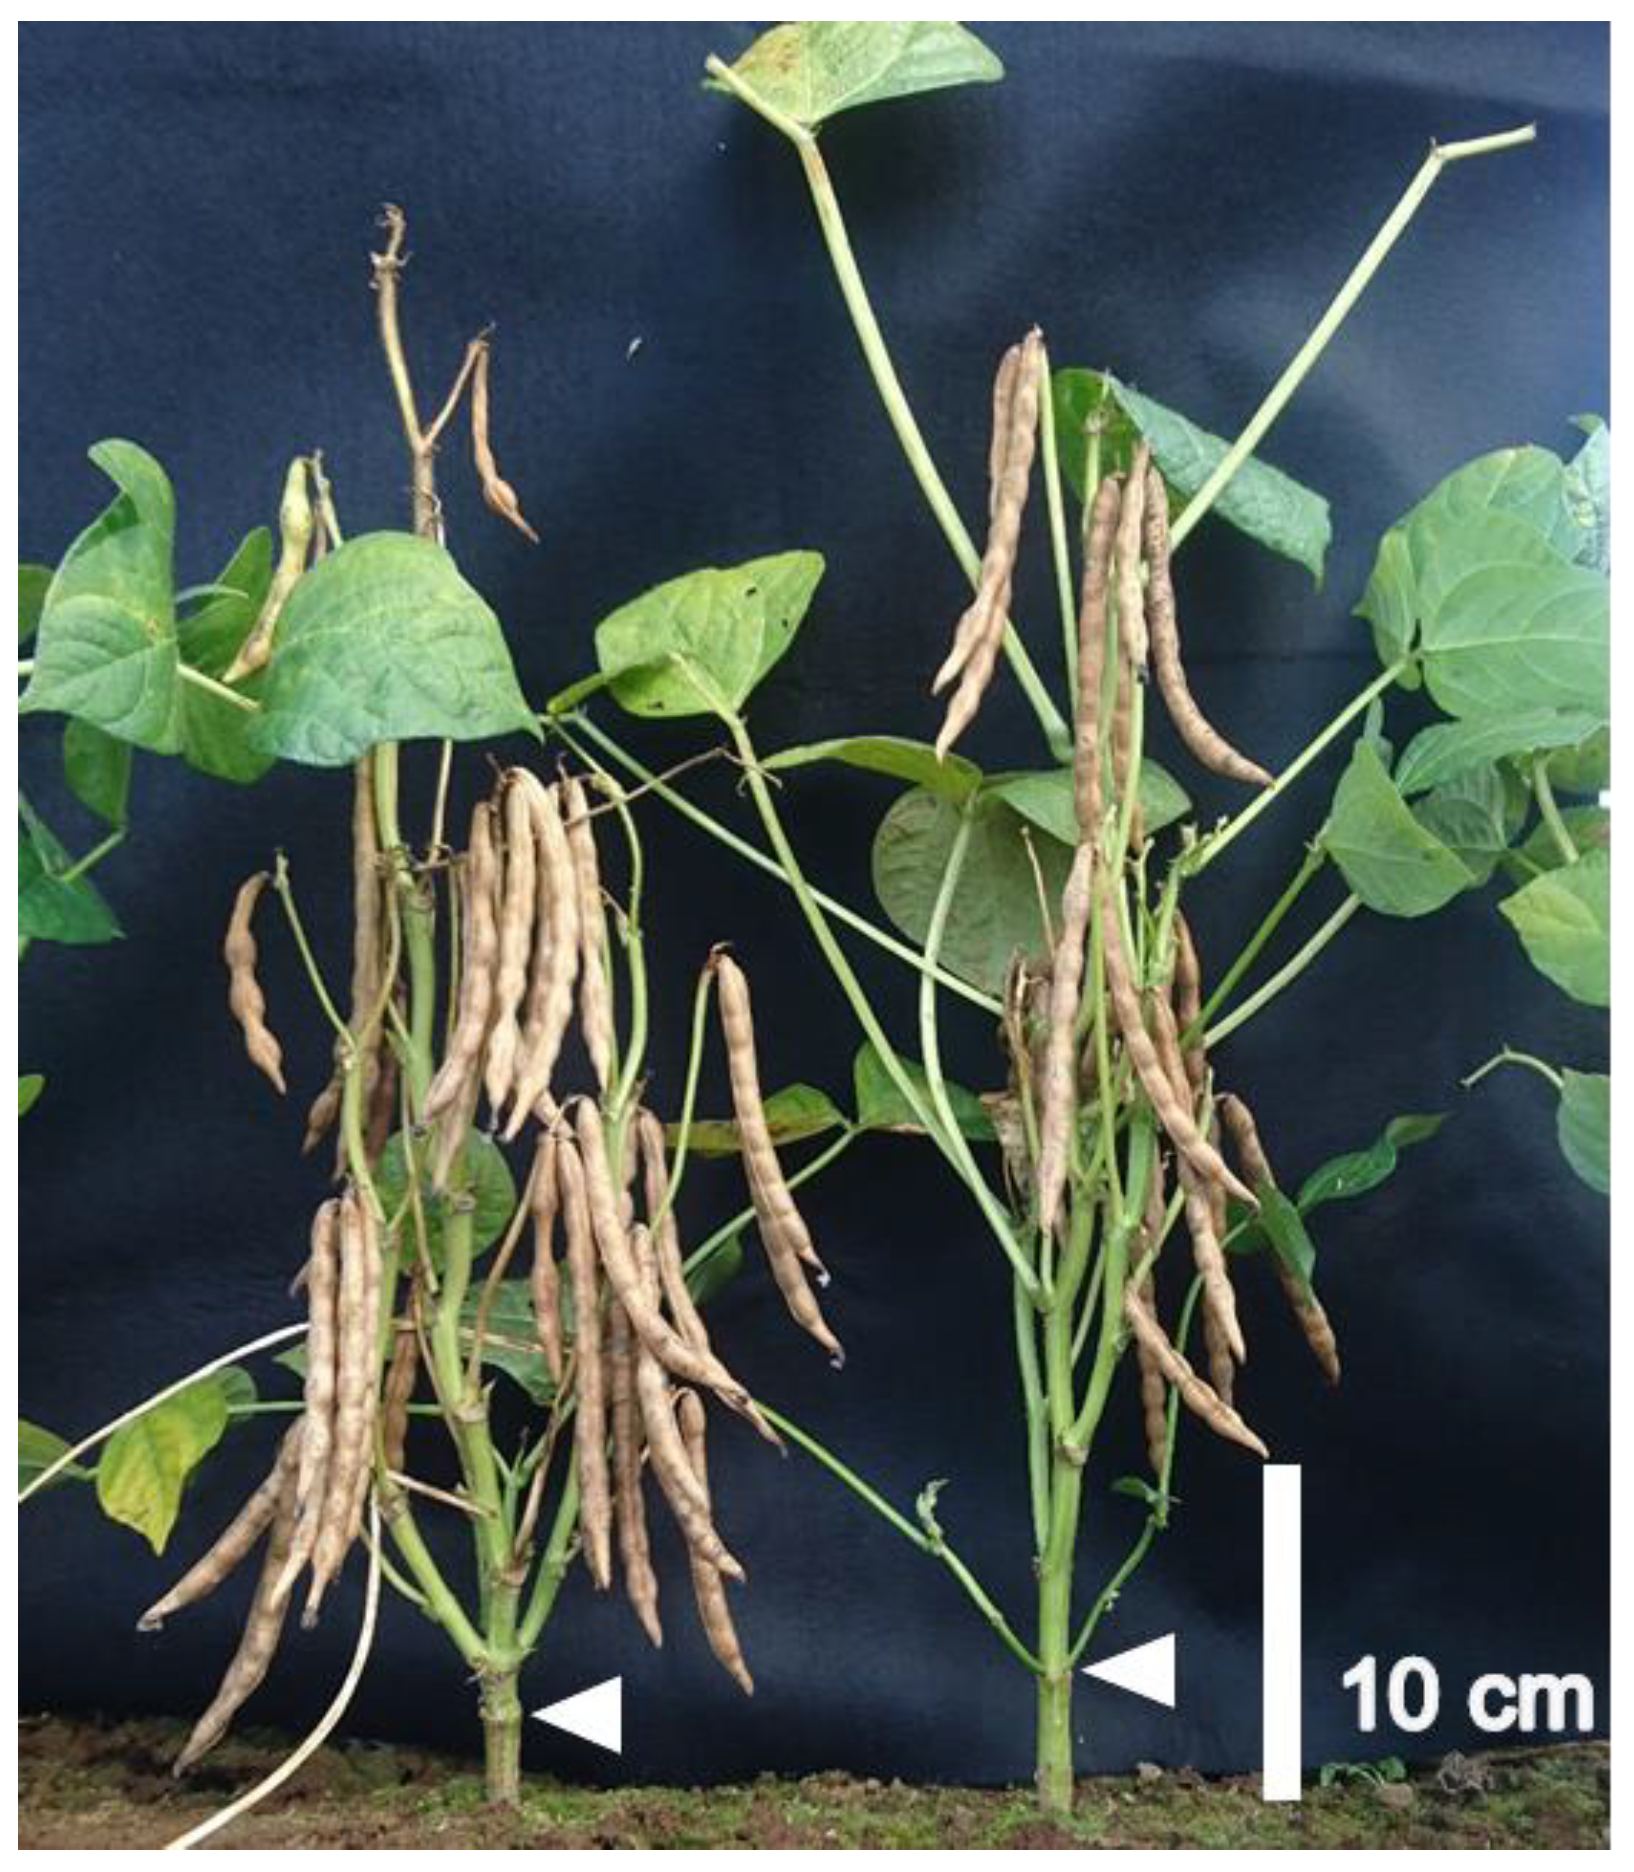
2.1. Plant Materials and Phenotypic Evaluation of RILs

For QTL-seq analysis, an F7 population with 155 individuals was developed by crossing Toiku161 (female parent) with Chihayahime (male parent). Toiku161 is a breeding line with long epicotyls, and Chihayahime is an early maturing cultivar released in 2016 that lacks the long epicotyl trait (Figure 1). Both parental materials were developed by the breeding program at the Tokachi Agricultural Experimental Station (TAES), Hokkaido Research Organization, Japan.
The F7 population and the parental lines were grown in a phytotron maintained at 22 °C during the day and 15 °C at night and a daylength of 16 h. This experiment was conducted from mid-November to mid-December 2017. Because of the short natural day-length (9 to 10 h) at this time, supplemental lighting was provided from 6 to 9-am and from 3 to 10-pm using high intensity LED lighting units (PFQ-300P/DT: Nippon Medical and Chemical Instruments, Osaka, Japan). The photosynthetic photon flux density of supplemental lighting was 1500 µmol m−2 s−1. A paper pot (Nippon Beet Sugar Manufacturing, Tokyo, Japan) with 4.7 cm × 4.7 cm × 5.0 cm depth was used to grow each plant. The paper pot was placed in a plastic tray (60.5 cm × 30.7 cm × 3.0 cm depth) and filled with potting soil (Hokusan, Hokkaido, Japan) containing chemical fertilizer (N 340 mg L−1, P 1350 mg L−1, K 220 mg L−1, pH 6.2). A single seed was planted in the center of each pot at 1.0 cm depth. Twelve plants were grown per line. An adequate amount of water was supplied when the soil surface became dry. The plant trays were rotated every 3 days to minimize positional effects in the phytotron. ECL of the F7 population and the parental lines was measured at 35 days after planting when epicotyl elongation has ceased. ECL was measured from the ground surface to the primary leaf node on the main stem of the plant in 0.1 cm increments. Mean ECL was calculated from the ECL values of each of the 155 individuals in the F7 population and parental line.

2.2. Construction of Sequencing Libraries and Sequencing

From the 155 individuals in the F7 population, 20 individual lines with extreme phenotypes were selected based on ECL phenotyping data in F7 population. The ten (10) lines with lowest mean ECL (over 10% of the total population) were selected for the shorter epicotyl length (SECL) group and the 10 lines with the longest mean ECL were selected for the longer epicotyl length (LECL) group. DNA extracted from these two groups were used to construct the DNA bulking groups following the QTL-seq method described by [6].
Genomic DNA was extracted from the 20 selected lines and parental lines using the DNeasy® Plant Mini Kit (QIAGEN, Venlo, The Netherlands) according to the manufacturers’ protocol. The DNA concentrations were measured with QubitTM dsDNA BR Assay Kits (Life Technologies, Carlsbad, CA, USA) with a Qubit fluorometer 2.0 (Invitrogen, Grand Island, NY, USA), according to the manufacturers’ directions. The DNA concentration of each sample was adjusted to a final concentration of 20 ng µL−1. Equal amounts of DNA from the 10 RILs in the SECL-group and the 10 RILs in the LECL-group were mixed to produce a bulk DNA sample for the SECL-group and the LECL-group, respectively.
Each bulk DNA sample and DNA from the parental lines was fragmented using Covaris S220 conditions that resulted in a fragment length of 300 bp. Libraries were prepared according to the KAPA Hyper Plus Kit manual (Kapa Biosystems, Wilmington, MA, USA) using adapters from the FastGene Adapter Kit (FastGene, Tokyo, Japan). To obtain libraries of the desired DNA size, DNA was fractionated using Labchip XT (PerkinElmer, Waltham, MA, USA) and the concentration of the prepared libraries was measured with the Qubit dsDNA Assay Kit (Life Technologies). The quality of the prepared libraries was then checked using Fragment Analyzer and the dsDNA 915 Reagent Kit (Advanced Analytical Technologies, Ankeny, IA, USA). The prepared libraries were sequenced by paired-end sequencing at 150 bp on a Hiseq X Ten (Illumina, San Diego, CA, USA), with a data output of around 30 Gb per sample.
The QTL-seq pipeline (https://genome-e.ibrc.or.jp/resource/mutmap, accessed on 5 April 2018) was used to estimate the candidate QTL regions following the protocol described by [6]. Firstly, quality control of short reads was performed to exclude reads with low quality values using the FASTX-Toolkit (http://hannonlab.cshl.edu/fastx_toolkit/download.html, accessed on 5 April 2018). To develop a ‘Chihayahime reference sequence’, the sequence reads of Chihayahime were aligned to V. angularis v1.0 reference genome (https://viggs.dna.affrc.go.jp/download, accessed on 5 April 2018) using BWA software ver. 0.5.9-r16 (https://sourceforge.net/projects/bio-bwa/files, accessed on 5 April 2018) and SNPs were detected using SAM tools [7]. A synthetic ‘Chihayahime reference sequence’ was constructed by replacing the detected SNPs with DNA sequence from the V. angularis v1.0 reference genome. In order to increase the accuracy, for subsequent analyses, additional SNPs were detected by re-aligning the short reads from the Chihayahime parent to the constructed ‘Chihayahime reference sequence’. The short reads containing SNPs detected at this stage were not used in subsequent analyses because they were considered to contain false-positive SNPs. SNP-index and Δ(SNP-index) were calculated to identify genomic regions for ECL, following [6,8,9]. SNP-index was referred to as to the proportion of reads with SNPs different from the reference parent (Chihayahime) sequence. To calculate SNP-index values for the SECL-group and LECL-group samples, sequence reads were first aligned to the ‘Chihayahime reference sequence’ using BWA software. High-quality SNPs were identified by mapping the short reads of both SECL and LECL groups with an average read depth of ≥10, using SAMtools [7] and based on the protocol described by [6]. The SNP-index was calculated for each bulked sample using the formula: SNP-index (at a position) = count of alternate base/count of reads aligned. Differences in SNP-index values (Δ(SNP-index)) were calculated by subtracting the SNP-index of the SECL-group from the SNP-index of the LECL-group for each identified SNP across the genome at 2 Mb intervals using a 50 Kb sliding window.

2.3. Phenotypic Trait Evaluation of F2 Population

An F2 population with 96 individuals was also used to detect QTLs for ECL. These plants were obtained by self-pollinating F1 seed derived from a cross between Chihayahime (female parent) and Toiku161 (male parent).
The F2 population and four plants of each parent were grown in the experimental field of TAES in 2018. Single seeds per planting station were planted at 60 cm ridge spacing and 20 cm within ridge plant spacing with 3 to 4 cm planting depth. ECL was measured 35 days after planting, at a time when the epicotyls were fully extended.

2.4. Genome-Wide Detection of SNPs and InDels, and Marker Analysis

SNPs and InDels between Toiku161 and Chihayahime were detected using GATK software ver. 3.8 (https://doi.org/10.1101/gr.107524.110, accessed on 12 December 2019) [10]. To remove adapter sequences and low-quality reads, the raw data were cleaned using Trimmomatic ver. 0.38 (https://doi.org/10.1093/bioinformatics/btu170, accessed on 12 December 2019) [11]. After trimming, only sequences with paired-end reads were aligned to the V. angularis v1.0 reference genome (https://viggs.dna.affrc.go.jp/download, accessed on 12 December 2019) using BWA ver. 0.7.17 (https://doi.org/10.1093/bioinformatics/btp324, accessed on 12 December 2019) [12] and SAMtools ver. 1.9 (https://doi.org/10.1093/bioinformatics/btp352, accessed on 12 December 2019) [7]. Duplicate reads sequenced multiple times were deleted using picard ver. 2.18.23 (http://broadinstitute.github.io/picard, accessed on 12 December 2019). Realignment of short reads close to insertion and deletion regions was performed using GATK. The SNPs and InDels identified were filtered to retain those with a mapping quality of ≥30 and minimum read depth of 10. Sequence variants between Toiku161 and Chihayahime were estimated from SNP/InDel information detected between Toiku161 and the V. angularis v1.0 reference genome, and between Chihayahime and the reference genome, respectively. InDel markers were developed based on SNP/InDel information between Toiku161 and Chihayahime. A total of 97 InDel markers listed in Table S1 were designed using Primer3Plus (https://primer3plus.com/cgi-bin/dev/primer3plus.cgi, accessed on 12 December 2019).
The PCR reaction solution for marker analysis comprised 2.9 µL sterile water, 0.05 µL each 100 pmol Forward and Reverse primers (0.05 µM final concentration per primer), 5 µL GoTaq Master Mix (Promega, Madison, WI, USA) and 2 µL DNA (4 ng µL−1 final concentration), making a total mixture of 10 µL. The PCR reaction conditions included an initial heat denaturation at 95 °C for 2 min, followed by 35 cycles with denaturation at 95 °C for 15 s, annealing at 55 to 60 °C for 15 s and extension at 72 °C for 30 s; and a final extension step at 72 °C for 2 min. The PCR products were separated by electrophoresis at 200 V for 30 min on 4% agarose gels in 1× TAE buffer. The gels were stained in 1:10,000 solution (0.5–1 ng µL−1 final concentration) ethidium bromide for 15 min and the PCR products were visualized by UV radiation.

2.5. QTL Analysis Using Linkage Mapping of the F2 Population

A linkage map was constructed using JoinMap® ver.5 [13], based on the genotypes of the 96 individuals in the F2 population. Genetic distances (cM) were calculated using the Kosambi map function [14].
QTL analysis was conducted using MapQTL® ver. 6 [15]. A permutation test was conducted using 1000 permutations at 5% LOD value significance, adopted as threshold level. Interval Mapping (IM) analysis was performed and if any LOD peak exceeded the significance threshold, the closest marker to the peak was set as the cofactor for Multiple QTL Mapping (MQM) analysis using MapQTL® ver. 6.

2.6. Interaction Assessment between Major QTLs

To analyze potential interaction between two major QTLs, qECL7.1 and qECL10.1 (described in results), four F2 plants (Plant ID: #236, #223, #206, and #286) were selected using DNA markers flanking qECL7.1 and qECL10.1. For this analysis, four DNA markers were used, TC64 and TC66 for qECL7.1, and TC87 and TC89 for qECL10.1, (Table S1). Plants #236 and #223 are heterozygous for the parental sequences in the qECL7.1 region, while plant #236 is homozygous for the Chihayahime sequence and #223 is homozygous for the Toiku161 sequence in the qECL10.1 region. On the contrary, plants #206 and #286 are heterozygous for parental sequences at qECL10.1, while plant #206 is homozygous for the Chihayahime sequence and #286 is homozygous for the Toiku161 sequence at qECL7.1. These four F2 plants were self-pollinated and generated four F3 RHLs.
The four F3 RHLs were grown in a growth chamber (LPH-411SP: Nippon Medical and Chemical Instruments, Osaka, Japan). Seeds were sown in 5 cm × 5 cm × 5.5 cm depth planting trays filled with potting soil at a sowing depth of 2 cm. The temperature was daytime 22 °C (16 h) and nighttime 15 °C (8 h) and photosynthetic photon flux density was 360 µmol m−2 s−1. Pots were irrigated on the sowing day and the tray was covered with a plastic sheet to retain moisture for the first 3 days. Thereafter, supplementary irrigation was applied as needed. The plant trays were rotated daily to minimize positional effects in the chamber. The ECL survey was conducted 21 days after sowing, due to adequate light condition that promoted rapid growth of plant materials.

2.7. Fine Mapping of qECL7.1

A total of six DNA markers consisting of InDel, CAPS, dCAPS and SNP markers were designed using Primer3Plus (https://primer3plus.com/cgi-bin/dev/primer3plus.cgi, accessed on 12 December 2019) to find different recombination points in the qECL7.1 region (Table S2). Self-pollinating plant #223 and genotyping inbred progeny over several generations generated five recombinant lines with different recombination sites. These included three F5 (#223_81_75, #223_112_347, #223_160_46) and two F6 (#223_95_178_193, #223_91_134_15) generations. In addition, two F5 lines (#223_105_7 with Chihayahime sequence and #223_105_1 with Toiku161 sequence) that were homozygous for large unrecombined regions within the qECL7.1 region, were chosen as isogenic controls.
The five recombinant lines and two lines with parental sequence were grown in a growth chamber as described above. Eleven seeds resulting from self-pollination of each line were planted and the ECL was measured 21 days after sowing. The plant trays were rotated daily to minimize positional effects in the chamber. The chromosomal region containing qECL7.1 was refined by comparing phenotypes and genotypes among the recombinant and nonrecombinant control plants.
Sequence information (V. angularis v1.0) and inferred gene information (Gene structure and function information) downloaded from VIGGS (https://viggs.dna.affrc.go.jp, accessed on 29 October 2020) were imported into the Integrative Genomics Viewer (IGV: https://software.broadinstitute.org.software/igv, accessed on 29 October 2020), to identify predicted genes within the qECL7.1 region.

2.8. Statistical Analysis

To determine statistically significant differences, the mean ECL of the recombinant lines and parent lines used in the fine-mapping analysis were compared against control line #223_105_7 using Dunnett’s test at p < 0.01 in R software version 3.6.2 [16].

3. Results

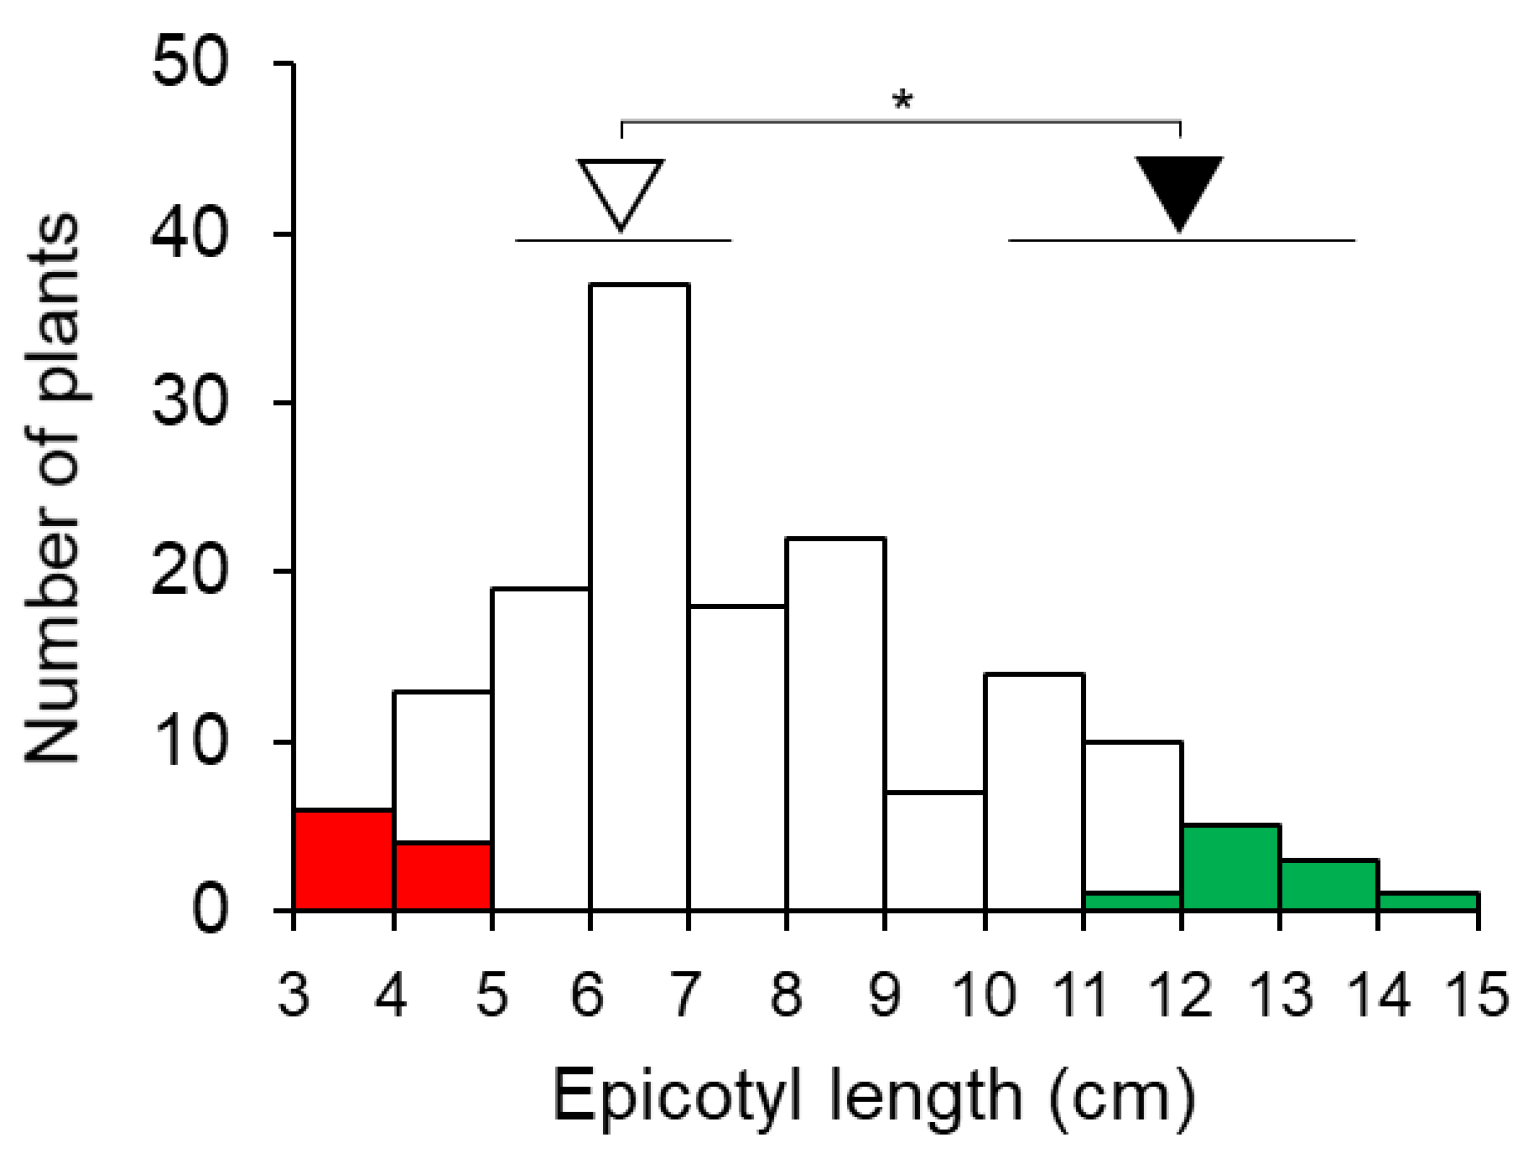
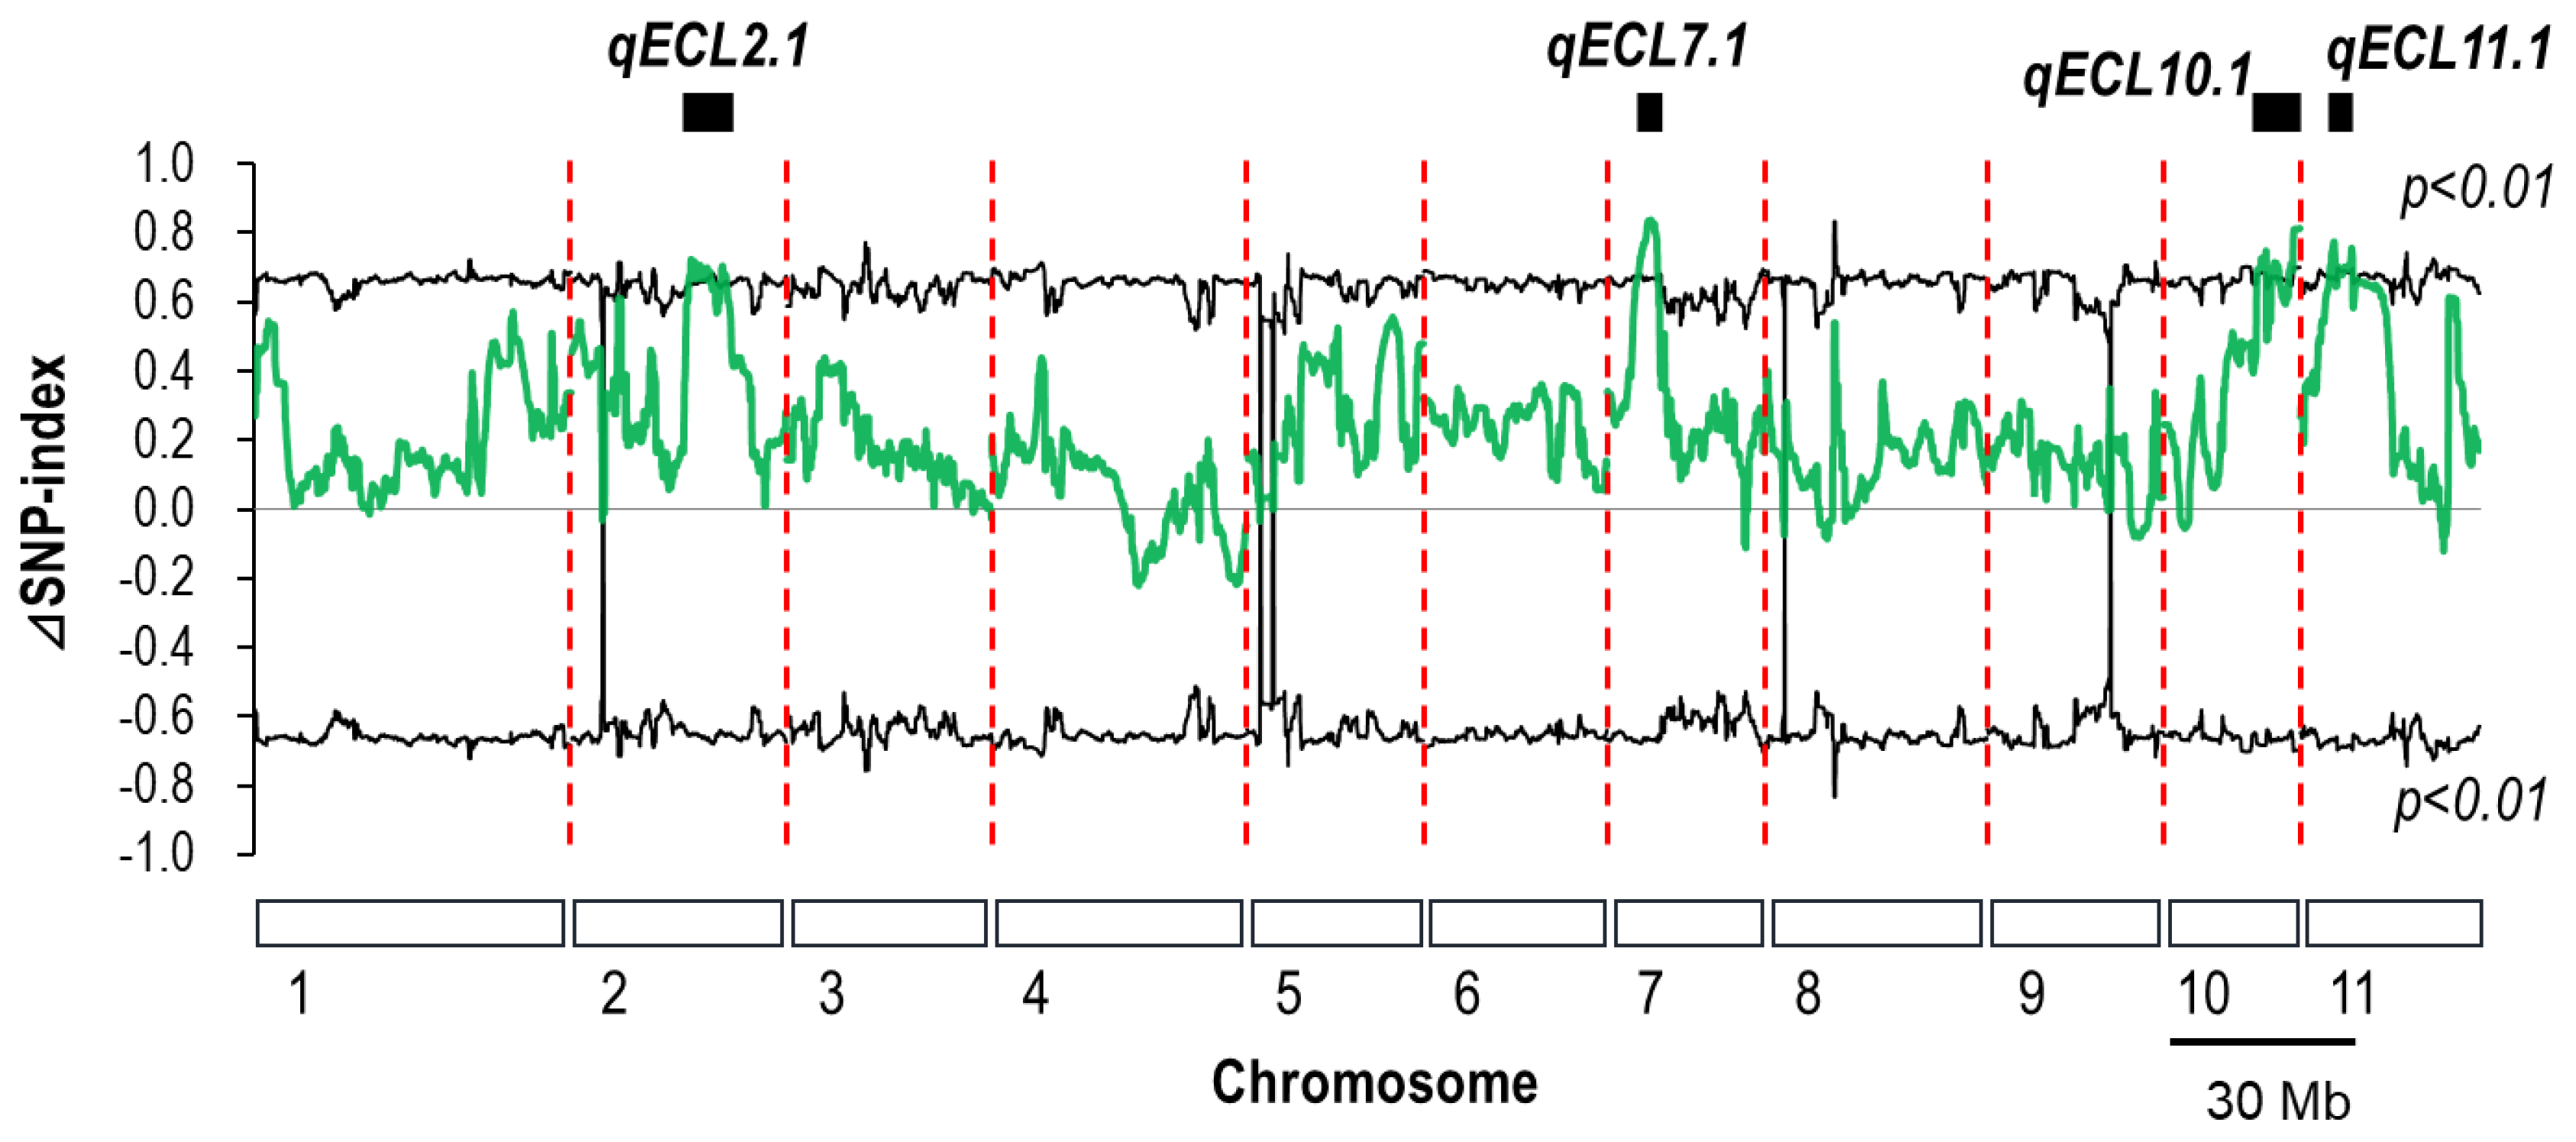
3.1. QTL-Seq Analysis for Epicotyl Length in F7 RILs

The frequency distribution of ECL showed a continuous variation in the 155 F7 RILs (Figure 2). The ECL of the female parent Toiku161 was significantly longer at 12.1 cm than that of the male parent Chihayahime at 6.5 cm. The ECL in the F7 RILs ranged from 3.2 cm to 14.1 cm with a mean length of 7.7 cm. Transgressive segregating RILs were observed with shorter ECL than Chihayahime and longer ECL than Toiku161.
Based on the F7 population phenotypic data, 10 lines with the longest epicotyls and 10 lines with the shortest epicotyls were selected for DNA extraction and preparation of the LECL and the SECL DNA pools used for the QTL-seq analysis. The ECL of RILs in the LECL-group ranged from 12.0 to 14.1 cm while RILs in the SECL-group had ECLs which ranged from 3.2 to 4.4 cm. Mean epicotyl lengths were of 12.9 ± 0.8 cm and 3.9 ± 0.4 cm for the long and short groups, respectively (Figure 2).
A Manhattan plot of Δ(SNP-index) for the LECL and SECL groups was generated for chromosomes 1 to 11 at 95% and 99% confidence intervals (Figure 3 and Figure S1). Values of Δ(SNP-index) that exceeded the QTL threshold at the 99% statistical level were identified at four locations, on Chromosomes 2, 7, 10 and 11 (Figure 3). The QTLs were named qECL2.1, qECL7.1, qECL10.1 and qECL11.1 (quantitative trait locus for EPICOTYL LENGTH 2.1, 7.1, 10.1 and 11.1). At qECL7.1, one peak was detected above the QTL threshold between 6.50 and 10.65 Mb and at qECL10.1 multiple peaks were detected between 19.75 to 28.85 Mb with the largest peak between 26.55 and 28.85 Mb (Table 1). No distinct peaks could be detected at qECL2.1 and qECL11.1. All detected QTLs had a positive Δ(SNP-index) value indicating presence of a QTL where the Toiku161 genotype contributes to long epicotyls.

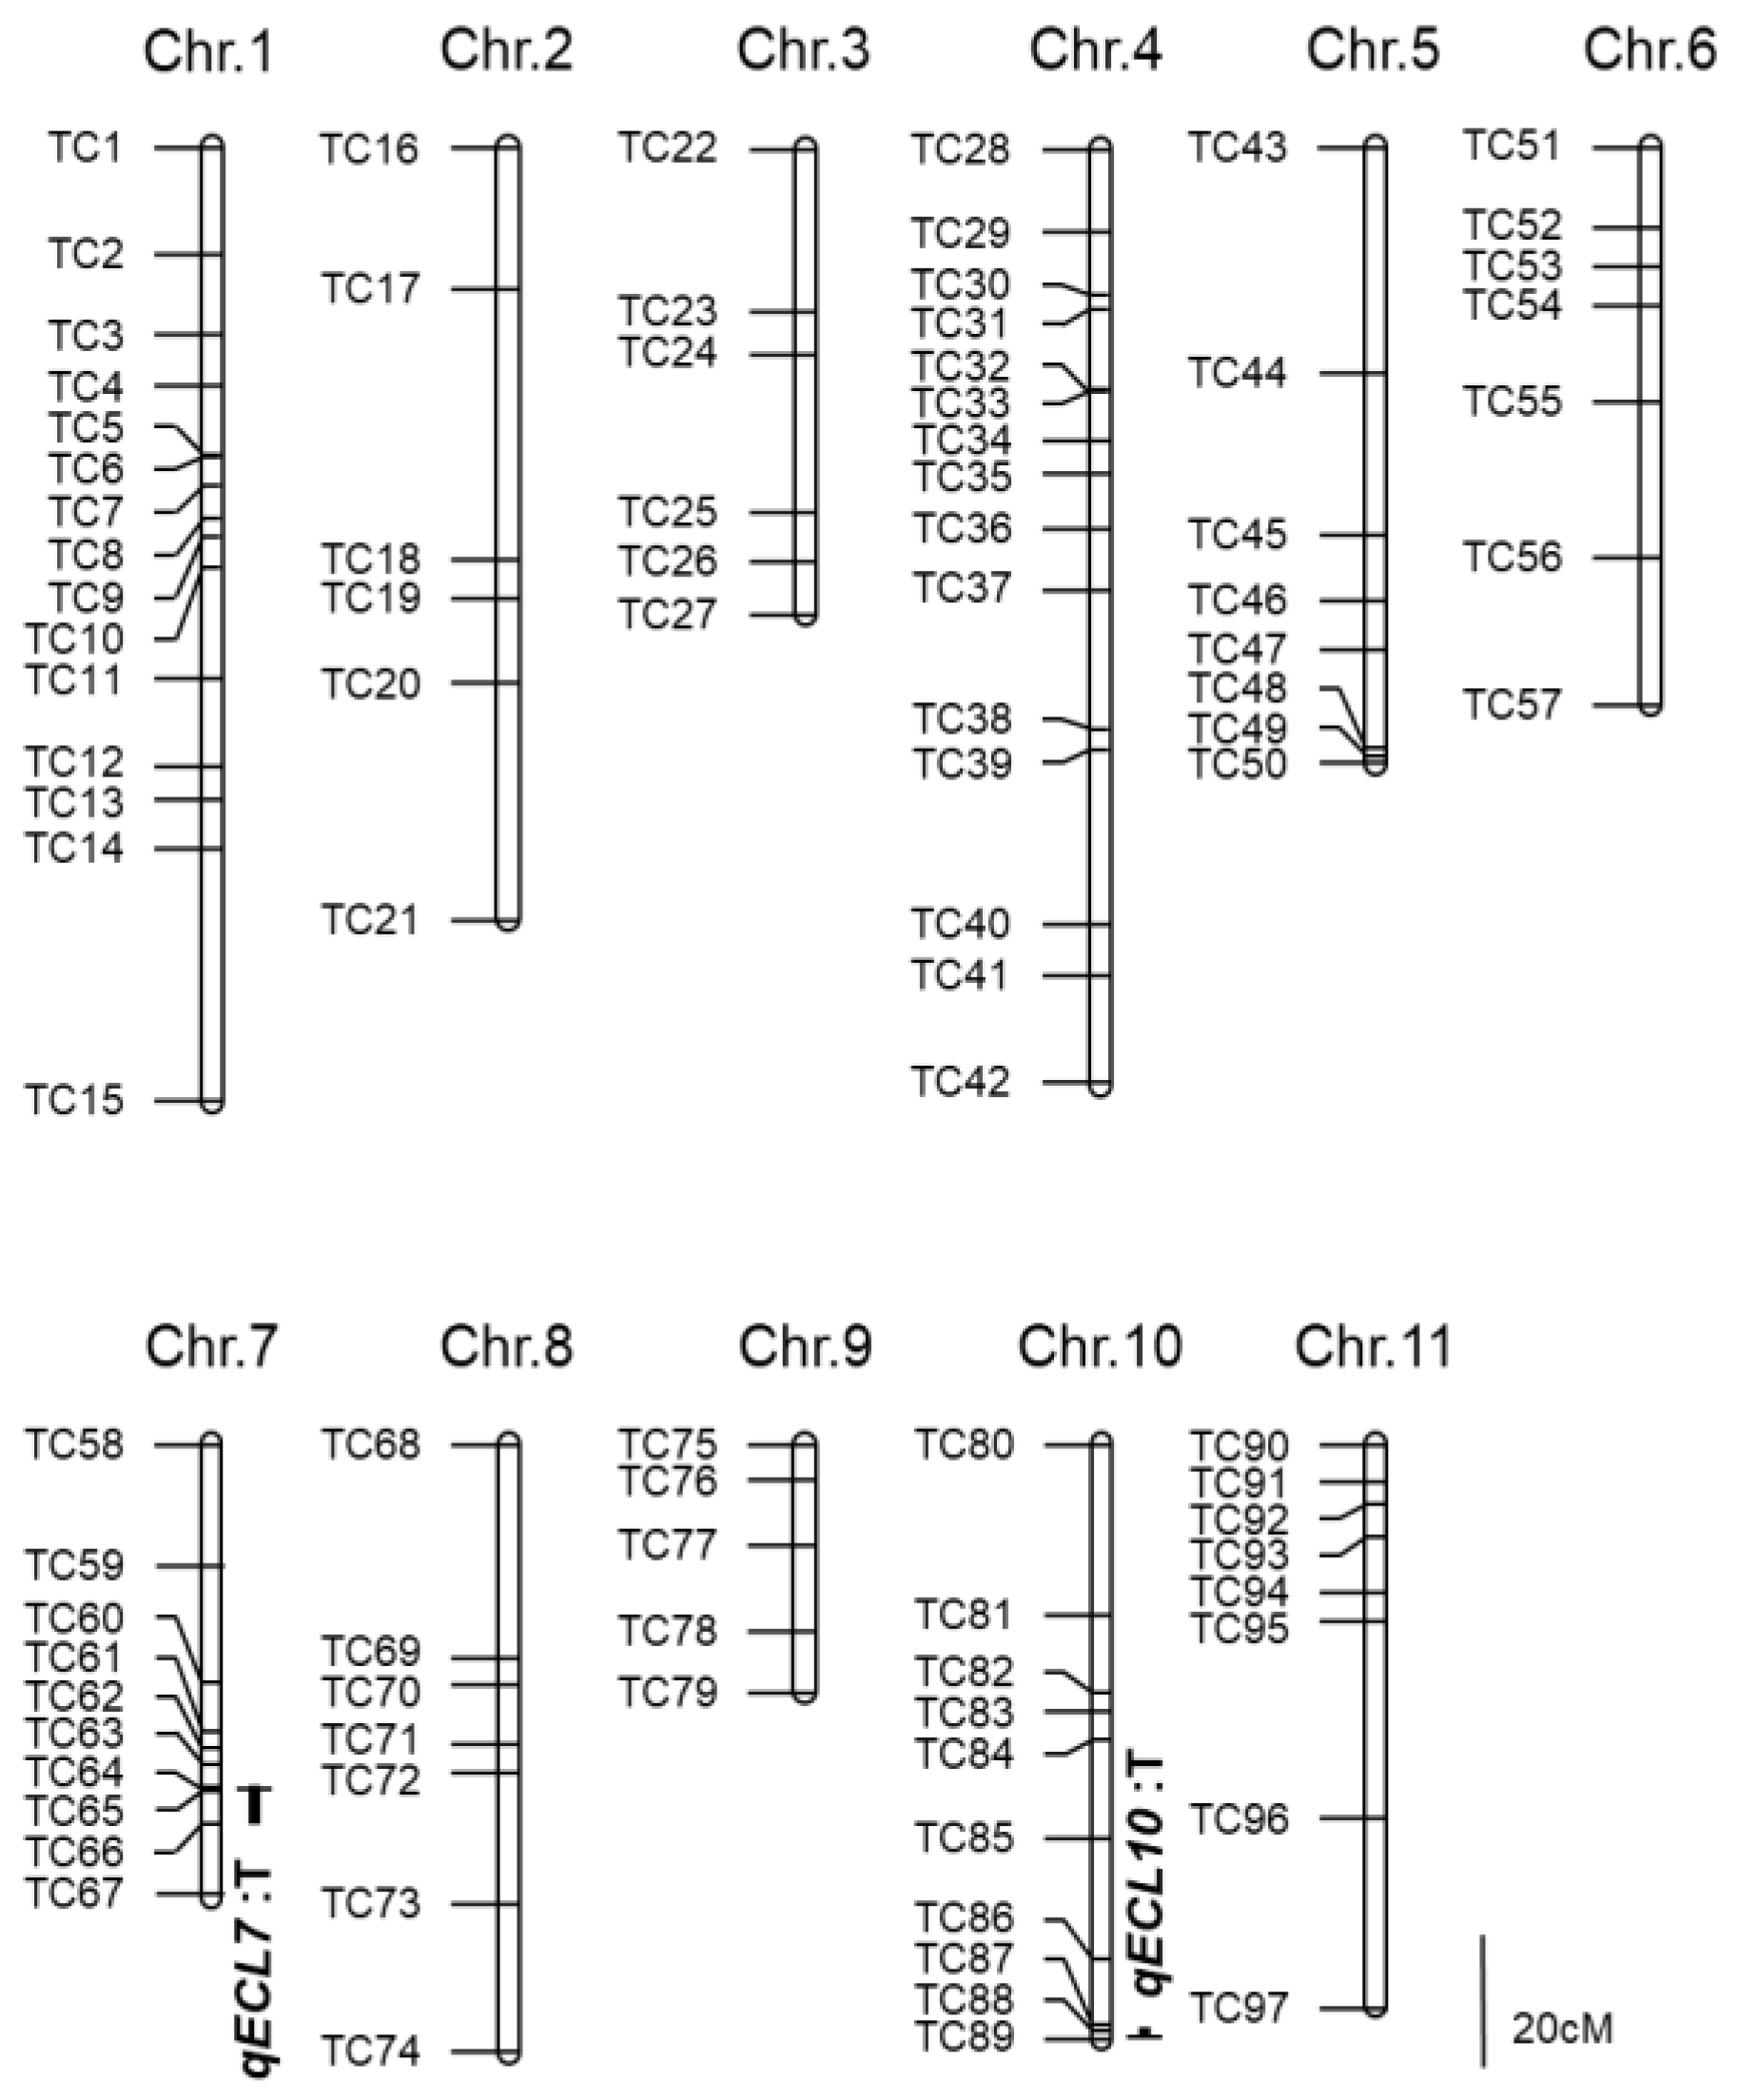
3.2. QTL Detection by Linkage Mapping

Multiple QTL mapping was performed in an F2 population to detect candidate genomic regions for ECL. The ECL for Toiku161 was approximately 2 cm longer than Chihayahime (Figure S2). The F2 population showed a continuous distribution in ECL between 2.5 cm and 8.2 cm with transgressive segregating individuals having a shorter ECL than Chihayahime and a longer ECL than Toiku161 (Figure S2). A linkage map was constructed using 97 InDel markers (Figure 4) that covered a genetic distance of 1008.1 cM, representing 92.1% of the adzuki bean genome. On chromosome 7, qECL7.1 had a peak position at 51.1 cM that was associated with marker TC64 at 9,479,153 Mb physical position, flanked by markers TC63 and TC66 (Table 2 and Table S1). On Chromosome 10, qECL10.1 had a peak position at 88.4 cM associated with marker TC89 at 28,568,685 Mb physical position, flanked by markers TC87 and TC89 (Table 2 and Table S1). The peak for qECL7.1 had 6.7 LOD value and 21.2% of phenotypic variance explained, while qECL10.1 had 4.4 LOD value and 13.4% of phenotypic variance explained. The additive effect of qECL7.1 (−0.8 cm) was slightly higher than that of qECL10.1 (−0.6 cm). At both loci, the Toiku161 sequence contributed to longer ECL. The physical positions of these two QTLs corresponded to the genomic regions for the qECL7.1 and qECL10.1 detected by the QTL-seq method (Table S1). The F2 population mapping study did not detect ECL QTLs on chromosomes 2 and 11 but did detect QTLs on chromosomes 7 and 10 that are consistent with QTLs qECL7.1 and qECL10.1 (Figure S3).

3.3. Interaction between qECL7.1 and qECL10.1

Four F2 plants (#236, #223, #206 and #286) and F3 RHLs derived from each plant were used to analyze the interaction between qECL7.1 and qECL10.1. The distribution of ECL for each of the four F3 RHL is shown in (Figure 5).
A mono modal distribution was observed in the ECLs of F3 RHLs #236 ranging from 2.8 to 4.0 cm (mean 3.3 ± 0.3 cm) and #206 ranging from 2.5 to 4.3 cm (mean 3.3 ± 0.4 cm). A bimodal distribution was observed in the ECL of RHLs #223 ranging from 2.3 cm to 8.9 cm (mean 4.7 ± 2.0 cm) and #286 ranging from 2.7 to 9.7 cm (mean 5.0 ± 2.0 cm). RHLs with a bimodal distribution could be divided into two groups. The 126 RHLs from #223 included 93 plants with short epicotyls (ECL ≤ 5.4 cm) and 33 plants with long epicotyls (ECL ≥ 6.4 cm). The 82 individuals from #286 included 56 plants with short epicotyls (ECL ≤ 5.2 cm) and 26 plants with long epicotyls (ECL ≥ 6.4 cm). These segregation patterns fit a monogenic 3:1 ratio, indicating that recessive genes at qECL7.1 and qECL10.1 from Toiku161 may contribute to the long epicotyl phenotype.
Plants in the F3 RHLs derived from plant #223 that were classified as Toiku161-homozygous at qECL10.1 had significantly longer mean ECL (6.5 ± 0.5 cm) than those classified as Chihayahime (2.6 ± 0.2 cm) homozygous or heterozygous plants. In the #286 RHLs, plants classified as Toiku161-homozygous at qECL7.1 showed significantly longer mean ECL (mean 6.6 ± 1.1 cm) than plants classified as Chihayahime (2.8 ± 0.4 cm) homozygous or heterozygous plants. The Toiku161 effect for increasing ECL at qECL10.1 was likewise observed in the Toiku161 homozygous class at qECL7.1, but not in the classes that were heterozygous and homozygous for the Chihayahime sequence at qECL7.1. Hence, the results indicate that there is an interaction between the two loci for ECL on chromosomes 7 and 10.

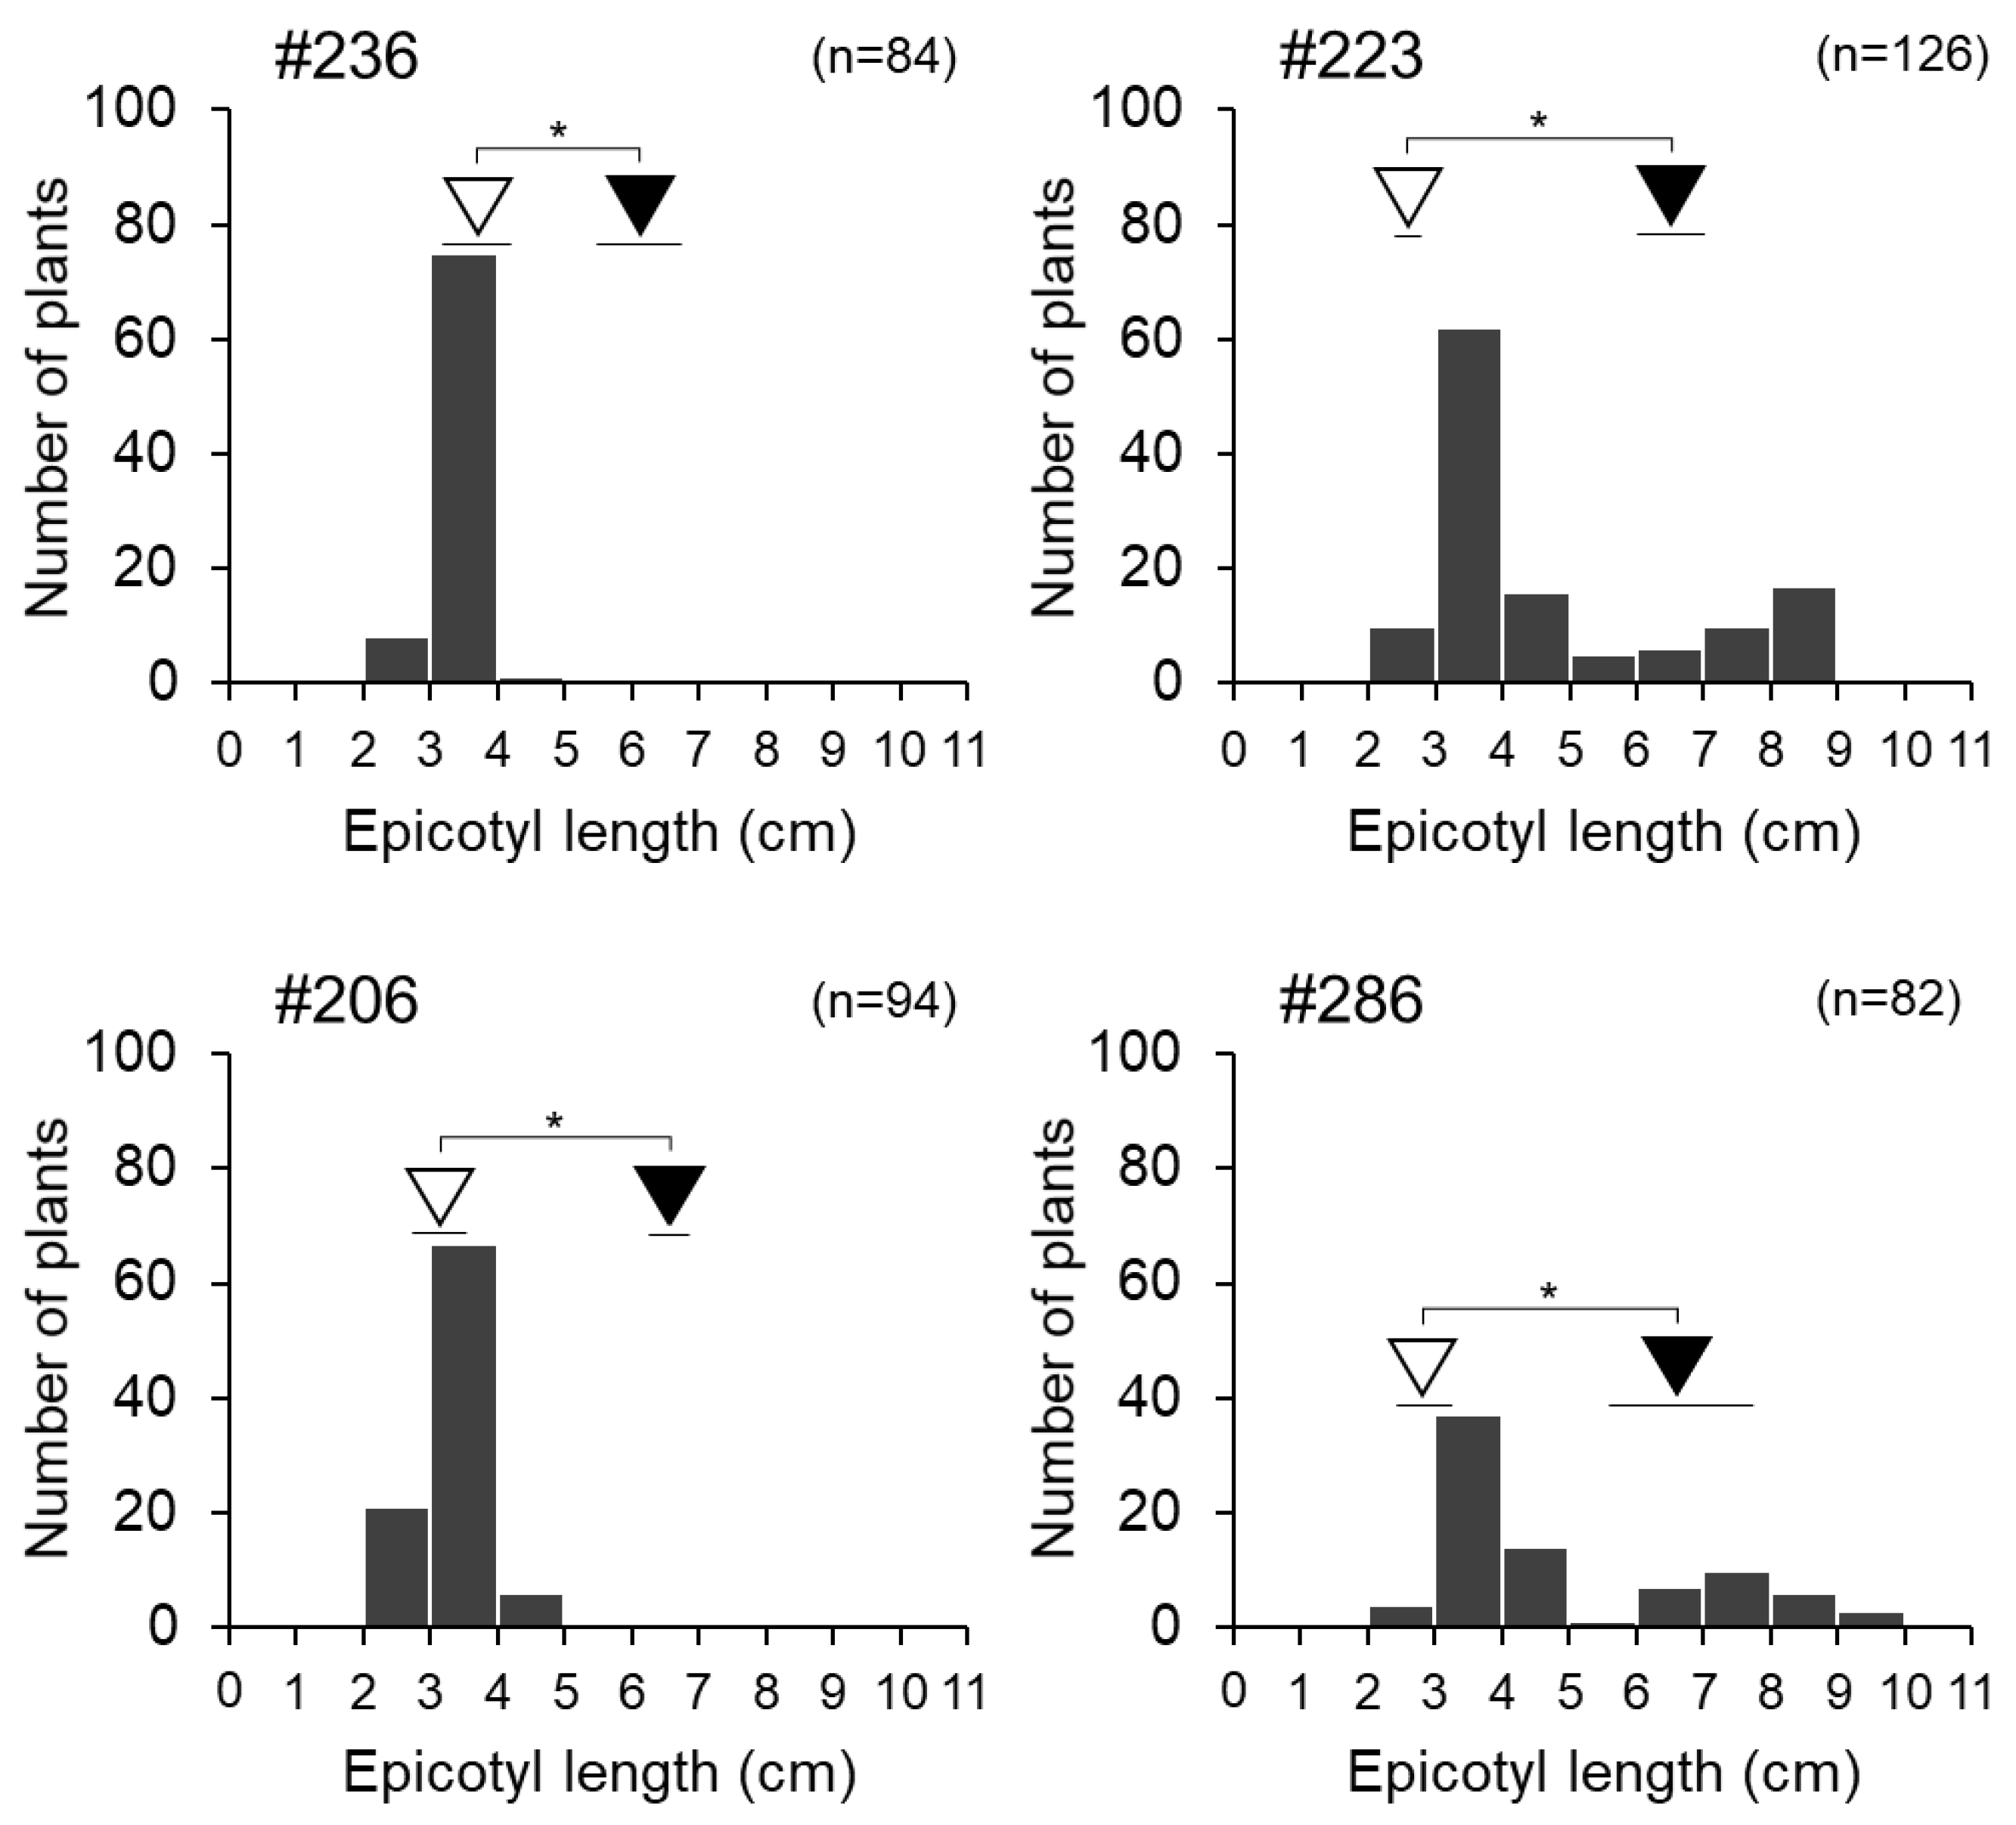
3.4. Fine Mapping of Epicotyl Length QTL qECL7.1 on Chromosome 7

The genetic position of qECL7.1 on chromosome 7 was refined using substitution lines produced by self-pollinating plant #223. Based on the phenotypic analysis, #223_112_347, which was classified as Toiku161 homozygous (7.3 ± 0.8 cm) at marker TC64 to TC101, showed significantly longer epicotyls than that of Chihayahime. Line #223_81_75, which was homozygous for Toiku161 at marker TC64 to TC102, likewise showed significantly longer epicotyls (7.0 ± 0.7 cm) than Chihayahime. The mean ECLs for #223_112_347 and #223_81_75 did not differ from that of the Toiku161 control line (6.9 ± 0.7 cm) (Table 3). Plants classified as Chihayahime-like showed ordinary ECLs and mean ECL for #223_160_46 (3.9 ± 0.6 cm), #223_95_178_193 (4.0 ± 0.4); and #223_91_134_15 (4.0 ± 0.5 cm) was not different from that of the Chihayahime control line (3.4 ± 0.5 cm) (Table 3). Thus, the phenotypic classification appeared to be linked with genotype classes that were homozygous for the Toiku161 allele and for the Chihayahime allele. Detailed mapping of the ECL trait on chromosome 7 showed that qECL7.1 was linked to markers TC99 and TC102. The candidate genomic region of qECL7.1 covers 418 kb between TC99 at 10,211,134 bp and TC102 at 10,628,880 bp physical position (Table 3). According to gene prediction models in VIGGS (https://viggs.dna.affrc.go.jp, accessed on 29 October 2020), 35 putative genes (Table 4) are contained within the 418 kb region of qECL7.1. Annotations for these genes include three non-protein coding genes, seven hypothetical proteins, 18 uncharacterized proteins and seven genes with putative functions.

4. Discussion

ECL is a key agronomic trait of adzuki bean. An important goal of adzuki bean breeding programs is the development of cultivars with increased ECL, within the range 6 to 8 cm [3]. ECL is a naturally complex trait in legumes, controlled by one or multiple genes and QTLs [8,17]. An in-depth analysis of genetic mechanisms underlying complex traits such as ECL is therefore necessary for successful identification and fine-mapping of genomic regions contributing to crop improvement.
In this study, four QTLs for ECL were detected by QTL-seq on chromosomes 2 (qECL2.1), 7 (qECL7.1), 10 (qECL10.1) and 11 (qECL11.1) in an F7 population developed from parental linesToiku161 and Chihayahime. Linkage mapping in F2 population detected one QTL on chromosome 7 (qECL7.1) and one QTL on chromosome 10 (qECL10.1). Since both qECL7.1 and qECL10.1 were identified at the same chromosomal region using two different analysis approaches, it is likely that these two are consistent QTLs. In the present study, qECL10.1 had a peak position associated with marker TC89 at 28,568,685 bp. Previously, qECL10 was mapped to a 28,630,875 bp region at the terminal end of chromosome 10 using a RHL population developed from a cross between breeding line Tokei1121 (long epicotyls) and cultivar Erimo167 (ordinary length epicotyls) [3]. The data suggest that qECL10 and qECL10.1 are within the same region. Substitution mapping narrowed the chromosomal region of qECL7.1 to a 418 kb region flanked by DNA markers TC99_10,211,134 bp and TC102_10,628,880 bp on chromosome 7. The expected physical position of qECL7 detected by [3], using an F2 population derived from Tokei1121 and Erimo167 was in 28.0 Mbp region. Alleles from the long epicotyl parents (Toiku161 and Tokei1121) at both loci increased ECL. The loci of qECL7.1 and qECL7 are about 18 Mbp apart, suggesting that they may be different QTLs. However, the study could not confirm this result due to the narrow chromosome 7. Thus, further studies are needed to determine if two different ECL-genes are present on chromosome 7, or if they are the same.
This study used substitution mapping to narrow down qECL7.1 to the 418 kb region described above [18]. Annotation analysis using the VIGGS database (https://viggs.dna.affrc.go.jp, accessed on 29 October 2020) predicted 35 genes in the qECL7.1 region. However, because the molecular function of qECL7.1 is unknown, it was difficult to precisely identify candidate genes predicted in the qECL7.1 region that contribute to ECL. Annotation of variants between parent lines revealed a mutation in the 5′ untranslated region (5′ UTR) of Vigan 07G1141000.01 that is similar in sequence to the kinesin-like protein found in soybean. Kinesins are adenosine triphosphate (ATP)-dependent biological motor proteins, that function to transport molecules along microtubules, segregate chromosomes and elongate organelles [18]. No mutations were detected in the protein coding region of this gene and the insertions observed in the 5′UTR region had many repeated sequences. Therefore, the present study could not confirm that Vigan 07G1141000.01 is the gene responsible for qECL7.1. The mutations in Chihayahime and Toiku161 may have altered the expression of Vigan 07G1141000.01, suppressed the transportation of essential cell wall molecules and reduced the cell elongation in epicotyls. In addition, there could be undetected mutations in the qECL7.1 region that may affect the function and expression of genes in the candidate region. Therefore, further studies are needed to test whether differences exist in the transcription and translation of Chihayahime and Toiku161 Vigan 07G1141000.01.
Transgressive segregation was observed in the F2 population. Two QTLs, qECL7.1 and qECL10.1, were identified in this study, and only the allele derived from Toiku161 showed an effect of increasing ECL. Beneficial alleles were not identified in the ordinary ECL parent Chihayahime. The identified QTLs, qECL7.1 and qECL10.1, explained 21% and 13% of the phenotypic variation for ECL in the adzuki bean mapping population, respectively. The constructed linkage maps covered approximately 92% of the whole adzuki bean genome, although there were large gaps between DNA markers in some regions. Therefore, there may be additional unidentified loci in the mapping population that contribute to ECL.
This study applied the QTL-seq method to take advantage of high-throughput genome sequencing and bulked segregation analysis (BSA). Based on a 2 Mb and 50 kb sliding window, four QTL regions qECL2.1, qECL7.1, qECL10.1 and qECL11.1 were identified. The QTL-seq methodology has proved useful in accurate determination of QTL regions, as it mainly requires whole genome resequencing of distinct DNA bulks rather than individual genotyping of an entire population [19,20]. Furthermore, the availability of a draft genome assembly facilitates the QTL sequencing process since initial marker development is not necessarily required. QTL-seq has been applied to legume crops including; soybean (Glycine max) plant height [8]; chickpea (Cicer arietinum) 100 seed weight [21]; pod number [22]; flowering time [23]; aschochyta blight resistance [9]; pigeon pea (Cajanus cajan) flowering time and leaf shape [24]; ground nut (Arachis hypogaea) fresh seed dormancy; and leaf spot resistance [25]. For adzuki bean, many putative genes are contained within each identified QTL with approximately 329 genes in the qECL7.1 region and 690 genes in the qECL10.1 region. This study used ten individual lines per DNA bulk, which may not capture the full extent of variation and recombinants in the mapping population. Further refinement of the qECL7.1 region is recommended using a larger population having more recombinants between DNA markers that co-segregate with the genomic region. This may allow for identification of candidate genes responsible for the ECL trait, and genomic regions with high utility for marker-assisted selection [24].
Mapping and isolation of QTLs promotes efficiency in crop breeding through marker-assisted selection and enhances understanding of molecular mechanisms associated with traits of interest [6,26]. To facilitate the use of study findings in breeding programs, it was important to understand the interaction between detected ECL QTLs. An assessment of F3 lines from plant #223 and plant #286 in this study, indicated that both qECL7.1 and qECL10.1 had the Toiku161 effect for increasing epicotyl length, indicating the presence of an epistatic interaction between the two loci [26]. In adzuki bean, epistatic reactions are critical genetic factors for ECL and specific pathways including qECL10 and qECL7 underline the genetic control mechanism for ECL [3]. In soybean, 11 epistatic loci and nine candidate genes associated to internode number were identified, and 10 epistatic loci and 10 epistatic candidate genes associated to plant height were identified [27]. In addition, significant additive effects were detected in 11 QTLs for plant height among which six QTLs had additive by environment interaction effects. Of six digenic epistatic QTL pairs, four QTLs had additive effects for plant height [28]. The significant epistatic interaction detected in soybean derived additive effects from both parent lines. In the present study, epistatic interactions between qECL7.1 and qECL10.1 mainly derived additive effects from the Toiku161 parent allele. Detailed genomic analysis, using near isogenic lines (NILs) of the QTLs, for example, will be helpful for a comprehensive understanding of these interactions.
The Identification of qECL7.1 and qECL10.1 and the interaction between these loci will contribute to marker-assisted gene pyramiding and the generation of adzuki bean genotypes with superior ECL traits, in the range of 6 to 8 cm as reported by [3]. The new genotypes will improve adzuki bean suitability for efficient mechanization at critical stages such as weeding at seedling stage and harvesting at pod. This study illustrated the development of a co-dominant InDel marker, TC64_9,479,153 nearest to qECL7.1, and co-dominant marker TC89_28,568,685 nearest to qECL10.1 and these may be useful in marker-assisted selection for adzuki bean long epicotyl genotypes.
ECL is one of several important plant architecture traits that affect mechanization efficiency in adzuki bean production. An understanding of how overall plant architecture effects suitability for mechanization and productivity is important for successful breeding of ideal genotypes. A study to clarify the genetic control mechanism for other plant architecture related traits and the interactions among the traits using RILs is currently in progress.

5. Conclusions

This study identified two QTLs for epicotyl length using QTL-seq and linkage mapping approaches. qECL7.1 on chromosome 7 was fine-mapped to a 418 kb region flanked by markers TC99_10,211,134 bp and TC102_10,628,880 bp by substitution mapping. Gene annotation analysis predicted 35 candidate genes in the chromosome 7 target region. One candidate gene, Vigan 07G1141000.01, contains a mutation that might contribute to ECL variation in adzuki bean cultivars, however, this study could not conclusively identify the candidate genes for ECL. Therefore, further fine-mapping of qECL7.1 is recommended to precisely identify candidate genes and functions, and to facilitate marker-based selection of ideal genotypes for epicotyl length in adzuki bean breeding.

Supplementary Materials

The following supporting information can be downloaded at: https://www.mdpi.com/article/10.3390/agriculture13071305/s1, Figure S1: Manhattan plot for QTL-seq analysis of ECL on adzuki bean chromosomes 1 to 11, Figure S2: Frequency distribution of ECL in F2 population, Figure S3: Multiple QTL mapping for ECL QTLs, Table S1: InDel markers used to detect QTLs in F2 population, Table S2: DNA markers used to narrow down qECL7.1, Supplementary raw data.

Author Contributions

M.K., K.K. and M.M. designed and managed the project. M.K. and M.M. wrote the manuscript. M.K., Y.H., H.N., N.M., T.Y., Y.K. and M.M. participated in trait investigations, data analysis, and field experiments. P.C.B. provided helpful suggestions for the manuscript structure, logic and proof-read the paper for English language correction. All authors have read and agreed to the published version of the manuscript.

Funding

This study was funded by the Japan Beans Fund Association (K.K.), JSPS KAKENHI Grant Number JP17K07618 (M.M.) and JP21K05538 (M.M.).

Institutional Review Board Statement

Not applicable.

Informed Consent Statement

Not applicable.

Data Availability Statement

Data presented in this study is available in the Supplementary Materials or upon request from the corresponding author.

Acknowledgments

The authors thank H. Sato, M. Sato, H. Miura, Y. Tokuji, K. Onishi and J. Kasuga for their valuable comments throughout the present study and Mina Irikiin for the guidance during laboratory experiments.

Conflicts of Interest

The authors declare that they have no conflicts of interest regarding the publication of this paper.

References

  1. Gontijo, W.D.R.; Sousa, P.H.S.; Matsuo, É.; Resende, J.C.; Barros, P.H.F.C.; Bomtempo, G.L. Epicotyl length in seedlings of soybean cultivars subjected to reduced inter-row spacing. Agron. Sci. Biotechnol. 2021, 7, 1–7. [Google Scholar] [CrossRef]
  2. Hisanori, S.; Tazawa, A.; Sato, H. Genetic Resources and Comparative Genomics of Legumes (Glycine and Vigna): Azuki Bean Cultivation in Hokkaido and Breeding at Tokachi Agricultural Experiment Station. In Proceedings of the 14th NIAS International Workshop on Genetic Resources, Tsukuba, Japan, 14 September 2009; pp. 87–90. [Google Scholar]
  3. Mori, M.; Maki, K.; Kawahata, T.; Kawahara, D.; Kato, Y.; Yoshida, T.; Nagasawa, H.; Sato, H.; Nagano, A.J.; Bethke, P.C.; et al. Mapping of qtls controlling epicotyl length in adzuki bean (Vigna angularis). Breed. Sci. 2021, 71, 208–216. [Google Scholar] [CrossRef] [PubMed]
  4. Isemura, T.; Kaga, A.; Konishi, S.; Ando, T.; Tomooka, N.; Han, O.K.; Vaughan, D.A. Genome dissection of traits related to domestication in azuki bean (Vigna angularis) and comparison with other warm-season legumes. Ann. Bot. 2007, 100, 1053–1071. [Google Scholar] [CrossRef] [PubMed] [Green Version]
  5. Kaga, A.; Isemura, T.; Tomooka, N.; Vaughan, D.A. The genetics of domestication of the azuki bean (Vigna angularis). Genetics 2008, 178, 1013–1036. [Google Scholar] [CrossRef] [Green Version]
  6. Takagi, H.; Abe, A.; Yoshida, K.; Kosugi, S.; Natsume, S.; Mitsuoka, C.; Uemura, A.; Utsushi, H.; Tamiru, M.; Takuno, S.; et al. QTL-seq: Rapid mapping of quantitative trait loci in rice by whole genome resequencing of DNA from two bulked populations. Plant J. 2013, 74, 174–183. [Google Scholar] [CrossRef]
  7. Li, H.; Handsaker, B.; Wysoker, A.; Fennell, T.; Ruan, J.; Homer, N.; Marth, G.; Abecasis, G.; Durbin, R. The Sequence Alignment/Map format and SAMtools. Bioinformatics 2009, 25, 2078–2079. [Google Scholar] [CrossRef] [Green Version]
  8. Zhang, X.; Wang, W.; Guo, N.; Zhang, Y.; Bu, Y.; Zhao, J.; Xing, H. Combining QTL-seq and linkage mapping to fine map a wild soybean allele characteristic of greater plant height. BMC Genom. 2018, 19, 226. [Google Scholar] [CrossRef] [Green Version]
  9. Kumar, K.; Purayannur, S.; Kaladhar, V.C.; Parida, S.K.; Verma, P.K. mQTL-seq and classical mapping implicates the role of an AT-HOOK MOTIF CONTAINING NUCLEAR LOCALIZED (AHL) family gene in Ascochyta blight resistance of chickpea. Plant Cell Environ. 2018, 41, 2128–2140. [Google Scholar] [CrossRef]
  10. McKenna, A.; Hanna, M.; Banks, E.; Sivachenko, A.; Cibulskis, K.; Kernytsky, A.; Garimella, K.; Altshuler, D.; Gabriel, S.; Daly, M.; et al. The genome analysis toolkit: A MapReduce framework for analyzing next-generation DNA sequencing data. Genome Res. 2010, 20, 1297–1303. [Google Scholar] [CrossRef] [Green Version]
  11. Bolger, A.M.; Lohse, M.; Usadel, B. Trimmomatic: A flexible trimmer for Illumina sequence data. Bioinformatics 2014, 30, 2114–2120. [Google Scholar] [CrossRef] [Green Version]
  12. Li, H.; Durbin, R. Fast and accurate short read alignment with Burrows-Wheeler transform. Bioinformatics 2009, 25, 1754–1760. [Google Scholar] [CrossRef] [Green Version]
  13. Van Ooijen, J.W. JoinMap 5®, Software for the Calculation of Genetic Linkage Maps in Experimental Populations of Diploid Species. Kyazma B.V., Wageningen, The Netherlands. 2019. Available online: www.kyazma.nl (accessed on 15 May 2023).
  14. Kosambi, D.D. The estimation of map distances from recombination values. Ann. Eugen. 1943, 12, 172–175. [Google Scholar] [CrossRef]
  15. Van Ooijen, J.W. MapQTL 6® Software for the Mapping of Quantitative Trait Loci in Experimental Populations of Diploid Species. Kyazma B.V., Wageningen, The Netherlands. 2019. Available online: www.kyazma.nl (accessed on 15 May 2023).
  16. Dunnett, C.W. A Multiple Comparison Procedure for Comparing Several Treatments with a Control. J. Am. Stat. Assoc. 1955, 50, 1096–1121. [Google Scholar] [CrossRef]
  17. Hong, H.; Li, M.; Chen, Y.; Wang, H.; Wang, J.; Guo, B.; Gao, H.; Ren, H.; Yuan, M.; Han, Y.; et al. Genome-wide association studies for soybean epicotyl length in two environments using 3VmrMLM. Front. Plant Sci. 2022, 13, 1033120. [Google Scholar] [CrossRef]
  18. Li, J.; Xu, Y.; Chong, K. The novel functions of kinesin motor proteins in plants. Protoplasma 2012, 249, 95–100. [Google Scholar] [CrossRef] [Green Version]
  19. Yang, L.; Wang, J.; Han, Z.; Lei, L.; Liu, H.L.; Zheng, H.; Xin, W.; Zou, D. Combining QTL-seq and linkage mapping to fine map a candidate gene in qCTS6 for cold tolerance at the seedling stage in rice. BMC Plant. Biol. 2021, 21, 278. [Google Scholar] [CrossRef]
  20. Lei, L.; Zheng, H.; Bi, Y.; Yang, L.; Liu, H.; Wang, J.; Sun, J.; Zhao, H.; Li, X.; Li, J.; et al. Identification of a Major QTL and Candidate Gene Analysis of Salt Tolerance at the Bud Burst Stage in Rice (Oryza sativa L.) Using QTL-Seq and RNA-Seq. Rice 2020, 13, 55. [Google Scholar] [CrossRef]
  21. Das, S.; Upadhyaya, H.D.; Bajaj, D.; Kujur, A.; Badoni, S.; Laxmi Kumar, V.; Tripathi, S.; Gowda, C.L.L.; Sharma, S.; Singh, S.; et al. Deploying QTL-seq for rapid delineation of a potential candidate gene underlying major trait-associated QTL in chickpea. DNA Res. 2014, 22, 193–203. [Google Scholar] [CrossRef]
  22. Das, S.; Singh, M.; Srivastava, R.; Bajaj, D.; Saxena, M.S.; Rana, J.C.; Bansal, K.C.; Tyagi, A.K.; Parida, S.K. MQTL-seq delineates functionally relevant candidate gene harbouring a major QTL regulating pod number in chickpea. DNA Res. 2015, 23, 53–65. [Google Scholar] [CrossRef] [Green Version]
  23. Srivastava, R.; Upadhyaya, H.D.; Kumar, R.; Daware, A.; Basu, U.; Shimray, P.W.; Tripathi, S.; Bharadwaj, C.; Tyagi, A.K.; Parida, S.K. A multiple QTL-Seq strategy delineates potential genomic loci governing flowering time in chickpea. Front. Plant Sci. 2017, 8, 1105. [Google Scholar] [CrossRef]
  24. Singh, V.; Sinha, P.; Obala, J.; Khan, A.W.; Chitikineni, A.; Saxena, R.K.; Varshney, R.K. QTL-seq for the identification of candidate genes for days to flowering and leaf shape in pigeonpea. Heredity 2022, 128, 411–419. [Google Scholar] [CrossRef] [PubMed]
  25. Clevenger, J.; Chu, Y.; Chavarro, C.; Botton, S.; Culbreath, A.; Isleib, T.G.; Holbrook, C.C.; Ozias-Akins, P. Mapping late leaf spot resistance in peanut (Arachis hypogaea) using QTL-seq reveals markers for marker-assisted selection. Front. Plant Sci. 2018, 9, 83. [Google Scholar] [CrossRef] [PubMed] [Green Version]
  26. Kumar, A.; Sandhu, N.; Dixit, S.; Yadav, S.; Swamy, B.P.M.; Shamsudin, N.A.A. Marker-assisted selection strategy to pyramid two or more QTLs for quantitative trait-grain yield under drought. Rice 2018, 11, 35. [Google Scholar] [CrossRef] [PubMed] [Green Version]
  27. Assefa, T.; Otyama, P.I.; Brown, A.V.; Kalberer, S.R.; Kulkarni, R.S.; Cannon, S.B. Genome-wide associations and epistatic interactions for internode number, plant height, seed weight and seed yield in soybean. BMC Genom. 2019, 20, 527. [Google Scholar] [CrossRef] [Green Version]
  28. Cao, Y.; Li, S.; Chen, G.; Wang, Y.; Bhat, J.A.; Karikari, B.; Kong, J.; Gai, J.; Zhao, T. Deciphering the genetic architecture of plant height in soybean using two RIL populations sharing a common M8206 parent. Plants 2019, 8, 373. [Google Scholar] [CrossRef] [Green Version]
Figure 1. Parent lines at maturity stage; Chihayahime variety (left) and Toiku161 variety (right). The white line represents 10 cm scale bar. The white arrowheads indicate position of the primary leaf node, which is the apical end of the epicotyl in each parent line.
Agriculture 13 01305 g001
Figure 2. Frequency distribution of ECL measured in 155 RILs of an F7 population. Arrowheads and horizontal lines indicate the mean values and range of values within one standard deviation of the mean for parent lines Chihayahime (white arrowhead) and Toiku161 (black arrowhead). * indicate statistical confidence at p < 0.01. Individual RILs used for the short and long epicotyl length pools are highlighted in red and green, respectively.
Agriculture 13 01305 g002
Figure 3. Manhattan plot for QTL–seq analysis of pooled F7 RILs with long or short epicotyls from a cross between Toiku161 and Chihayahime. The SNP-index was calculated based on 2 Mb intervals with a 50 kb sliding window analysis and differences in SNP-index (Δ(SNP-index)) between the short and long epicotyl pools are plotted in green. Black rectangles represent QTL regions on chromosome 2, 4, 7 and 11. Statistical confidence intervals with p < 0.01 are indicated by the two black lines.
Agriculture 13 01305 g003
Figure 4. Multiple QTL mapping for ECL trait. Linkage maps were constructed for an F2 population with 96 individuals using the indicated 97 InDel markers. Vertical axis represents marker position. Black rectangles represent the two LOD support factor for candidate QTL regions on chromosome 7 and 10. Letter ‘T’ represents the Toiku161 allele effect.
Agriculture 13 01305 g004
Figure 5. ECL of F3 RHLs derived from F2 individuals #236, #223, #206 and #286. Arrowheads and horizontal lines indicate the mean values and range of values within one standard deviation of the mean for progenitor lines Chihayahime (white arrowhead) and Toiku161 (black arrowhead). * indicate statistical confidence at p < 0.01.
Agriculture 13 01305 g005
Table 1. Putative QTLs for epicotyl length among 155 F7 RILs derived from a cross between Toiku161 (female parent) with Chihayahime (male parent).
ChromosomePhysical IntervalΔ(SNP-index) 1 Range
(Mb)
225.30–25.600.64–0.67
225.75–26.150.64–0.66
227.10–27.250.64–0.65
227.55–27.850.64–0.65
228.10–29.050.64–0.68
231.65–32.750.63–0.70
76.50–10.650.65–0.83
1019.75–21.750.66–0.76
1022.75–24.350.66–0.73
1026.55–28.850.66–0.80
116.30–7.450.65–0.75
117.80–11.100.65–0.73
1 Delta single nucleotide polymorphism index.
Table 2. QTL peaks on chromosome 7 and 10 for epicotyl length in the 96 F2 RILs.
ChromosomeLOD Peak PositionNearest MarkerMarker IntervalLOD 1 ValueAE 2DE 3PVE 4
(cM)(cm)(cm)(%)
751.1TC64TC63–TC666.7−0.8−0.121.2
1088.4TC89TC87–TC894.4−0.6−0.513.4
1 Logarithm of odds. 2 Additive effect of the allele from Chihayahime compared with that from Toiku161. 3 Dominance effect. 4 Percentage of the total phenotypic variation explained by each QTL.
Table 3. Genotypes of nine DNA markers at the qECL7.1 region on chromosome 7 and epicotyl length in the recombinants.
LineGenotype of Marker in RecombinantsEpicotyl Length (cm)
TC64_9,479,153TC65_9,984,711TC98_10,131,117TC99_10,211,134TC100_10,305,602TC101_10,308,093TC102_10,628,880TC103_11,772,495TC66_13,081,534Mean SD Estimated Genotype of qECL7.1
ChihayahimeAAAAAAAAA3.2±0.5 CH
Toiku161BBBBBBBBB6.9±0.7*T161
#223_105_7AAAAAAAAA3.4±0.5---CH (Control)
#223_105_1BBBBBBBBB6.9±0.7*T161 (control)
#223_81_75BBBBBBBAA7.0±0.7*T161
#223_112_347BBBBBBAAA7.3±0.8*T161
#223_160_46BBBBAAAAA3.9±0.6 CH
#223_95_178_193BBBAAAAAA4.0±0.4 CH
#223_91_134_15AAAAAAABB4.0±0.5 CH
Plants were homozygous for the Toiku161 (black boxes) and Chihayahime (white boxes) sequences at nine DNA markers. Asterisks indicate difference in ECL between genotypes using Dunnett’s test with a significance level of p < 0.01 indicated by *.
Table 4. Predicted genes within the qECL7.1 region from TC99_10.2M to TC102_10.6M.
GenePosition (bp)Length (bp)Description
Vigan.07G111100.01Chr07:10217067–10225123 (+ strand)8056Biological process: cell redox homeostasis
(GO:0045454)
Vigan.07G111200.01Chr07:10225971–10227563 (− strand)1592Similar to early nodulin-like protein 2-like.
[XP_006592879.1, Glycine max]
Vigan.07G111300.01Chr07:10245110–10253581 (+ strand)8471Biological process: regulation of Rab GTPase
activity (GO:0032313)
Vigan.07G111400.01Chr07:10259315–10262198 (+ strand)2883cellulose microfibril organization
Vigan.07G111500.01Chr07:10267247–10267599 (+ strand)352Similar to integrase core domain containing
protein. [I6ZTT9, Phaseolus vulgaris]
Vigan.07G111600.01Chr07:10270113–10274630 (− strand)4517Mitochondrial outer membrane translocase
complex, subunit Tom22, plant (IPR017411)
Vigan.07G111700.01Chr07:10274131–10274487 (+ strand)356Hypothetical protein.
Vigan.07G111800.01Chr07:10278476–10286164 (− strand)7688DDRGK domain containing protein (IPR019153)
Vigan.07G111900.01Chr07:10287789–10289985 (− strand)2196Hypothetical protein.
Vigan.07G112000.01Chr07:10291534–10291999 (− strand)465Hypothetical protein.
Vigan.07G112100.01Chr07:10292828–10293475 (− strand)647Hypothetical protein.
Vigan.07G112300.01Chr07:10297927–10298963 (+ strand)1036Hypothetical protein.
Vigan.07G112400.01Chr07:10311827–10312393 (+ strand)566Hypothetical protein.
Vigan.07G112500.01Chr07:10349998–10352995 (+ strand)2997Biological process: oxidation-reduction process
(GO:0055114)
Vigan.07G112600.01Chr07:10363325–10365026 (− strand)1701Hypothetical protein.
Vigan.07G112700.01Chr07:10444164–10448247 (+ strand)4083Biological process: oxidation-reduction
process (GO:0055114)
Vigan.07G112800.01Chr07:10463548–10464907 (+ strand)1359Similar to uncharacterized protein.
[D8WJ57, Glycine max]
Vigan.07G112900.01Chr07:10472813–10481791 (+ strand)8978Similar to uncharacterized protein.
[K7LW88, Glycine max]
Vigan.07G113000.01Chr07:10482576–10483609 (− strand)1033Similar to Potassium/sodium hyperpolarization.
[XP_007021055.1, Theobroma cacao]
Vigan.07G113100.01Chr07:10495792–10500041 (+ strand)4249WD40/YVTN repeat-like-containing domain
(IPR015943)
Vigan.07G113200.01Chr07:10501026–509455 (− strand)8426UHRF1-binding protein 1-like (IPR026728)
Vigan.07G113300.01Chr07:10505128–10506155 (+ strand)1027Non-protein coding gene.
Vigan.07G113400.01Chr07:10537568–10544061 (+ strand)6493WD40/YVTN repeat-like-containing domain
(IPR015943)
Vigan.07G113500.01Chr07:10558674–10564005 (+ strand)5331Glycosyl transferase, family 8 (IPR002495)
Vigan.07G113600.01Chr07:10562715–10563808 (− strand)1093Domain of unknown function DUF1995
(IPR018962)
Vigan.07G113700.01Chr07:10564235–10566639 (− strand)2404Myc-type, basic helix-loop-helix (bHLH) domain
(IPR011598)
Vigan.07G113800.01Chr07:10578898–10580621 (− strand)1723Biological process: cell redox homeostasis
(GO:0045454)
Vigan.07G113900.01Chr07:10584354–10585861 (+ strand)1507Cellular component: photosystem II
oxygen evolving complex (GO:0009654)
Vigan.07G114000.01Chr07:10584354–10585924 (− strand)1570Non-protein coding gene.
Vigan.07G114100.01Chr07:10586027–0592438 (− strand)6411Molecular function: microtubule motor activity
(GO:0003777)
Vigan.07G114200.01Chr07:10597826–10599550 (− strand)1724HSP20-like chaperone (IPR008978)
Vigan.07G114300.01Chr07:10599645–0600897 (− strand)1252Non-protein coding gene.
Vigan.07G114400.01Chr07:10602299–10606380 (+ strand)4081Cellular component: actin filament (GO:0005884)
Vigan.07G114500.01Chr07:10617379–10618239 (− strand)860Molecular function: DNA binding (GO:0003677)
Vigan.07G114600.01Chr07:10625237–10626614 (− strand)1377Molecular function: DNA binding (GO:0003677)
Disclaimer/Publisher’s Note: The statements, opinions and data contained in all publications are solely those of the individual author(s) and contributor(s) and not of MDPI and/or the editor(s). MDPI and/or the editor(s) disclaim responsibility for any injury to people or property resulting from any ideas, methods, instructions or products referred to in the content.

