Article

Computational Fluid Dynamics Modeling of Ammonia Concentration in a Commercial Broiler Building

by
João C. Gonçalves
1,2,3,*,
António M. G. Lopes
3 and
José L. S. Pereira
1,4
1
Agrarian School of Viseu, Polytechnic Institute of Viseu, Quinta da Alagoa, 3500-606 Viseu, Portugal
2
CERNAS-IPV Research Centre, Polytechnic Institute of Viseu, Campus Politécnico, Repeses, 3504-510 Viseu, Portugal
3
ADAI-LAETA, Department of Mechanical Engineering, University of Coimbra, Rua Luís Reis Santos, Pólo II, 3030-788 Coimbra, Portugal
4
Centre for the Research and Technology of Agro-Environmental and Biological Sciences (CITAB), Inov4Agro, University of Trás-os-Montes and Alto Douro, Quinta de Prados, 5000-801 Vila Real, Portugal
*
Author to whom correspondence should be addressed.
Agriculture 2023, 13(5), 1101; https://doi.org/10.3390/agriculture13051101
Submission received: 12 April 2023 / Revised: 5 May 2023 / Accepted: 19 May 2023 / Published: 21 May 2023
(This article belongs to the Section Farm Animal Production)

Abstract

:
In the present study, a numerical model was developed to predict the flow pattern inside a broiler building. The model was intended to predict the velocity fields inside the domain and the ammonia (NH3) emitted or released by litter from poultry housing. The numerical model was developed in computational fluid dynamics (CFDs) commercial code and intended to represent a commercial broiler building and to simulate the 3D and heat transfer in steady-state flow. The evaporative cooling pads were also included in the model. The validation of the model was based on experimental measurements obtained in previous studies. The simulations were focused on the summer, winter, and mid-season conditions. Numerical measurements of NH3 concentration were compared with the experimental measurements, and a quite good agreement was verified. The numerical results allowed the characterization of: the inside flow pattern developed for the summer and winter periods and the NH3 and velocity field distributions inside the broiler building. It was found that NH3 concentration increased along the tunnel, as a result, especially, of the low flow rate of the exhaust fan. It was verified that the low velocities inside domain were not sufficient to remove the gaseous pollutants.

1. Introduction

The world population already exceeds seven billion people, and is expected to exceed nine billion by 2050 and at least ten billion by the end of this century. The constant increase in the world population also leads to a need for an increase in food production. Bird meat is a very important protein source for human consumption. World chicken-meat production for 2022 was around 101 million tons worldwide [1]. Broiler production is highly developed and is oriented for two breeding goals: hens to obtain fertile eggs and broilers to obtain meat.
Ventilation of broiler buildings is very important, as the decomposition of litter material in the floor generates manure and produces several gases that are harmful for humans and animals. Along with carbon dioxide (CO2), the production of broilers also generates methane (CH4) and nitrous oxide (N2O), which are considered the main greenhouse gases, and one of the main causes of climate change, due to their potential contribution to global warming [2]. In the face of the environmental problems caused by the gas emissions in broiler production, international regulations have been published in order to reduce ammonia (NH3) emissions, particularly the directive (European Union) 2016/2284 of 14 December, that aims for a 20% reduction in NH3 emissions from animal housing by 2030 [3,4]. In addition, NH3, N2O, and CH4 contribute to acid rain, ozone formation in the troposphere, and global warming [5].
The average annual gas emission rates from broiler houses using new litter material in each production cycle varies greatly among European countries, with values from 0.06 to 0.45 g day−1 broiler−1 for NH3, 0 to 46 mg day−1 broiler−1 for N2O, 55.2 to 98.4 g day−1 broiler−1 for CO2, and 0 to 50 mg day−1 broiler−1 for CH4 [6].
Continuous exposure to high concentrations (>15.2 mg/m3 or >20 ppm) of NH3 is harmful to humans and animals [4,7], as it can cause several respiratory problems and eye irritation. Likewise, continuous exposure of broilers to this gas is reported to be the cause of health problems and a reduction in the rate of weight gain [7,8]. In addition, international regulations also intend to protect birds’ and workers’ health, by limiting exposure to NH3. The volatilization of NH3 is influenced by several factors such as temperature and relative humidity, ventilation rate and air velocity, and excretion rate and litter removal schedules [7,9]. Some studies have been published concerning strategies to control and reduce NH3 volatilization in broiler housing, either by incorporating additives in the litter material or by dietary manipulation [2,5,10,11,12,13,14,15]. Strategies such as the utilization of additives and the adoption of diets with lower levels of crude protein are some examples of measures that can contribute to reducing NH3 losses in broiler production facilities [7].
Efficient ventilation strategies are of utmost importance for the healthy growth of broilers and low mortality rates. Additionally, productivity is highly dependent on indoor environmental conditions, since birds are very sensitive animals [16]. Broiler farms with inadequate ventilation systems can have high mortality rates when the air inside the building is hot, humid, and nearly still in the microenvironment close to the broiler chickens. The uniformity of air velocity in the region occupied by the broilers is also important in inhibiting migration into better ventilated but already crowded areas, which will contribute to increased bird mortality [17]. The ventilation pattern used in broiler buildings is usually different from the cold to the warm season, and also depends on the stage of the fattening cycle of broiler production. Commercially, different typical ventilation patterns can be found, according to the number and location of the air exhaust ventilators and the outside air admission. For example, Fancom, in The Netherlands, can supply five different design configurations.
The inside thermal and dynamic parameter distribution that determines the internal climate components such as air temperature and velocity and relative humidity depends on several factors such as: the geometry and dimensions of the building, the location and dimensions of the air inlet and outlet, the ventilation regime, the envelope parameter’s (walls, floor, and ceiling) and, of course, outside conditions of temperature, relative humidity, wind, and radiation. Typically, and most used in Portugal, the broiler buildings’ geometry consists of long tunnels equipped with extraction ventilators located in one extreme and on the top of the building. The outside air for refreshment enters through small openings on the lateral walls. These openings are automatically controlled and can open or close according to the external climatic conditions. This ventilation strategy is a compromise between thermal comfort in terms of temperature and humidity, and the need to refresh the internal air and at the same time remove the gaseous pollutants.
Using appropriated methodology and equipment, experimental data may give important information about the air flow and other variables such as temperature and gas concentrations. The main drawbacks of the experimental approach are the cost of equipment and the time needed to setup the measurement chain and perform the measurements as well as the fact that it is only feasible to take measurements at a relatively reduced number of locations.
In recent years, numerical simulation tools have been improving, also benefiting from higher computer calculation and storage capabilities. CFD techniques can be used to evaluate and optimize building design to improve the thermal comfort in shopping malls, state buildings such as schools or hospitals, or in refrigerated food conservation equipment [18]. CFD tools may be used to improve the indoor environment of livestock farms in terms of building design and farm operation. CFD studies can be applied in existing broiler housing or before constructing the building. Therefore, the use of CFD techniques may contribute to reducing the cost of production and to increasing the productivity of the animals [19]. In Rong et al. [20] the authors summarize the best practice guidelines for CFD modeling in livestock buildings to ensure prediction quality. Taking the advantages of CFD techniques, this methodology have been also used to simulate the indoor air flow in animal buildings, namely in pig [21,22], cattle [23], and, in particular, poultry housing [17,24]. In Eva Galdo (2017) [19], a review of animal buildings’ CFD simulations is presented. Of particular interest are the studies devoted to broiler buildings ([16,17,25,26,27]. The adequate design of broiler buildings and the location of inlet and exhaust air ventilators have been also investigated by several authors, such as [16,20,25,26].
The main objective of the present study was to develop a 3D CFD numerical model able to simulate the 3D fluid flow distribution inside a broiler building, in order to assess the indoor airflow pattern, and the concentration distributions of gaseous pollutants such as NH3. We intended to characterize the field distribution of NH3 concentration and velocity inside the broiler building, for winter, mid-season, and summer periods. One important objective of the present study was to compare the NH3 concentration, measured experimentally in the real installations, with the numerical results. By comparing numerical and experimental results, an evaluation could be made as to whether the locations of the gaseous sampling points in the experimental approach were sufficient and representative of the real distribution inside the building. In fact, by allowing a solution for the whole variables’ field, the CFD approach can provide a sound support for deciding the best location points for experimental gas-concentration sampling.

2. Material and Methods

2.1. Broiler Building

The building analyzed in the present work was one of the commercial broiler buildings studied in [3], in which the authors carried out experimental work measuring the NH3, N2O, CO2, and CH4 concentration. The commercial broiler farm was located in Figueira da Foz, a small coastal town in center Portugal. The building is oriented in the east–west direction, has a length of 120 m, a width of 16 m, a 4.0 m ridge, and sidewalls are 2.7 m high. The building has a steel structure, a concrete floor, and the side walls and ceiling are insulated with polyurethane. The building is equipped with four lines of automatic feeding systems, four lines of nipple drinking systems, evaporative cooling pads (model Celdek, Munters, Kista–Stockholm, Sweden). The climate control system is model F37 from Fancom, Panningen, The Netherlands.
The ventilation configuration consists of five roof exhaust fans, eight exhaust fans at the top of the tunnel and two exhaust fans on the lateral walls near the west top. The air inlet is through 52 small rectangular windows (0.38 m × 0.86 m) located in both lateral walls. The ventilation is through a minimum transitional tunnel ridge system being controlled with one differential pressure meter (0–100 Pa, Fancom, The Netherlands), two temperature sensors (SF7, Fancom, The Netherlands), and two relative humidity sensors (model RHM.17 (indoors) and model RHO.17(outdoors))

2.2. Field Measurements

The experimental values used in the present study were as per [3]. These values were be used to assess the numerical method, by comparing the NH3 concentration values measured at four different locations, and for six different situations (two during the summer period, two during the winter period, and two during the mid-season period).
In [3], concentration values of NH3, N2O, CO2, and CH4 were measured indoors and outdoors at four different locations. The four indoor collecting points were located in the central part of the building along its main axis (x = 14 m; x = 23 m; x = 50 m; x = 77 m), at a distance of 0.5 m from the ground. Concentration measurements were monitored by a multipoint sampler connected to a photoacoustic field gas monitor (INNOVA 1409-12 and 1412i-5, Lumasense Technologies, Ballerup, Denmark). Air samples were collected in sequence through the sampling points, with gas concentration continuously measured and recorded every 2 minutes. For data comparison with the CFD model, hourly-averaged values were used. Table 1 lists the simulation conditions. More details about the experimental equipment and measurement procedures can be found in [3].

3. CFD Model

3.1. Geometry, Numerical Model, and Boundary Conditions

In this study, the commercial package ANSYS-CFX was used to create the numerical model for the simulations. The geometric model replicated the relevant features of the actual commercial broiler and may be seen in Figure 1. The air inlet was through 52 windows with dimensions 0.38 m × 0.86 m, with 26 windows located in each of the lateral walls. The exhaust was through five fans placed in the ceiling, eight fans at the top west and two fans at each lateral wall near the top of the tunnel. Due to their small size in comparison with the building dimensions, the feeding and drinking lines and measurement equipment, as well as other obstacles, were not taken in account in the simulations.
The lateral walls and the ceiling were considered adiabatic. At the floor, a heat flux rate was imposed to simulate the metabolic heat release rate of the broilers and also from the litter. It was concluded by [28] that the total heat production—THP (sum of sensible and latent bird heat production) depends on the broiler’s growing-cycle day, inner temperature, and weight, as well as the day period (light or dark). In our study, and according to the methodology proposed by these authors, a total specific heat release rate of 8 W/kg and 10 W/kg was adopted for summer and for the winter situations, respectively. The NH3 release rate from the litter was also considered in the simulations made in this study. Considering the experimental results of Pereira et al. (2018) [3], the values listed in Table 2 were used. The broiler building was equipped with 100 mm thick, 21.0 × 1.8 m evaporative cooling pads (model Celdek 7060-15, Munters, Sweden), installed along the lateral walls (Figure 1). The evaporative pads, parallelepipedal in shape, were simulated as a porous medium, with corresponding properties calculated following the methodology reported in [29] and also used in the work of [30].
The flow inside the broiler building was considered as steady state, incompressible, and turbulent. Due to symmetry relative to the longitudinal vertical plane located at mid-width, only half of the domain was simulated. Küçüktopcu et al. [31] evaluated several turbulence models for assessing the indoor environment of a broiler building and concluded that the RNG k–ε model showed the best agreement with the measurements of velocity and temperature. This model was thus adopted for the present simulations. The governing equations were discretized using the high resolution and the upwind schemes for the convective and turbulent terms, respectively. The iterative calculation procedure was assumed close enough to the convergence when all residuals became lower than 10–4.

3.2. Simulated Periods or Configurations and Boundary Conditions

Six different situations were simulated to replicate summer, winter, and mid-season periods, including the day and night periods. All the conditions corresponded to the final stage of the broilers’ growing-cycle, which lasts approximately 30 days. Table 1 and Table 2 summarize all the conditions of the simulated configurations in the broiler building.

3.3. Mesh Independence Tests

In addition to other factors, results from the CFD simulations can be greatly affected by mesh design and refinement. To keep discretization errors as low as possible, higher node concentrations should be ensured in regions of large spatial variations. For that purpose, the mesh was refined near solid boundaries and at inlets and outlets, as shown in Figure 2.
To evaluate mesh independence, four meshes with different sizes were created and the simulation results compared. Table 3 presents the number of elements and nodes of the tested meshes.
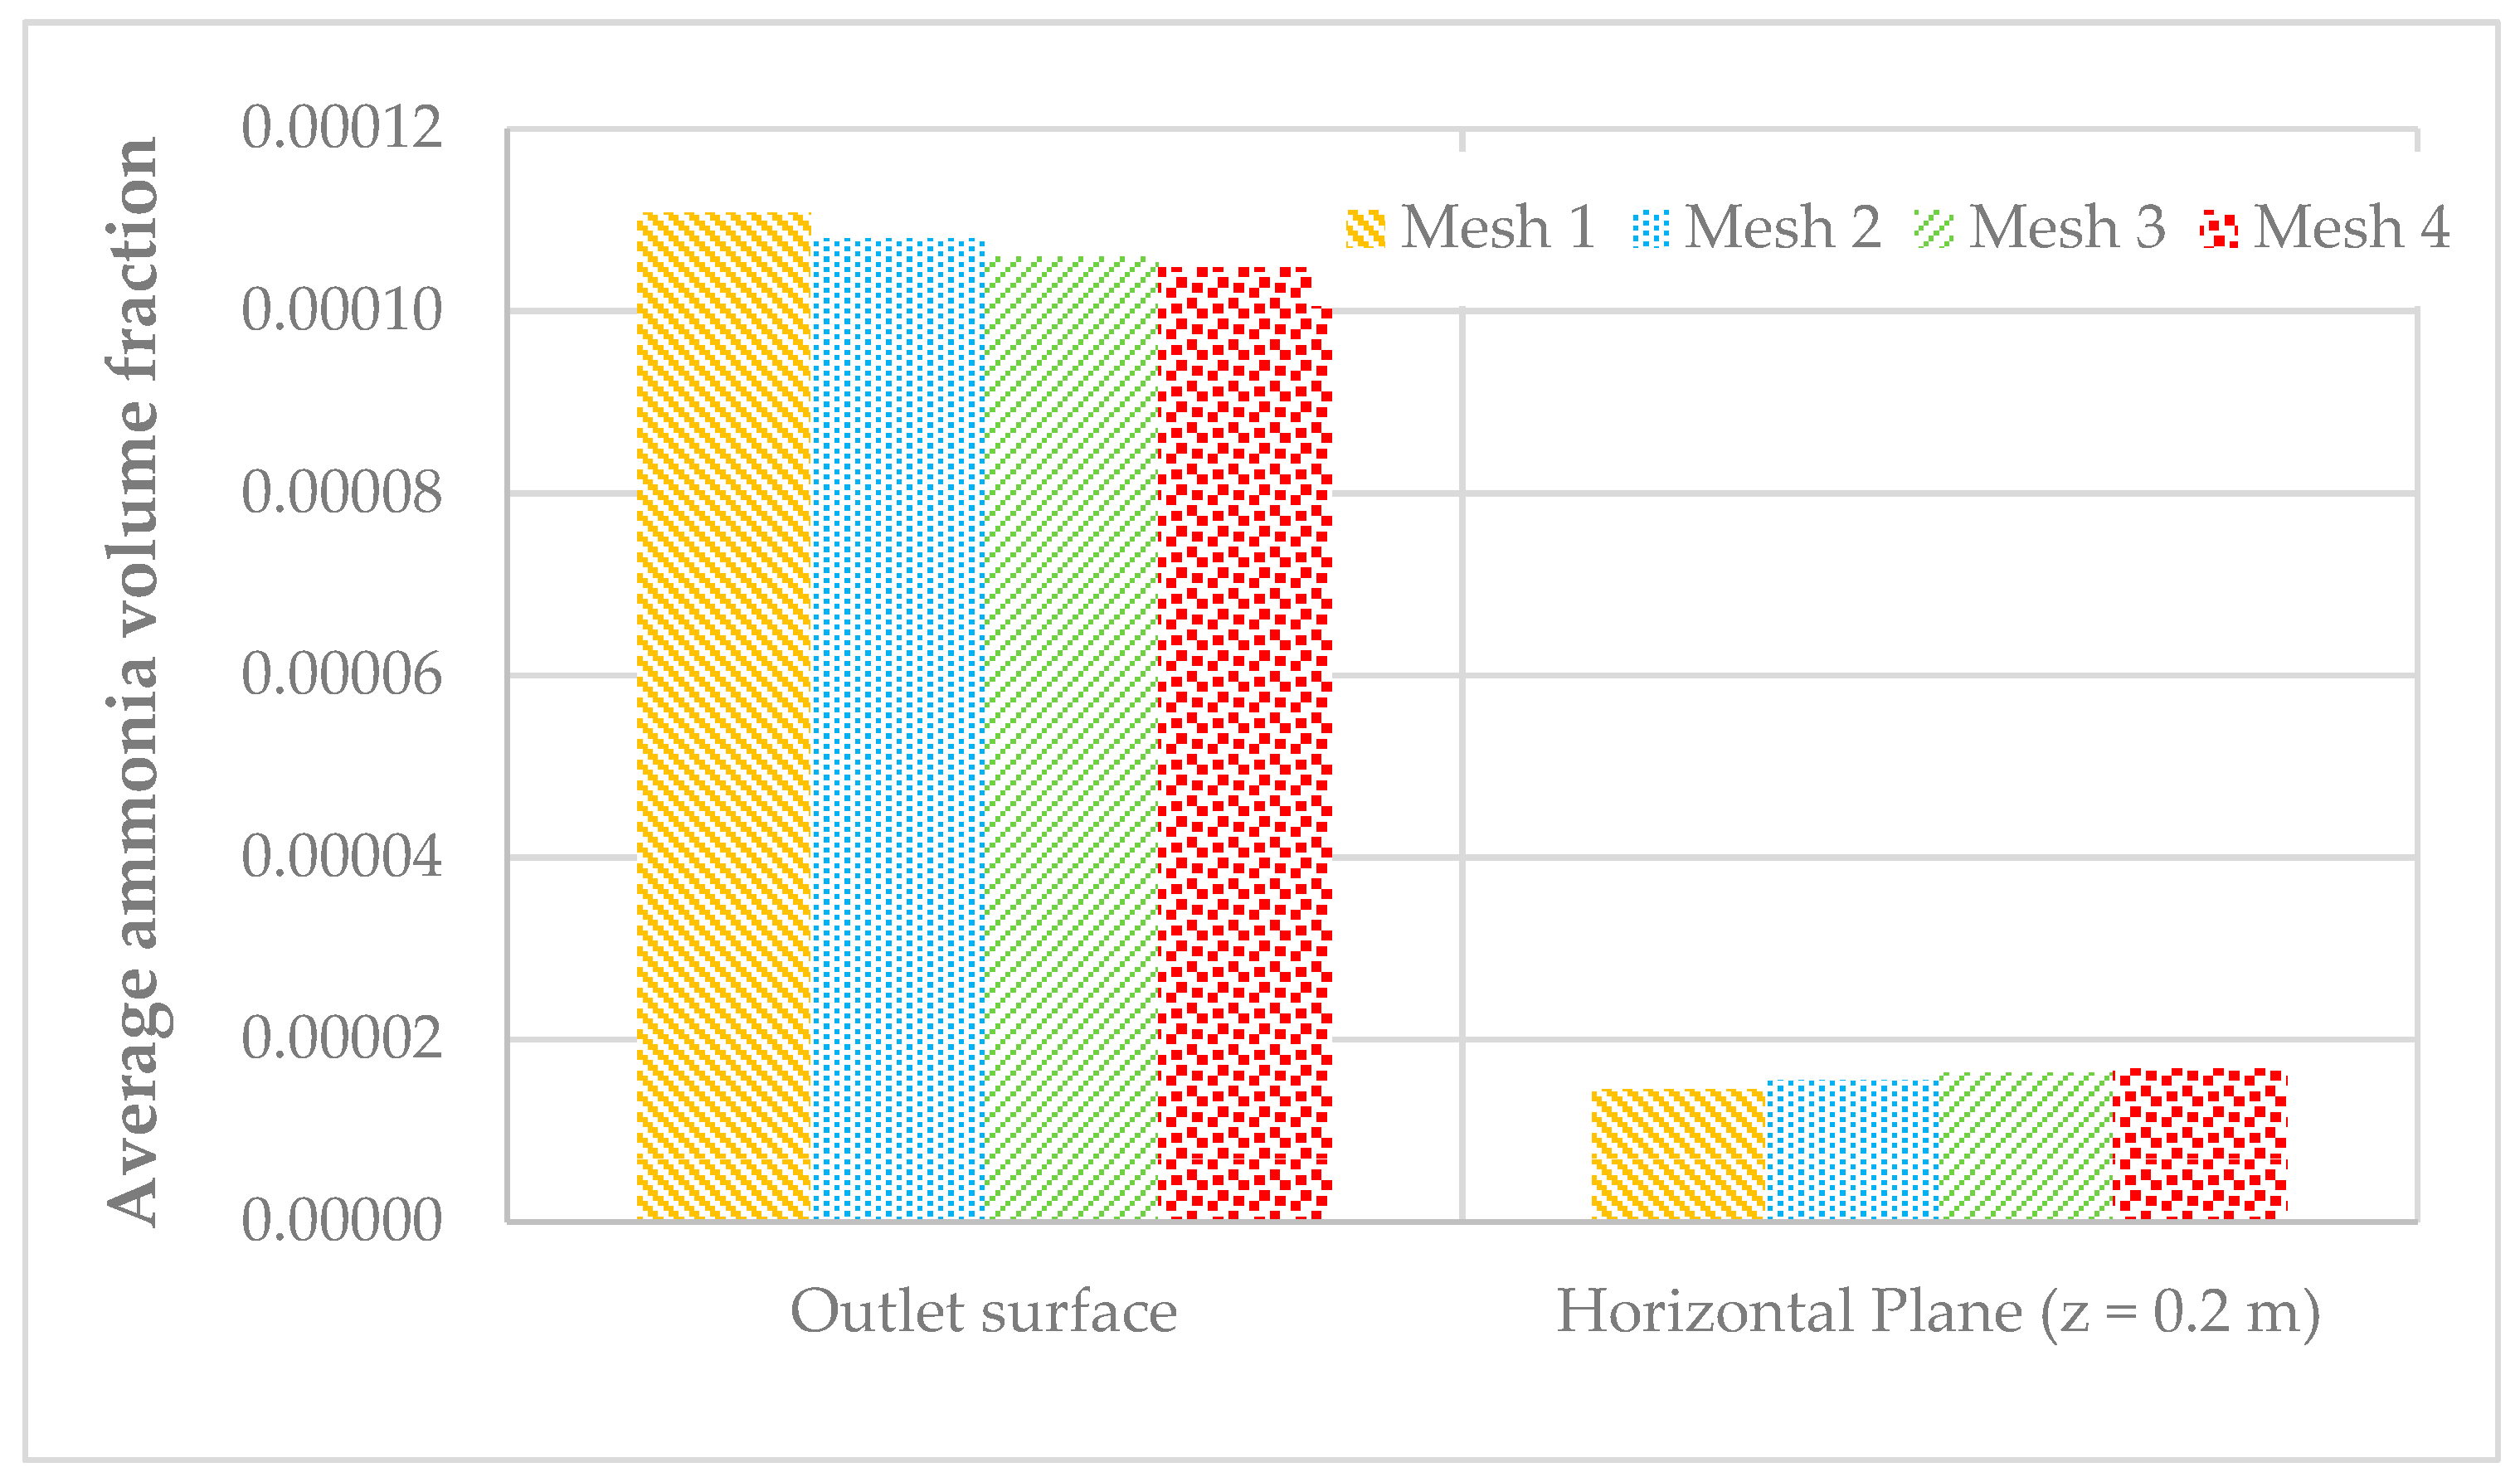
Mesh dependency analysis was made based on the average value of NH3 volume fraction values at the global outlet surface and in a horizontal plane at height z = 0.2 m, for the four different meshes tested. Figure 3 shows the results for all the four meshes.
Once results for Meshes 3 and 4 were close enough, in order to optimize the time computer calculation effort and the CFD accurate results, Mesh 3 was considered in all further simulations.

4. Results and Discussion

4.1. Comparison of Experimental and Numerical Results for NH3 Concentration

As previously stated, the main motivation and objective of the present study was to simulate the airflow inside a broiler building and to verify the model results by comparing the obtained NH3 concentration with the experimental measurements. For this purpose, a simulation campaign was carried for the conditions presented in Table 2.
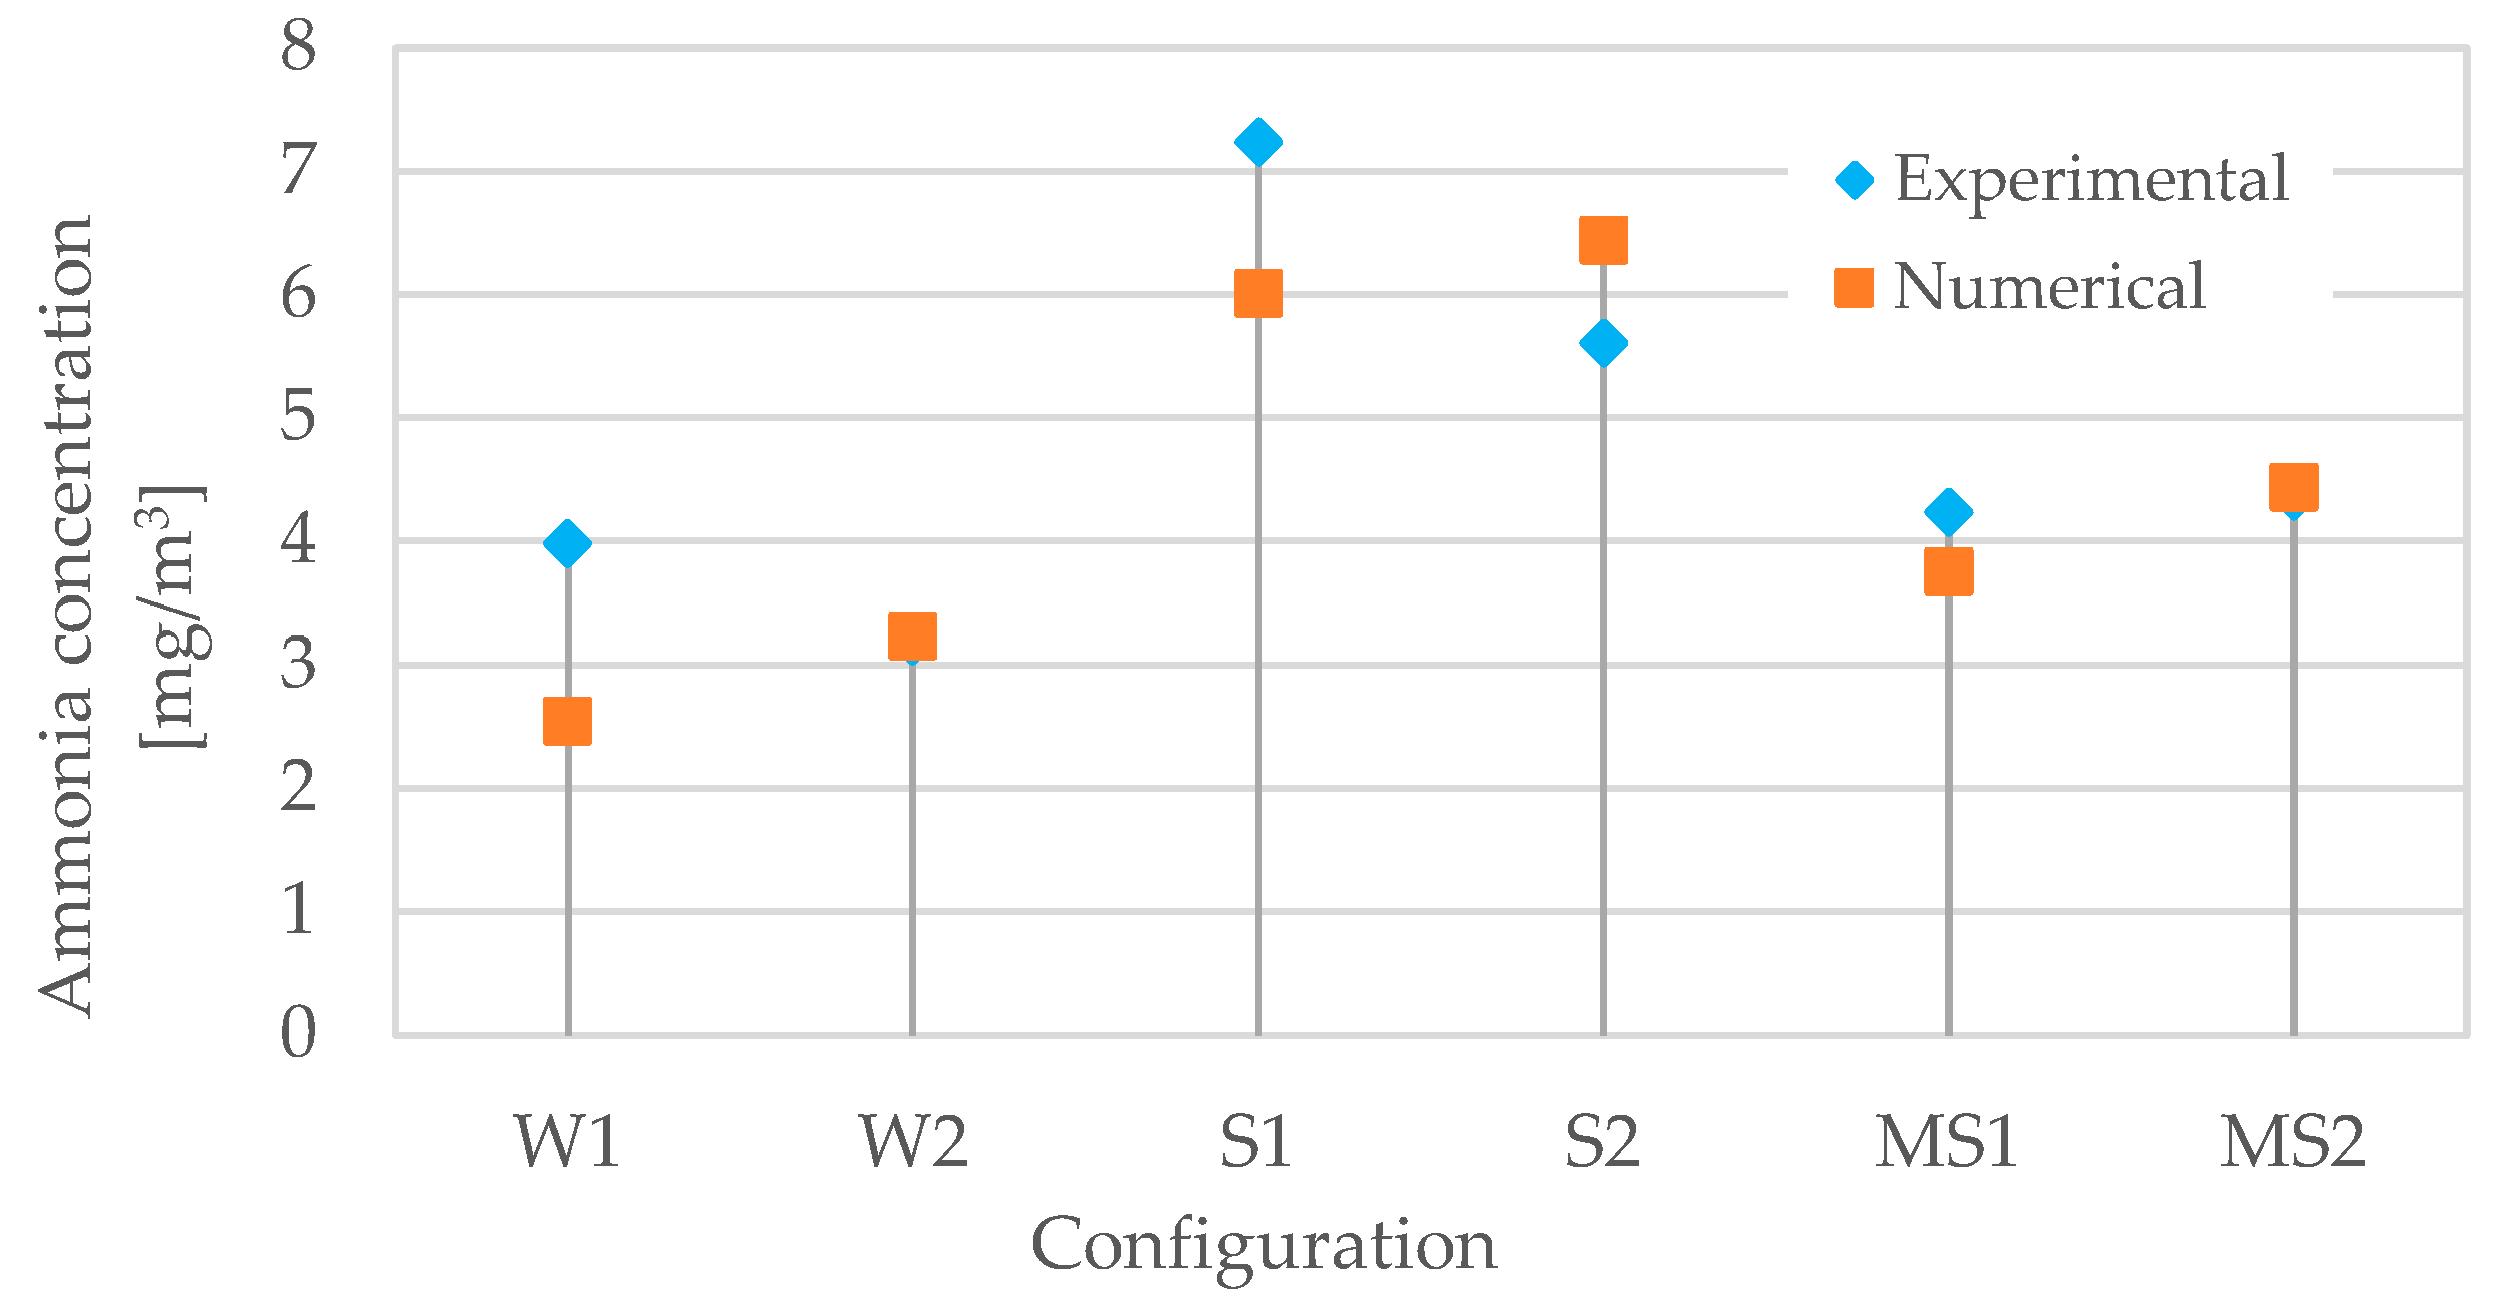
For the experimental results, average values were computed from measurements at four collecting points located in the central part of the building along the tunnel main axis at locations x = 14 m; x = 23 m; x = 50 m; and x = 77 m, at a height 0.5 m from the ground [3]. Figure 4 compares the experimental and numerical average values of NH3 concentration for the different simulated configurations. Globally, quite a good agreement was obtained between numerical and experimental results. The best agreement was obtained for configuration winter 2 (W2) and mid-season 2 (MS2), with almost coincident results. In contrast, the largest difference was verified for configurations winter 1 (W1) and summer 1 (S1), with CFD NH3 concentration underestimations of 36% and 17%, respectively.
The mid-season configurations MS1 and MS2 had the two largest numbers of broilers, leading to a larger NH3 generation. In spite of this, the largest NH3 concentrations were obtained, both numerically and experimentally, for the two summer configurations, S1 and S2. This is most likely because in the mid-season configurations ventilation rates are higher and pollutants are thus removed more effectively.

4.2. Characterization of Indoor Air Flow for Different Configurations

4.2.1. Airflow Pattern

As described in Section 3.2, six different situations were simulated to replicate summer, winter, and mid-season conditions, as listed in Table 2. Numerical simulations show that the flow pattern inside the broiler building was quite complex and very much dependent on the thermal and dynamic initial conditions. This can be observed in Figure 5, that shows the streamlines for S1 and MS2 configurations, with representation at half domain. For the S1 configuration, the flow pattern along the longitudinal direction (x-axis) was characterized by the formation of strong vortices immediately after the air entered in the domain, as clearly shown in Figure 5a. This pattern was also observed in the MS1 configuration, and was even more intense for the winter configuration. The consequence was a significant variation of the local properties inside the domain for different initial conditions.
A different flow pattern was observed in the MS2 configuration (Figure 5b). For this configuration, although in the initial zone of the air inlet the flow pattern was similar to that verified in S1, the longitudinal vortices of configuration S1 were not verified but, instead, the streamlines become linear and parallel to each other. This different behavior was due to the higher exhaust air flow rates imposed in the initial conditions. Thus, in this configuration, the inertial forces were larger than the viscous forces and turbulence almost disappeared. In these cases, and at least for zones far away from the inlet, the flow was clearly characterized as a displacement flow, with higher predictability of local flow properties. This airflow pattern also promoted a better and more effective removal of pollutants present in the compartment. However, as a disadvantage, the higher flow velocity may cause discomfort. This is confirmed in the figures showing NH3 concentration and velocity profiles.
Figure 6 shows the velocity vectors in a vertical plane located at x = 15 m, for configurations S1 and MS2. This figure clearly confirms the flow complexity and the differences between these two configurations, with configuration MS2 showing two large vortices rotating in opposite directions. In configuration S1, the lower air temperature at the inlet forced the flow down, creating a single large vortex that proceeded downstream as seen in Figure 5a. In configuration MS2, the higher values for temperature and inlet air velocity caused a different flow pattern. In this case, two opposite recirculation cells were observed. This behavior was obviously strongly dependent of inlet and initial conditions, which, once again, caused the great local variability of the properties. Therefore, special attention must be dedicated in the selection of the locations of sample collection points in field measurements.

4.2.2. Ammonia Distribution

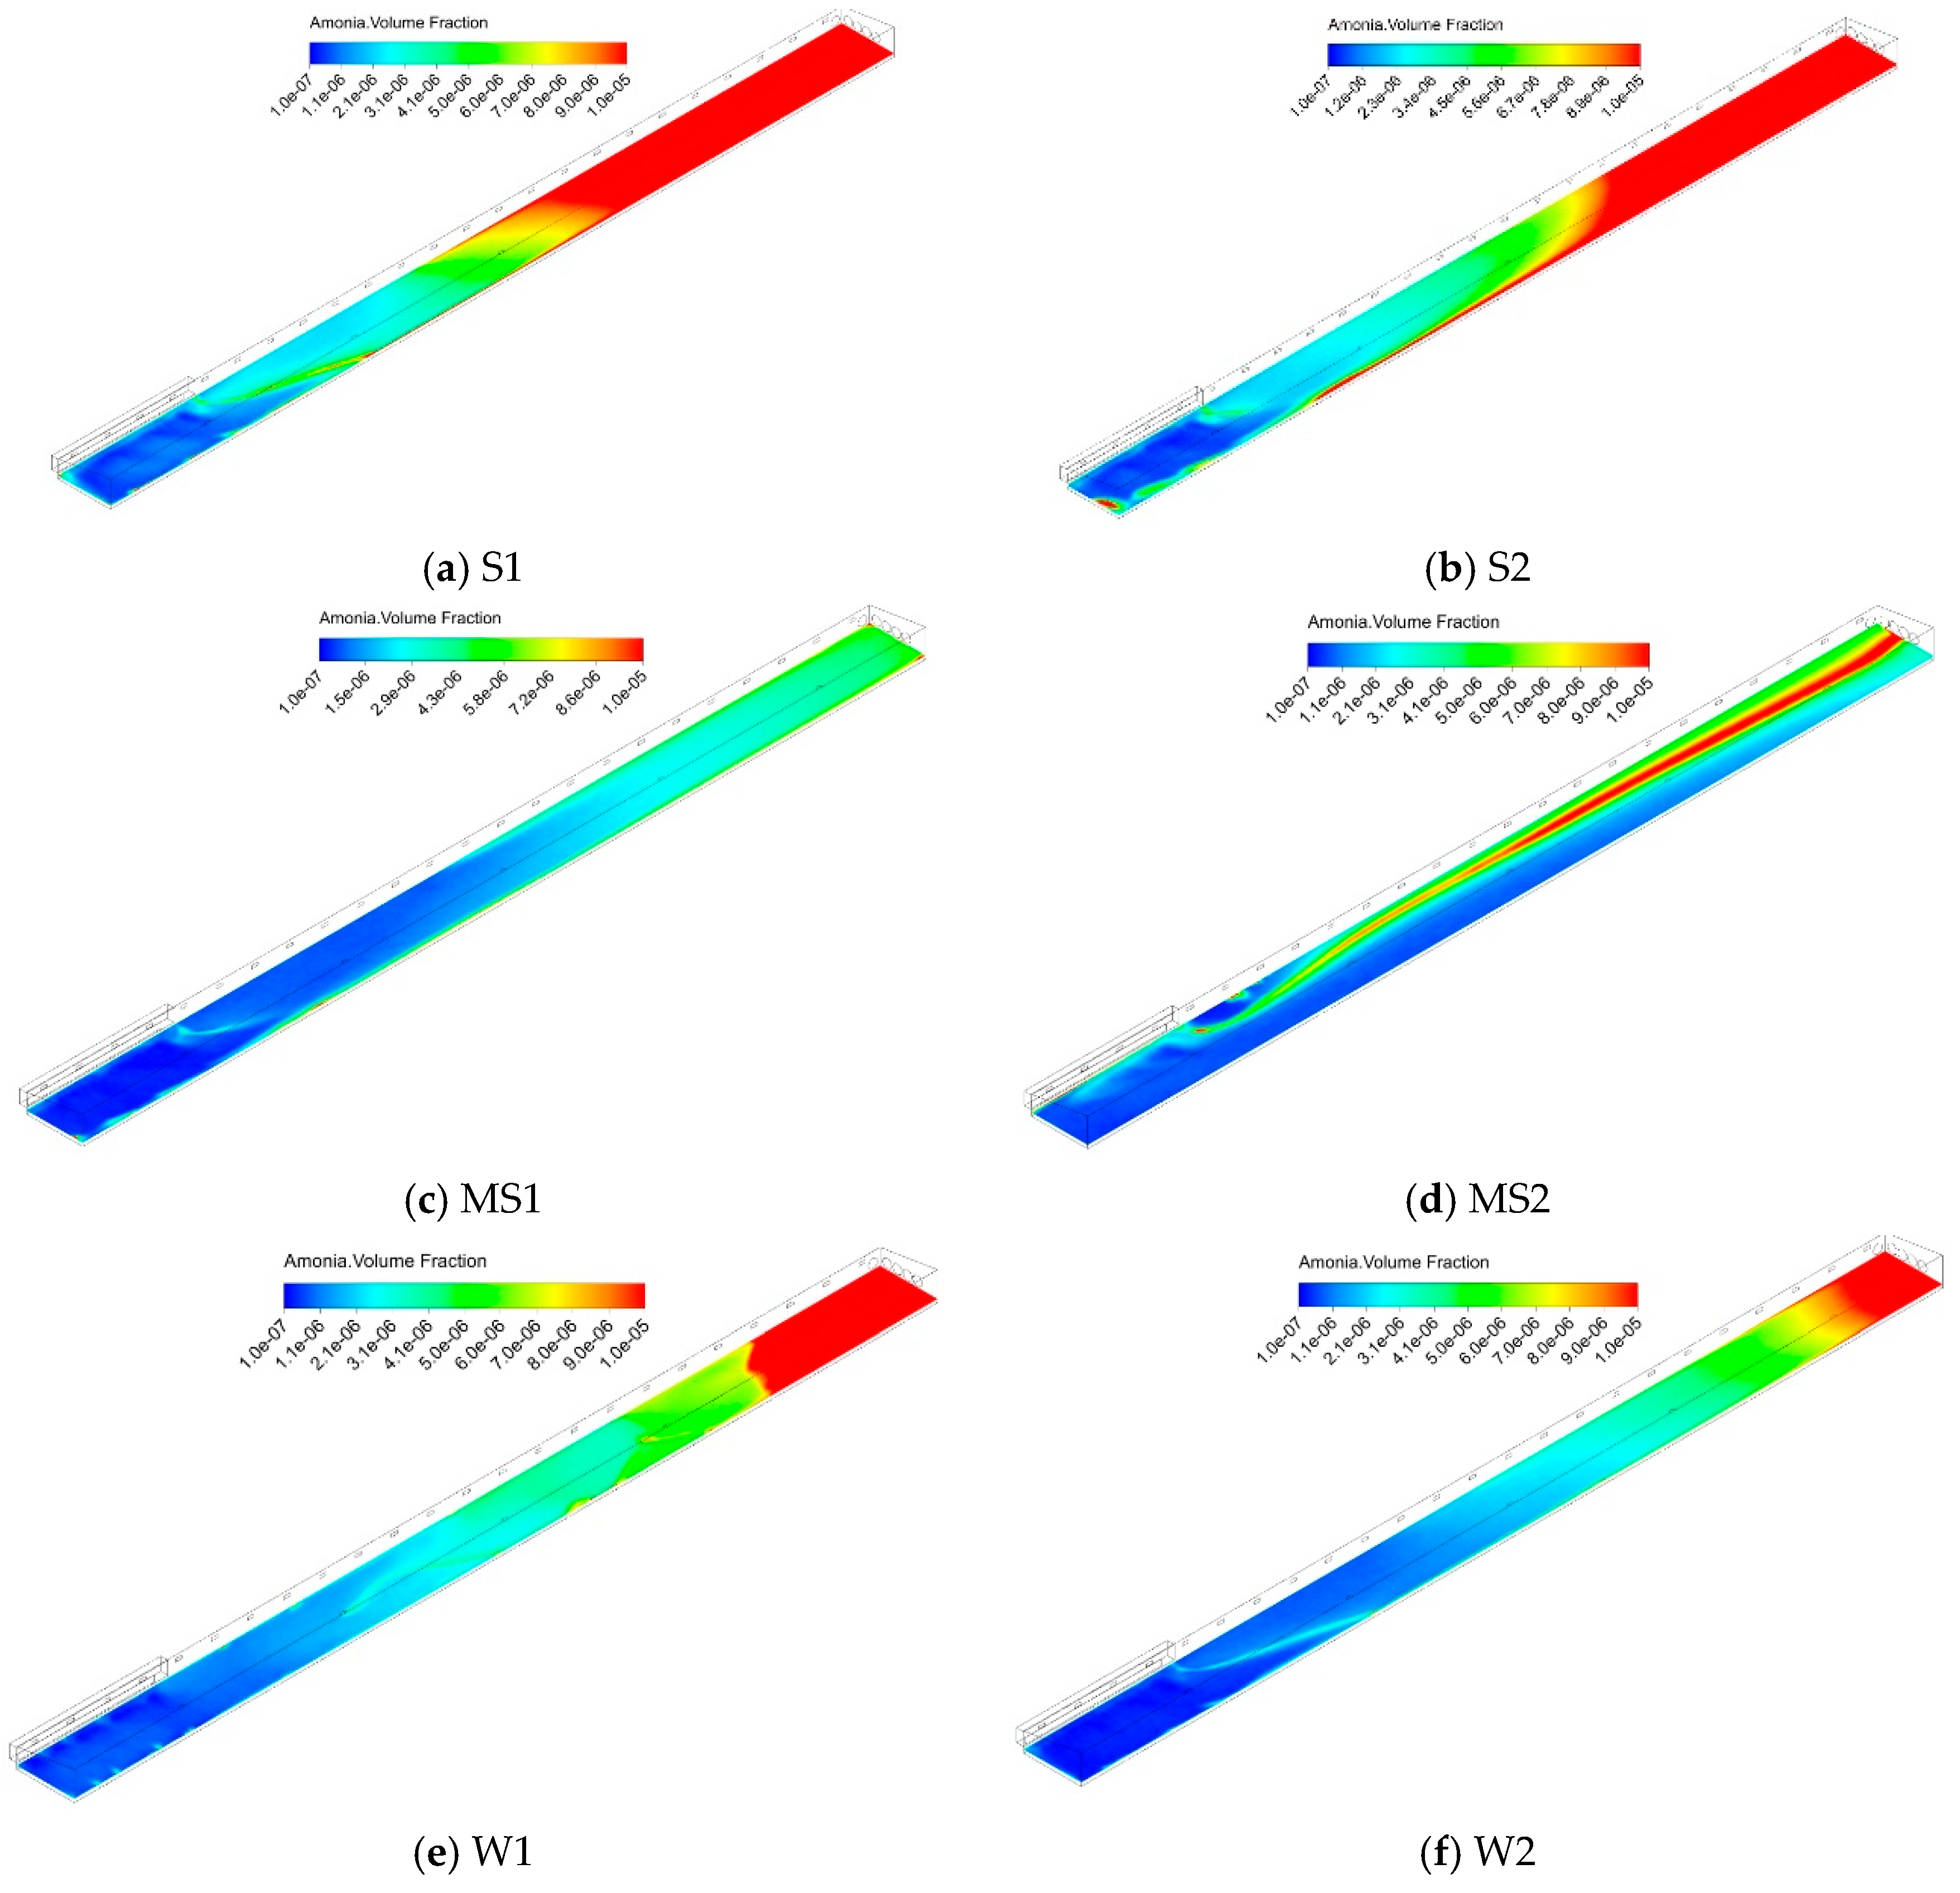
Figure 7 shows the NH3 volume distribution in a horizontal plane located at z = 0.5 m from ground, for the six simulated configurations. As expected, concentration values increased from the inlet zone to the exhaust zone, as the fresh air entering the domain through the evaporative pad was contaminated by NH3 released from the ground (i.e., litter material).
Mid-season configurations were characterized by a significant exhaust ventilation rate, so the NH3 was more effectively removed, as can be observed in Figure 7d. This configuration is characterized by the tunnel (displacement) ventilation, with parallel streamlines along the tunnel. In the MS2 configuration, the NH3 emission was similar to the S2 configuration; however, in MS2 the ventilation rate was 50% larger than in S2 configuration.
In winter situations the outside air temperature, as well as the exhaust ventilation rate, was significant lower. Figure 7e,f shows the contours of NH3 concentration for these situations. Although in winter the flow velocities were much lower, we can confirm that, just as in configurations S1 and S2, also in configurations W1 and W2, the NH3 concentration increased greatly near the exhaust zones, at the tunnel exit. This also indicates that the exhaust flow rate imposed by the fans was not sufficient to efficiently remove the NH3.
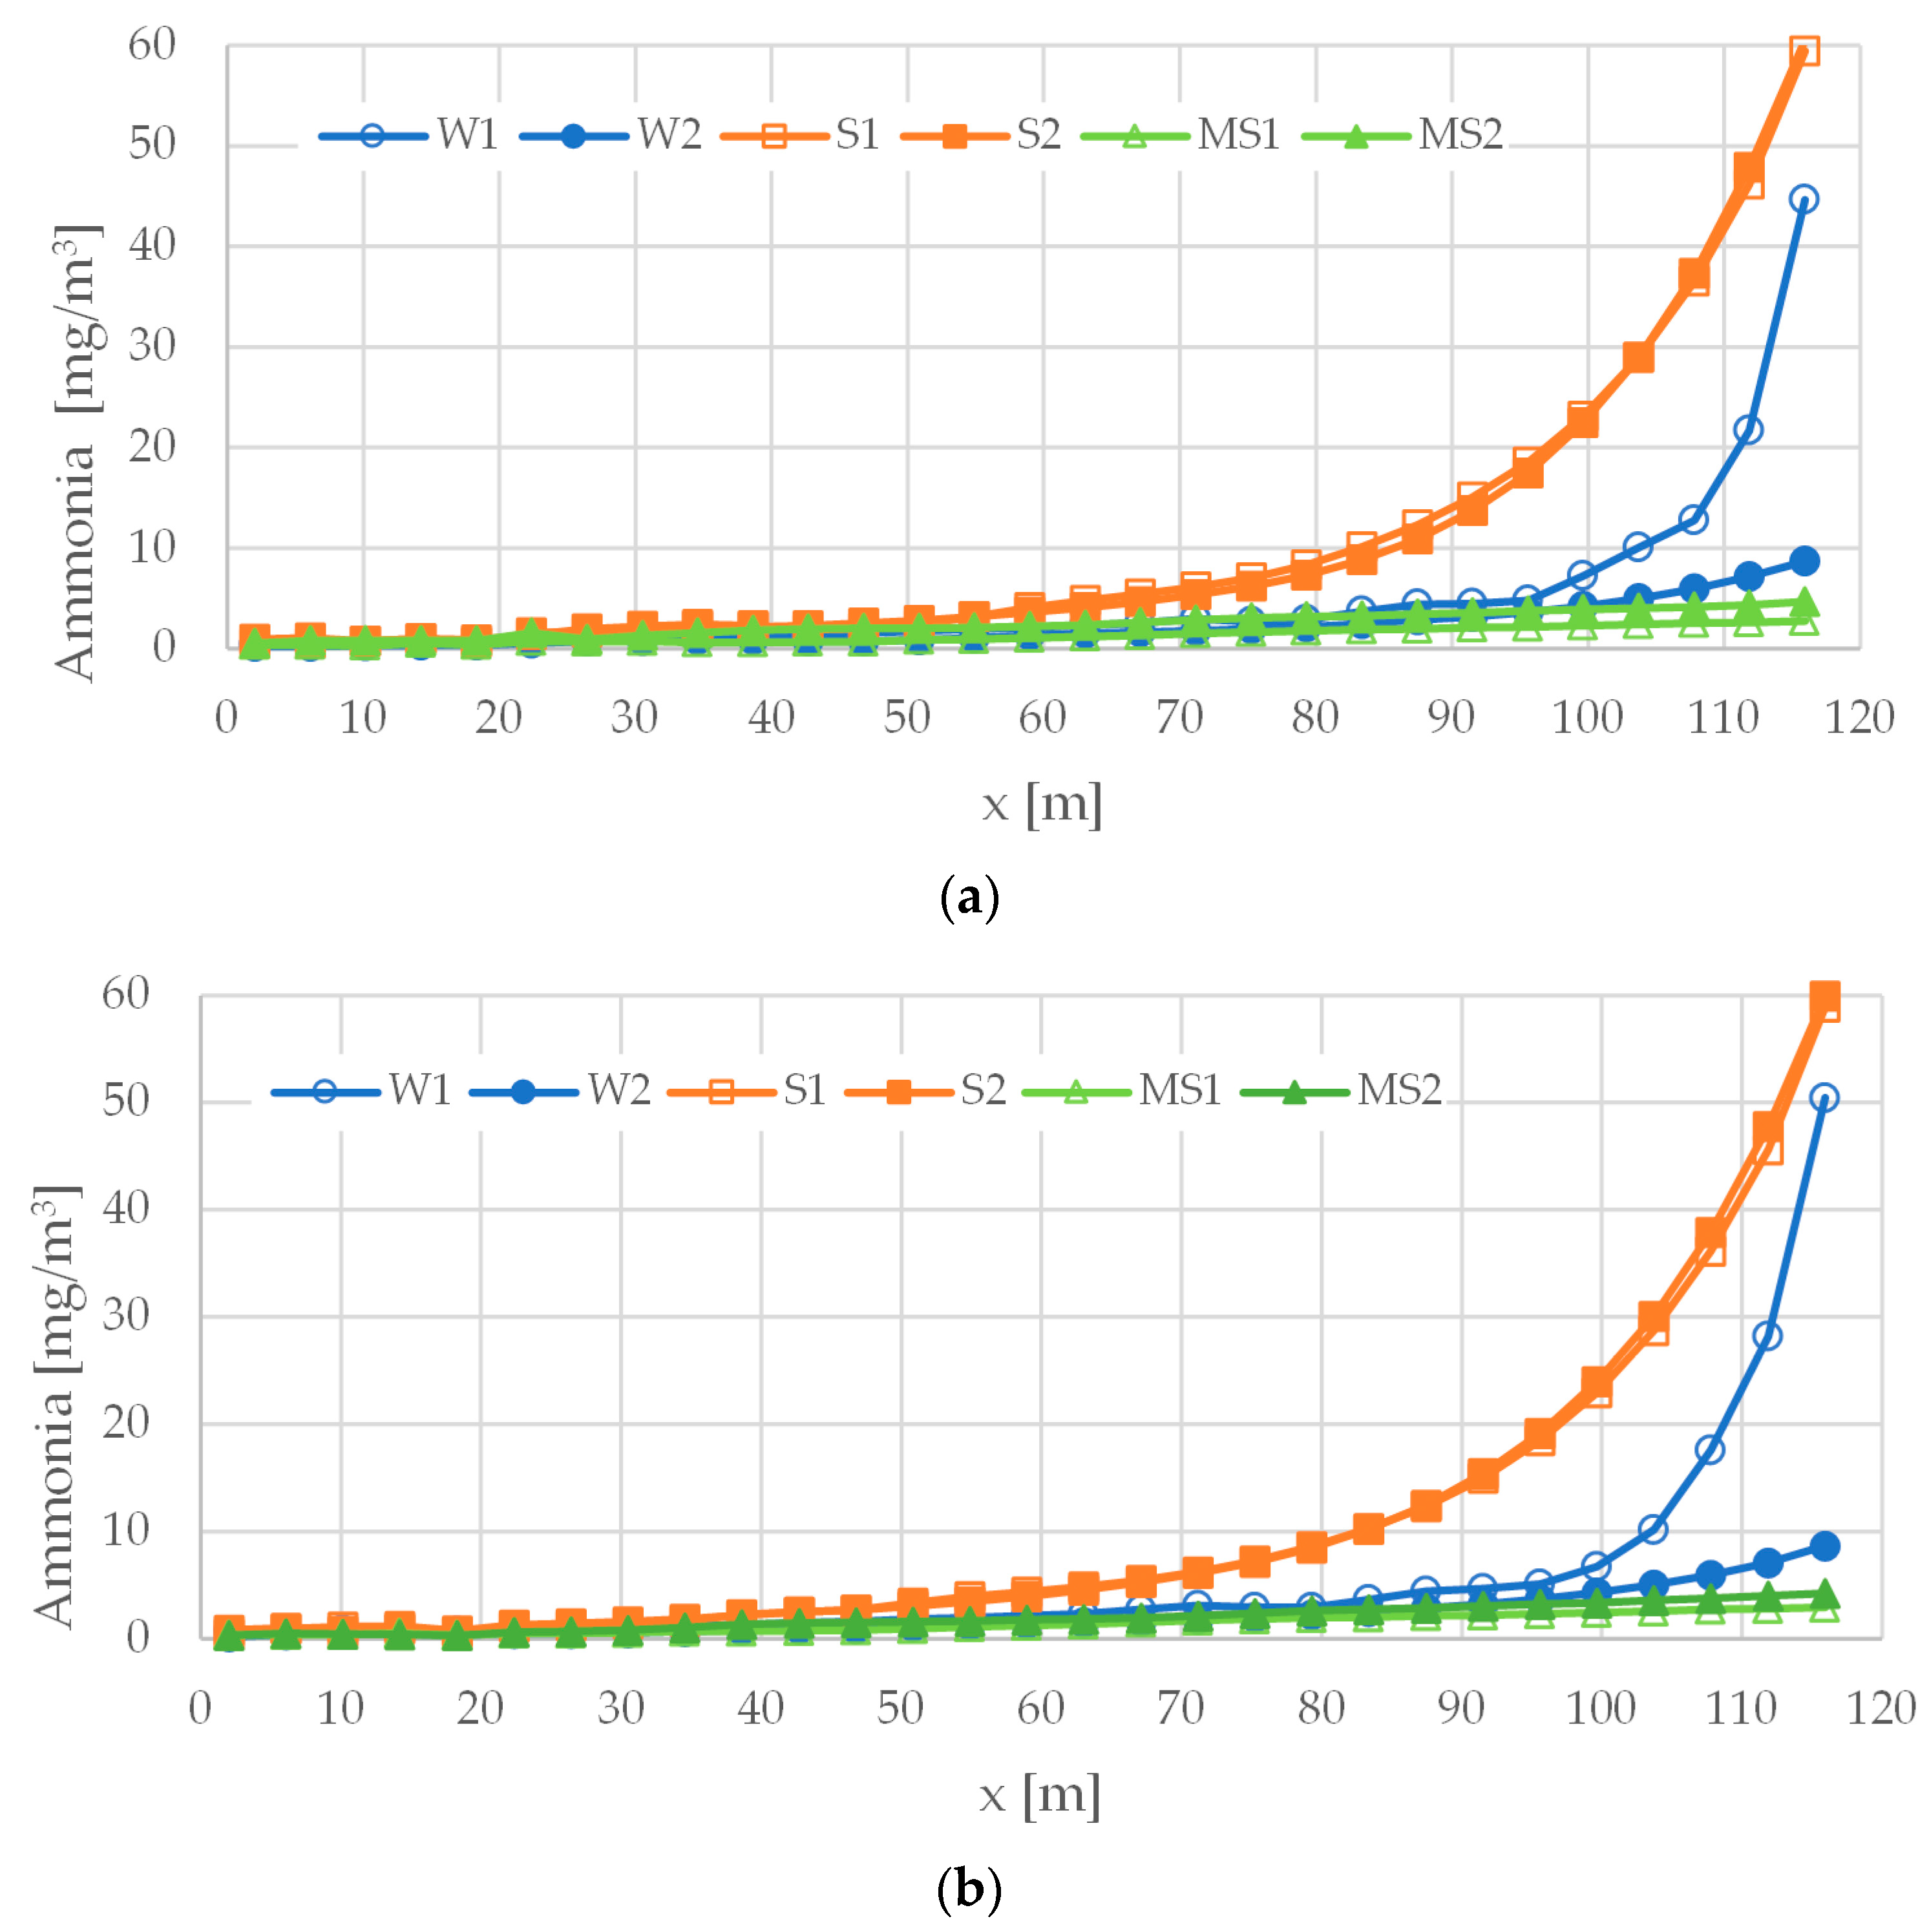
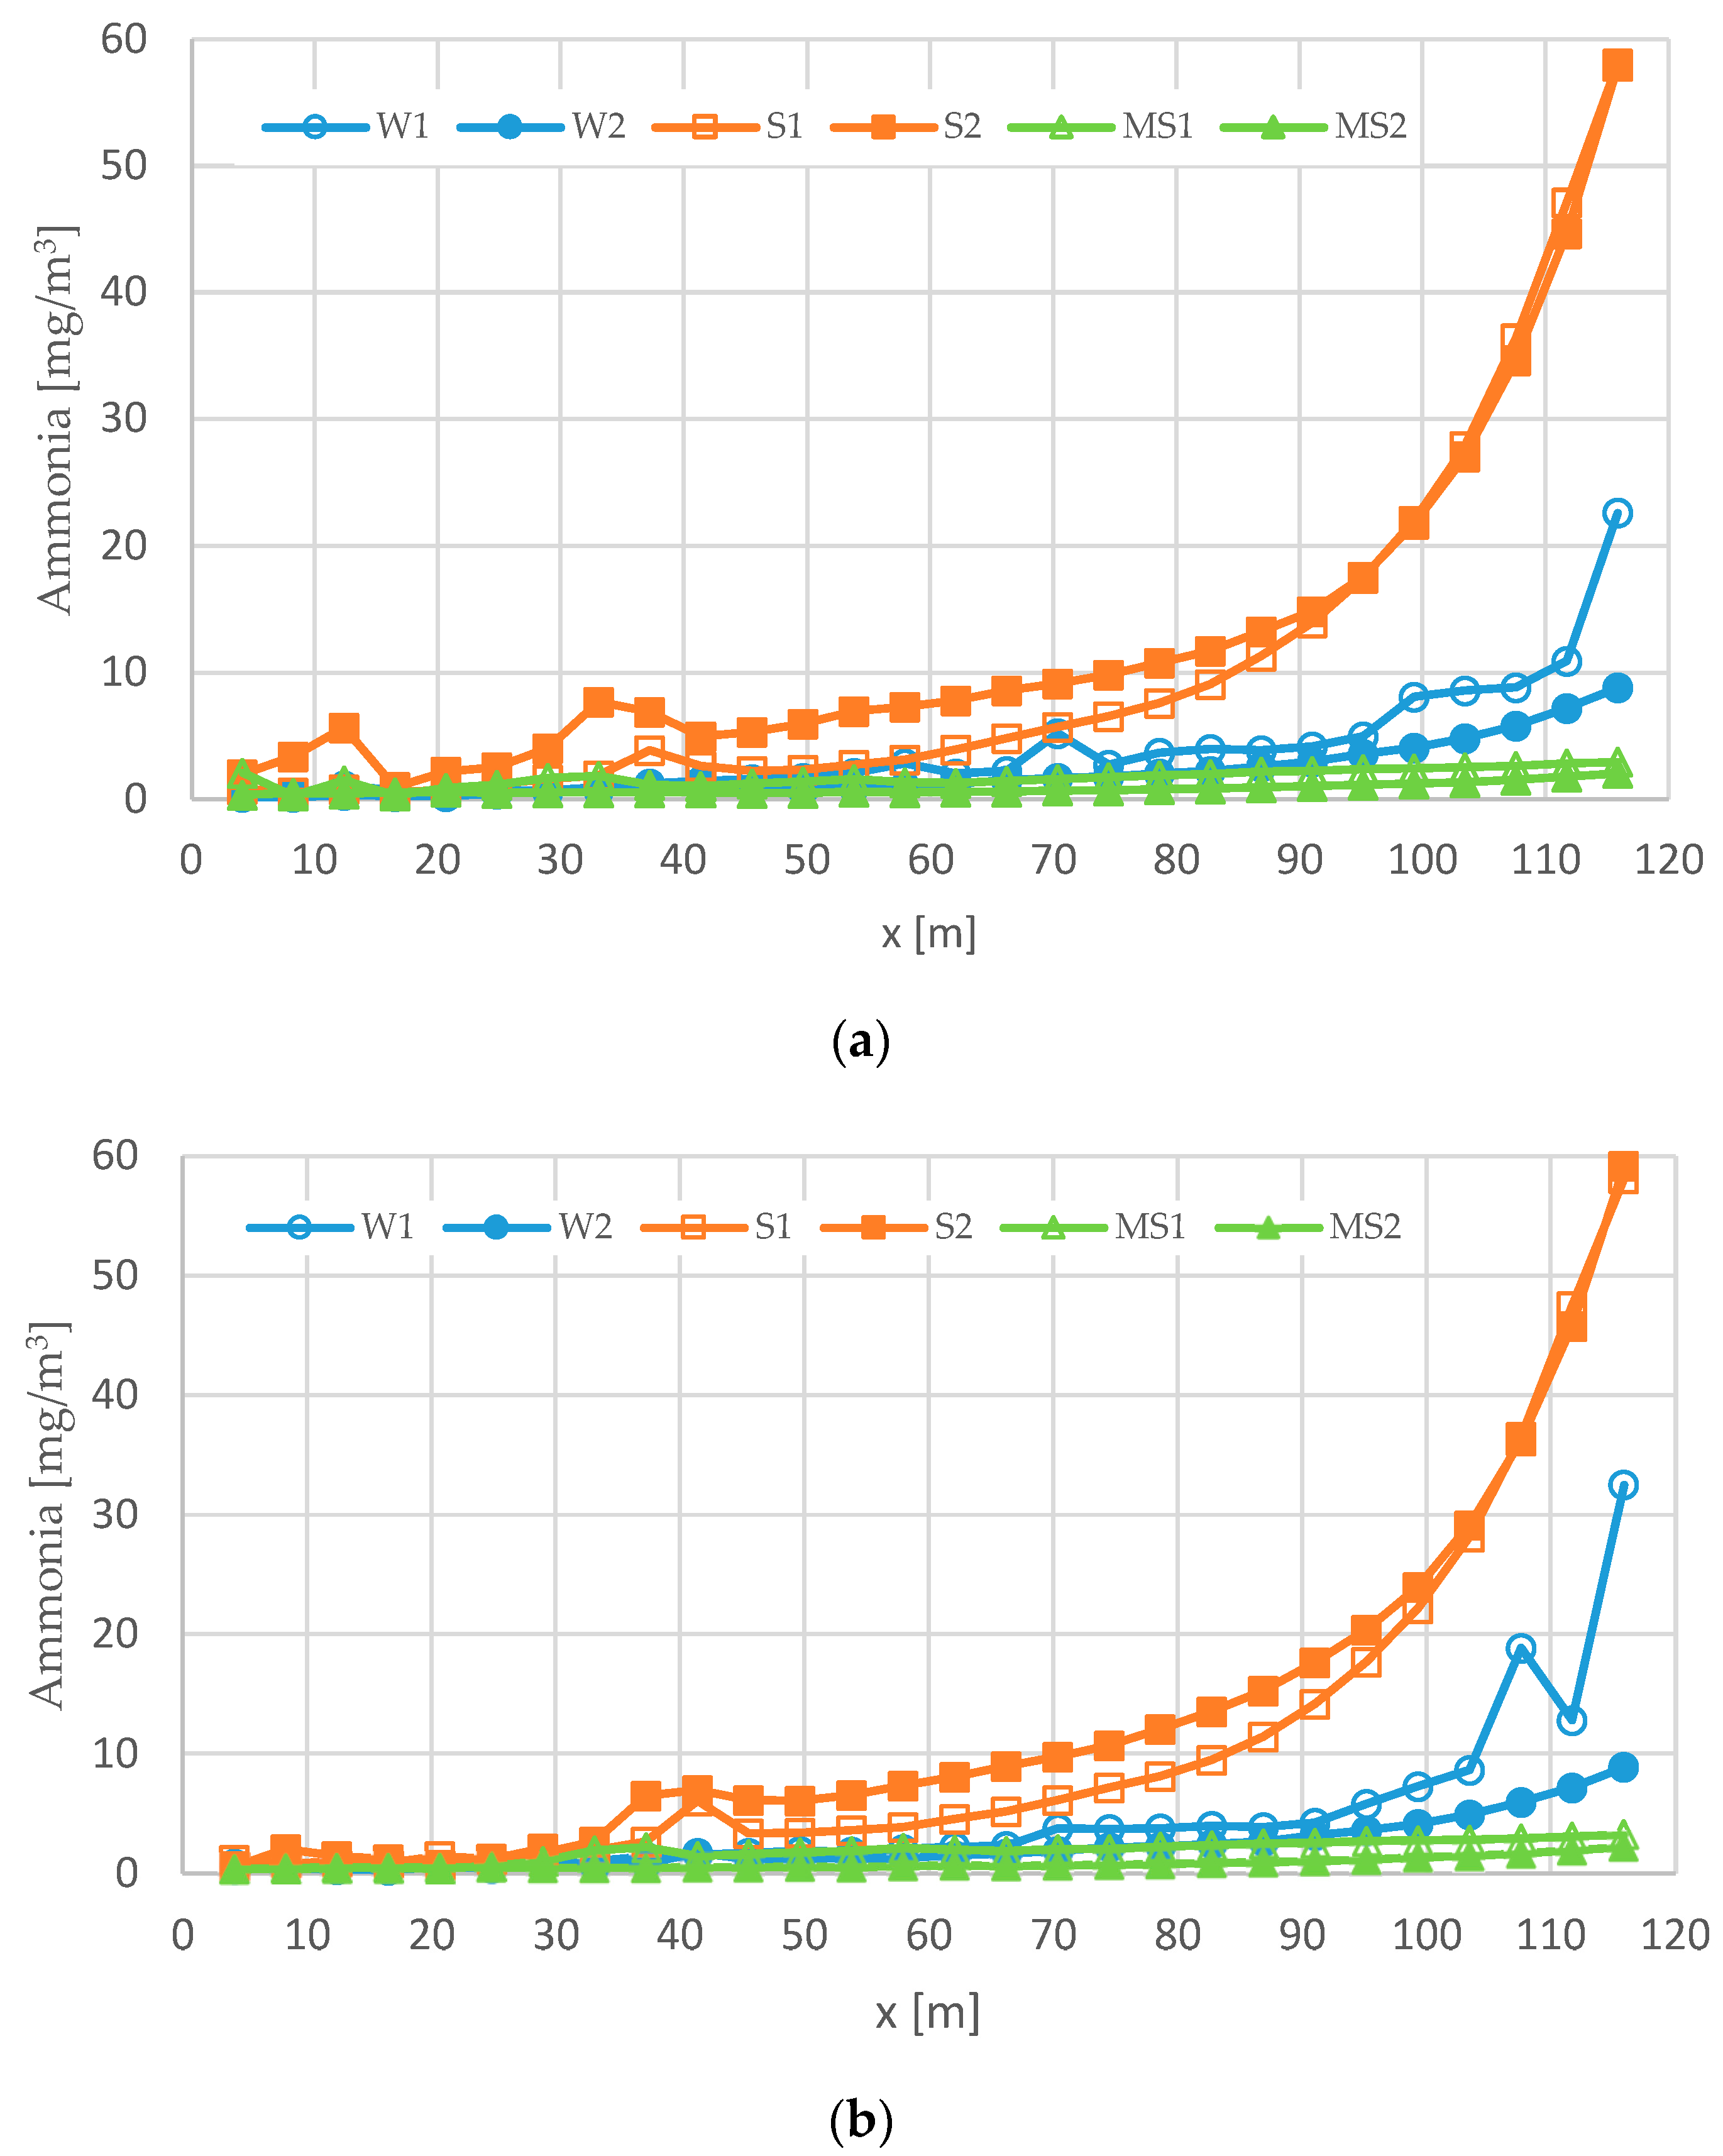
To better understand the NH3 distribution, this property was averaged in the transversal y direction using 15 sampling points and plotted in Figure 8 as a function of the longitudinal x direction at height z = 0.5 m and z = 1.8 m. Although the vertical scale of the graph was limited to 30 mg/m3 for better depicting the evolution of NH3 concentration in the first half of the tunnel, NH3 concentration reached values larger than 40 mg/m3 for configurations S1, S2, and W1.
From the Figure 7 it may be concluded that NH3 is efficiently removed from the building in configurations MS1, MS2, and W2. On the other hand, in configurations S1, S2, and W1 the NH3 concentration substantially increased after the mid-length of the tunnel. It may be also noticed in Figure 8a,b that the NH3 concentration distribution was rather similar at heights of z = 0.5 m and z = 1.8 m. Previous studies [3,4,6] recommended a limit of 7.6 mg/m3 (10 ppm) of NH3 to maintain a good indoor air quality on broiler buildings, but the threshold value of 15.2 mg/m3 (20 ppm) is recommended as the limit for a short-period exposure. Note that long-term NH3 toxicity in the broiler building may increase the susceptibility of birds to the adverse effects of NH3 even at 15.2 mg/m3 [4,6].
Figure 9 represents the NH3 concentration along the longitudinal x direction at y = 7.5 m, at constant heights from the ground z = 0.5 m and z = 1.8 m. Comparing these local concentration values obtained at a specific y transversal location with the concentration values averaged over the transversal direction depicted in Figure 8, it may be noted that, at least up to x = 60 m, the local concentration values (Figure 9a) were always higher. Thus, despite the same trend being observed, it may be concluded that the experimental point measurement methodology was, in this case, overestimating the values of gas concentration.
We can also state that, taking into account the numerical results, it was verified that the NH3 concentration at the outlets was much higher than the average values obtained in the longitudinal line, the average in the horizontal plane (cf. Figure 8), and also the values measured experimentally at the four sample collection points (cf. Figure 3). Thus, it is predicted that the methods that consist of collecting the gases at the outlet may overestimate the average concentration inside the building.

4.2.3. Velocity Distribution

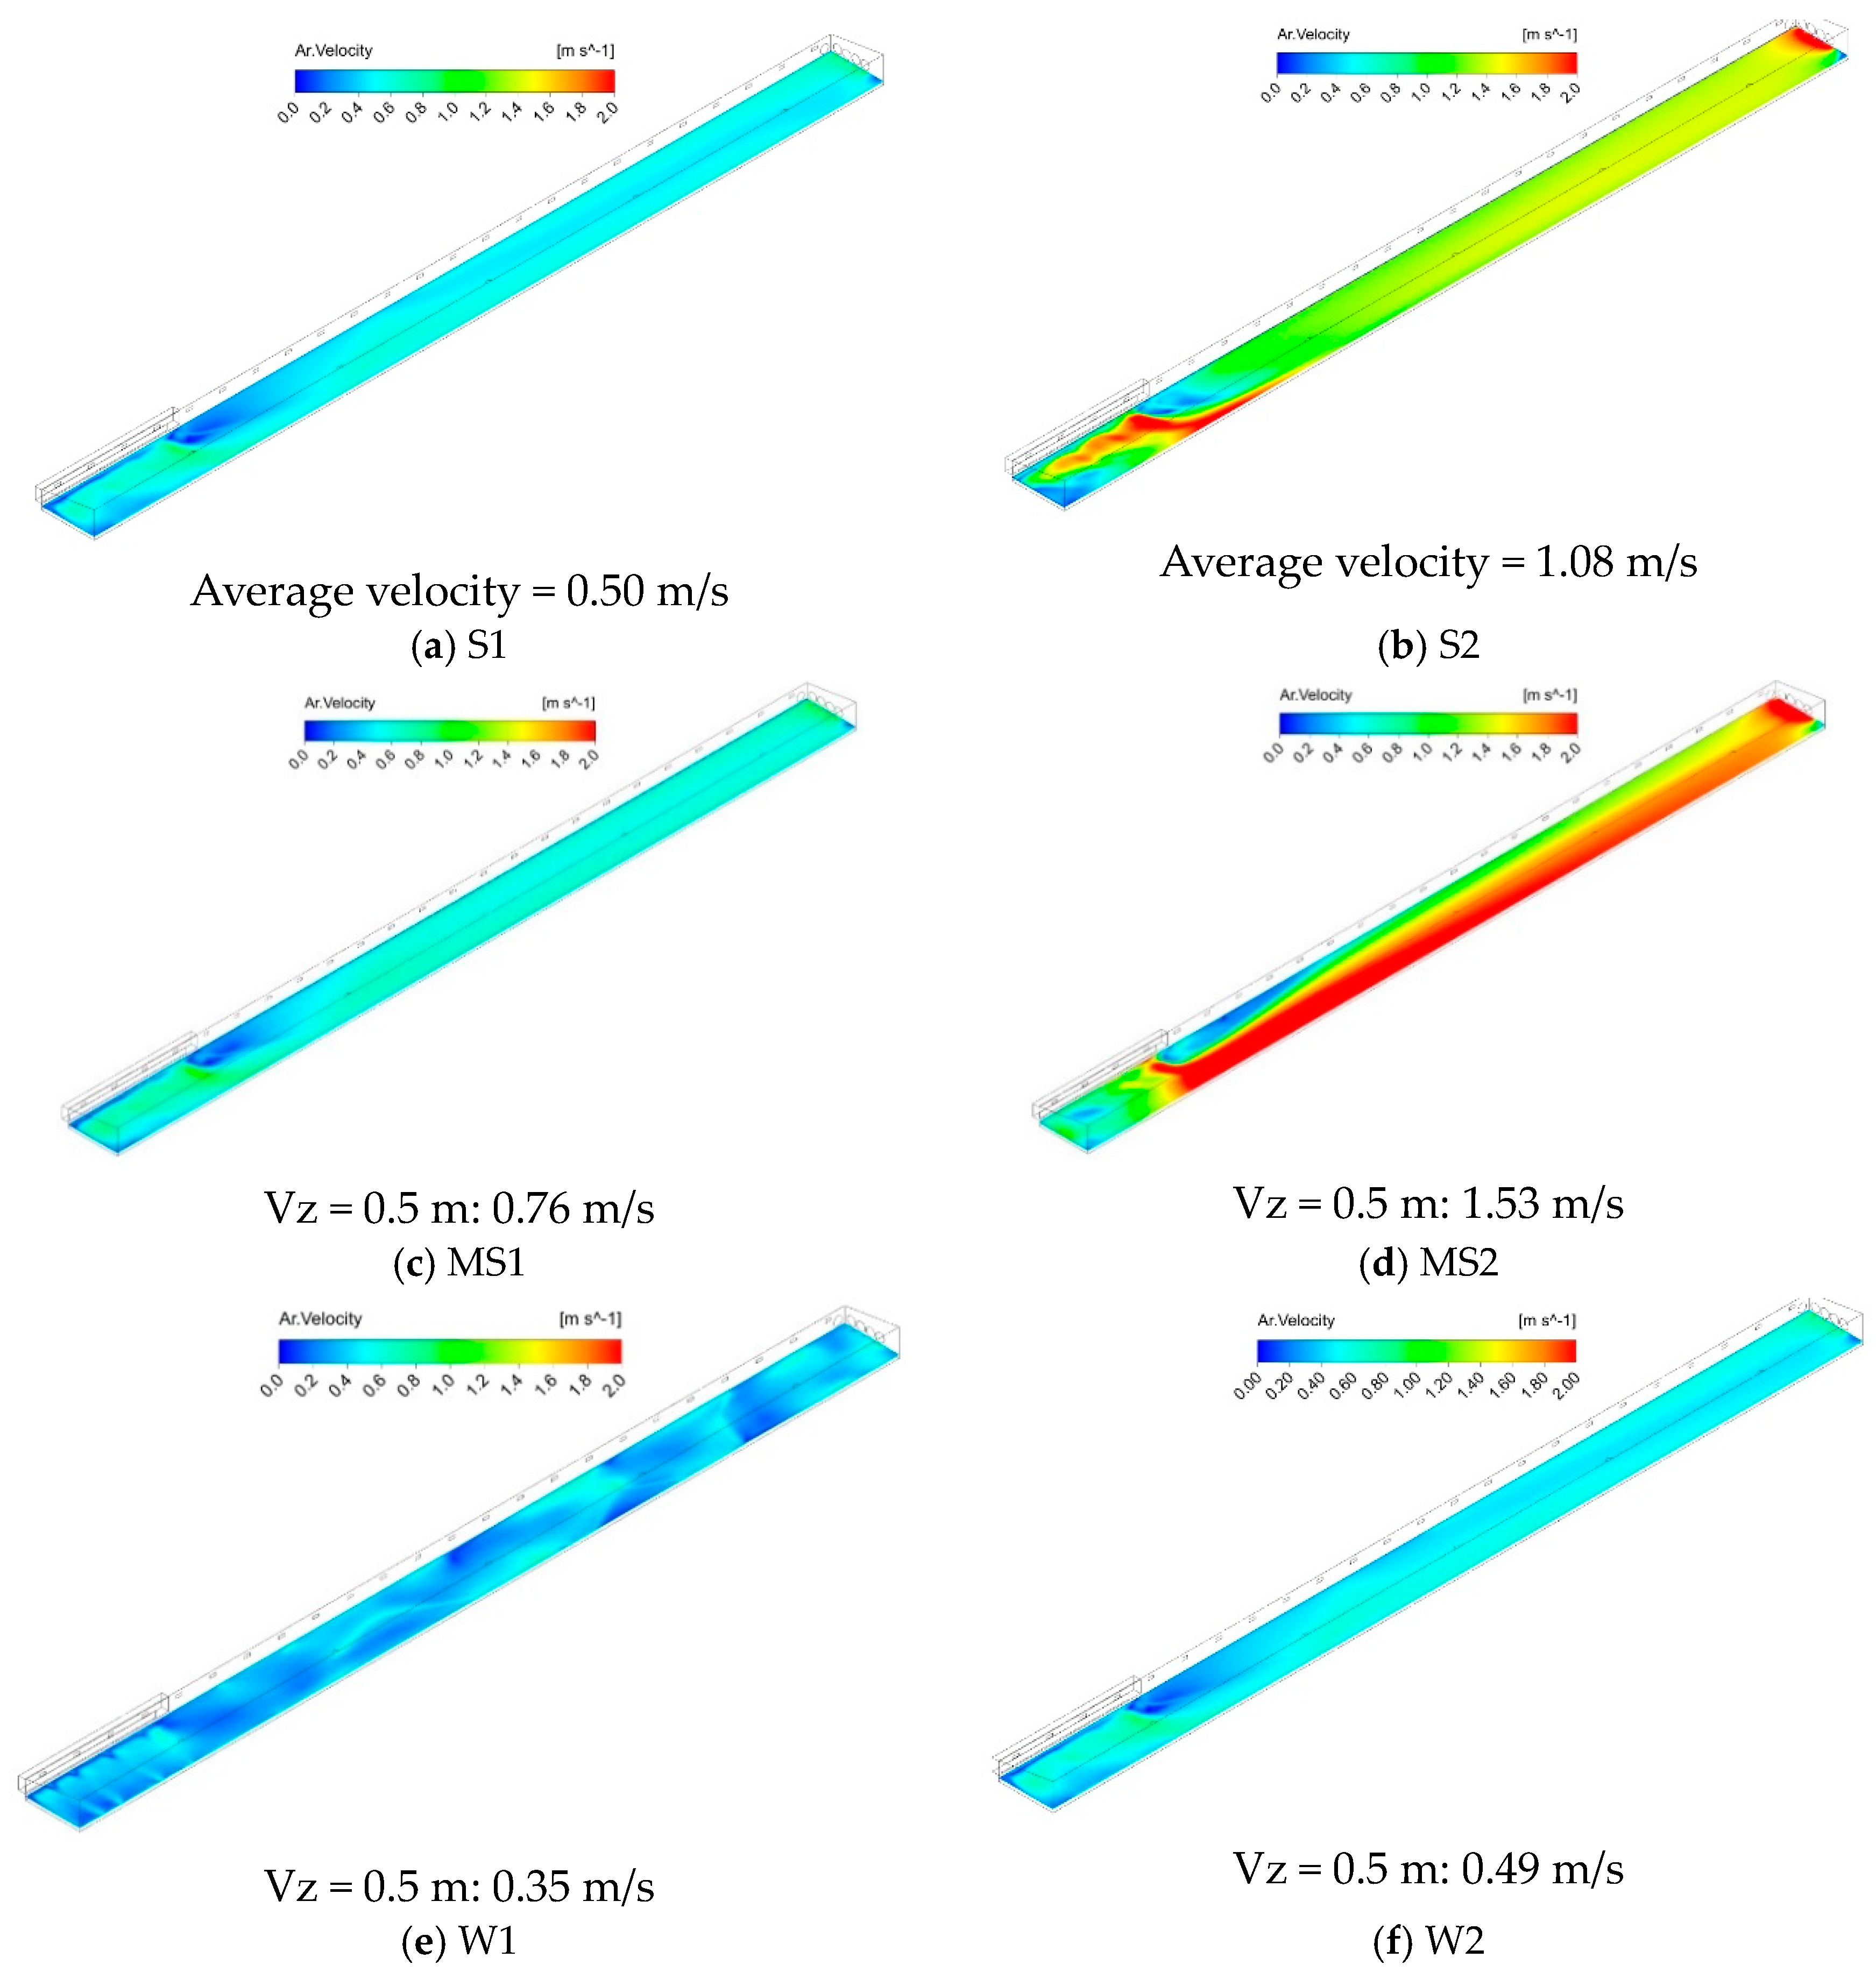
Figure 10 shows the velocity distribution colored with the local air velocity values, for all the configurations. It also shows the average velocity values at z = 0.5 m. Not surprisingly, the highest values of indoor air velocity were verified in configurations MS2 and S2, because these were also the configurations with the highest exhaust ventilation rates imposed in the numerical calculation. Particularly in MS2 configuration, there was a large central extension where velocity exceeded 2 m/s. The same occurred in configuration S2, but only in the area in front of the air inlets. The highest velocity values were observed at the outlet surface (exhaust fans). These high velocity areas were prone to causing more stress to the broilers. However, we must emphasize that these situations refer to the final stage of the growing period (day 30), characterized by a low mortality rate, due to the broilers’ greater resistance. The opposite was verified for the winter configurations, and also for S1, with zones where the velocity did not reach 1 m/s, representing difficulties for the removal of gaseous pollutants, in particular NH3, as verified in Figure 7 and Figure 8.
For configurations W1 and W2, as the exhaust air flow rate was lower, the inner air velocities were also lower, with average velocity values 0.35 m/s and 0.49 m/s in plane z = 0.5 m, for W1 and W2 configurations, respectively. In these configurations, as the inner air velocities were lower, it was verified that buoyancy forces were significant, overlapping with the inertial forces of the longitudinal flow, which caused an increase in NH3 concentration along the tunnel (cf. Figure 9).
In all situations, the existence of a recirculation and almost stagnation zone, near the lateral wall and immediately after the air intake, approximately between x = 20 m and x = 30 m, can also be seen.
Cited by [16,32] reported that the optimum air velocity in individual boiler building should be in the range between 1.5 m/s and 2 m/s. In our study, numerical results identified several zones where air velocity was lower than 1 m/s, particularly in the winter configurations, and higher than 2 m/s observed in MS2 configuration (cf. Figure 10).

5. Conclusions

In this study a 3D numerical model was developed to predict the flow field pattern inside a broiler building. Six different configurations were explored, corresponding to summer, winter and mid-season situations, for which experimental data were available. The numerical simulations considered all available experimental data, both geometrical and dynamic, used as initial and boundary conditions.
The experimental results of the average NH3 concentration obtained at four sampling points for the six explored configurations were compared with the numerical results, and, globally, quite a good agreement between the results from both experimental and numerical methodologies was verified.
The results of numerical simulations, namely through streamlines, showed that the flow pattern inside the broiler building was quite complex, and very dependent on the thermal and dynamic initial conditions. This complexity is justified by the geometrical configuration, namely the positions of the of the air inlet and outlet, and by the confrontation of the inertia forces of the flow and the thermal buoyancy forces.
The flow complexity and large local variation of properties reinforce the special attention needed in the choice of the location of sample collection points in field-experiment measurements, to ensure that the property values represent their value of the entire domain. This is one of the important contributions of the paper.
The numerical model allowed the calculation of the NH3 distribution in the whole domain. Depending on the configuration, gaseous pollutants such as NH3 may or may not be removed efficiently. It was found that in winter and summer configurations, in which the extraction flow rate was lower, the NH3 concentration increased considerably along the tunnel, with no efficient removal of NH3. On the other hand, in situations where the air extraction flow rates were high (mid-season), the NH3 was efficiently removed, maintaining low concentrations throughout the tunnel.
Finally, concerning the velocity field, the numerical simulations allowed us to identify configurations where the indoor air velocity was lower than recommended, mostly in winter, but also in summer situations. In fact, in configurations W1, W2, and S1, in which the extraction flow rates were lower, it could be observed that, at the level slightly above the birds (z = 0.5 m), there are zones where the air velocity was less than 1 m/s. This justified the verified difficulty in the removal of NH3 in these configurations. In addition, the selection of indoor sampling points should be made carefully for a precise assessment of the gas indoor concentrations.

Author Contributions

Conceptualization, J.C.G. and J.L.S.P.; methodology, J.C.G., A.M.G.L. and J.L.S.P.; software, J.C.G. and A.M.G.L.; validation, J.C.G., A.M.G.L. and J.L.S.P.; formal analysis, J.C.G. and A.M.G.L.; investigation, J.C.G., A.M.G.L. and J.L.S.P.; resources, J.C.G., A.M.G.L. and J.L.S.P.; data curation, J.C.G., A.M.G.L. and J.L.S.P.; writing—original draft preparation, J.C.G.; writing—review and editing, J.C.G., A.M.G.L. and J.L.S.P.; visualization, J.C.G.; supervision, J.C.G.; project administration, J.C.G. and J.L.S.P.; funding acquisition, J.L.S.P. All authors have read and agreed to the published version of the manuscript.

Funding

This work is supported by National Funds by FCT—Portuguese Foundation for Science and Technology, under the project UIDB/04033/2020 and project UIDB/00681/2020.

Institutional Review Board Statement

Not applicable.

Data Availability Statement

Not applicable.

Acknowledgments

We would like to thank the CERNAS Research Centre and the Polytechnic Institute of Viseu for their support.

Conflicts of Interest

The authors declare no conflict of interest.

References

  1. USAD of Agriculture. Livestock and Poultry: World Markets and Trade. USDA Foreign Agricultural Service. 2022. Available online: https://www.fas.usda.gov/data/livestock-and-poultry-world-markets-and-trade (accessed on 15 September 2022).
  2. Anderson, K.; Moore, P.A.; Martin, J.; Ashworth, A.J. Evaluation of a Novel Poultry Litter Amendment on Greenhouse Gas Emissions. Atmosphere 2021, 12, 563. [Google Scholar] [CrossRef]
  3. Pereira, J.L.S.; Ferreira, S.; Pinheiro, V.; Trindade, H. Ammonia, Nitrous Oxide, Carbon Dioxide and Methane Emissions from Commercial Broiler Houses in Mediterranean Portugal. Water Air Soil Pollut. 2018, 229, 377. [Google Scholar] [CrossRef]
  4. Naseem, S.; King, A.J. Ammonia production in poultry houses can affect health of humans, birds, and the environment-techniques for its reduction during poultry production. Environ. Sci. Pollut. Res. Int. 2018, 25, 15269–15293. [Google Scholar] [CrossRef] [PubMed]
  5. Bittman, S.; Sheppard, S.C.; Hunt, D. Potential for mitigating atmospheric ammonia in Canada. Soil Use Manag. 2017, 33, 263–275. [Google Scholar] [CrossRef]
  6. Pereira, J.L.S.; Garcia, C.; Trindade, H.; Pereira, J.L.S.; Garcia, C.; Trindade, H. Review of Measures to Control Airborne Pollutants in Broiler Housing; IntechOpen: London, UK, 2023. [Google Scholar] [CrossRef]
  7. Oliveira, M.D.; Sousa, F.C.; Saraz, J.O.; Calderano, A.A.; Tinôco, I.F.F.; Carneiro, A.P.S. Ammonia Emission in Poultry Facilities: A Review for Tropical Climate Areas. Atmosphere 2021, 12, 1091. [Google Scholar] [CrossRef]
  8. Berry Lott. Amônia. Avicultura Industrial. 2016. Available online: https://www.aviculturaindustrial.com.br/imprensa/amonia/20030711-113203-0098 (accessed on 15 September 2022).
  9. Broucek, J. Nitrous Oxide Release from Poultry and Pig Housing. Pol. J. Environ. Stud. 2018, 27, 467–479. [Google Scholar] [CrossRef]
  10. Anderson, K.; Moore, P.A., Jr.; Martin, J.; Ashworth, A.J. Effect of a new manure amendment on ammonia emissions from poultry litter. Atmosphere 2020, 11, 257. [Google Scholar] [CrossRef]
  11. Inoue, K.R.A.; Tinôco, I.d.F.F.; Cassuce, D.C.; Bueno, M.M.; Graña, A.L. Análise da Concentração de Amônia em Galpões de Frango de Corte Submetidos a Diferentes Dietas. Rev. Eng. Na Agric. Reveng. 2012, 20, 19–24. [Google Scholar] [CrossRef]
  12. Khan, D.R.; Wecke, C.; Liebert, F. An Elevated Dietary Cysteine to Methionine Ratio Does Not Impact on Dietary Methionine Efficiency and the Derived Optimal Methionine to Lysine Ratio in Diets for Meat Type Chicken. Open J. Anim. Sci. 2015, 5, 457–466. [Google Scholar] [CrossRef]
  13. Medeiros, R.; Santos, B.J.M.; Freitas, M.; Silva, O.A.; Alves, F.F.; Ferreira, E. A adição de diferentes produtos químicos e o efeito da umidade na volatilização de amônia em cama de frango. Cienc. Rural 2008, 38, 2321–2326. [Google Scholar] [CrossRef]
  14. Moore, P. Methods of Treating Manure. U.S. Patent 7011824, 14 March 2006. Available online: https://scholarworks.uark.edu/pat/121 (accessed on 9 September 2022).
  15. Vilela, M.D.O.; Gates, R.S.; Souza, C.D.F.; Junior, C.G.D.S.T.; Sousa, F.C. Nitrogen transformation stages into ammonia in broiler production: Sources, deposition, transformation and emission to environment. Dyna 2020, 87, 221–228. [Google Scholar] [CrossRef]
  16. Küçüktopcu, E.; Cemek, B.; Simsek, H.; Ni, J.-Q. Computational Fluid Dynamics Modeling of a Broiler House Microclimate in Summer and Winter. Animals 2022, 12, 867. [Google Scholar] [CrossRef] [PubMed]
  17. Blanes-Vidal, V.; Guijarro, E.; Balasch, S.; Torres, A.G. Application of computational fluid dynamics to the prediction of airflow in a mechanically ventilated commercial poultry building. Biosyst. Eng. 2008, 100, 105–116. [Google Scholar] [CrossRef]
  18. Gonçalves, J.C.; Costa, J.J.; Figueiredo, A.R.; Lopes, A.M.G. CFD modelling of aerodynamic sealing by vertical and horizontal air curtains. Energy Build. 2012, 52, 153–160. [Google Scholar] [CrossRef]
  19. Galdo, E.H.G. Evaluación de Alternativas en las Instalaciones Avícolas de Pollos de Carne para la Mejora de las Condiciones de Confort de los Animales; Instituto de Ciencia y Tecnología Animal, Universitat Politècnica de València: Valencia, Spain, 2017. [Google Scholar]
  20. Rong, L.; Nielsen, P.V.; Bjerg, B.; Zhang, G. Summary of best guidelines and validation of CFD modeling in livestock buildings to ensure prediction quality. Comput. Electron. Agric. 2016, 121, 180–190. [Google Scholar] [CrossRef]
  21. Iqbal, A.; Gautam, K.R.; Zhang, G.; Rong, L. Modelling of animal occupied zones in CFD. Biosyst. Eng. 2021, 204, 181–197. [Google Scholar] [CrossRef]
  22. Shin, H.; Kwak, Y.; Jo, S.-K.; Kim, S.-H.; Huh, J.-H. Applicability evaluation of a demand-controlled ventilation system in livestock. Comput. Electron. Agric. 2022, 196, 106907. [Google Scholar] [CrossRef]
  23. Pakari, A.; Ghani, S. Comparison of different mechanical ventilation systems for dairy cow barns: CFD simulations and field measurements. Comput. Electron. Agric. 2021, 186, 106207. [Google Scholar] [CrossRef]
  24. Tong, X.; Zhao, L.; Heber, A.J.; Ni, J.-Q. Development of a farm-scale, quasi-mechanistic model to estimate ammonia emissions from commercial manure-belt layer houses. Biosyst. Eng. 2020, 196, 67–87. [Google Scholar] [CrossRef]
  25. Li, H.; Rong, L.; Zong, C.; Zhang, G. A numerical study on forced convective heat transfer of a chicken (model) in horizontal airflow. Biosyst. Eng. 2016, 150, 151–159. [Google Scholar] [CrossRef]
  26. Li, J.; Suvarna, M.; Li, L.; Pan, L.; Pérez-Ramírez, J.; Ok, Y.S.; Wang, X. A review of computational modeling techniques for wet waste valorization: Research trends and future perspectives. J. Clean. Prod. 2022, 367, 133025. [Google Scholar] [CrossRef]
  27. Osorio, R.H.; Tinôco, I.F.; Mendes, L.; Guerra, L.G.; Barbari, M.; Baptista, F.J.; Tinôco, B.F. CFD modeling of the thermal environment in a negative pressure tunnel ventilated broiler barn during the first week of life. In Proceedings of the 7th European Conference on Precision Livestock Farming, Milan, Italy, 15–18 September 2015. [Google Scholar]
  28. Chepete, H.J.; Xin, H. Heat and Moisture Production of Poultry and Their Housing Systems: Pullets and Layers. ASHRAE Trans. 2004, 110, 286–299. [Google Scholar]
  29. Franco, A.; Valera, D.L.; Peña, A.; Pérez, A.M. Aerodynamic analysis and CFD simulation of several cellulose evaporative cooling pads used in Mediterranean greenhouses. Comput. Electron. Agric. 2011, 76, 218–230. [Google Scholar] [CrossRef]
  30. Fidaros, D.; Baxevanou, C.; Bartzanas, T.; Kittas, C. Numerical study of mechanically ventilated broiler house equipped with evaporative pads. Comput. Electron. Agric. 2018, 149, 101–109. [Google Scholar] [CrossRef]
  31. Küçüktopcu, E.; Cemek, B. Evaluating the influence of turbulence models used in computational fluid dynamics for the prediction of airflows inside poultry houses. Biosyst. Eng. 2019, 183, 1–12. [Google Scholar] [CrossRef]
  32. Yahav, S.; Straschnow, A.; Vax, E.; Razpakovski, V.; Shinder, D. Air Velocity Alters Broiler Performance Under Harsh Environmental Conditions1. Poult. Sci. 2001, 80, 724–726. [Google Scholar] [CrossRef]
Figure 1. Geometry domain representative of the broiler building, with the inlet fresh air in the evaporative pad (lower left corner of the figure), and the outlet at the end of the tunnel.
Agriculture 13 01101 g001
Figure 2. Details of the mesh, showing the mesh refinement at the outlet and inlet surfaces, in the litter and in the evaporative pad of the broiler building.
Agriculture 13 01101 g002
Figure 3. Average NH3 volume fraction values at the global outlet surface and at z = 0.2 m plane, for the 4 tested meshes of the broiler building.
Agriculture 13 01101 g003
Figure 4. Experimental and numerical average values of NH3 concentration from 4 collecting points, and for the different configuration simulated in the broiler building.
Agriculture 13 01101 g004
Figure 5. Streamlines for two configurations in the broiler building.
Agriculture 13 01101 g005
Figure 6. Vector profile in a plane yz, and at x = 15 m, for the configurations: (a) S1, and (b) MS2 in the broiler building.
Agriculture 13 01101 g006
Figure 7. Color contours of NH3 concentration (volume fraction) in a plane at z = 0.5 m from ground, for the 6 configurations simulated in the broiler building.
Agriculture 13 01101 g007
Figure 8. Average NH3 concentration at each x location at height (a) z = 0.5 m and (b) z = 1.8 m in the broiler building.
Agriculture 13 01101 g008
Figure 9. Ammonia concentration profile along the tunnel in a line (x direction), located at y = 7.5 m and at high of: (a) z = 0.5 m and (b) z = 1.8 m in the broiler building.
Agriculture 13 01101 g009
Figure 10. Horizontal plane at z = 0.5 m, colored with the local velocity for the 6 simulated configurations in the broiler building.
Agriculture 13 01101 g010
Table 1. Details of the configurations simulated in broiler building.
ConfigurationSeasonCorrespondent DateGrowth Period (day)Hour of the Day (h)Broilers NumberLiveweight (g)
W1Winter21 March 201831637,1801141.0
W2Winter21 March 2018311437,1531170.0
S1Summer23 July 201828636,3091214.1
S2Summer23 July 2018281436,2921245.0
MS1Mid-season7 October 201730638,7181515.6
MS2Mid-season7 October 2017301438,7121533.0
Table 2. Boundary and initial conditions of the simulated configurations in broiler building.
ConfigurationTint (°C)Hrint (%)Tout (°C)Hrout (%)Outlet Volume Flow Rate (m3/h)Outlet Mass Flow Rate (kg/s)NH3 Litter Emission (kg/(m2·s))Broiler Heat Released (W/m2)
W124.061.66.065.446,300.316.02.87 × 10−8220.95
W225.359.013.254.772,906.922.03.44 × 10−8226.40
S126.180.919.688.290,620.530.29.40 × 10−8344.39
S229.162.725.955.5210,754.270.31.86 × 10−07353.00
MS124.773.49.594.3115,777.439.16.99 × 10−8305.06
MS230.439.228.726.9300,510.0100.71.90 × 10−7309.09
Table 3. Mesh details of the broiler building.
No. NodesNo. Elements
Mesh 1479,973165,6020
Mesh 2608,814234,3413
Mesh 31,222,8945478,648
Mesh 42,241,3411,058,1101
Disclaimer/Publisher’s Note: The statements, opinions and data contained in all publications are solely those of the individual author(s) and contributor(s) and not of MDPI and/or the editor(s). MDPI and/or the editor(s) disclaim responsibility for any injury to people or property resulting from any ideas, methods, instructions or products referred to in the content.