Article

Non-Destructive Hyperspectral Imaging and Machine Learning-Based Predictive Models for Physicochemical Quality Attributes of Apples during Storage as Affected by Codling Moth Infestation †

by
Alfadhl Y. Khaled
1,
Nader Ekramirad
1,
Kevin D. Donohue
2,
Raul T. Villanueva
3 and
Akinbode A. Adedeji
1,*
1
Department of Biosystems and Agricultural Engineering, University of Kentucky, Lexington, KY 40546, USA
2
Department of Electrical and Computer Engineering, University of Kentucky, Lexington, KY 40506, USA
3
Department of Entomology, University of Kentucky, Princeton, KY 42445, USA
*
Author to whom correspondence should be addressed.
This paper is a part of the PhD Thesis of Ekramirad N, presented at University of Kentucky (USA).
Agriculture 2023, 13(5), 1086; https://doi.org/10.3390/agriculture13051086
Submission received: 17 April 2023 / Revised: 5 May 2023 / Accepted: 18 May 2023 / Published: 19 May 2023
(This article belongs to the Special Issue Applications of Data Analysis in Agriculture)

Abstract

:
The demand for high-quality apples remains strong throughout the year, as they are one of the top three most popular fruits globally. However, the apple industry faces challenges in monitoring and managing postharvest losses due to invasive pests during long-term storage. In this study, the effect of codling moth (CM) (Cydia pomonella [Linnaeus, 1758]), one of the most detrimental pests of apples, on the quality of the fruit was investigated under different storage conditions. Specifically, Gala apples were evaluated for their qualities such as firmness, pH, moisture content (MC), and soluble solids content (SSC). Near-infrared hyperspectral imaging (HSI) was implemented to build machine learning models for predicting the quality attributes of this apple during a 20-week storage using partial least squares regression (PLSR) and support vector regression (SVR) methods. Data were pre-processed using Savitzky–Golay smoothing filter and standard normal variate (SNV) followed by removing outliers by Monte Carlo sampling method. Functional analysis of variance (FANOVA) was used to interpret the variance in the spectra with respect to the infestation effect. FANOVA results showed that the effects of infestation on the near infrared (NIR) spectra were significant at p < 0.05. Initial results showed that the quality prediction models for the apples during cold storage at three different temperatures (0 °C, 4 °C, and 10 °C) were very high with a maximum correlation coefficient of prediction (Rp) of 0.92 for SSC, 0.95 for firmness, 0.97 for pH, and 0.91 for MC. Furthermore, the competitive adaptive reweighted sampling (CARS) method was employed to extract effective wavelengths to develop multispectral models for fast real-time prediction of the quality characteristics of apples. Model analysis showed that the multispectral models had better performance than the corresponding full wavelengths HSI models. The results of this study can help in developing non-destructive monitoring and evaluation systems for apple quality under different storage conditions.

1. Introduction

Apples are considered one of the most important fruits that are a source of nutrients such as vitamins, minerals, and bioactive compounds, providing so many health benefits [1]. However, apples, like other fruits, are highly perishable produce that require proper preservation to reduce the degradation of macro and micro-nutrients and to extend their shelf life [2]. For this, apples are typically packaged and kept at a desired low temperature of 32–39 °F (0 °C to 4 °C) range, using different refrigeration systems during postharvest processes, transportation, and long-term storage. Generally, this conditioning reduces and delays microbial growth and enzymatic reactions, thereby improving overall apple quality, reducing mass loss, and extending its shelf-life [3].
Codling moth (CM), (Cydia pomonella L.) is the most problematic pest to the apple industry in the United States that can have large economic effects if uncontrolled [4]. Our group studied methods to non-destructively (NDT) detect and sort CM-infested apples with high accuracy [5,6,7,8,9]. There is greater interest in the NDT approach due to zero-tolerance for the occurrence of CM in most international destinations, particularly Asia, for U.S. apples, where there may be an import ban if a pest such as CM is entrained in a shipment. Cold storage is one of the system approaches used to reduce the risk of possible pest infestation. To meet the severe phytosanitary regulations for apples, cold storage treatment was already used against the apple maggot and the oriental fruit moth pests [10,11]. Normally, the CM begins to reproduce by laying eggs on apples and the surrounding leaves at temperatures above 10 °C. However, when they are exposed to a temperature lower than this or colder temperature below 1 °C, the physiological condition of the CM larvae undergoes preconditioning for diapause, an inactive state that allows the larvae to last through the winter season within their cocoons [12]. Diapausing larvae do not feed and are freeze-tolerant [9]. However, cold storage may not solve and eliminate CM in the apple during shipments to foreign markets and can cause some physiochemical changes to apples if its temperature falls below a certain threshold that can cause physiological damage, such as a chilling injury. While it is known that cold storage will slow down the CM’s activities, a better understanding of the impact of cold storage conditions on quality attributes of healthy and infested apples is desired in this study.
Inefficient apple storage in terms of temperature and humidity can change the fruit quality, including external and internal quality [13]. In terms of the external quality of apples, they are typically evaluated based on physical appearance including, shape, color, size, and the presence or absence of surface defects. These attributes affect the pricing of horticultural products in the market. The internal quality of apples, however, refers to their nutritional value, texture, and flavor. The internal quality features cannot be evaluated using visual inspection and they often require destructive physicochemical analysis such as a Brix refractometer to test the soluble solids content (SSC) and the Magness-Taylor test for firmness. Firmness is the primary textural attribute of horticultural products, and sensory properties such as bitterness, sweetness, and sourness, as well as various volatile compounds, form the characteristic flavor [14]. Thus, there is a need to study the effect of cold storage on the important quality attributes of apples and to develop quality predicting models using NDT evaluation methods. The evaluation of these internal qualities was a key theme in the non-destructive quality assessment of horticultural products [15]. Some studies explored different techniques for the non-destructive evaluation of apple quality features. These techniques include machine vision [16], visible-near infrared (Vis/NIR) spectroscopy [17], and computed tomography (CT) [18]. Most of these techniques have limitations, including a long setup process, high cost, and sensitivity to changes in the environmental condition.
Hyperspectral imaging (HSI) emerged as a promising tool in detecting apple quality, as it combines imaging and spectroscopy technologies for providing spatial and spectral information of the sample simultaneously. Through this integration, HSI can detect a sample’s external and internal quality characteristics [19]. The HSI technique, which is based on the relation between light scattering, structure, and textural properties of biological tissues, uses a highly focused light beam to generate scattering images to enhance its assessment of fruit qualities. Lu [20] applied Vis/NIR HSI to evaluate the SSC and firmness of two types of apple varieties, namely golden delicious and red delicious. The author used the artificial neural networks (ANN) model to analyze the data and found that the coefficient of determination (R2) for SSC and firmness prediction were 0.79 and 0.76 for golden delicious and red delicious apples, respectively. It was concluded that the relatively poor predictions for red delicious apples might be attributed to their irregular fruit shape, which could have negatively affected the scattering measurements. Relatively poor predictions of SSC using Vis/NIR HSI compared to point Vis/NIR spectroscopy could be attributed to the lower signal-to-noise ratio and the fact that the light scattering technique tends to be suitable in predicting structural features such as firmness than SSC. In addition, using NIR HSI in comparison to Vis/NIR system will ensure full coverage of the spectral absorption bands such as water (1150, 1450, and 1900 nm), lipids (1040, 1200, 1400, and 1700 nm), and collagen (near 1200 and 1500 nm) at the longer wavelength range [21]. For example, Ma et al. [21] applied near-infrared HSI in 913 to 2519 nm to predict the SSC in Fuji apples and obtained a higher R2 of 0.89 using PLS regression.
Vis-NIR HSI was wildly used for the quality assessment of fruits because of its lower cost than that of longer wavelength range NIR. However, the absorption of the chemical component of tissue such as water, lipids, and collagen at the longer wavelength (NIR) range is much more conspicuous than the features observed in the Vis-NIR range. Thus, the longer wavelengths of NIR HSI have the potential to provide enhanced sensitivity compared to the Vis-NIR range [21]. In addition, there is no study that investigated the cold storage effect on CM-infested apples in terms of the quality of apples as well as the prediction of the quality of the fruit using the spectral information from the HSI method. Since any biological variability will affect the prediction of the quality parameters and the developed models [22], it is necessary to study the CM-infestation variability in the measured spectra. This gap in knowledge indicates a need to understand the influence of cold storage on CM infestation and the ability to use the HSI approach to predict physicochemical changes in healthy apples under different storage conditions. The main objectives of this study were to study the effect of the storage conditions (temperature and time) on the quality changes of apples as well as to predict the quality characteristics of apples using HSI combined with machine learning regression models. The specific objectives were to: (1) investigate the effect of the CM-infestation as a source of variability on the measured HSI spectra, (2) evaluate its impact on the performance of the models for predicting the quality characteristics of apples, and (3) to select some optimal wavebands to develop a multispectral imaging system for the non-destructive quality prediction of apples.

2. Materials and Methods

2.1. Sample Preparation

A total of 180 organic Gala apple samples, with a diameter ranging from 60 to 75 mm, with no sign of pest attack, diseases, or damage, were purchased from a local market in Lexington, KY, USA, in February 2021. The apple samples were divided into two groups: 60 samples as a control and 120 samples as the infested group. The samples of the infested group were artificially infested by placing the first instar larvae on each apple and isolating it in a plastic container with a removable lid. Then, a total of 180 samples were further divided randomly into three groups of 60 apples (20 control and 40 infested) to place in three different storage conditions of 0 °C, 4 °C, and 10 °C in a relative humidity of 85–90%. The physiological quality attributes of apples were measured on the first day and after being refrigerated for 4, 8, 12, 16, and 20 weeks. The hyperspectral data acquisition and measurement of quality characteristics of apples were carried out in the Food Engineering lab at the Biosystems and Agricultural Engineering Department, University of Kentucky, Lexington, KY, USA.

2.2. Hyperspectral Image Acquisition

The shortwave near-infrared (SWNIR) HSI system used in this study consisted of a NIR spectrograph with a wavelength range from 900 to 1700 nm and a spectral resolution of 3 nm (N17E, Specim, Oulu, Finland), a moving stage driven by a stepping motor (MRC-999-031, Middleton Spectral Vision, Middleton, WI, USA), a 150 W halogen lamp (A20800, Schott, Southbridge, MA, USA), an InGaAs camera (Goldeye infrared camera: G-032, Allied Vision, Stradtroda, Germany) mounted perpendicular to the sample stage, and a computer with data acquisition and analysis software (FastFrame™ Acquisition Software, version 1, Middleton Spectral Vision com, Middleton, WI, USA) (Figure 1). The parameters of the sample stage speed, the exposure time of the camera, the halogen lamp angle, and the vertical distance between the lens and the sample were adjusted to 10 mm/s, 40 milliseconds (ms), 45°, and 25 cm, respectively, to acquire clear images. The size of each acquired HSI was 266 × 320 × 256 (X, Y, 𝜆) which was saved as a “*.raw” file along with a header file as “*.hdr”.
After the image acquisition, calibrating the raw HSI with white and dark reference images was needed to compensate for the effect of illumination as well as the dark current of the detector. A whiteboard with a reflectance of 99% from a polytetrafluoroethylene (PTFE) Teflon plate was used to acquire the white reference image. Then, the lights were turned off and the camera lens was covered completely with a cap to acquire the dark reference image. Then, the HSI was corrected with the white and dark reference according to the following Equation (1):
R = R 0 R d R w R d
where R is the corrected image, R 0 is the raw HSI, R d is the dark image, and R w is the white reflectance image.

2.3. Physicochemical Parameters Measurements

After HSI image acquisition, destructive tests were carried out immediately with the apple firmness measurement first. This was carried out at three locations around the equatorial region of each apple, using a texture analyzer (TA. XT express, Stable Micro Systems Ltd., Surrey, UK), with a 6 mm flat probe, a puncture depth of 5 mm, and a puncture speed of 25 mm/min. From the force–displacement curve, the peak force was used as the firmness value in N. The average of the three measurements was calculated to represent the firmness of a sample. The soluble solids content (SSC), which is considered an index for evaluating the sweetness of apples, was determined in °Brix using a portable refractometer (PAL-BX/ACID5, ATAGO Co. Ltd., Tokyo, Japan). Apple pulp from each tested position was cut out to extract the juice to place on the refractometer sample glass for the measurement [23]. Additionally, the extracted juice was used to determine pH by means of a digital pH-meter (Sartorius PB-10, Göttingen, Germany) under room temperature at 25 ± 2 °C. Finally, to measure the moisture content (MC) of the apple slices, 20 g of each sample was weighed using a digital balance with an accuracy of 0.001 g and dried in an oven at 105 °C for 24 h [24,25]. Afterward, the wet basis MC was calculated by dividing the final weight by the initial weight.

2.4. Data Processing

After the acquisition and correction of the HSI, to acquire spectral data, three regions of interest (ROIs) as rectangles with 10 × 10 pixels were segmented near the equatorial area of each apple in the images. Then, the average spectral information of all the pixels within each three ROIs was extracted and represented as the spectral data of the sample in the form of reflectance intensity versus wavelength. After spectral data extraction, the pre-processing steps of wavelength trimming, maximum normalization, Savitzky–Golay smoothing (with the moving window width of 27 and the second-order polynomial), and standard normal variable (SNV) were performed to remove the noisy wavelengths at the edges of each spectrum, to scale data, and to compensate the particle size scattering and path length difference effects, respectively. Additionally, the Monte Carlo sampling approach was used to detect the outliers before building the regression models.
To analyze the variance in the spectra with respect to the storage time and infestation effects, functional analysis of variance (FANOVA) was used. This method adapts the traditional analysis of variance by representing each observation (spectrum) as a function. Many authors showed that the functional approach in chemometrics has some advantages in building predictive models and analyzing the sources of variance in spectroscopic data [24]. In this method, the spectrum of a sample is the result of the reflection and absorption peaks for different chemical components where the spectral information is represented by the overall mean and the main effects [26]. In this study, the storage time and CM infestation effects were considered the main effects. For each main effect, the group effect was significant if p ≤ 0.05.
This study applied partial least squares regression (PLSR) and support vector regression (SVR) to build the regression models using the mean spectrum of the ROI as the independent variables X and the measured quality values as the dependent variables Y. PLSR is particularly useful in spectral analysis for constructing a linear model when the amount of sample data used for modeling are small. The data used for modeling were divided into the training (80%) and prediction (20%) sets using the Kennard-Stone sample selection algorithm.
The performance of the training and prediction models was evaluated by the correlation coefficient of training (Rc) and its root mean square error (RMSEC), and the correlation coefficient of the prediction model (Rp) and its mean square error (RMSEP) [27]. All algorithms used in this study for pre-processing and data analysis were performed on Python 3.10 (Python Software Foundation, https://www.python.org- accessed on 10 March 2022) platform and in Jupyter Editor Notebook. Open-source libraries of Spectral, NumPy, Sklearn, Scikit-fda, and Matplotlib were used in this work.
Wavelength selection is an important part of spectral data analysis. Its function is to eliminate the redundant information contained in the spectrum, retain the data information related to the current task, and then, reduce the data dimension. In this paper, competitive adaptive reweighted sampling (CARS) was applied for selecting useful wavelengths [28].

3. Results and Discussion

3.1. Quality Change of Apples during Storage

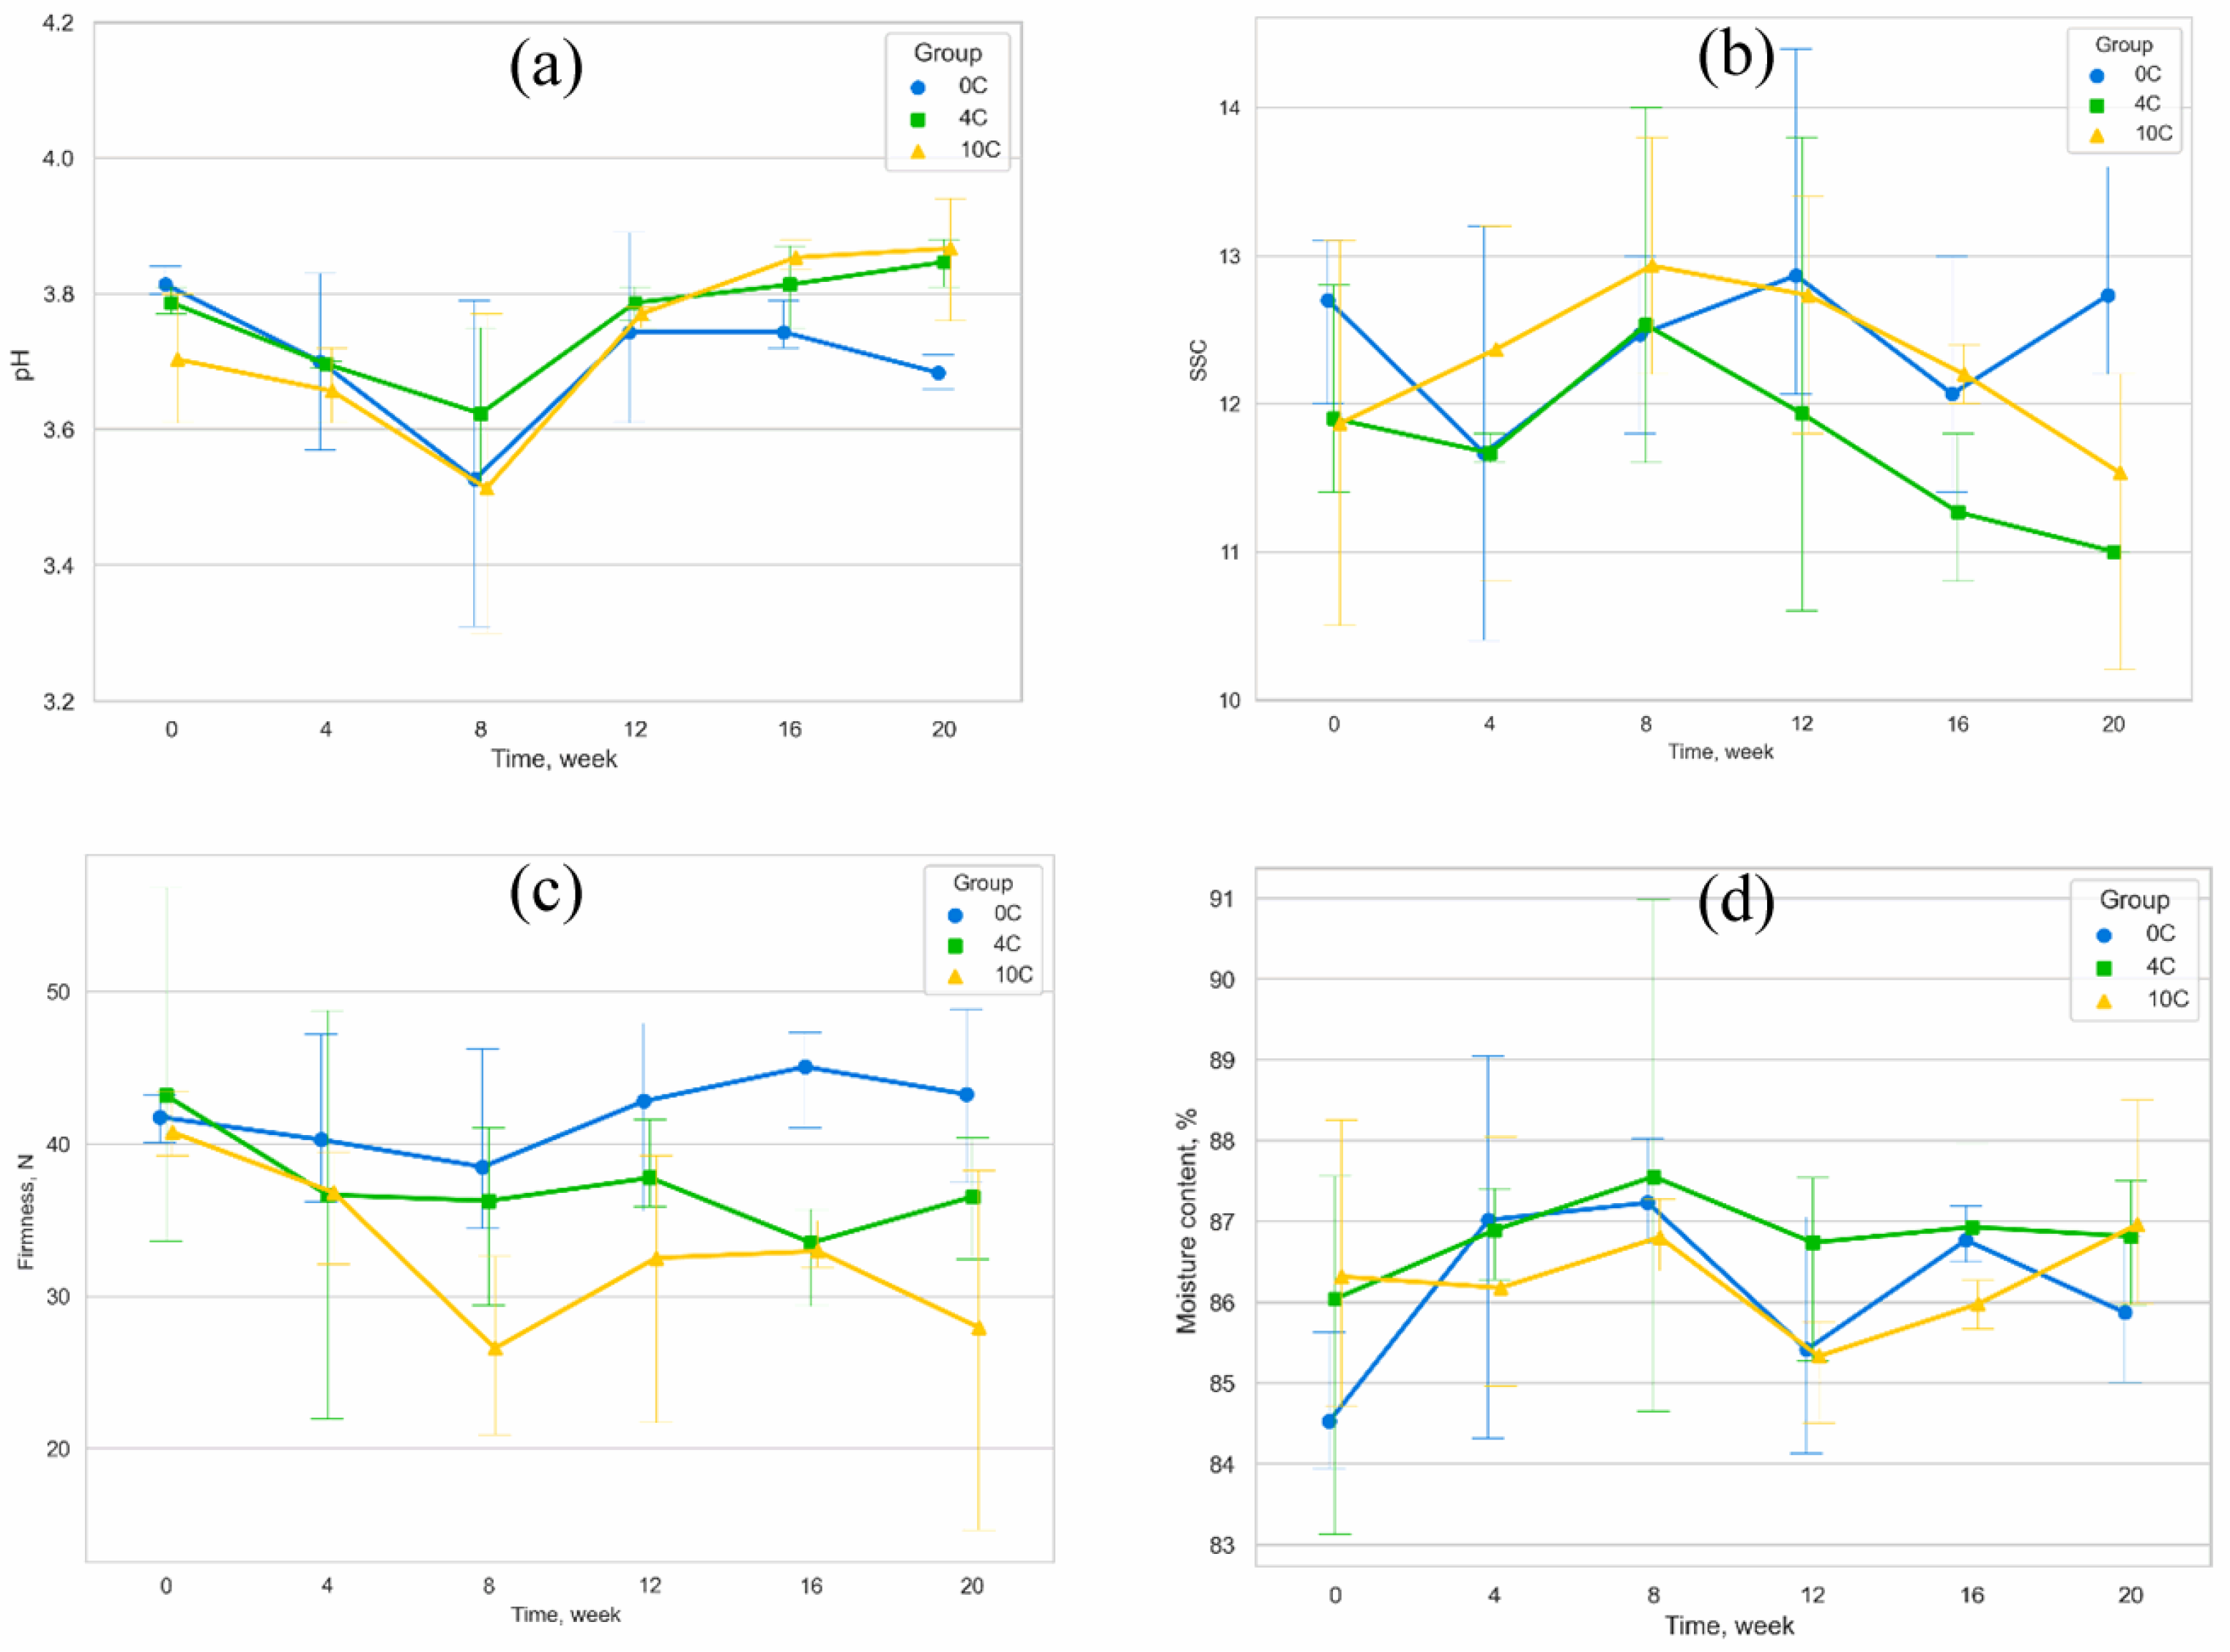
Changes in quality attributes of apples (control), namely SSC, pH, MC, and firmness, measured during cold storage at three different temperatures are presented in Figure 2. The results of FANOVA showed that there was a significant (p < 0.05) change in the pH and firmness of apples with storage time. However, SSC and MC did not show a significant change during storage. The pH values of apples tended to decrease at first, then increase during cold storage. It declined from 3.81 ± 0.02, 3.79 ± 0.02, and 3.70 ± 0.09 to 3.53 ± 0.24, 3.62 ± 0.11, and 3.51 ± 0.23 during the first two months for samples at 0 °C, 4 °C, and 10 °C, respectively (as shown in Figure 2a). The increase in pH towards the end of the storage is related to metabolism activities, especially respiration which consumes organic acid, as the main factor in the pH of the fruit [29]. There was no significant (p < 0.05) difference in pH values for apples stored at different temperatures and they showed a similar trend during storage. While other quality attributes of the apples did not differ significantly between the control and the infested apples, the results of FANOVA showed that there was a significant difference in the pH of control and infested apple fruits.
For SSC, no significant change was observed with time or temperature. This is because the apples used in this study were fully mature. The results are in agreement with the findings of [30], who showed that the value of SSC underwent the highest changes in low-maturity apples by nearly 13% in comparison to only 2% for fully mature apples. This was because of the lower initial starch content in low-maturity apples which converts into sugar as apple fruits mature, causing the change in the SSC value during storage [31]. Since the apples used in the current study were at a high maturity level, the change in the SSC value was minimum. Ghafir et al. [30] presented a result that showed no significant change in total soluble solid, SSC, and starch concentration in mature Gala apples during 180 days of storage at 0 °C. In Figure 2b, the values of SSC of apples at 4 °C and 10 °C tended to increase at first, peaking around two months of storage, before decreasing until the end. This changing trend agrees with the results of Zhang et al. [32], who reported an increase in the SSC of fully mature apples in the first two months of storage at 1 °C, followed by a decrease towards the end of the 6-month cold storage.
As shown in Figure 2c, the firmness of apples significantly (p < 0.05) decreased with storage time for samples stored at 4 °C and 10 °C, but the apples at 0 °C did not change significantly over time. This decrease in firmness during storage was related to water loss in cells, the cell walls becoming thinner, and the degradation of the cell wall materials and the pectin [33,34]. Additionally, the results showed that temperature had a significant effect on apple firmness with higher temperatures having less firmness values.
The FANOVA also showed that the effect of time and temperature on the MC of stored apples was not significant (p > 0.05), as can be seen in Figure 2d. This could be a result of keeping the relative humidity of the controlled environment chamber at a high level, around 90% to minimize water loss in apples during storage. Additionally, the findings suggest that maintaining a high relative humidity of around 90% in the controlled environment chamber may have contributed to the insignificant effects of time and temperature on apple MC. This information could be valuable for optimizing apple storage conditions to minimize moisture loss and extend shelf life.

3.2. Reflectance Spectra of Control and Infested Apples during Storage

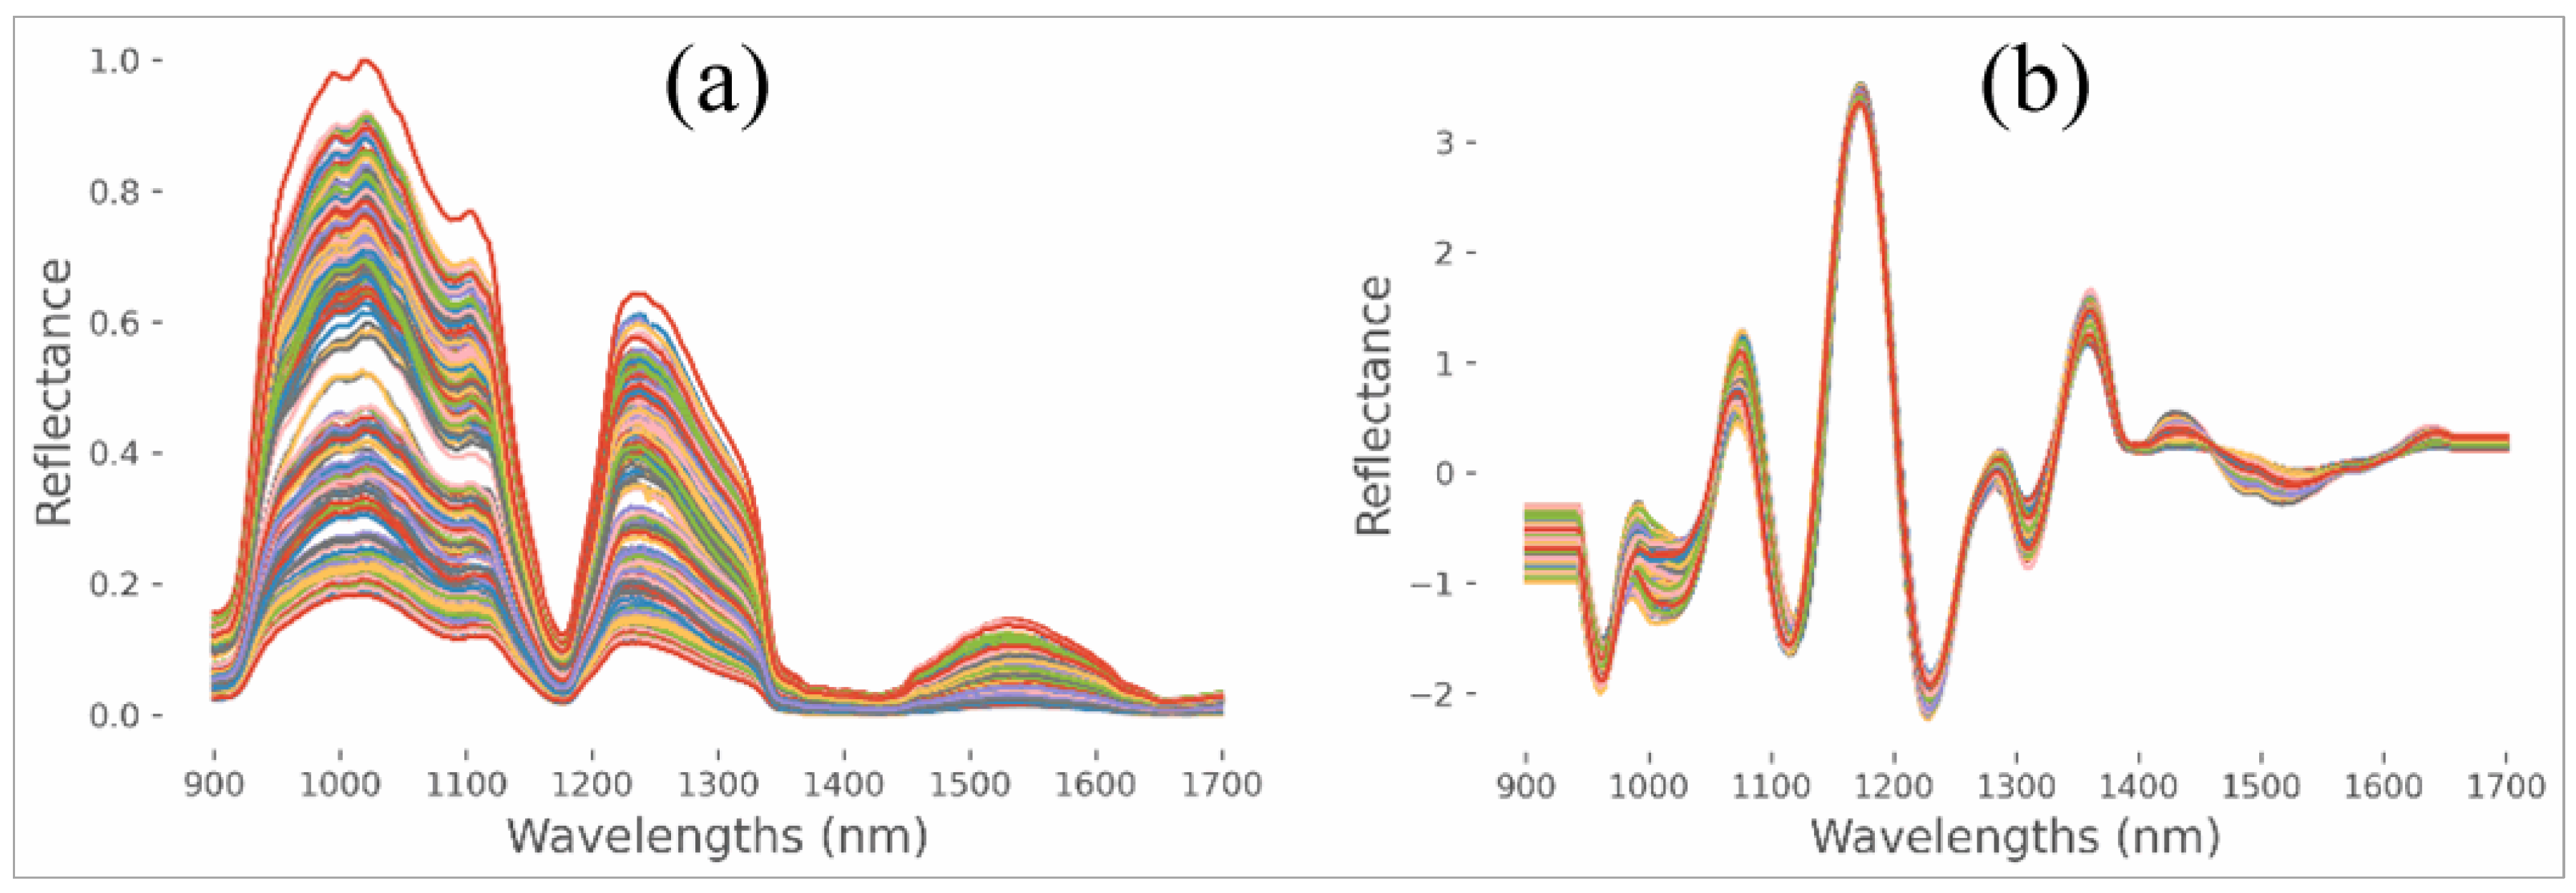
Figure 3a,b shows the measured reflectance spectra of all measured apples (control and infested), in the region between 900 and 1700 nm, and in the raw spectra form and after pre-processing using Savitzky–Golay smoothing and SNV. There were some distinct absorption valleys in the spectra around 950, 1200, and 1400 nm. The absorption at about 950 and 1200 nm relates to the first overtones of O-H band in water molecules [35]. The absorption around 1400 nm is attributed to the combination of the second overtone of C-H and the first overtone of O-H [36]. Similar spectra were also reported for apples by Peirs et al. [37], and Nicolaï et al. [38].

3.3. Predicting the Quality of Control and Infested Apples during Storage

To study the effect of biological variability on the spectra, one-way ANOVA was applied to analyze the effect of CM infestation on the spectra. The results showed that the CM’s infestation effect on the spectra was significant with a p ≤ 0.05. Figure 4 shows the mean spectra of the raw data for CM-infested and control apples. Overall, it can be seen from Figure 4 that the CM-infested apples had more absorption, especially at the peak points. The higher absorbance of the infested apples can be explained by a combination of chemical and textural changes due to the infestation [39]. Additionally, from Figure 4, while all spectra have similar shapes and trends, there was a significant difference between the mean spectra for the control and infested apples. This variability affects the performance of predictive models. It should be noted that although all spectra have a very similar shape, there is a large variability in absorbance at certain wavebands of each class.
Table 1, Table 2, Table 3 and Table 4 show the performance of the PLSR and SVR regression methods in predicting the SSC, pH, MC, and firmness of the apples during the storage time and across three temperatures. Spectra data with the full spectrum (900–1700 nm) were used to establish PLSR and SVR models for the quality parameters. To obtain an efficient and reliable model, the optimal number of latent variables (LVs) was first selected (in the range of 1 to 20) as the inputs of the training model by calculating the RMSECV using a 10-fold cross-validation.
In Table 1, the regression models for predicting pH were established separately for the control, infested, and combined samples. This was because the ANOVA results showed a significant difference (p < 0.05) between control and infested samples in terms of pH value. While the model for pH prediction in the control samples gave a high correlation coefficient of prediction up to 0.97, the accuracies for the infested and combined models were not satisfactory, possibly because of the large variations in the spectra as well as the differences in chemical characteristics and cell structure of infested apples versus healthy ones. It was shown that many sources of biological variabilities such as cultivar, harvest season, and origin, as well as maturity and shelf-life, greatly affect the fruit quality properties and the accuracy and robustness of the models for the prediction of these properties [40]. Thus, the poor predictive models for the combination of control and infested samples may be due to not accounting for these variabilities. This is mainly because of significantly different spectra coming from control and infested samples for which the predictions were poor. When these sources of variability were excluded from the data by separating control and infested samples, there was considerable improvement in the results for the control compared to the combined data (from Rp = 0.54, RMSEP = 0.33 to Rp = 0.97, RMSEP = 0.25). Thus, for the purpose of predicting the quality attributes of apples, only the control samples will be considered to have propensity for accurate and robust models. In addition, PLSR gave higher accuracies than SVR in predicting apples’ pH values. These results are comparable to the results of Guo et al. [41], who established a PLS model based on shortwave infrared HSI (1000–2500 nm) for the pH of the Fuji apple, with the best Rp of 0.847 and RMSEP of 0.0398. Another important point is that interest in pH and other quality attributes measurement will always be for healthy apples and not infested.
The training and prediction performances of PLSR and SVR models for determining pH, firmness, SSC, and MC of control apples stored at 0 °C, 4 °C, and 10 °C for stored for 20 weeks (data collected at 4 weeks intervals) are shown in Table 2, Table 3 and Table 4, respectively. As shown in Table 2, the best results for pH were achieved using PLSR; however, the SVR model had the highest Rp and the lowest RMSEP for firmness, SSC, and MC prediction. For firmness, SVR gave 0.96, 0.95, 1.21, and 1.45 for Rc, Rp, RMSEC, and RMSEP, respectively. In addition, Table 2 shows that the Rc and Rp of all models for the samples stored at 0 °C exceeded 0.84, indicating the efficiency of PLSR and SVR models to predict the internal quality attributes of apples in long-term cold storage.
Table 3 presents the prediction performance of regression models for quality attributes of control samples stored at 4 °C. The PLSR model showed good prediction performance with high Rc and Rp values and low RMSEC and RMSEP values for most quality attributes. However, SVR showed mixed results with lower Rc and Rp values and higher RMSEC and RMSEP values for some attributes. Overall, PLSR demonstrated promising prediction performance, while SVR exhibited varying accuracy, indicating that PLSR may be a more reliable method for predicting quality attributes in control samples stored at 4 °C.
Table 4 shows that the predictive models for the samples stored at 10 °C for a 20-week period had a high performance for all the attributes except SSC. In a similar work, Dong & Guo [42] used NIR hyperspectral reflectance imaging in the range of 900–1700 nm to predict SSC, firmness, MC, and pH values of Fuji apples by PLS regression, least squares support vector machine (LSSVM), and back-propagation network modeling during a 13-week storage period. They reported that while all their models failed to predict firmness, the LSSVM model gave better accuracy in predicting SSC, MC, and pH with Rp of 0.961, 0.984, and 0.882, respectively.
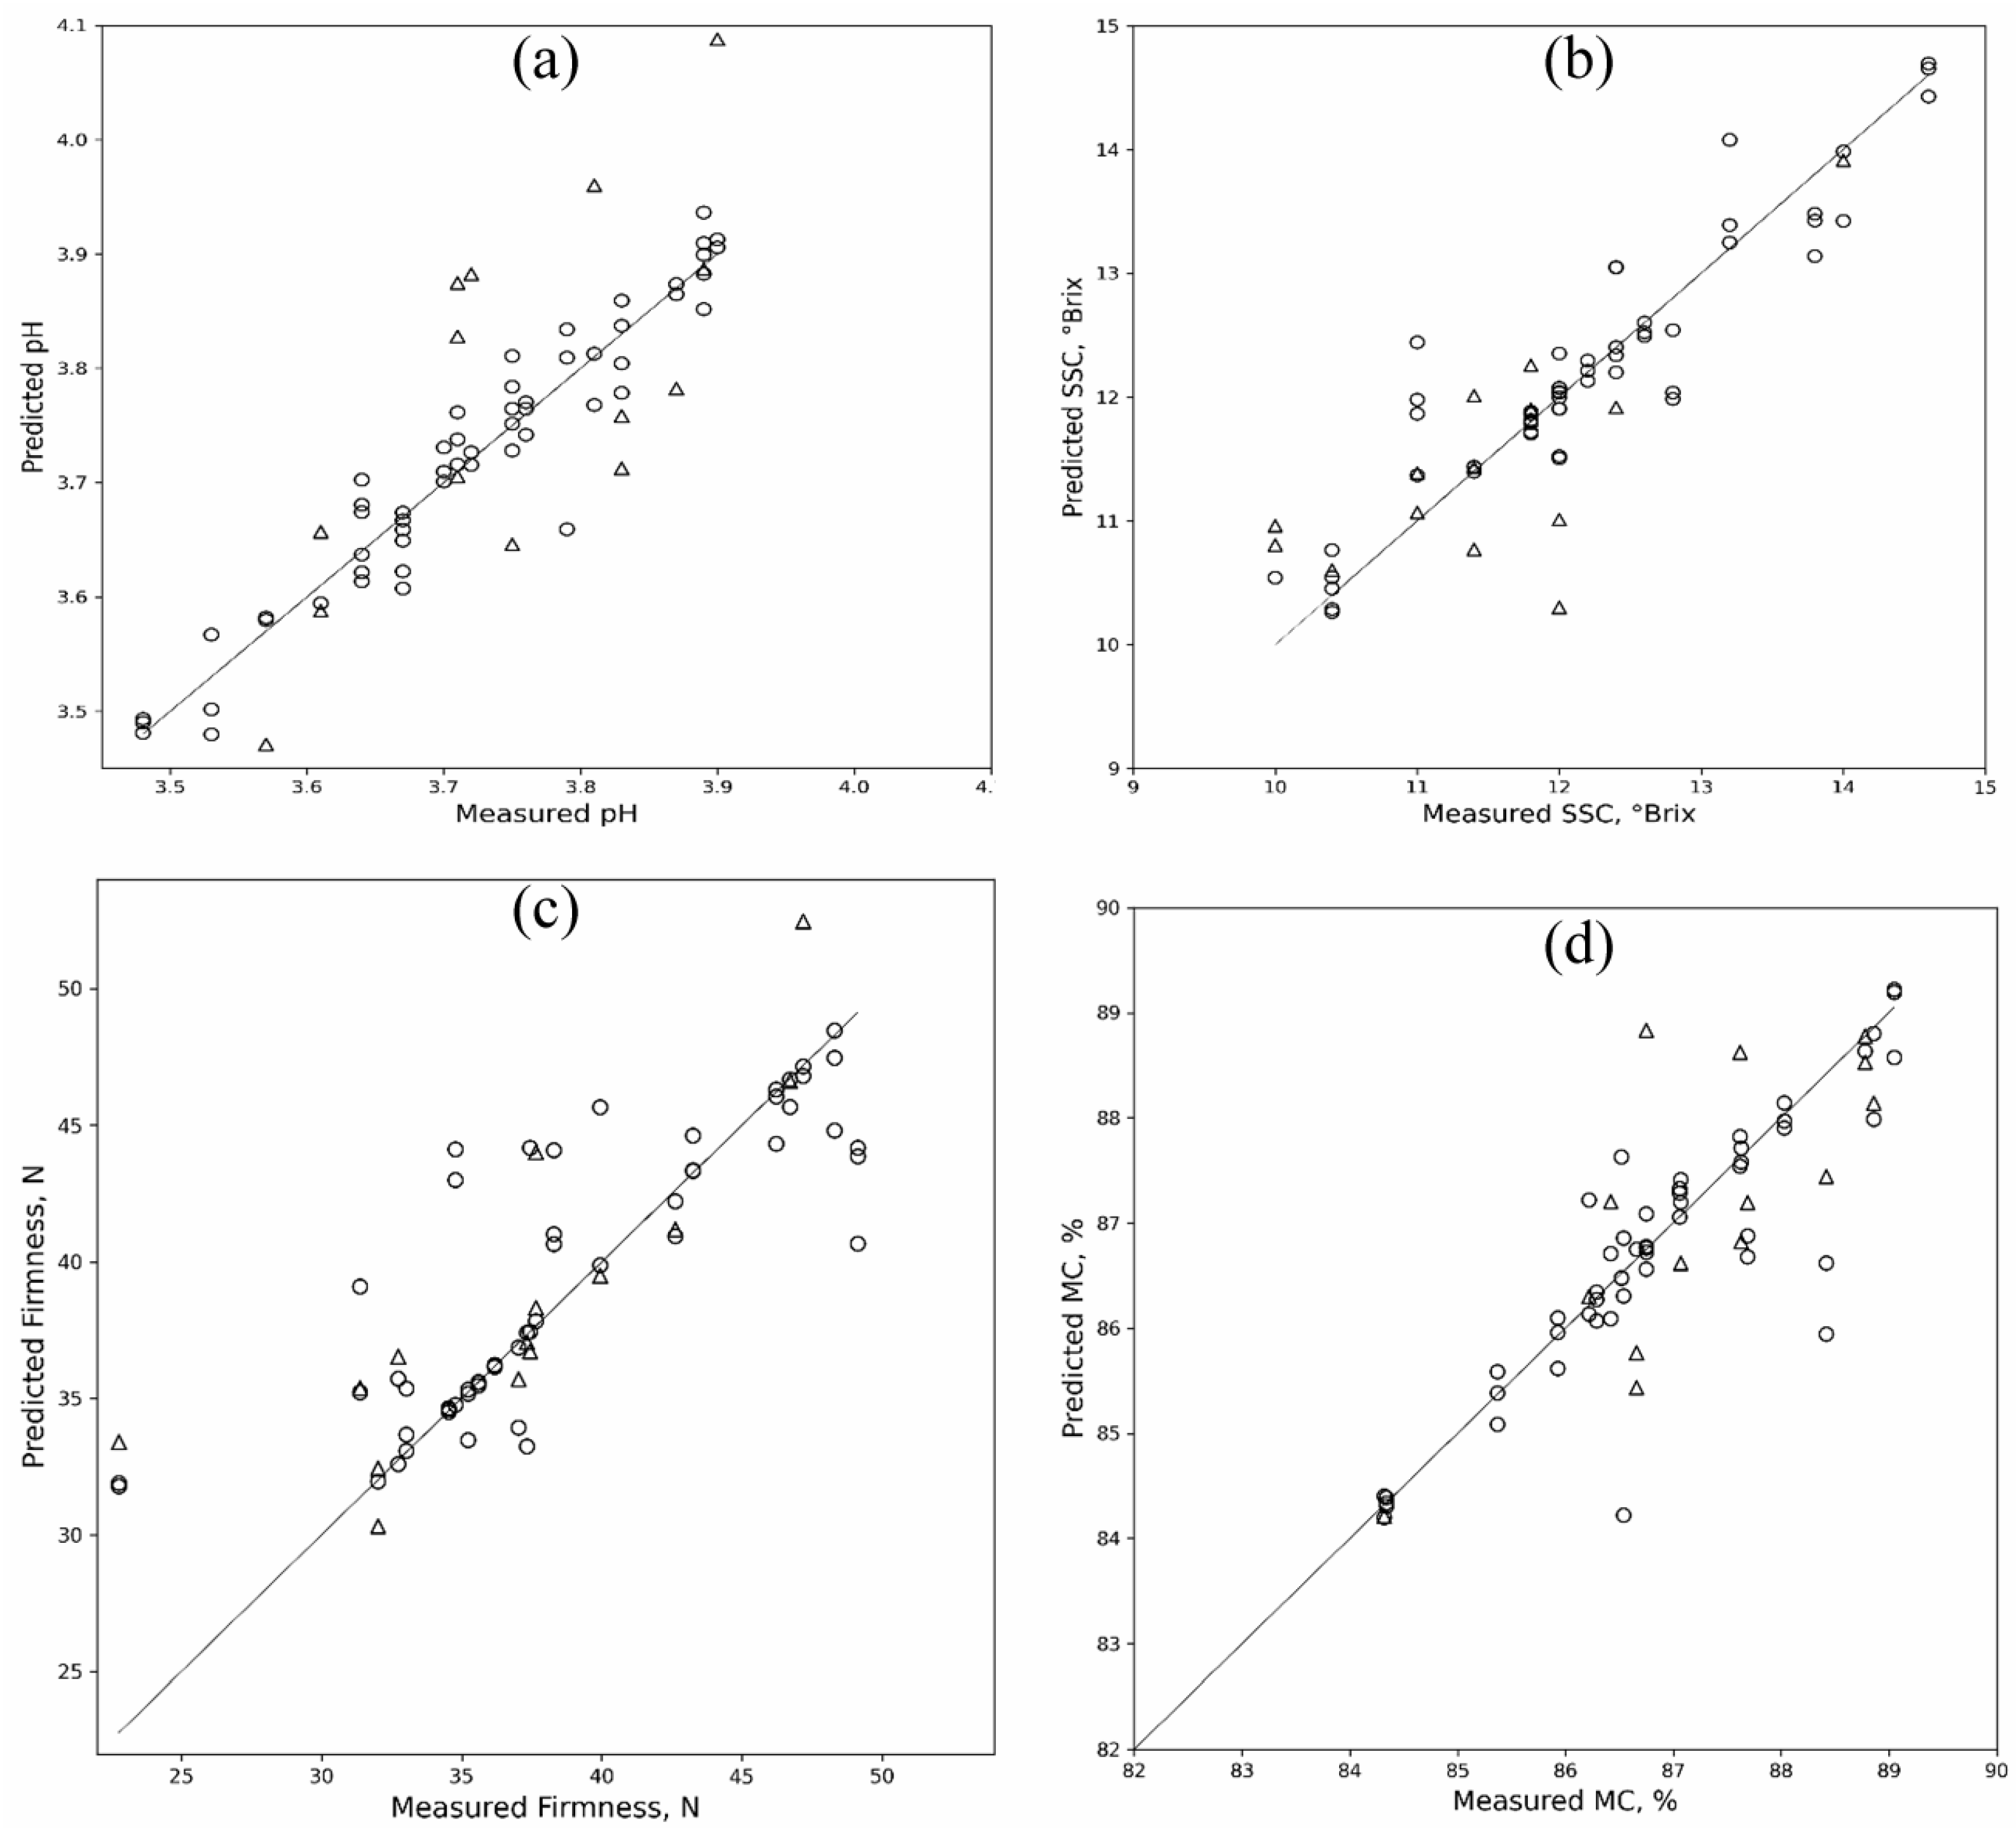
In Figure 5, the values of pH, SSC, firmness, and MC of the predicted data sets by the PLSR model are plotted against the actual values. The figure shows that all the qualities presented a good fit of data between measured and predicted with less variation as clearly seen in Figure 5a. These results indicate that these apple quality parameters can be accurately predicted from NIR reflectance HSI using PLSR. Table 5 represents the selected wavelengths and their analysis for pH, SSC, firmness, and MC. The selected wavelength numbers for pH, SSC, firmness, and MC were 14, 19, 7, and 12, respectively. For example, the PLSR prediction model for firmness uses seven wavelengths 957, 1164, 1184, 1248, 1321, 1324, and 1477 nm, which only account for 0.02% of the full spectrum, achieving a relatively optimal prediction effect with Rp of 0.95. The selection of specific wavelengths in spectral modeling can be advantageous for several reasons. First, using selected wavelengths can reduce the complexity of the model, as fewer variables are involved, which can lead to simpler and more interpretable models. Second, selected wavelengths may correspond to specific molecular or chemical information related to the analyte of interest, which can improve the specificity and sensitivity of the model in predicting the target property. Third, using selected wavelengths can help to mitigate the impact of noise or interference from irrelevant spectral regions, thereby enhancing the robustness and accuracy of the model. Additionally, using selected wavelengths can also reduce the computational burden and processing time, as fewer data points need to be analyzed. Therefore, it is concluded that PLSR is the best model for firmness prediction in this context.

4. Conclusions

This study investigated the quality of healthy and infested “Gala” organic apples under three different storage conditions, as well as the non-destructive prediction of these quality attributes using SWNIR HSI coupled with machine learning. FANOVA was used to analyze the effect of biological variability on the measured spectra. This showed that storage time and CM infestation significantly impacted the spectra, resulting in variability in the predictive models. However, when the data of infested and control samples were separated, the best results for the prediction of quality attributes of apples were achieved for the control samples stored at 0 °C, with Rp values of 0.92 for SSC, 0.95 for firmness, 0.97 for pH, and 0.91 for MC. Furthermore, CARS algorithm was employed to select optimal wavelengths for developing multispectral models with satisfactory performance. This study showed that SWNIR HSI method can be used for post-harvest apple quality prediction under varied conditions with a degree of high accuracy, with potential applications in inline/online apple sorting.

Author Contributions

Conceptualization, A.A.A.; methodology, N.E. and A.Y.K.; writing—original draft preparation, A.Y.K. and N.E.; writing—review and editing, A.A.A., K.D.D. and R.T.V.; supervision, A.A.A. All authors have read and agreed to the published version of the manuscript.

Funding

This research was funded by [USDA-NIFA] grant number [2019-67021-29692]. The APC was also funded by [USDA-NIFA].

Institutional Review Board Statement

Not applicable.

Informed Consent Statement

Not applicable.

Data Availability Statement

Will be provided on request following the funding agency’s policy on data sharing.

Acknowledgments

This work was funded and supported by the National Institute of Food and Agriculture (NIFA) under U.S. Department of Agriculture (USDA); and partly by the Kentucky Agricultural Experiment Station (KAES).

Conflicts of Interest

The authors declare no conflict of interest.

References

  1. Salehi, F.; Aghajanzadeh, S. Effect of dried fruits and vegetables powder on cakes quality: A review. Trends Food Sci. Technol. 2020, 95, 162–172. [Google Scholar] [CrossRef]
  2. Liu, G.; Nie, R.; Liu, Y.; Mehmood, A. Combined antimicrobial effect of bacteriocins with other hurdles of physicochemic and microbiome to prolong shelf life of food: A review. Sci. Total Environ. 2022, 825, 154058. [Google Scholar] [CrossRef] [PubMed]
  3. Onwude, D.I.; Chen, G.; Eke-Emezie, N.; Kabutey, A.; Khaled, A.Y.; Sturm, B. Recent advances in reducing food losses in the supply chain of fresh agricultural produce. Processes 2020, 8, 1431. [Google Scholar] [CrossRef]
  4. Ekramirad, N.; Khaled, A.Y.; Parrish, C.A.; Donohue, K.D.; Villanueva, R.T.; Adedeji, A.A. Development of pattern recognition and classification models for the detection of vibro-acoustic emissions from codling moth infested apples. Postharvest Biol. Technol. 2021, 181, 111633. [Google Scholar] [CrossRef]
  5. Li, M.; Ekramirad, N.; Rady, A.; Adedeji, A. Application of acoustic emission and machine learning to detect codling moth infested apples. Trans. ASABE 2018, 61, 1157–1164. [Google Scholar] [CrossRef]
  6. Rady, A.; Ekramirad, N.; Adedeji, A.; Li, M.; Alimardani, R. Hyperspectral imaging for detection of codling moth infestation in GoldRush apples. Postharvest Biol. Technol. 2017, 129, 37–44. [Google Scholar] [CrossRef]
  7. Ekramirad, N.; Khaled, A.Y.; Donohue, K.D.; Villanueva, R.T.; Adedeji, A.A. Classification of Codling Moth-Infested Apples Using Sensor Data Fusion of Acoustic and Hyperspectral Features Coupled with Machine Learning. Agriculture 2023, 13, 839. [Google Scholar] [CrossRef]
  8. Adedeji, A.A.; Ekramirad, N.; Khaled, A.Y.; Parrish, C. Acoustic Emission and Near-Infra Red Imaging Methods for Nondestructive Apple Quality Detection and Classification. In Nondestructive Quality Assessment Techniques for Fresh Fruits and Vegetables; Springer Nature Singapore: Singapore, 2022; pp. 301–329. [Google Scholar]
  9. Khaled, A.Y.; Ekramirad, N.; Parrish, C.A.; Eberhart, P.S.; Doyle, L.E.; Donohue, K.D.; Adedeji, A.A. Non-destructive detection of codling moth infestation in apples using acoustic impulse response signals. Biosyst. Eng. 2022, 224, 68–79. [Google Scholar] [CrossRef]
  10. Breth, D.I. Controlling Oriental Fruit Moth in Peaches Using Mating Disruption and Assessing the Problem in Apples. 2002. Available online: https://ecommons.cornell.edu/bitstream/handle/1813/45908/2002breth-NYSIPM.pdf?sequence=1&isAllowed=y (accessed on 16 April 2023).
  11. Hong, Y.A.; Gallardo, R.K.; Fan, X.; Atallah, S.; Gómez, M.I. Phytosanitary Regulation of Washington Apple Producers under an Apple Maggot Quarantine Program. J. Agric. Resour. Econ. 2019, 44, 646–663. [Google Scholar]
  12. Rozsypal, J.; Koštál, V.; Zahradníčková, H.; Šimek, P. Overwintering strategy and mechanisms of cold tolerance in the codling moth (Cydia pomonella). PLoS ONE 2013, 8, e61745. [Google Scholar] [CrossRef]
  13. Mditshwa, A.; Fawole, O.A.; Opara, U.L. Recent developments on dynamic controlled atmosphere storage of apples—A review. Food Packag. Shelf Life 2018, 16, 59–68. [Google Scholar] [CrossRef]
  14. Fathizadeh, Z.; Aboonajmi, M.; Hassan-Beygi, S.R. Nondestructive methods for determining the firmness of apple fruit flesh. Inf. Process. Agric. 2021, 8, 515–527. [Google Scholar] [CrossRef]
  15. Nturambirwe, J.F.I.; Opara, U.L. Machine learning applications to non-destructive defect detection in horticultural products. Biosyst. Eng. 2020, 189, 60–83. [Google Scholar] [CrossRef]
  16. Cárdenas-Pérez, S.; Chanona-Pérez, J.; Méndez-Méndez, J.V.; Calderón-Domínguez, G.; López-Santiago, R.; Perea-Flores, M.J.; Arzate-Vázquez, I. Evaluation of the ripening stages of apple (Golden Delicious) by means of computer vision system. Biosyst. Eng. 2017, 159, 46–58. [Google Scholar] [CrossRef]
  17. Ma, T.; Xia, Y.; Inagaki, T.; Tsuchikawa, S. Rapid and nondestructive evaluation of soluble solids content (SSC) and firmness in apple using Vis–NIR spatially resolved spectroscopy. Postharvest Biol. Technol. 2021, 173, 111417. [Google Scholar] [CrossRef]
  18. Du Plessis, A.; Broeckhoven, C.; Guelpa, A.; Le Roux, S.G. Laboratory x-ray micro-computed tomography: A user guideline for biological samples. Gigascience 2017, 6, gix027. [Google Scholar] [CrossRef] [PubMed]
  19. Shi, J.; Zhang, F.; Wu, S.; Guo, Z.; Huang, X.; Hu, X.; Zou, X. Noise-free microbial colony counting method based on hyperspectral features of agar plates. Food Chem. 2019, 274, 925–932. [Google Scholar] [CrossRef]
  20. Lu, R. Nondestructive measurement of firmness and soluble solids content for apple fruit using hyperspectral scattering images. Sens. Instrum. Food Qual. Saf. 2007, 1, 19–27. [Google Scholar] [CrossRef]
  21. Ma, T.; Li, X.; Inagaki, T.; Yang, H.; Tsuchikawa, S. Noncontact evaluation of soluble solids content in apples by near-infrared hyperspectral imaging. J. Food Eng. 2018, 224, 53–61. [Google Scholar] [CrossRef]
  22. Peirs, A.; Tirry, J.; Verlinden, B.; Darius, P.; Nicolaï, B.M. Effect of biological variability on the robustness of NIR models for soluble solids content of apples. Postharvest Biol. Technol. 2003, 28, 269–280. [Google Scholar] [CrossRef]
  23. Tian, X.; Li, J.; Wang, Q.; Fan, S.; Huang, W.; Zhao, C. A multi-region combined model for non-destructive prediction of soluble solids content in apple, based on brightness grade segmentation of hyperspectral imaging. Biosyst. Eng. 2019, 183, 110–120. [Google Scholar] [CrossRef]
  24. Azevedo, V.M.; Dias, M.V.; de Siqueira Elias, H.H.; Fukushima, K.L.; Silva, E.K.; Carneiro, J.D.D.S.; Borges, S.V. Effect of whey protein isolate films incorporated with montmorillonite and citric acid on the preservation of fresh-cut apples. Food Res. Int. 2018, 107, 306–313. [Google Scholar] [CrossRef]
  25. Vesali, F.; Gharibkhani, M.; Komarizadeh, M.H. An approach to estimate moisture content of apple with image processing method. Aust. J. Crop Sci. 2011, 5, 111–115. [Google Scholar]
  26. Saeys, W.; De Ketelaere, B.; Darius, P. Potential applications of functional data analysis in chemometrics. J. Chemom. A J. Chemom. Soc. 2008, 22, 335–344. [Google Scholar] [CrossRef]
  27. Zhang, H.; Song, T.Q.; Wang, K.L.; Wang, G.X.; Hu, H.; Zeng, F.P. Prediction of crude protein content in rice grain with canopy spectral reflectance. Plant Soil Environ. 2012, 58, 514–520. [Google Scholar] [CrossRef]
  28. Cui, J.; Yang, M.; Son, D.; Cho, S.I.; Kim, G. Hyperspectral imaging for tomato bruising damage assessment of simulated harvesting process impact using wavelength interval selection and multivariate analysis. Appl. Eng. Agric. 2020, 36, 533–547. [Google Scholar] [CrossRef]
  29. Jan, I.; Rab, A.; Sajid, M.; Ali, A.; Shah, S. Response of apple cultivars to different storage durations. Sarhad J. Agric 2012, 28, 219–225. [Google Scholar]
  30. Ghafir, S.A.; Gadalla, S.O.; Murajei, B.N.; El-Nady, M.F. Physiological and anatomical comparison between four different apple cultivars under cold-storage conditions. Afr. J. Plant Sci. 2009, 3, 133–138. [Google Scholar]
  31. Blažek, J.; Hlušičková, I.; Varga, A. Changes in quality characteristics of Golden Delicious apples under different storage conditions and correlations between them. Hortic. Sci. 2003, 30, 81–89. [Google Scholar] [CrossRef]
  32. Zhang, B.; Zhang, M.; Shen, M.; Li, H.; Zhang, Z.; Zhang, H.; Xing, L. Quality monitoring method for apples of different maturity under long-term cold storage. Infrared Phys. Technol. 2021, 112, 103580. [Google Scholar] [CrossRef]
  33. Johnston, J.W.; Hewett, E.W.; Hertog, M.L. Postharvest softening of apple (Malus domestica) fruit: A review. New Zealand J. Crop. Hortic. Sci. 2002, 30, 145–160. [Google Scholar] [CrossRef]
  34. Szymańska-Chargot, M.; Chylińska, M.; Pieczywek, P.M.; Rösch, P.; Schmitt, M.; Popp, J.; Zdunek, A. Raman imaging of changes in the polysaccharides distribution in the cell wall during apple fruit development and senescence. Planta 2016, 243, 935–945. [Google Scholar] [CrossRef] [PubMed]
  35. Kuckenberg, J.; Tartachnyk, I.; Noga, G. Evaluation of fluorescence and remission techniques for monitoring changes in peel chlorophyll and internal fruit characteristics in sunlit and shaded sides of apple fruit during shelf-life. Postharvest Biol. Technol. 2008, 48, 231–241. [Google Scholar] [CrossRef]
  36. Cortés, V.; Blasco, J.; Aleixos, N.; Cubero, S.; Talens, P. Monitoring strategies for quality control of agricultural products using visible and near-infrared spectroscopy: A review. Trends Food Sci. Technol. 2019, 85, 138–148. [Google Scholar] [CrossRef]
  37. Peirs, A.; Schenk, A.; Nicolaï, B.M. Effect of natural variability among apples on the accuracy of VIS-NIR calibration models for optimal harvest date predictions. Postharvest Biol. Technol. 2005, 35, 1–13. [Google Scholar] [CrossRef]
  38. Nicolai, B.M.; Theron, K.I.; Lammertyn, J. Kernel PLS regression on wavelet transformed NIR spectra for prediction of sugar content of apple. Chemom. Intell. Lab. Syst. 2007, 85, 243–252. [Google Scholar] [CrossRef]
  39. Susič, N.; Žibrat, U.; Sinkovič, L.; Vončina, A.; Razinger, J.; Knapič, M.; Gerič Stare, B. From genome to field—Observation of the multimodal nematicidal and plant growth-promoting effects of Bacillus firmus I-1582 on tomatoes using hyperspectral remote sensing. Plants 2020, 9, 592. [Google Scholar] [CrossRef]
  40. Bobelyn, E.; Serban, A.-S.; Nicu, M.; Lammertyn, J.; Nicolai, B.M.; Saeys, W. Postharvest quality of apple predicted by NIR-spectroscopy: Study of the effect of biological variability on spectra and model performance. Postharvest Biol. Technol. 2010, 55, 133–143. [Google Scholar] [CrossRef]
  41. Guo, Z.-M.; Huang, W.-Q.; Peng, Y.-K.; Wang, X.; Li, J. Impact of region of interest selection for hyperspectral imaging and modeling of sugar content in apple. Mod. Food Sci. Technol. 2014, 30, 59–63. [Google Scholar]
  42. Dong, J.; Guo, W. Nondestructive determination of apple internal qualities using near-infrared hyperspectral reflectance imaging. Food Anal. Methods 2015, 8, 2635–2646. [Google Scholar] [CrossRef]
Figure 1. Schematic diagram of the hyperspectral imaging system [7].
Agriculture 13 01086 g001
Figure 2. Changes in pH during cold storage (a), SSC (b), firmness (c), and moisture content (d) of control apples at different temperatures.
Agriculture 13 01086 g002
Figure 3. Spectral curves obtained by the mean spectra for the control and infested samples over the storage period (a), and Savitzky—Golay combined with SNV pre-treatment (b).
Agriculture 13 01086 g003
Figure 4. The mean spectra of the raw data for CM-infested and control apples.
Agriculture 13 01086 g004
Figure 5. The measured vs. predicted values for pH (a), SSC (b), Firmness (c), and MC (d) for apples at 0 °C for calibration and prediction sets.
Agriculture 13 01086 g005
Table 1. The prediction performance of regression models for pH during the storage and across three temperatures.
Samples ConditionRegression ModelRcRMSECRpRMSEP
Control PLSR0.940.170.970.25
SVR0.930.190.930.30
Infested PLSR0.970.130.710.24
SVR0.650.240.440.24
CombinationPLSR0.850.240.540.33
SVR0.890.220.490.34
Rc: correlation coefficient of calibration, Rp: correlation coefficient of prediction, RMSEC: root mean square error of calibration, RMSEP: root mean square error of prediction, PLSR: partial least square regression, SVR: support vector regression.
Table 2. Prediction performance of regression models for the control samples at 0 °C stored for 20 weeks.
Quality
Parameter
Samples
Condition
Regression ModelRcRMSECRpRMSEP
pHControl, stored at 0 °CPLSR0.940.170.970.25
SVR0.930.190.930.30
FirmnessControl, stored at 0 °CPLSR0.951.260.931.62
SVR0.961.210.951.45
SSCControl, stored at 0 °CPLSR0.950.530.900.81
SVR0.950.560.920.89
MCControl, stored at 0 °CPLSR0.850.810.880.88
SVR0.840.820.910.82
SSC: soluble solids content, MC: moisture content, Rc: correlation coefficient of calibration, Rp: correlation coefficient of prediction, RMSEC: root mean square error of calibration, RMSEP: root mean square error of prediction, PLSR: partial least square regression, SVR: support vector regression.
Table 3. Prediction performance of regression models for the control samples at 4 °C stored for 20 weeks.
Quality
Parameter
Samples
Condition
Regression ModelRcRMSECRpRMSEP
pHControl, stored at 4 °CPLSR0.920.290.890.51
SVR0.950.250.760.90
FirmnessControl, stored at 4 °CPLSR0.951.370.743.19
SVR0.672.200.542.54
SSCControl, stored at 4 °CPLSR0.880.680.580.91
SVR0.990.360.770.80
MCControl, stored at 4 °CPLSR0.980.390.661.08
SVR0.960.580.950.87
SSC: soluble solids content, MC: moisture content, Rc: correlation coefficient of calibration, Rp: correlation coefficient of prediction, RMSEC: root mean square error of calibration, RMSEP: root mean square error of prediction, PLSR: partial least square regression, SVR: support vector regression.
Table 4. Performance of regression models for the control samples at 10 °C stored for 20 weeks.
Quality
Parameter
Samples
Condition
Regression ModelRcRMSECRpRMSEP
pHControl, stored at 10 °CPLSR0.970.180.940.40
SVR0.970.200.960.35
FirmnessControl, stored at 10 °CPLSR0.980.980.950.97
SVR0.990.100.981.77
SSCControl, stored at 10 °CPLSR0.920.650.731.03
SVR0.710.920.561.19
MCControl, stored at 10 °CPLSR0.970.530.941.31
SVR0.990.100.801.16
SSC: soluble solids content, MC: moisture content, Rc: correlation coefficient of calibration, Rp: correlation coefficient of prediction, RMSEC: root mean square error of calibration, RMSEP: root mean square error of prediction, PLSR: partial least square regression, SVR: support vector regression.
Table 5. Prediction performance of regression models for apples stored in 0 °C.
Quality
Parameter
Selected Wavelengths (nm)Regression ModelRcRMSECRpRMSEP
pH950, 1161, 1221, 1224, 1271, 1274, 1334, 1378, 1381, 1471, 1474, 1477, 1481, 1584PLSR0.900.200.920.26
SVR0.980.120.920.29
SSC1081, 1117, 1157, 1161, 1164, 1167, 1238, 1241, 1244, 1248, 1251, 1254, 1258, 1301, 1354, 1358, 1368, 1477, 1481PLSR0.970.480.910.84
SVR0.940.570.920.85
Firmness957, 1164, 1184, 1248, 1321, 1324, 1477PLSR0.801.770.951.66
SVR0.871.680.941.84
MC953, 957, 1020, 1054, 1071, 1074, 1184, 1188, 1241, 1291, 1344, 1348PLSR0.830.830.890.80
SVR0.830.840.900.85
Test split and with selected wavelength, SSC: soluble solids content, MC: moisture content, Rc: correlation coefficient of calibration, Rp: correlation coefficient of prediction, RMSEC: root mean square error of calibration, RMSEP: root mean square error of prediction, PLSR: partial least square regression, SVR: support vector regression.
Disclaimer/Publisher’s Note: The statements, opinions and data contained in all publications are solely those of the individual author(s) and contributor(s) and not of MDPI and/or the editor(s). MDPI and/or the editor(s) disclaim responsibility for any injury to people or property resulting from any ideas, methods, instructions or products referred to in the content.