
PDD-Net: Plant Disease Diagnoses Using Multilevel and Multiscale Convolutional Neural Network Features


Abstract
1. Introduction
- A novel CNN-based framework, PDD-Net, is proposed; it incorporates data augmentation techniques and transfer learning to efficiently handle limited data samples and enhance the model-training process.
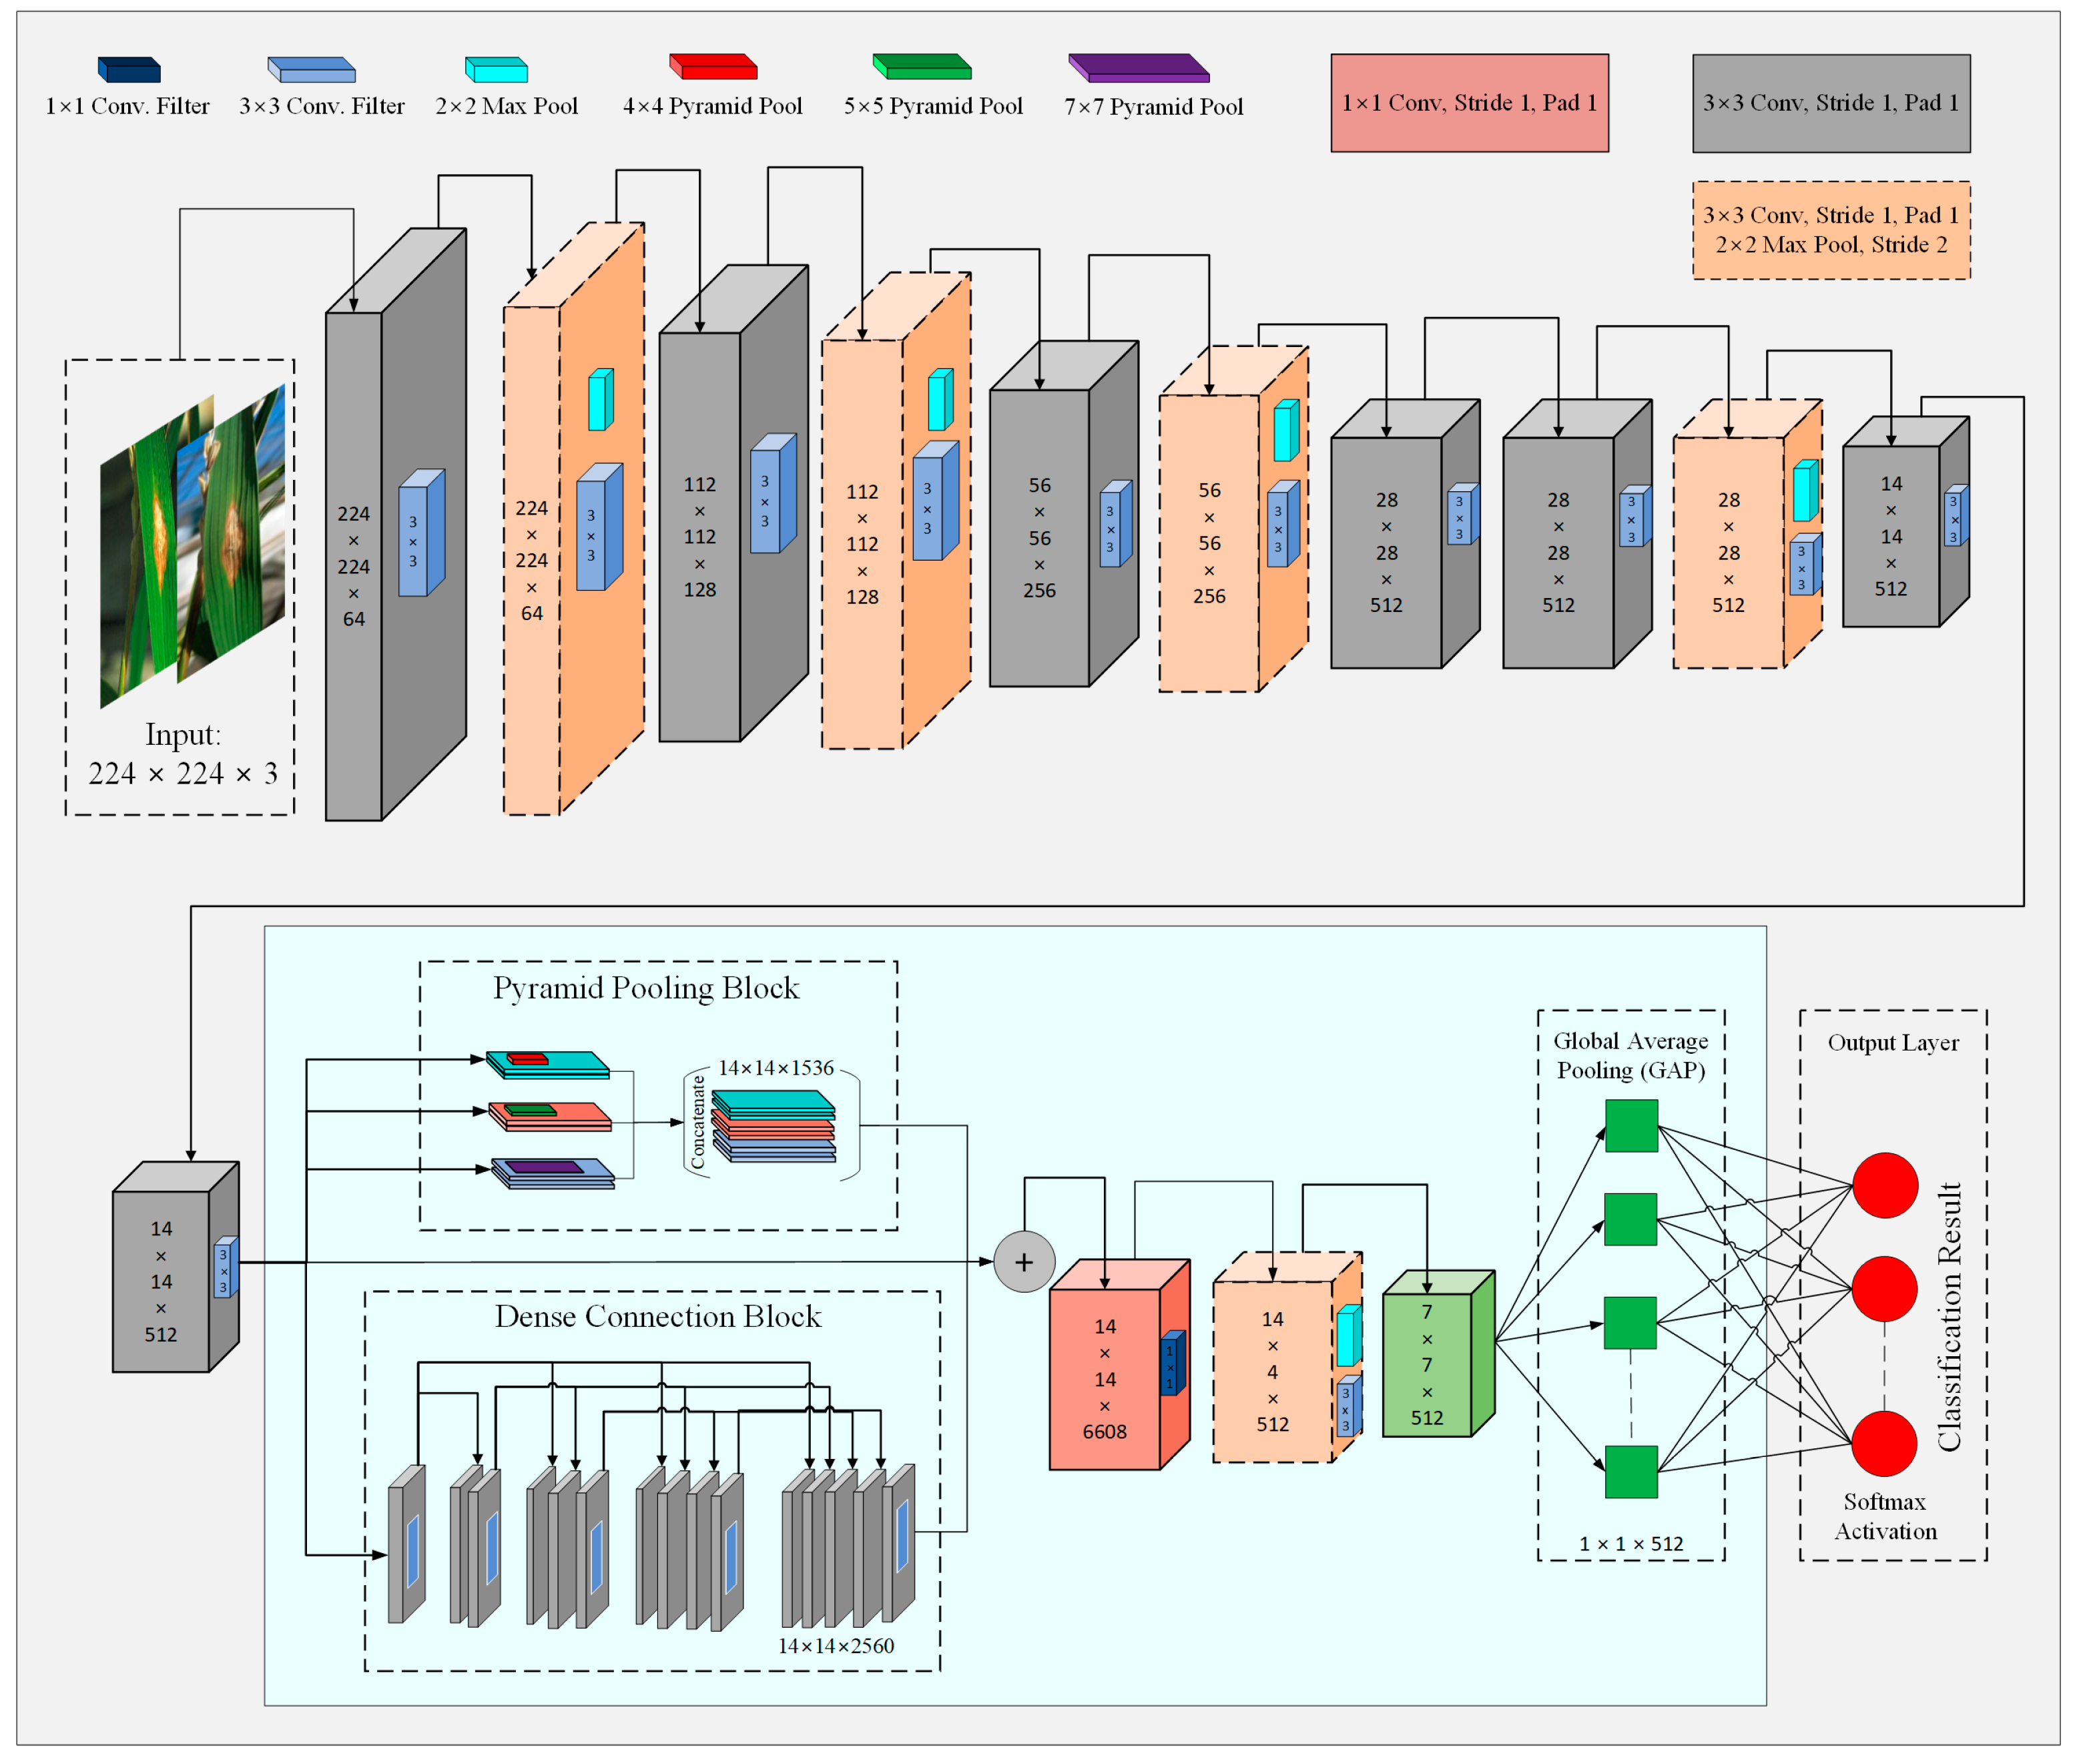
- The PDD-Net architecture was designed to include multilevel and multiscale features, a stable FTS activation function, and a Global Average Pooling (GAP) layer, which together improve the classification accuracy and prevent overfitting in the model.
- To ensure model generalization and stability, fivefold cross-validation was employed as an essential part of the model evaluation process.
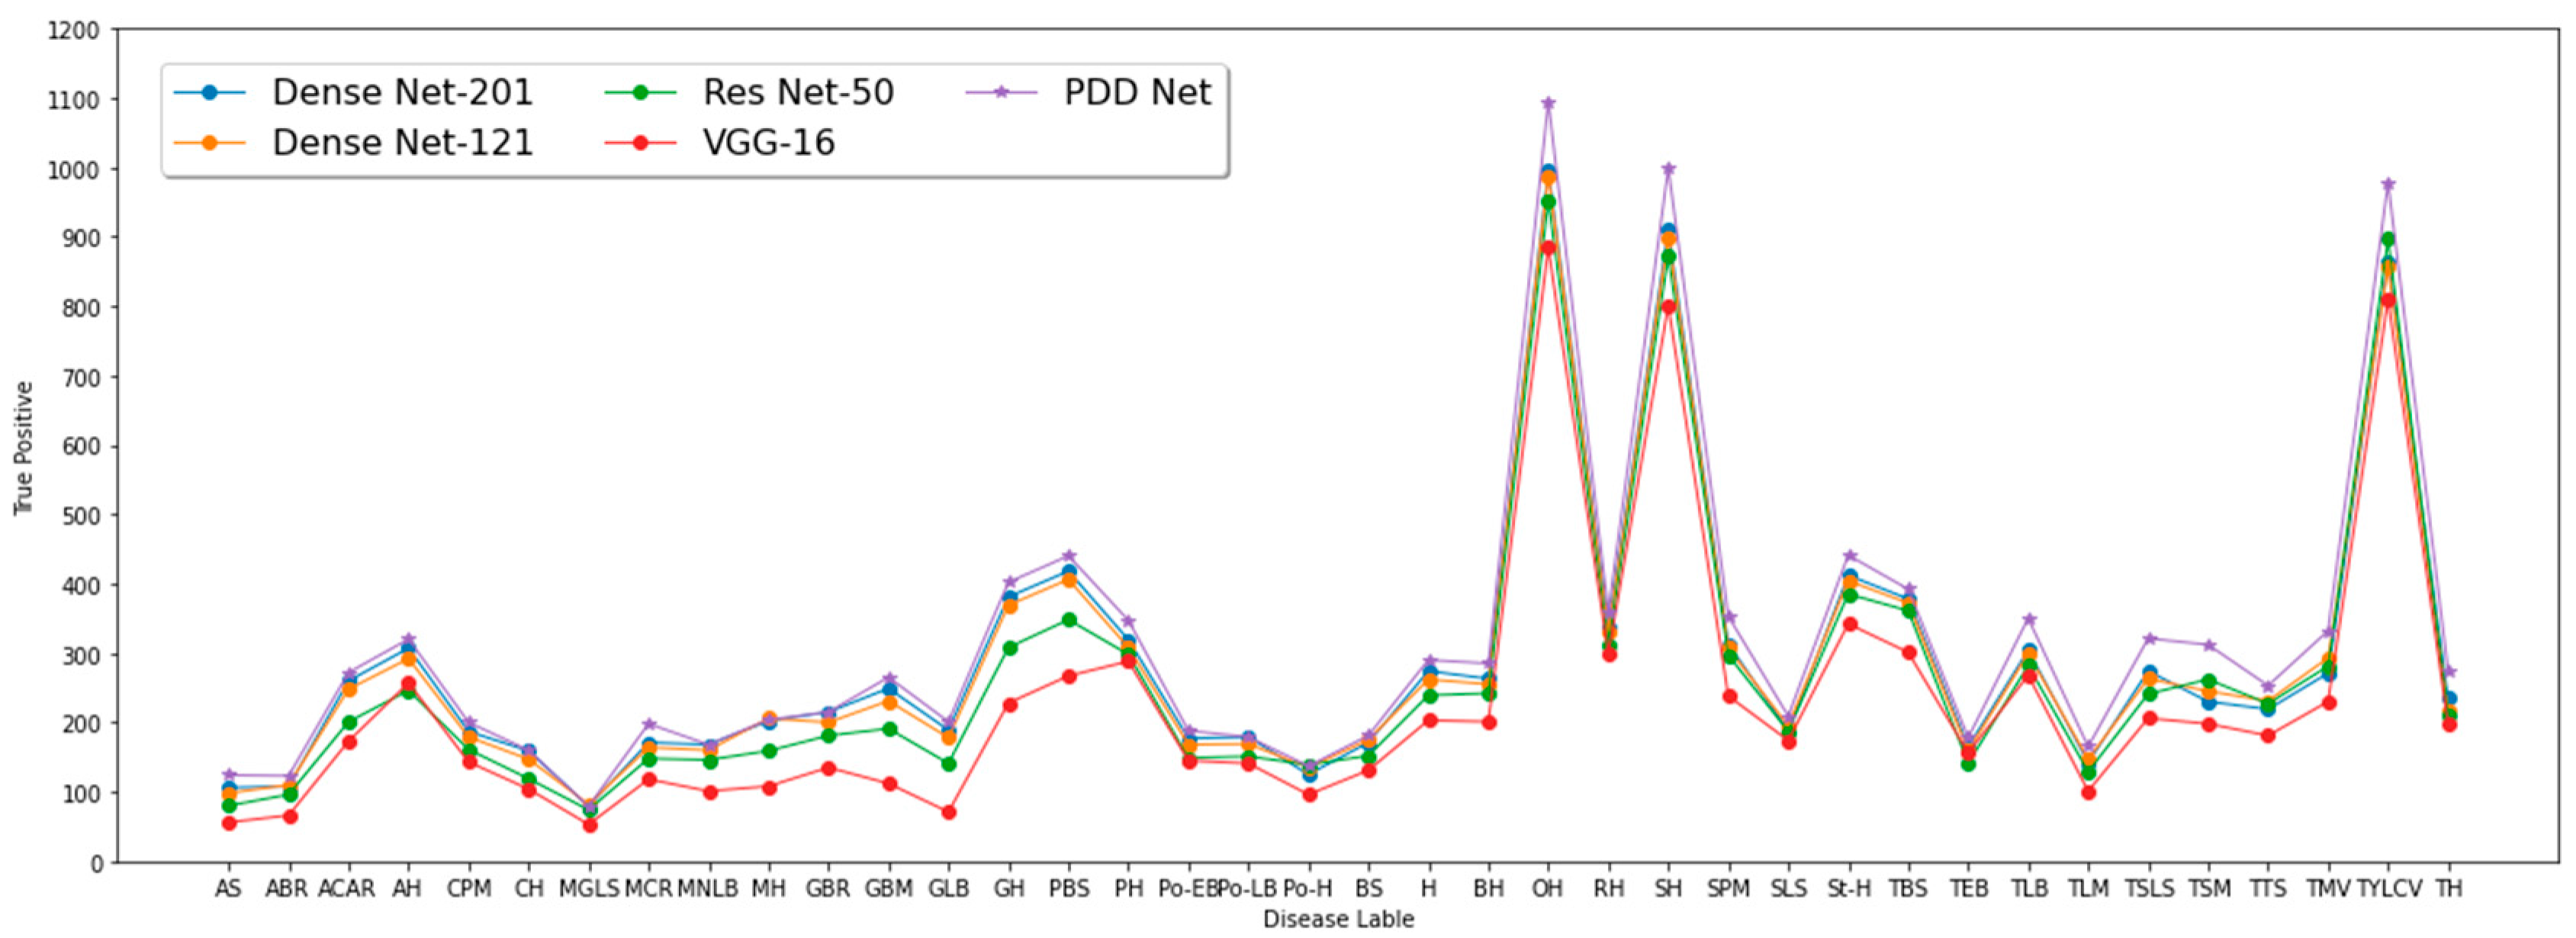
- The reported performance results such as precision, recall, F1 score, and accuracy demonstrated the superior performance of PDD-Net compared to baseline methods, including DenseNet-201, DenseNet-121, ResNet-50, and VGG-16.
2. Literature Review
3. Materials and Methods
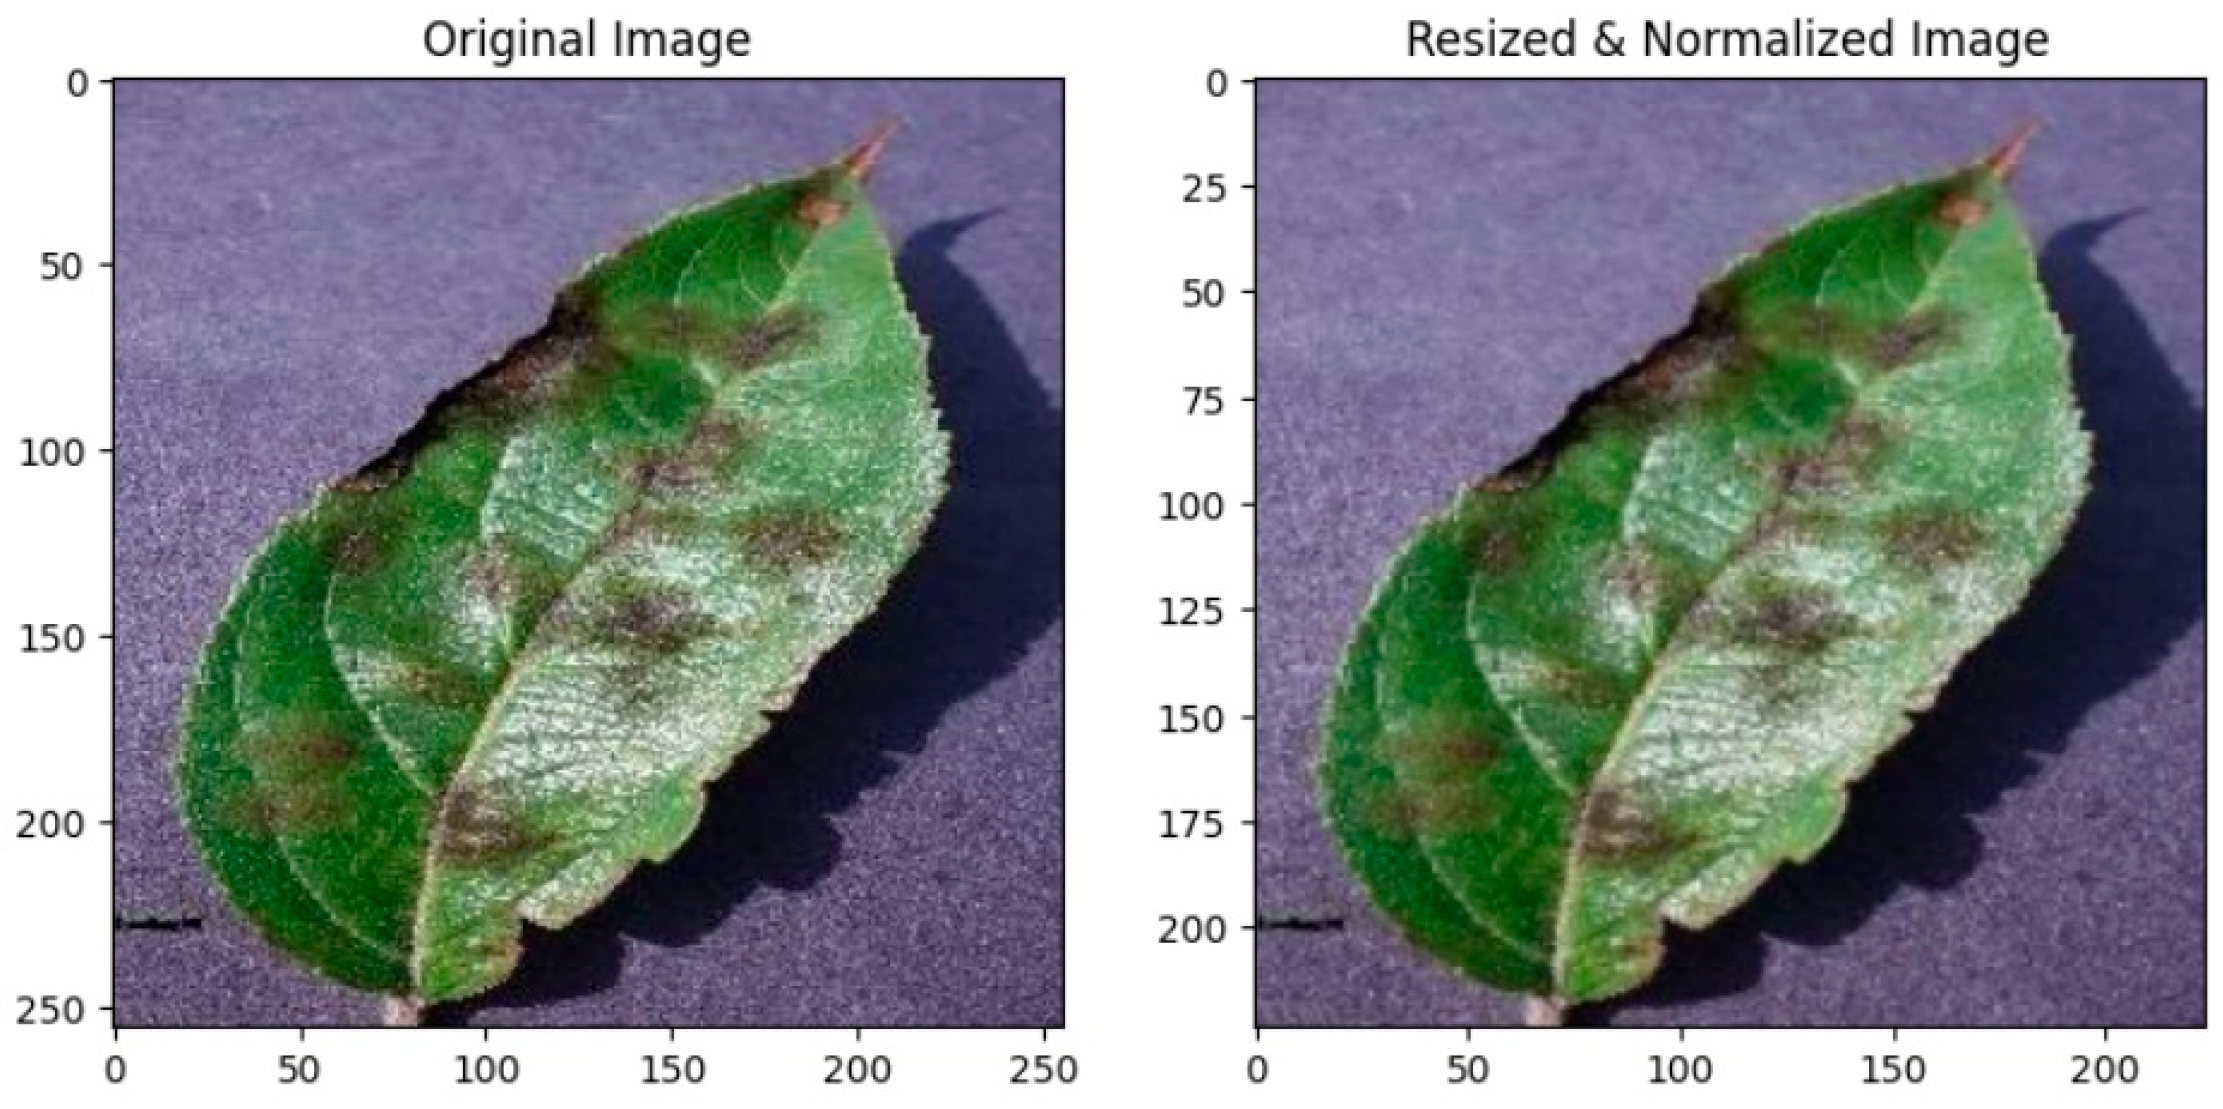
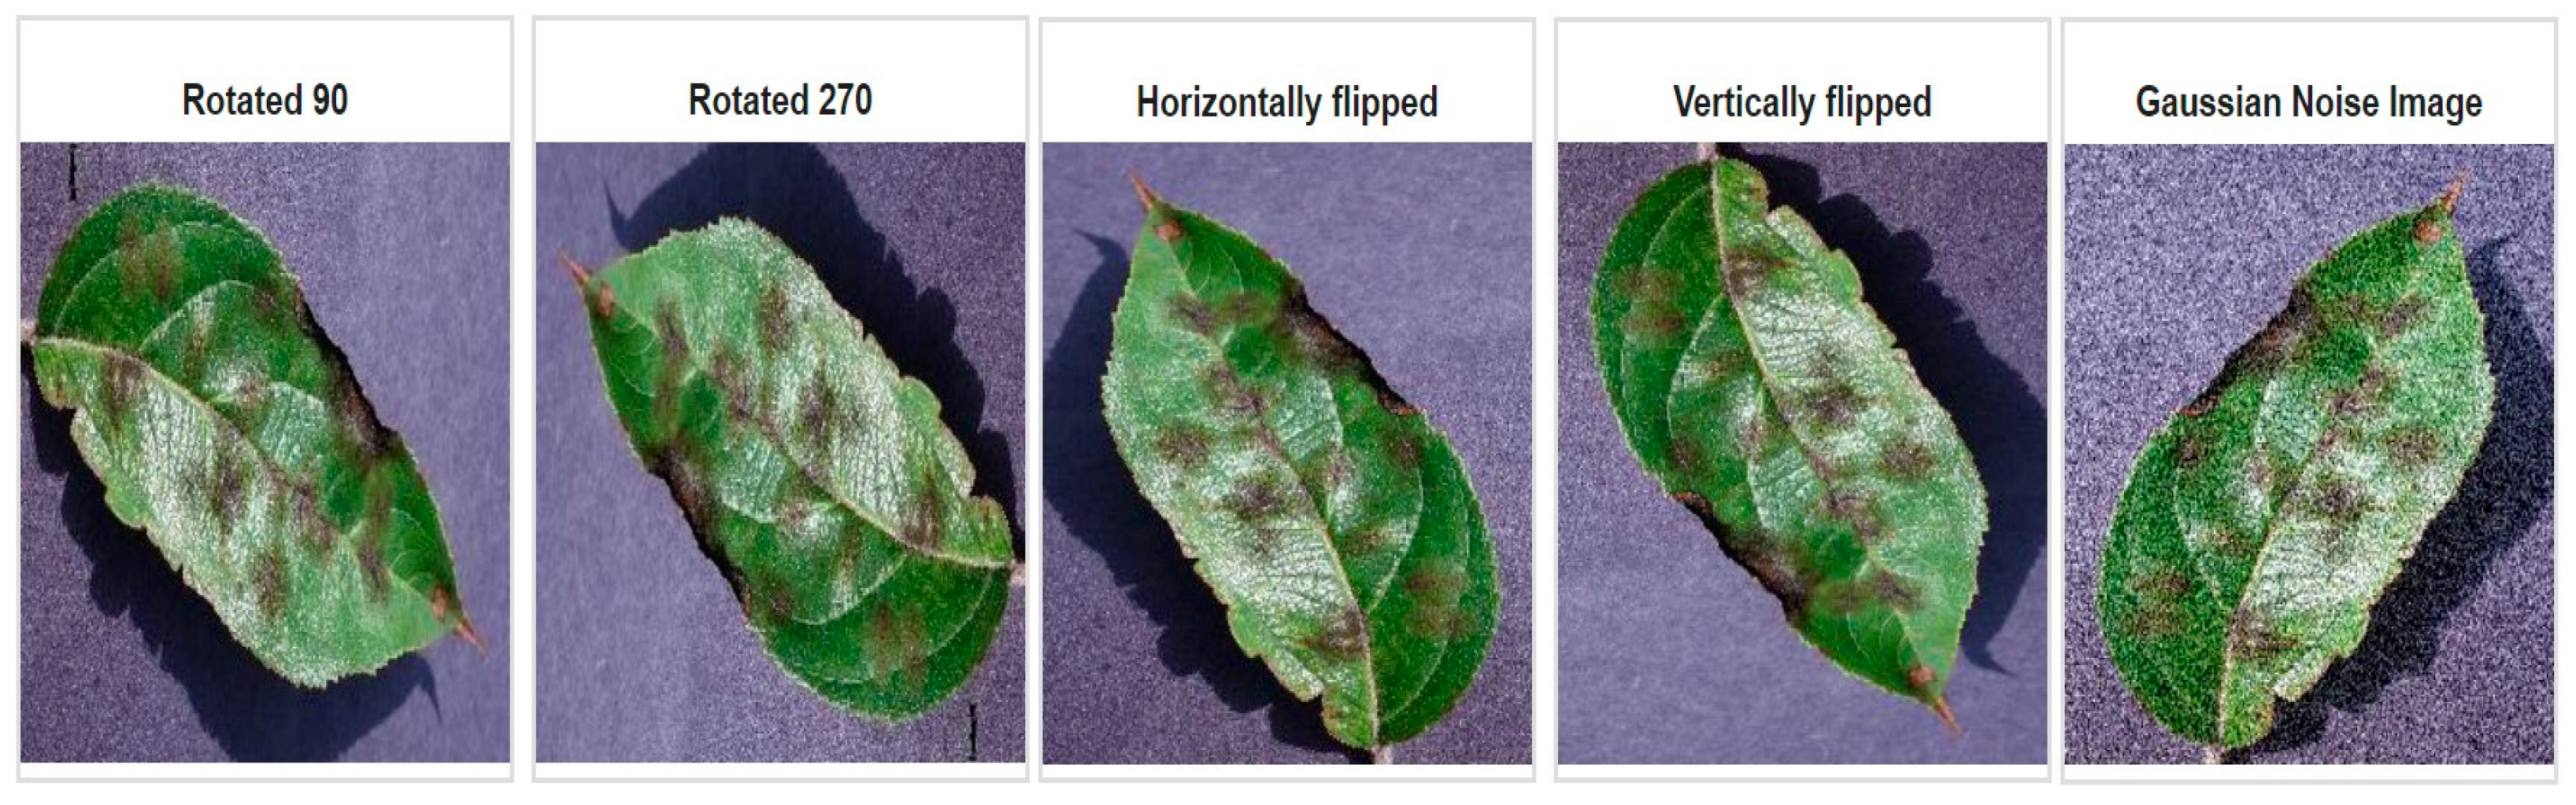
3.1. Image Preprocessing and Augmentation
3.2. Transfer Learning
3.3. Benchmark Acquisition
3.4. Plant Disease Diagnosis Framework
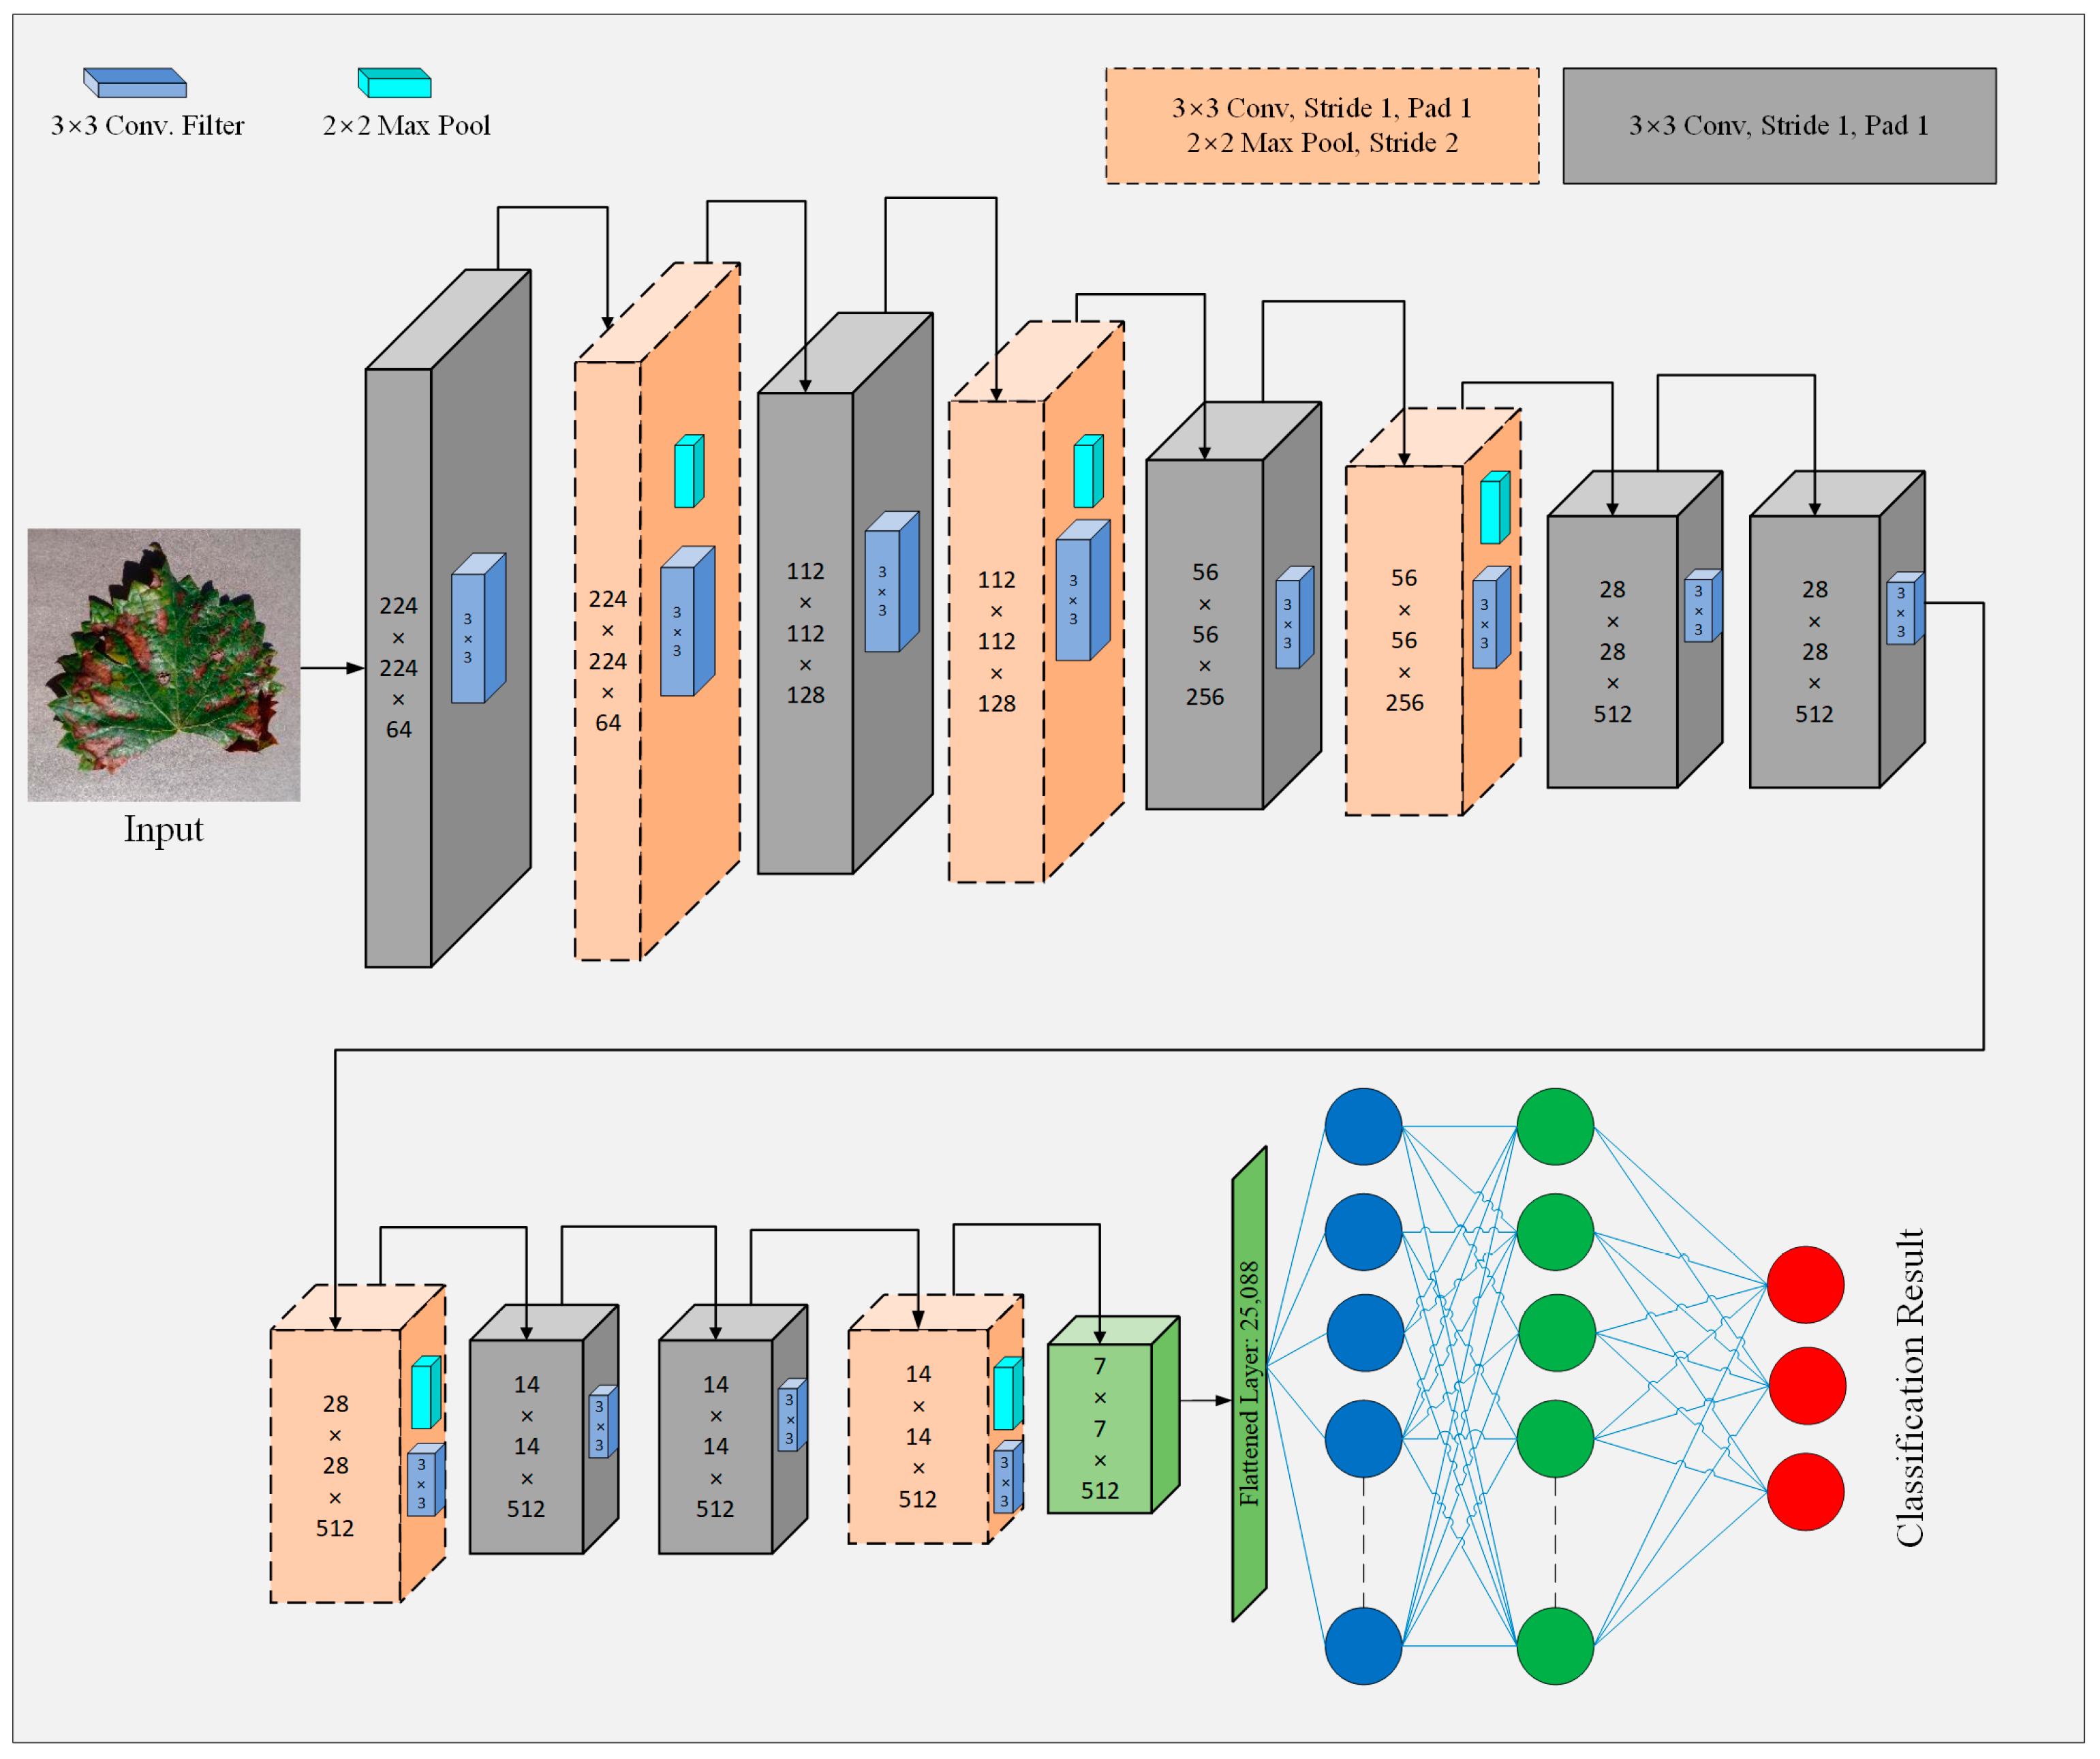
3.4.1. The Principle of Baseline Model
3.4.2. Model Improvements
- Multilevel features extraction
- 2.
- Multiscale features extraction
- 3.
- Activation function
- 4.
- Global Average Pooling (GAP)
3.4.3. Model Fine Tuning and Loss Function
3.4.4. Model Performance Metrics
3.5. Model Training and Testing
4. Results
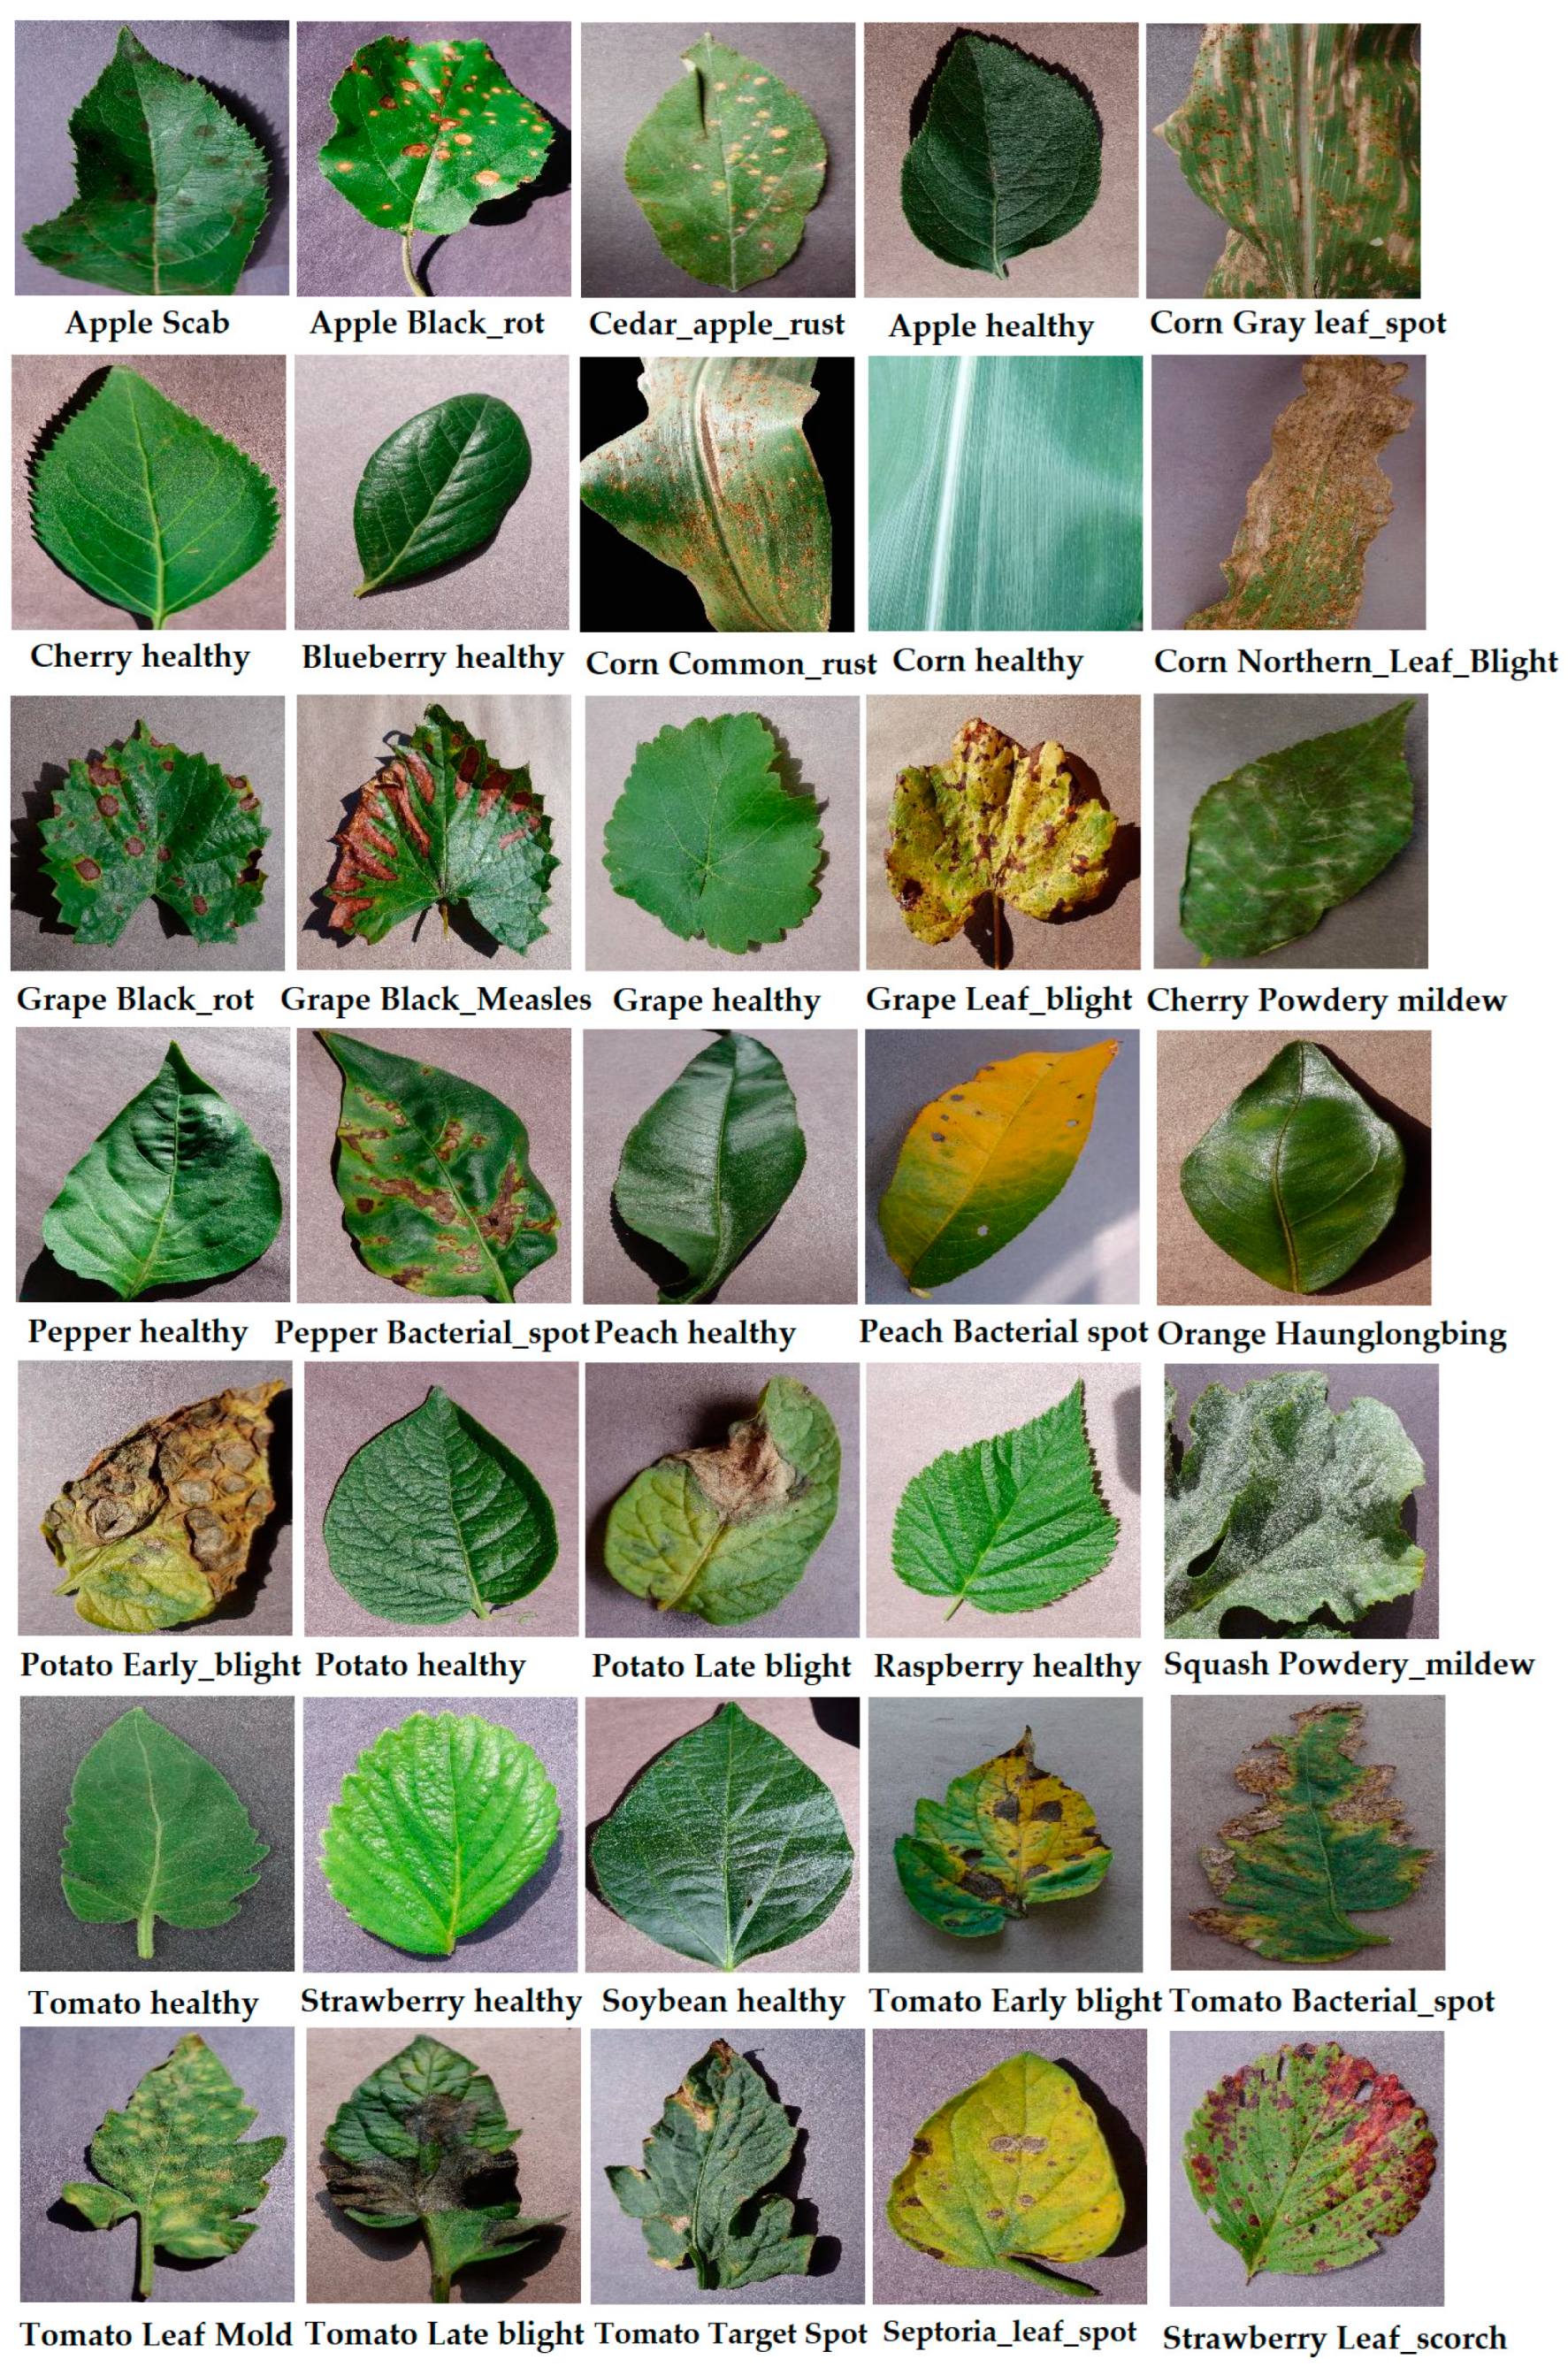
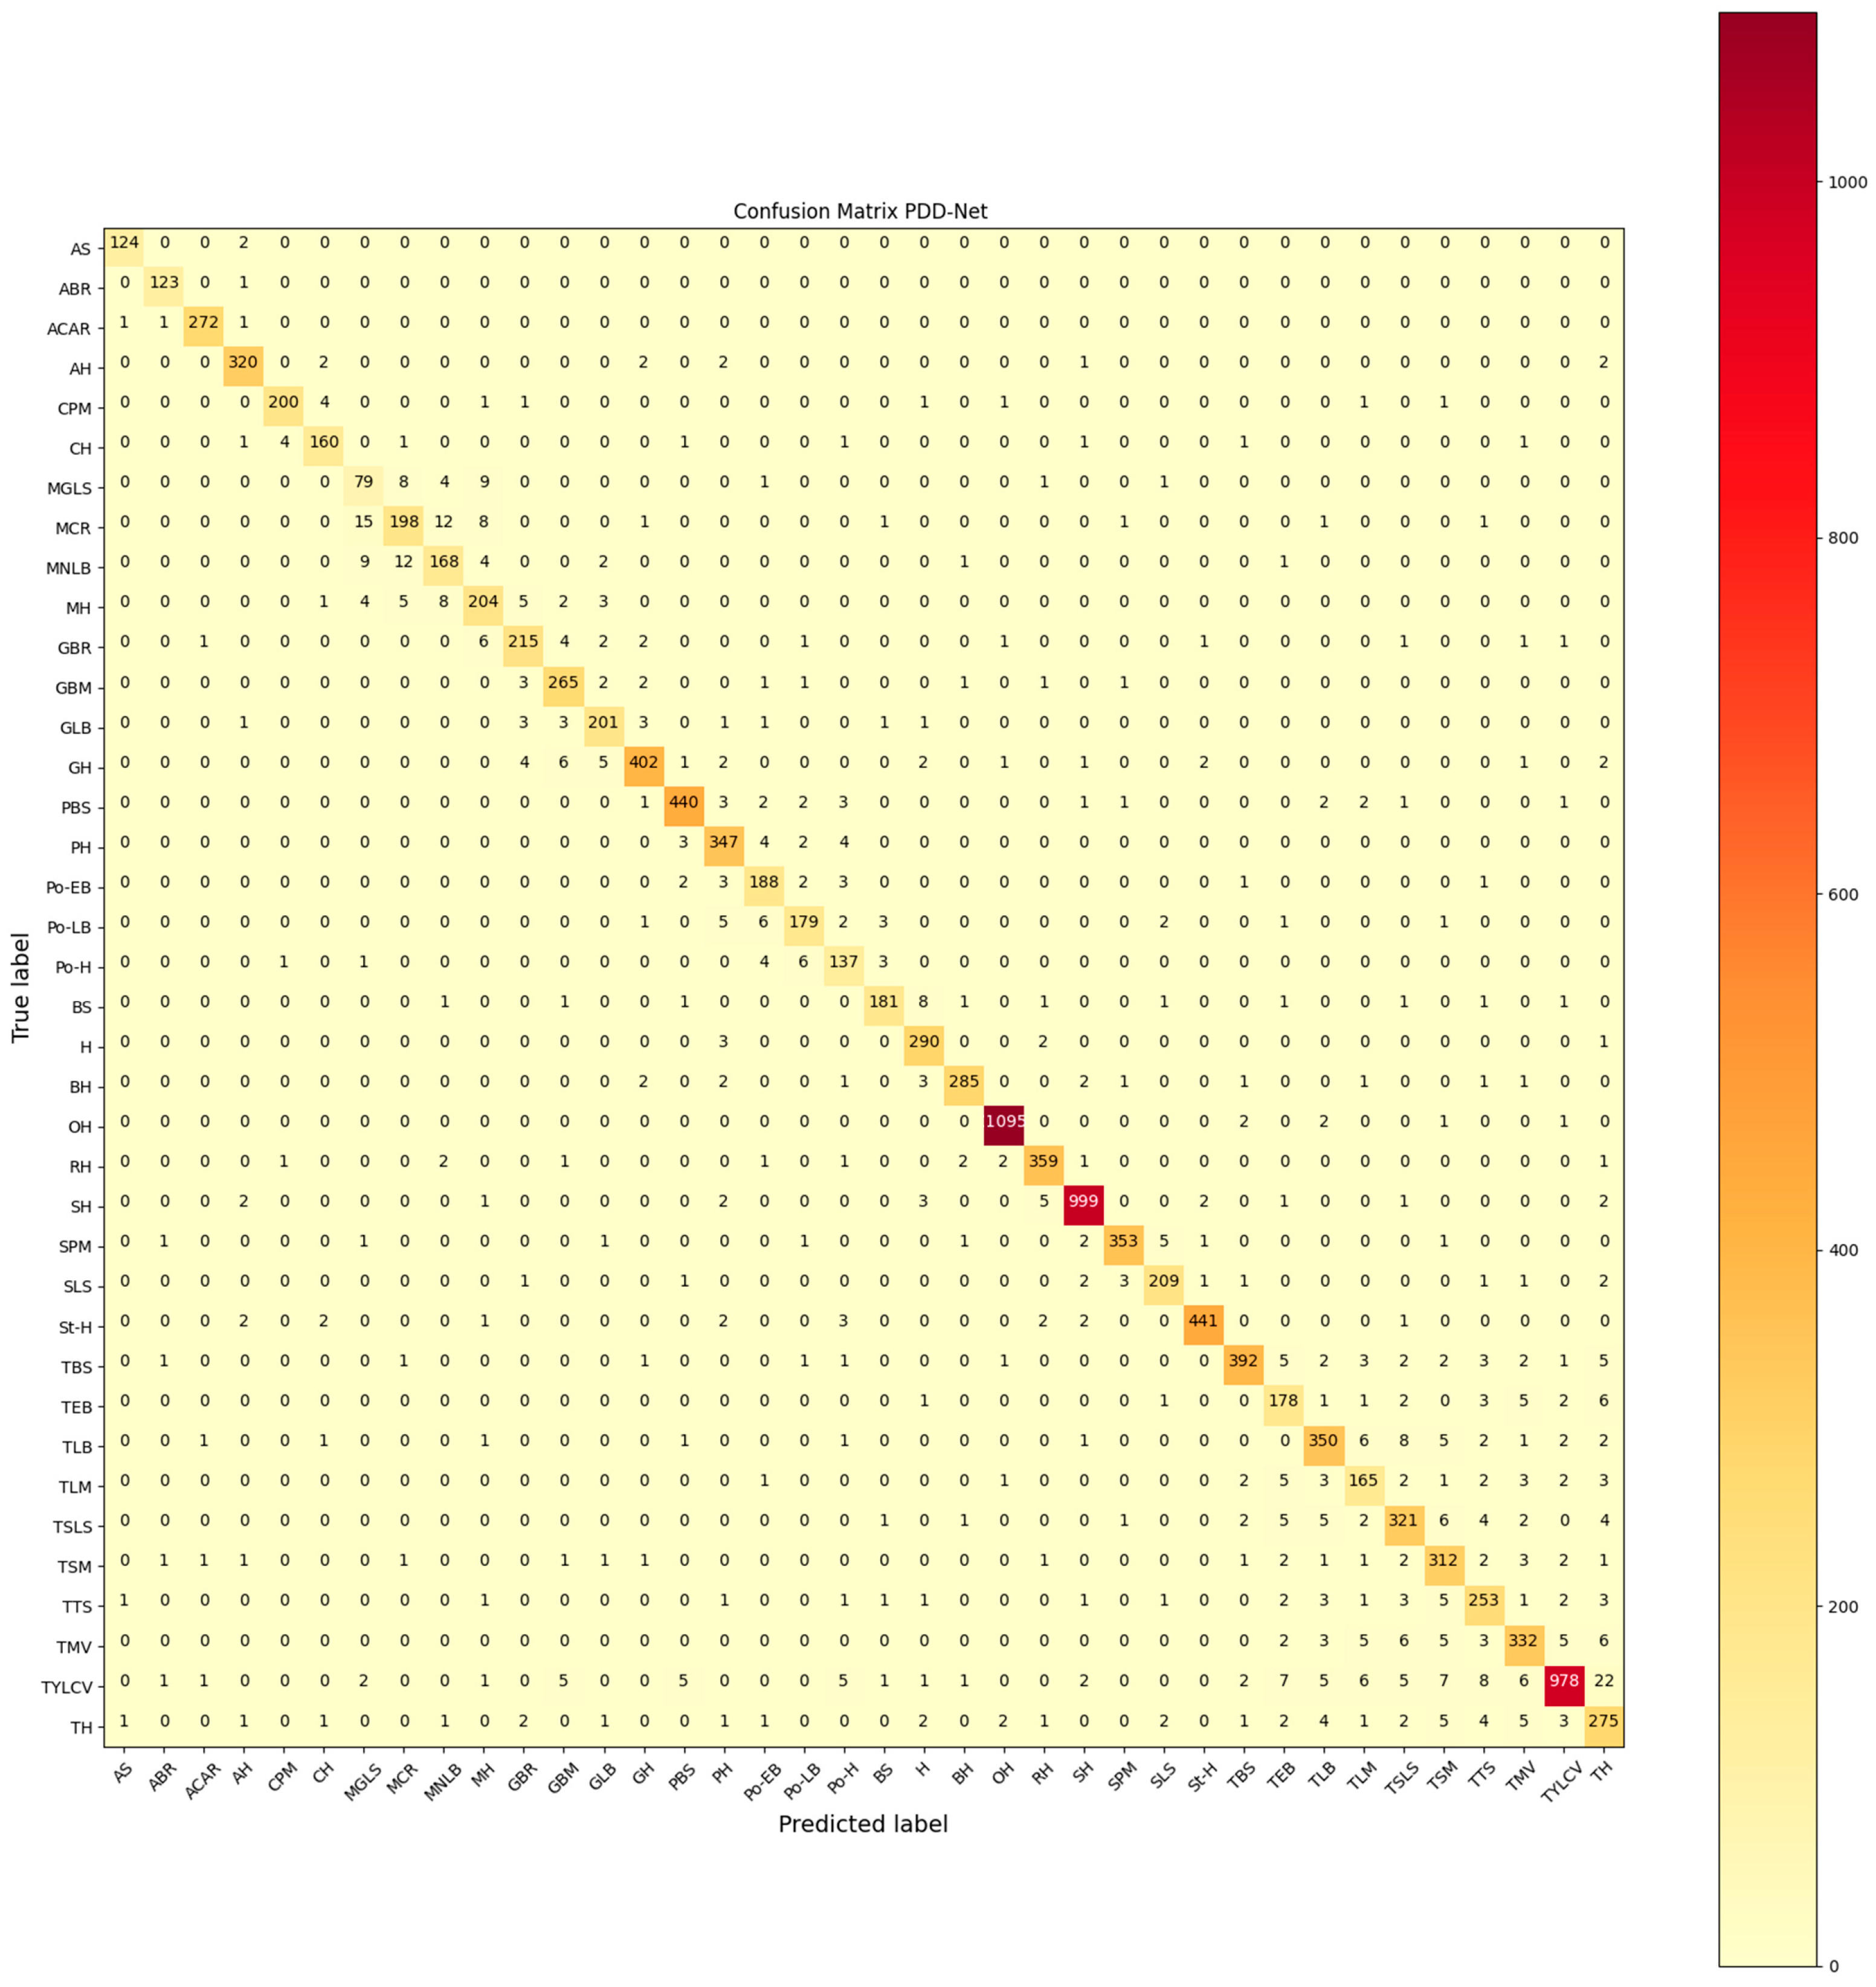
4.1. PlantVillage
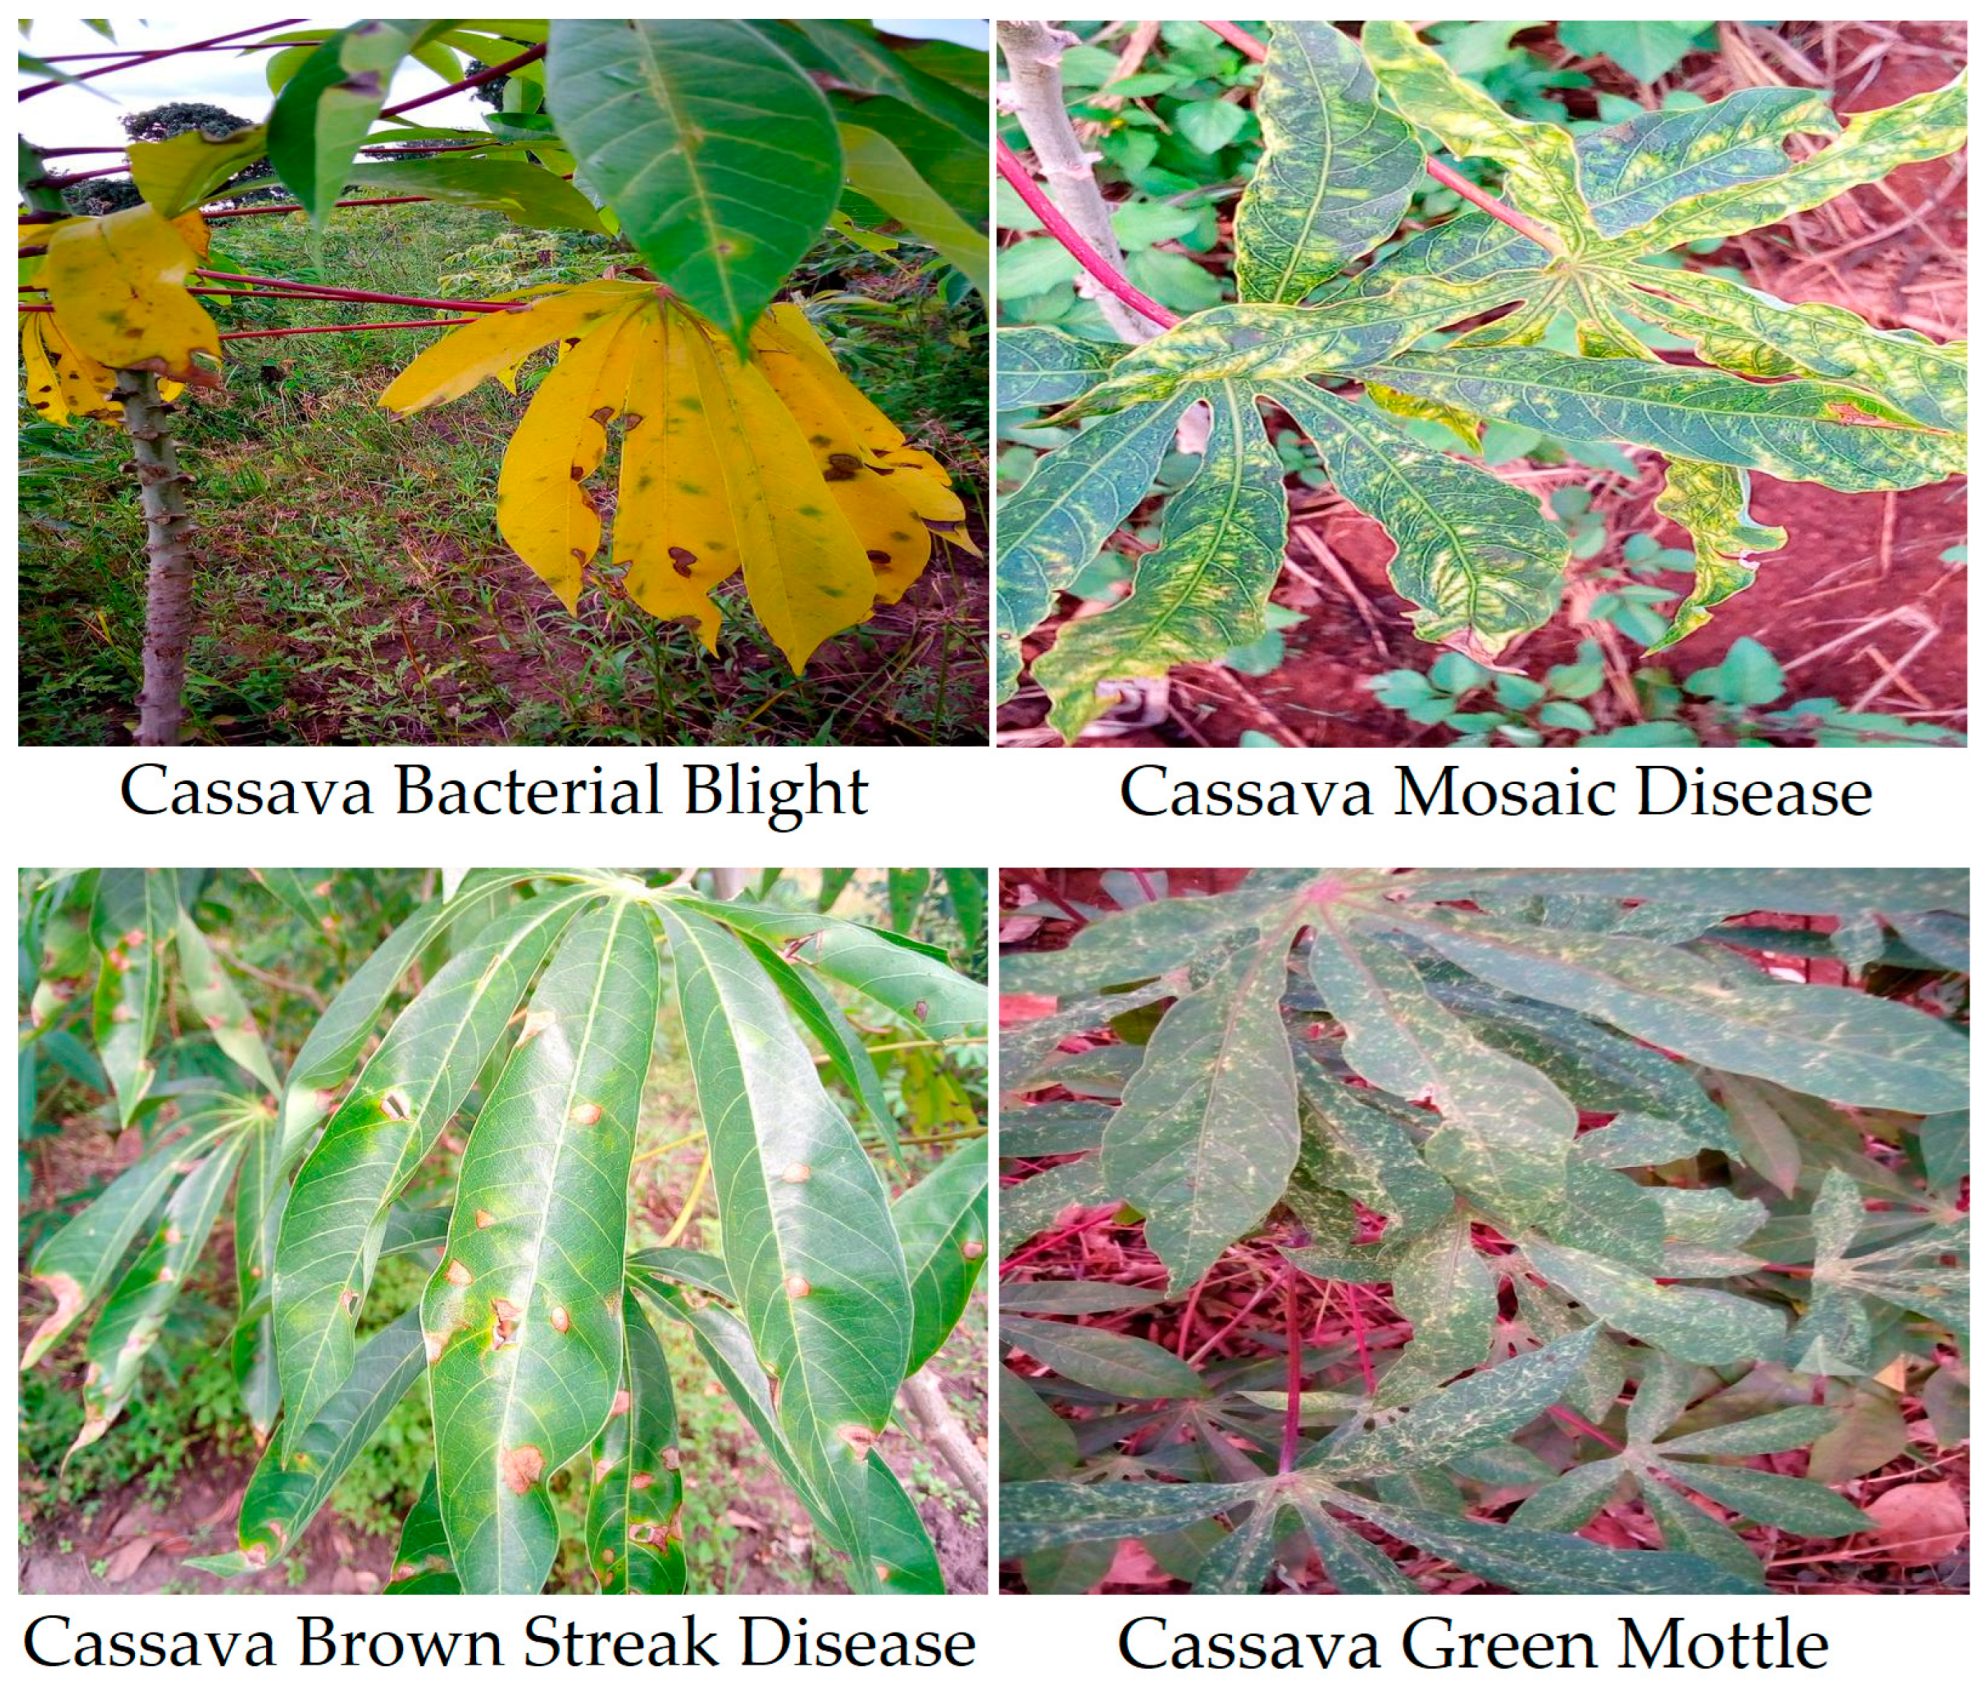
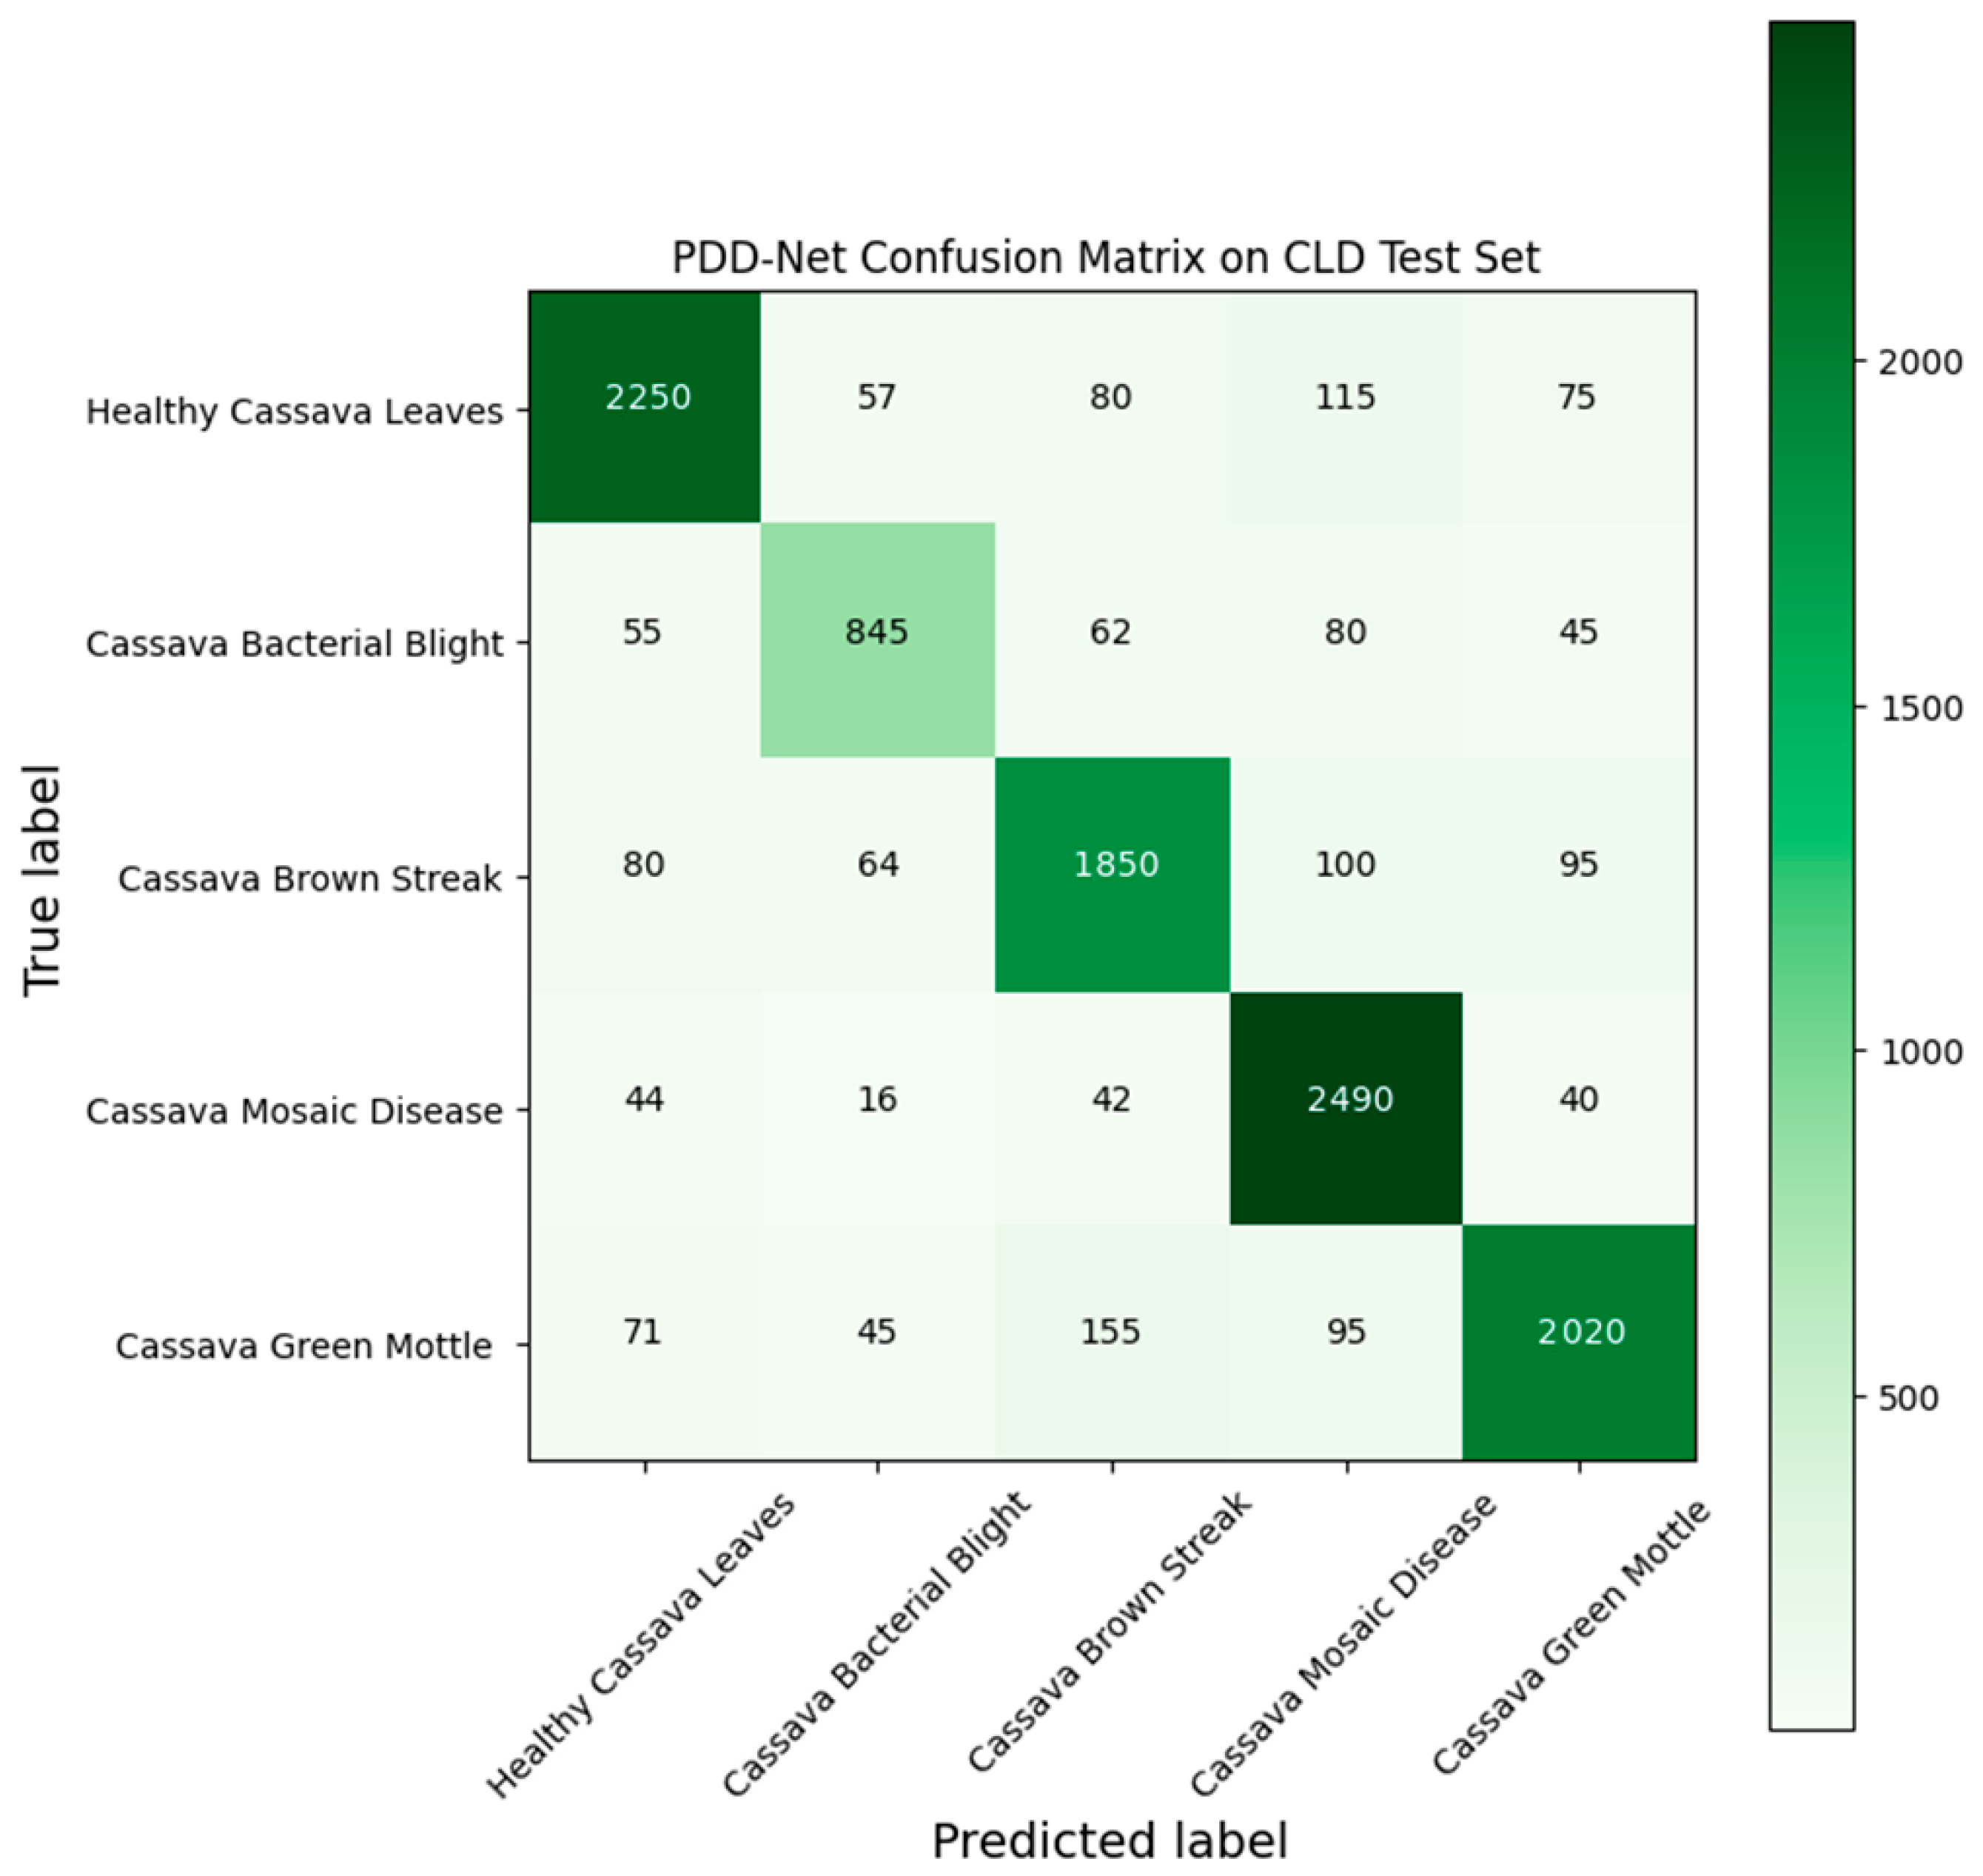
4.2. Cassava Leaf Disease (CLD)
5. Discussion
6. Conclusions and Future Work
Author Contributions
Funding
Institutional Review Board Statement
Informed Consent Statement
Data Availability Statement
Conflicts of Interest
References
- Taghikhah, F.; Voinov, A.; Shukla, N.; Filatova, T.; Anufriev, M. Integrated modeling of extended agro-food supply chains: A systems approach. Eur. J. Oper. Res. 2021, 288, 852–868. [Google Scholar] [CrossRef]
- Imami, D.; Valentinov, V.; Skreli, E. Food Safety and Value Chain Coordination in the Context of a Transition Economy: The Role of Agricultural Cooperatives. Int. J. Commons 2021, 15, 21–34. [Google Scholar] [CrossRef]
- Shang, Y.; Hasan, M.K.; Ahammed, G.J.; Li, M.; Yin, H.; Zhou, J. Applications of Nanotechnology in Plant Growth and Crop Protection: A Review. Molecules 2019, 24, 2558. [Google Scholar] [CrossRef] [PubMed]
- Bass, D.; Stentiford, G.D.; Wang, H.-C.; Koskella, B.; Tyler, C.R. The Pathobiome in Animal and Plant Diseases. Trends Ecol. Evol. 2019, 34, 996–1008. [Google Scholar] [CrossRef] [PubMed]
- Saleem, M.H.; Potgieter, J.; Arif, K.M. Plant Disease Detection and Classification by Deep Learning. Plants 2019, 8, 468. [Google Scholar] [CrossRef]
- Nagaraju, M.; Chawla, P. Systematic review of deep learning techniques in plant disease detection. Int. J. Syst. Assur. Eng. Manag. 2020, 11, 547–560. [Google Scholar] [CrossRef]
- Shruthi, U.; Nagaveni, V.; Raghavendra, B.K. A Review on Machine Learning Classification Techniques for Plant Disease Detection. In Proceedings of the 2019 5th International Conference on Advanced Computing & Communication Systems (ICACCS), Coimbatore, India, 15–16 March 2019; pp. 281–284. [Google Scholar]
- Pantazi, X.; Moshou, D.; Tamouridou, A. Automated leaf disease detection in different crop species through image features analysis and One Class Classifiers. Comput. Electron. Agric. 2019, 156, 96–104. [Google Scholar] [CrossRef]
- Hlaing, C.S.; Zaw, S.M.M. Tomato Plant Diseases Classification Using Statistical Texture Feature and Color Feature. In Proceedings of the 2018 IEEE/ACIS 17th International Conference on Computer and Information Science (ICIS), Singapore, 6–8 June 2018; pp. 439–444. [Google Scholar]
- Muhathir, M.; Hidayah, W.; Ifantiska, D. Utilization of Support Vector Machine and Speeded up Robust Features Extraction in Classifying Fruit Imagery. Comput. Eng. Appl. J. 2020, 9, 183–193. [Google Scholar] [CrossRef]
- Iniyan, S.; Jebakumar, R.; Mangalraj, P.; Mohit, M.; Nanda, A. Plant Disease Identification and Detection Using Support Vector Machines and Artificial Neural Networks. In Artificial Intelligence and Evolutionary Computations in Engineering Systems; Springer: Singapore, 2020; pp. 15–27. [Google Scholar]
- Mohameth, F.; Bingcai, C.; Sada, K.A. Plant Disease Detection with Deep Learning and Feature Extraction Using Plant Village. J. Comput. Commun. 2020, 8, 10–22. [Google Scholar] [CrossRef]
- Hanbay, K. Hyperspectral image classification using convolutional neural network and two-dimensional complex Gabor transform. J. Fac. Eng. Archit. Gazi Univ. 2020, 35, 443–456. [Google Scholar]
- Kusumo, B.S.; Heryana, A.; Mahendra, O.; Pardede, H.F. Machine Learning-Based for Automatic Detection of Corn-Plant Diseases Using Image Processing. In Proceedings of the 2018 International Conference on Computer, Control, Informatics and Its Applications (IC3INA), Tangerang, Indonesia, 1–2 November 2018; pp. 93–97. [Google Scholar]
- Golhani, K.; Balasundram, S.K.; Vadamalai, G.; Pradhan, B. A review of neural networks in plant disease detection using hyperspectral data. Inf. Process. Agric. 2018, 5, 354–371. [Google Scholar] [CrossRef]
- Tianyu, Z.; Zhenjiang, M.; Jianhu, Z. Combining cnn with Hand-Crafted Features for Image Classification. In Proceedings of the 2018 14th IEEE International Conference on Signal Processing (ICSP), Beijing, China, 12–16 August 2018; pp. 554–557. [Google Scholar]
- Fooladgar, F.; Kasaei, S. A survey on indoor RGB-D semantic segmentation: From hand-crafted features to deep convolutional neural networks. Multimedia Tools Appl. 2020, 79, 4499–4524. [Google Scholar] [CrossRef]
- Peng, X.; Yu, J.; Yao, B.; Liu, L.; Peng, Y. A Review of FPGA-Based Custom Computing Architecture for Convolutional Neural Network Inference. Chin. J. Electron. 2021, 30, 1–17. [Google Scholar]
- Lu, J.; Tan, L.; Jiang, H. Review on Convolutional Neural Network (CNN) Applied to Plant Leaf Disease Classification. Agriculture 2021, 11, 707. [Google Scholar] [CrossRef]
- Zhang, Y.-D.; Dong, Z.; Chen, X.; Jia, W.; Du, S.; Muhammad, K.; Wang, S.-H. Image based fruit category classification by 13-layer deep convolutional neural network and data augmentation. Multimedia Tools Appl. 2019, 78, 3613–3632. [Google Scholar] [CrossRef]
- Chen, J.; Chen, J.; Zhang, D.; Sun, Y.; Nanehkaran, Y. Using deep transfer learning for image-based plant disease identification. Comput. Electron. Agric. 2020, 173, 105393. [Google Scholar] [CrossRef]
- Tiwari, V.; Joshi, R.C.; Dutta, M.K. Dense convolutional neural networks based multiclass plant disease detection and classification using leaf images. Ecol. Inform. 2021, 63, 101289. [Google Scholar] [CrossRef]
- Zhang, S.; Zhang, S.; Zhang, C.; Wang, X.; Shi, Y. Cucumber leaf disease identification with global pooling dilated convolutional neural network. Comput. Electron. Agric. 2019, 162, 422–430. [Google Scholar] [CrossRef]
- Zhang, J.; Rao, Y.; Man, C.; Jiang, Z.; Li, S. Identification of cucumber leaf diseases using deep learning and small sample size for agricultural Internet of Things. Int. J. Distrib. Sens. Netw. 2021, 17, 15501477211007407. [Google Scholar] [CrossRef]
- Zhong, Y.; Zhao, M. Research on deep learning in apple leaf disease recognition. Comput. Electron. Agric. 2020, 168, 105146. [Google Scholar] [CrossRef]
- Wang, J.; Yu, L.; Yang, J.; Dong, H. DBA_SSD: A Novel End-to-End Object Detection Algorithm Applied to Plant Disease Detection. Information 2021, 12, 474. [Google Scholar] [CrossRef]
- Chakraborty, K.K.; Mukherjee, R.; Chakroborty, C.; Bora, K. Automated recognition of optical image based potato leaf blight diseases using deep learning. Physiol. Mol. Plant Pathol. 2022, 117, 101781. [Google Scholar] [CrossRef]
- Wagle, S.A.; Harikrishnan, R.; Ali, S.H.M.; Faseehuddin, M. Classification of Plant Leaves Using New Compact Convolutional Neural Network Models. Plants 2021, 11, 24. [Google Scholar] [CrossRef]
- Abbas, A.; Jain, S.; Gour, M.; Vankudothu, S. Tomato plant disease detection using transfer learning with C-GAN synthetic images. Comput. Electron. Agric. 2021, 187, 106279. [Google Scholar] [CrossRef]
- Tariq, U.; Hussain, N.; Nam, Y.; Kadry, S. An Integrated Deep Learning Framework for Fruits Diseases Classification. Comput. Mater. Contin. 2022, 71, 1387–1402. [Google Scholar]
- Thompson, R.N.; Brooks-Pollock, E. Detection, forecasting and control of infectious disease epidemics: Modelling outbreaks in humans, animals and plants. Philos. Trans. R Soc. B Biol. Sci. 2019, 374, 20190038. [Google Scholar] [CrossRef]
- Alatawi, A.A.; Alomani, S.M.; Alhawiti, N.I.; Ayaz, M. Plant Disease Detection using AI based VGG-16 Model. Int. J. Adv. Comput. Sci. Appl. 2022, 13. [Google Scholar] [CrossRef]
- Eunice, J.; Popescu, D.E.; Chowdary, M.K.; Hemanth, J. Deep Learning-Based Leaf Disease Detection in Crops Using Images for Agricultural Applications. Agronomy 2022, 12, 2395. [Google Scholar]
- Simonyan, K.; Zisserman, A. Very deep convolutional networks for large-scale image recognition. arXiv 2014, arXiv:1409.1556. [Google Scholar]
- Deng, J.; Dong, W.; Socher, R.; Li, L.J.; Li, K.; Fei-Fei, L. Imagenet: A Large-Scale Hierarchical Image Database. In Proceedings of the 2009 IEEE Conference on Computer Vision and Pattern Recognition, Miami, FL, USA, 20–25 June 2009; pp. 248–255. [Google Scholar]
- Szegedy, C.; Vanhoucke, V.; Ioffe, S.; Shlens, J.; Wojna, Z. Rethinking the Inception Architecture for Computer Vision. In Proceedings of the IEEE Conference on Computer Vision and Pattern Recognition, Las Vegas, NV, USA, 27–30 June 2016; pp. 2818–2826. [Google Scholar]
- Huang, G.; Liu, Z.; Van Der Maaten, L.; Weinberger, K.Q. Densely Connected Convolutional Networks. In Proceedings of the IEEE Conference on Computer Vision and Pattern Recognition, Honolulu, HI, USA, 21–26 July 2017; pp. 4700–4708. [Google Scholar]
- Howard, A.G.; Zhu, M.; Chen, B.; Kalenichenko, D.; Wang, W.; Weyand, T.; Andreetto, M.; Adam, H. Mobilenets: Efficient convolutional neural networks for mobile vision applications. arXiv 2017, arXiv:1704.04861. [Google Scholar]
- He, K.; Zhang, X.; Ren, S.; Sun, J. Deep Residual Learning for Image Recognition. In Proceedings of the IEEE Conference on Computer Vision and Pattern Recognition, Las Vegas, NV, USA, 27–30 June 2016; pp. 770–778. [Google Scholar]
- Msonda, P.; Uymaz, S.A.; Karaağaç, S.S. Spatial Pyramid Pooling in Deep Convolutional Networks for Automatic Tuberculosis Diagnosis. Trait. Du Signal 2020, 37, 1075–1084. [Google Scholar] [CrossRef]
- Chieng, H.H.; Wahid, N.; Ong, P.; Perla, S.R.K. Flatten-T Swish: A thresholded ReLU-Swish-like activation function for deep learning. arXiv 2018, arXiv:1812.06247. [Google Scholar] [CrossRef]
- Cap, Q.H.; Uga, H.; Kagiwada, S.; Iyatomi, H. LeafGAN: An Effective Data Augmentation Method for Practical Plant Disease Diagnosis. IEEE Trans. Autom. Sci. Eng. 2020, 19, 1258–1267. [Google Scholar] [CrossRef]
- Girshick, R. Fast r-cnn. In Proceedings of the IEEE International Conference on Computer Vision, Santiago, Chile, 7–13 December 2015; pp. 1440–1448. [Google Scholar]
- Redmon, J.; Divvala, S.; Girshick, R.; Farhadi, A. You Only Look Once: Unified, Real-Time Object Detection. In Proceedings of the IEEE Conference On Computer Vision and Pattern Recognition, Las Vegas, NV, USA, 27–30 June 2016; pp. 779–788. [Google Scholar]
- Liu, W.; Anguelov, D.; Erhan, D.; Szegedy, C.; Reed, S.; Fu, C.Y.; Berg, A.C. Ssd: Single Shot Multibox Detector. In Proceedings of the Computer Vision–ECCV 2016: 14th European Conference, Amsterdam, The Netherlands, 11–14 October 2016; Springer International Publishing: Amsterdam, The Netherlands, 2016. Part I 14. pp. 21–37. [Google Scholar]
- Nair, V.; Hinton, G.E. Rectified Linear Units Improve Restricted Boltzmann Machines. In Proceedings of the 27th International Conference on Machine Learning (ICML-10), Haifa, Israel, 21–24 June 2010; pp. 807–814. [Google Scholar]
- Szegedy, C.; Ioffe, S.; Vanhoucke, V.; Alemi, A. Inception-v4, Inception-Resnet and the Impact of Residual Connections on Learning. In Proceedings of the AAAI Conference on Artificial Intelligence, San Francisco, CA, USA, 4–9 February 2017; Volume 31. [Google Scholar]
- Attallah, O. Tomato Leaf Disease Classification via Compact Convolutional Neural Networks with Transfer Learning and Feature Selection. Horticulturae 2023, 9, 149. [Google Scholar] [CrossRef]
- Koo, K.-M.; Cha, E.-Y. Image recognition performance enhancements using image normalization. Hum. Cent. Comput. Inf. Sci. 2017, 7, 33. [Google Scholar] [CrossRef]
- Ramachandran, P.; Zoph, B.; Le, Q.V. Searching for activation functions. arXiv 2017, arXiv:1710.05941. [Google Scholar]
- Lin, T.Y.; Goyal, P.; Girshick, R.; He, K.; Dollár, P. Focal Loss for Dense Object Detection. In Proceedings of the IEEE International Conference on Computer Vision, Venice, Italy, 22–29 October 2017; pp. 2999–3007. [Google Scholar]
- Hardt, M.; Recht, B.; Singer, Y. Train faster, generalize better: Stability of stochastic gradient descent. In Proceedings of the International Conference on Machine Learning, PMLR. New York City, NY, USA, 19–24 June 2016; pp. 1225–1234. [Google Scholar]
- Turki, T.; Taguchi, Y.H. Discriminating the Single-cell Gene Regulatory Networks of Human Pancreatic Islets: A Novel Deep Learning Application. Comput. Biol. Med. 2021, 132, 104257. [Google Scholar] [CrossRef] [PubMed]
- Turki, T.; Wei, Z. Improved Deep Convolutional Neural Networks via Boosting for Predicting the Quality of In Vitro Bovine Embryos. Electronics 2022, 11, 1363. [Google Scholar] [CrossRef]


| Category | Training Samples | Testing Samples | Total Samples |
|---|---|---|---|
| HCL | 10,308 | 2577 | 12,885 |
| CBB | 4348 | 1087 | 5435 |
| CBSD | 8756 | 2189 | 10,945 |
| CMD | 10,526 | 2632 | 13,158 |
| CGM | 9544 | 2386 | 11,930 |
| Total Samples | 43,482 | 10,871 | 54,353 |
| Plant Name | Leaf Label | Image Frequency | Plant Name | Leaf Label | Image Frequency | ||
|---|---|---|---|---|---|---|---|
| Train | Test | Train | Test | ||||
| Apple | Scab (AS) | 504 | 126 | Peeper | Bacterial spot (BS) | 798 | 199 |
| Black rot (ABR) | 497 | 124 | Healthy (H) | 1182 | 296 | ||
| Cedar apple rust (ACAR) | 1100 | 275 | Blueberry | Healthy (BH) | 1202 | 300 | |
| Healthy (AH) | 1316 | 329 | Orange | Huanglongbing (OH) | 4406 | 1101 | |
| Cherry | Powdery mildew (CPM) | 842 | 210 | Raspberry | Healthy (RH) | 1484 | 371 |
| Healthy (CH) | 683 | 171 | Soybean | Healthy (SH) | 4072 | 1018 | |
| Corn/Maze | Gray leaf spot (MGLS) | 410 | 103 | Squash | Powdery mildew (SPM) | 1468 | 367 |
| Common rust (MCR) | 954 | 238 | Strawberry | Leaf scorch (SLS) | 887 | 222 | |
| Northern leaf blight (MNLB) | 788 | 197 | Healthy (St-H) | 1824 | 456 | ||
| Healthy (MH) | 930 | 232 | Tomato | Bacterial spot (TBS) | 1702 | 425 | |
| Grape | Black rot (GBR) | 944 | 236 | Early blight (TEB) | 800 | 200 | |
| Black measles (GBM) | 1106 | 277 | Late blight (TLB) | 1527 | 382 | ||
| Leaf blight (GLB) | 861 | 215 | Leaf mold (TLM) | 762 | 190 | ||
| Healthy (GH) | 1716 | 429 | Septoria leaf spot (TSLS) | 1417 | 354 | ||
| Peach | Bacterial spot (PBS) | 1338 | 459 | Spider mites (TSM) | 1341 | 335 | |
| Healthy (PH) | 1440 | 360 | Target spot (TTS) | 1123 | 281 | ||
| Potato | Early blight (Po-EB) | 800 | 200 | Mosaic virus (TMV) | 1468 | 367 | |
| Late blight (Po-LB) | 800 | 200 | Yellow leaf curl virus (TYLCV) | 4286 | 1071 | ||
| Healthy (Po-H) | 608 | 152 | Healthy (TH) | 1273 | 318 | ||
| Class | Precision % | Recall % | F1 Score % |
|---|---|---|---|
| AS | 97.64 | 98.41 | 98.02 |
| ABR | 96.09 | 99.19 | 97.62 |
| ACAR | 98.55 | 98.91 | 98.73 |
| AH | 96.39 | 97.26 | 96.82 |
| CPM | 97.09 | 95.24 | 96.15 |
| CH | 93.57 | 93.57 | 93.57 |
| MGLS | 71.17 | 76.70 | 73.83 |
| MCR | 87.61 | 83.19 | 85.34 |
| MNLB | 85.71 | 85.28 | 85.50 |
| MH | 86.08 | 87.93 | 86.99 |
| GBR | 91.88 | 91.10 | 91.49 |
| GBM | 92.01 | 95.67 | 93.81 |
| GLB | 92.20 | 93.49 | 92.84 |
| GH | 96.17 | 93.71 | 94.92 |
| PBS | 96.70 | 95.86 | 96.28 |
| PH | 92.78 | 96.39 | 94.55 |
| Po-EB | 89.52 | 94.00 | 91.71 |
| Po-LB | 91.79 | 89.50 | 90.63 |
| Po-H | 84.05 | 90.13 | 86.98 |
| BS | 94.27 | 90.95 | 92.58 |
| H | 92.65 | 97.97 | 95.24 |
| BH | 97.27 | 95.00 | 96.12 |
| OH | 99.18 | 99.46 | 99.32 |
| RH | 96.25 | 96.77 | 96.51 |
| SH | 98.33 | 98.13 | 98.23 |
| SPM | 97.78 | 96.19 | 96.98 |
| SLS | 94.14 | 94.14 | 94.14 |
| St-H | 98.44 | 96.71 | 97.57 |
| TBS | 96.55 | 92.67 | 94.57 |
| TEB | 83.96 | 89.00 | 86.41 |
| TLB | 91.62 | 91.62 | 91.62 |
| TLM | 84.62 | 86.84 | 85.71 |
| TSLS | 89.66 | 90.68 | 90.17 |
| TSM | 88.64 | 93.13 | 90.83 |
| TTS | 87.54 | 90.04 | 88.77 |
| TMV | 90.96 | 90.46 | 90.71 |
| TYLCV | 97.70 | 91.32 | 94.40 |
| TH | 81.60 | 86.48 | 83.97 |
| Framework | Precision % | Recall % | F1 Score % | Accuracy % |
|---|---|---|---|---|
| DenseNet-201 | 82.82 | 85.13 | 83.82 | 85.60 |
| DenseNet-121 | 81.30 | 83.47 | 82.15 | 84.05 |
| ResNet-50 | 75.00 | 76.13 | 75.19 | 78.38 |
| VGG-16 | 60.87 | 63.36 | 61.67 | 67.12 |
| PDD-Net | 92.06 | 92.71 | 92.36 | 93.79 |
| Category | Precision % | Recall % | F1 Score % |
|---|---|---|---|
| HCL | 90.00 | 87.31 | 88.64 |
| CBB | 82.28 | 77.74 | 79.94 |
| CBSD | 84.51 | 84.51 | 84.51 |
| CMD | 86.46 | 94.60 | 90.35 |
| CGM | 88.79 | 84.66 | 86.68 |
| Framework | Precision % | Recall % | F1 Score % | Accuracy % |
|---|---|---|---|---|
| DenseNet-201 | 81.77 | 81.76 | 81.57 | 82.50 |
| DenseNet-121 | 80.76 | 80.35 | 80.33 | 81.27 |
| ResNet-50 | 79.92 | 79.53 | 79.55 | 80.88 |
| VGG-16 | 78.93 | 78.54 | 78.54 | 79.89 |
| PDD-Net | 86.41 | 85.77 | 86.02 | 86.98 |
Disclaimer/Publisher’s Note: The statements, opinions and data contained in all publications are solely those of the individual author(s) and contributor(s) and not of MDPI and/or the editor(s). MDPI and/or the editor(s) disclaim responsibility for any injury to people or property resulting from any ideas, methods, instructions or products referred to in the content. |
© 2023 by the authors. Licensee MDPI, Basel, Switzerland. This article is an open access article distributed under the terms and conditions of the Creative Commons Attribution (CC BY) license (https://creativecommons.org/licenses/by/4.0/).
Share and Cite
Alghamdi, H.; Turki, T. PDD-Net: Plant Disease Diagnoses Using Multilevel and Multiscale Convolutional Neural Network Features. Agriculture 2023, 13, 1072. https://doi.org/10.3390/agriculture13051072
Alghamdi H, Turki T. PDD-Net: Plant Disease Diagnoses Using Multilevel and Multiscale Convolutional Neural Network Features. Agriculture. 2023; 13(5):1072. https://doi.org/10.3390/agriculture13051072
Chicago/Turabian StyleAlghamdi, Hamed, and Turki Turki. 2023. "PDD-Net: Plant Disease Diagnoses Using Multilevel and Multiscale Convolutional Neural Network Features" Agriculture 13, no. 5: 1072. https://doi.org/10.3390/agriculture13051072
APA StyleAlghamdi, H., & Turki, T. (2023). PDD-Net: Plant Disease Diagnoses Using Multilevel and Multiscale Convolutional Neural Network Features. Agriculture, 13(5), 1072. https://doi.org/10.3390/agriculture13051072