Article

Fertilization Strategies on Fennel Crop in the Mediterranean Environment: Agronomic Performance, Costs and Sustainability Assessment

by
Mariangela Diacono
1,
Alessandro Persiani
1,*,
Vincenzo Alfano
1,*,
Antonio Monteforte
2 and
Francesco Montemurro
1
1
Council for Agricultural Research and Economics, Research Centre for Agriculture and Environment, Via Celso Ulpiani 5, 70125 Bari, Italy
2
Biovegetal—Tersan Puglia S.p.A., Sp 231 km 1600, Modugno, 70026 Bari, Italy
*
Authors to whom correspondence should be addressed.
Agriculture 2023, 13(5), 1048; https://doi.org/10.3390/agriculture13051048
Submission received: 22 March 2023 / Revised: 10 May 2023 / Accepted: 11 May 2023 / Published: 12 May 2023
(This article belongs to the Special Issue Integrated LCA-LCC Assessment Model of Agricultural Systems)

Abstract

:
In the Mediterranean area, using organic fertilizers is crucial to maintaining and increasing soil fertility and crop productivity since soil organic matter is being progressively depleted due to climate change effects. Therefore, the aim of this study was to compare two different organic fertilizers (MC1 without and MC2 with an inoculum of selected microorganisms), applied at 100% and 50% doses, with mineral fertilization and an unfertilized control: (i) by assessing the agronomic performance of fennel crop; and (ii) by investigating environmental and economic sustainability, through GHG emissions determination, carbon efficiency, and cost analysis. The results of the MC2 were comparable to the mineral fertilization for crop growing parameters (plants and roots dry weights) and marketable yield, irrespective of the amount applied (50–100%), likely due to the inoculum of selected microorganisms. These may have favored the soil microbial activity, the nutrient availability, and better synchronization of N mineralization with fennel N demand with respect to MC1 (with a higher C/N ratio). The MC2 also achieved lower costs than the other treatments. The highest GHG emission value was found in the mineral fertilization treatment, while the lowest was recorded in the unfertilized control treatment. The two organic treatments at 100% were the most carbon-efficient systems because of the highest carbon stocks/output, considering the difference between C stocked/output and the C loss/input emitted.

1. Introduction

Climate change is becoming one of the major threats to agricultural systems and food security, particularly in the Mediterranean regions where extreme weather events (e.g., heavy precipitation and droughts) negatively affect the quality of cultivated soils [1].
In fact, the increasing frequency of exceptionally heavy and intensive rainfall has increased the risk of soil erosion, flooding, hypoxic conditions, and the loss of soil and nutrients by surface run-off. Moreover, the rising temperature has enhanced the mineralization rate of soil organic matter, the leaching of nutrients, and thus soil fertility decline [2].
To supply the growing demand for food, specialized conventional agriculture has contributed, in turn, to soil degradation and greenhouse gases emission (GHG) enhancement, because of intensive energy use during tillage and overuse of synthetic agrochemicals and fertilizer (i.e., carbon-intensive and high energy-demanding input) overuse [3,4]. Therefore, mitigation and adaptation measures are needed to counteract the environmental degradation effects (e.g., biodiversity loss, soil organic matter depletion, soil erosion, etc.) caused by climate change. Among them, appropriate crop diversification strategies, climate-smart soil management, and organic fertilization techniques might improve soil health, crop production, food security, and environmental sustainability [5,6].
In arid and semiarid Mediterranean regions, where organic matter is being progressively depleted [7,8], proper fertilization practices are crucial in maintaining soil fertility and crop productivity. As a consequence, these practices can ensure the environmental and economic sustainability of agricultural systems [9]. In particular, from an environmental point of view, the avoided mineral fertilizer production and application in agriculture is estimated to reduce agricultural GHG emissions by up to 20% by reducing N2O emissions and about 10% by lowering energy demand [10]. In low input and organic agriculture, the use of biofertilizers—by recycling different agricultural wastes, co-products and by-products—can represent a successful circular economy strategy to recover valuable nutrients of waste streams, at the same time reducing environmental pollution from their disposal [11,12].
Many studies have demonstrated that organic amendments can provide several benefits to soil quality [13,14,15]. The authors indicated that these enhanced soil structure, improved biological properties, and overall soil fertility. However, many effects evolve slowly, e.g., by organic matter restoration and carbon sequestration in the soil, showing positive effects over the long period [16]. In the current context of climate change and energy crisis, where prices for mineral fertilizers are progressively increasing and nutrient resources (particularly phosphorus) are depleting, organic fertilizers are becoming an interesting alternative from both an environmental and economic point of view [17].
The most appropriate fertilization should be chosen, considering both environmental and economic sustainability. Therefore, the evaluation of soil fertility management options, integrating agronomic performance analysis with GHG determination and carbon sustainability indexes [18,19], can be considered a win–win approach. In addition to agronomic evaluation, the carbon footprint is an essential component of the environmental impact assessment of agricultural production [20,21]. In the current context of growing environmental concerns, the application of sustainable agricultural practices, such as reduced tillage and the use of sustainable fertilizers, is essential. This approach can reduce the negative effects of agriculture on the environment by reducing inputs, which in turn reduces CO2 emissions, soil degradation phenomena, and the cost of cultivation [19]. In the context of climate change and anthropogenic emissions into the atmosphere, a sustainability system can be assessed by evaluating temporal changes in the output/input ratios of C using a holistic approach [22]. The term C output comprises all outputs, including productions, biomasses, and root biomass. Similarly, the term C input can be comprehensive and include direct input and indirect losses in the terrestrial/soil C pool, losses of C due to erosion C, and tertiary sources of C emission (e.g., the manufacture of farm machinery).
Despite the many studies and scientific works that have compared the agronomic and environmental performance of organic and mineral fertilizers on soil and plant, there are almost no studies that also include cost analysis.
Fertilization costs depend both on fertilizer type and spreading mode. In fact, depending on the fertilizer bulk density and N content, the amount of fertilizer needed per hectare can vary greatly, and thus the total costs.
The fertilizer amount (weight and volume) and the number of applications (basal dressing and/or topdressing) needed per hectare have an impact on the spreading working times (depending on the spreader loading capacity), fuel consumption, human labor, and thus on the operating costs of spreading. Moreover, depending on the fertilizer form (granular or non-granular), the use of more suitable handling and spreading machinery has an impact on both purchasing and operating costs (spreading efficiency).
Even if these topics are already studied, there is a lack of knowledge regarding integrating agronomic performance, costs, and sustainability assessment in Mediterranean vegetables. Therefore, the objectives of this study were to compare, under Mediterranean conditions, two different organic fertilizers (MC1 without and MC2 with an inoculum of selected microorganisms), applied at 100% and 50% doses, with mineral fertilization and an unfertilized control: (i) by assessing the agronomic performance of fennel crop; and (ii) by investigating environmental and economic sustainability, through GHG emissions determination, carbon efficiency, and cost analysis.

2. Materials and Methods

2.1. Experimental Design, Treatment, and Measurements

The field experiment was carried out during the 2020 and 2021 seasons at the experimental farm “Campo 7” of the Italian Council for Agricultural Research and Economics—Research Centre for Agriculture and Environment (CREA-AA), located in Metaponto (MT), in Southern Italy (lat. 40°24′ N; long. 16°48′ E, 8 m above sea level). The climate of the area is classified as accentuated thermo-Mediterranean, according to the UNESCO-FAO [23]. The soil is classified as “Epiaquert” [24], with a texture (at 0–0.5 m) of 60 and 36% of clay and silt, respectively, and a bulk density of 1350 kg m−3 on average.
The field trial was conceived to evaluate the effects of different fertilization strategies on horticultural and cereal crops in rotation. In this study, the effect of two years of fennel cultivation is presented, while wheat had been grown as a previous crop.
The experimental design was a randomized complete block design with two factors (year and fertilization treatment) and three replications. Based on fennel nitrogen (N) uptake, the total amount of fertilizer applied in each fertilized treatment was 130 kg of N ha−1, two commercial organic fertilizers being compared, both applied alone as basal dressing and in combination with UREA in the topdressing. In particular, the first fertilizer, MC1, was a compost (TOC = 300 g kg−1 of dry weight, N = 20 g kg−1 of dry weight, C/N = 15; Tersan Puglia S.p.A., Bari, Italy) obtained from municipal solid waste from separate collections and biodegradable wastes from parks and gardens management, whereas MC2 was a new typology of compost (TOC = 300 g kg−1 of dry weight, N = 45 g kg−1 of dry weight, C/N = 6.6; Tersan Puglia S.p.A., Bari), again from municipal solid waste, characterized by an inoculum of selected microorganisms (Hypocreaceae, Pseudomonadaceae, and Bacillaceae). The following treatments were, thus, compared: T1 = 100% MC1 for a total amount of 7.6 Mg ha−1; T2 = 50% MC1 for a total amount of 3.8 Mg ha−1 plus 50% UREA (topdressing) (46% N) for a total amount of 130 kg N ha−1; T3 = 100% MC2 for a total amount of 4.3 Mg ha−1; T4 = 50% MC2 plus 50% UREA (topdressing) (46% N) for a total amount of 130 kg N ha−1; T5 = 50% of mineral fertilizer 18–46 (basal dressing), for a total amount of 330 kg ha−1, plus 50% UREA (topdressing) (46% N) for a total amount of 130 kg N ha−1. All the treatments were compared to a not fertilized control (T6).
In each cropping season, the organic fertilizers were applied about one month before the cash crop transplanting, while the topdressing fertilizers were applied one month after transplanting. The irrigation management was the same in all analyzed theses, and a drip irrigation system was utilized. The amount of irrigation water supplied was about 2080 m3 ha−1 as an average of the two-year fennel cultivation. In both cropping seasons, fennel was cultivated during the autumn and harvested during the winter, when the commercial maturity stage occurred. In particular, fennel was transplanted on 11 August 2020 and harvested during the first week of November 2020 in the first season, while was transplanted on 3 August 2021 and harvested during the last week of October 2021 in the second one.

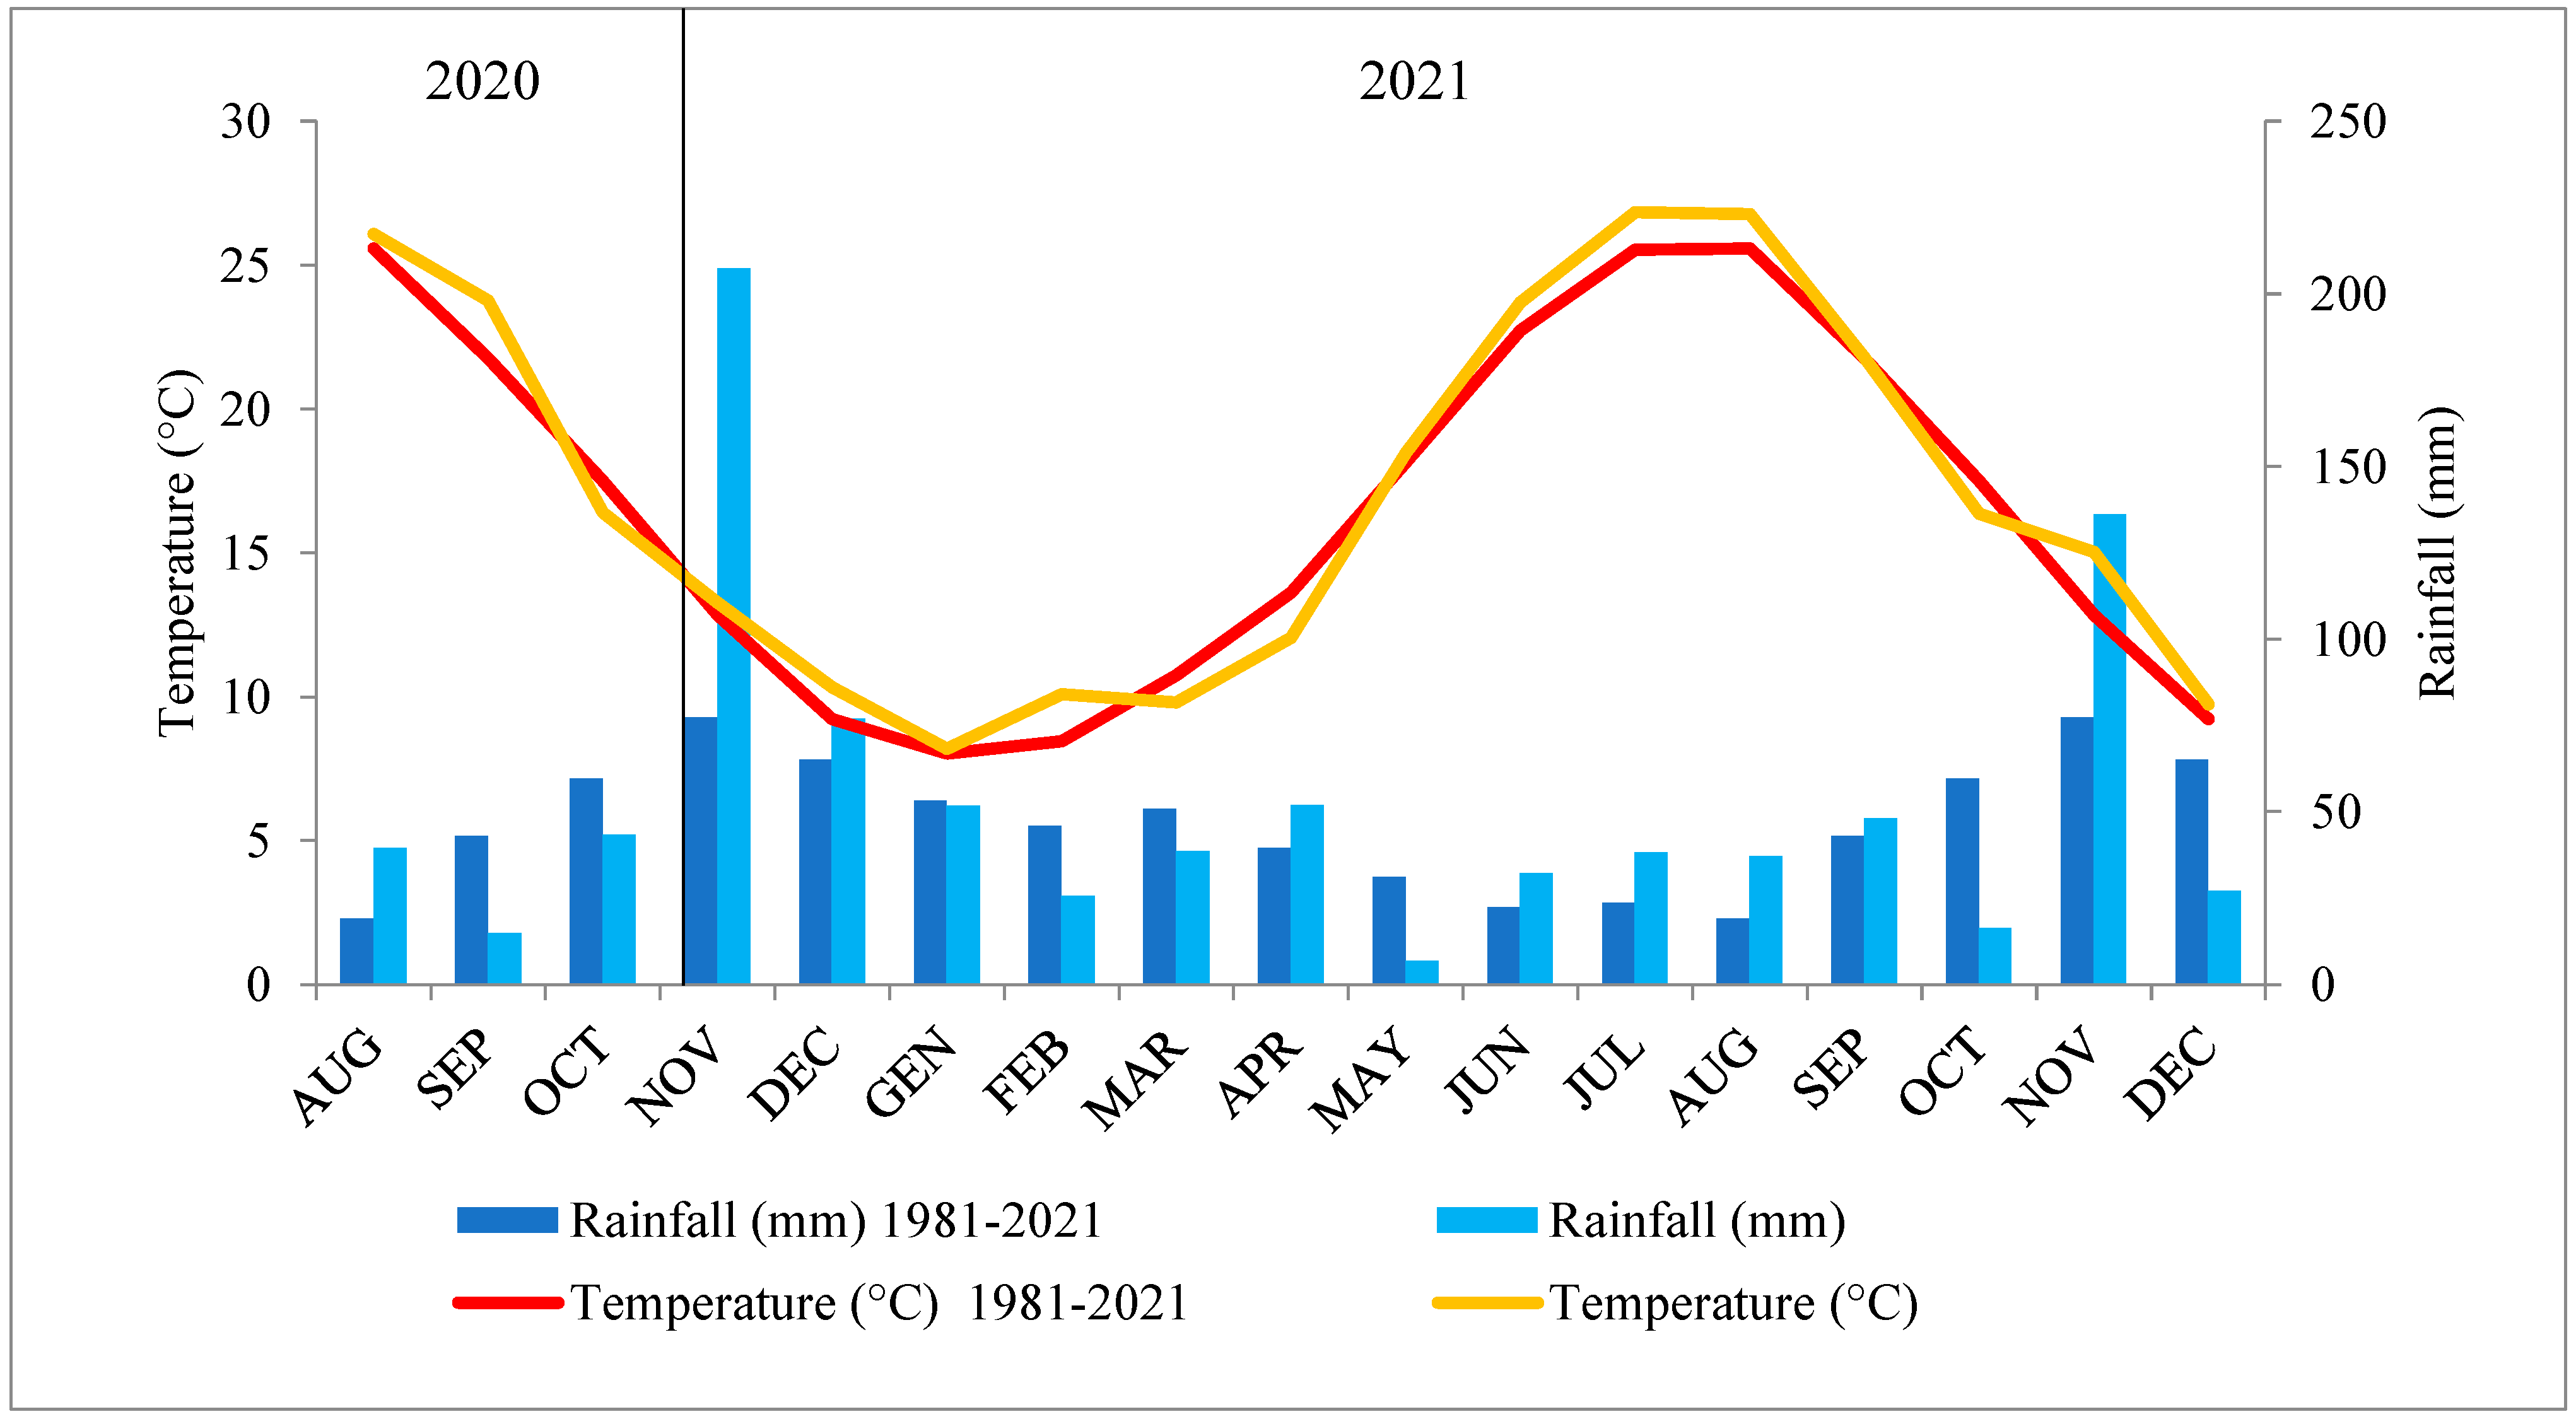
2.2. Weather Information and Agronomic Determinations

The mean monthly temperatures and the rainfall for each cropping season were continuously monitored by collecting data from a nearby weather station and were compared with the long-term averages (40 years, from 1981 to 2021; Figure 1).
During the fennel growing periods (at about 30, 60, and 75 days after transplanting) the aboveground biomass and roots dry weights (g) were determined from five randomly selected plants in each plot. Aboveground biomass (Mg ha−1), root biomass (Mg ha−1), marketable yield (Mg ha−1), root aboveground biomass, root dry matter (%), and fennel head weight (g) were also determined at commercial maturity. Crop products and residues were dried at 70 °C until a constant weight was achieved, to obtain the dry matter [25]. The residues and the fennels head were analyzed to determine their Total N and Total Organic Carbon (TOC) contents. The N (%) was determined by the Kjeldahl method [26], and TOC (%) content by using the Springer–Klee method [27].

2.3. Sustainability Assessment

To assess the environmental sustainability of the different fertilization treatments— from transplanting to harvest—the annual mean values of greenhouse gas emissions (GHG) due to input use and soil management were estimated and expressed in CO2 equivalents. The GHG emissions during the cultivation process were estimated by multiplying the input data (e.g., fertilizers, fuels, etc.) by the corresponding emission coefficient (EC) for agricultural inputs, as reported in Table 1. The emissions were divided by operations, and in particular: soil tillage, fertilizer applications, irrigation systems, irrigation, weeds control, and harvest.
The direct and indirect N2O and NOx emissions from N inputs (fertilizer application and biomass decomposition) were estimated and converted into CO2 equivalents with the IPCC methodology [28] by considering the coefficients listed in Table 1 and the following formulas [19,29]:
N2O-based CO2 eq. emissions = N2O direct + N2O indirect;
N2O direct = (N fertilizers + N biomasses) × EF × 44/28 (stoichiom. coefficient) × 298;
N2O indirect = {(N fertilizers + N biomasses) × FRACLeach × EFLeach + (N fertilizers × FRACgas × EFvolat)} × (44/28) × 298;
where
EF = emission factor (kg N2O-N kg−1 N),
FRACLeach = leaching factor of N (%),
EFLeach = leaching emission factor (kg N2O-N kg−1 N),
FRACgas = volatilization of NH3 and NOx (%),
EFvolat = volatilization emission factor (kg N2O-N kg−1 N).
The N of the biomass residues, which were reintroduced in the soil, was calculated by multiplying the residues’ dry matter by their N content. The CH4 emissions were not calculated in this study because they may be considered irrelevant in our field trial conditions, as also indicated in comparable experiments [18,30].
Table 1. Greenhouse gases emission coefficients (EC) of farm facilities and direct emissions estimation formulas for fennel production.
Inputs UnitECReferences
Fuels
Diesel emission fuel production kg CO2 eq. 0.55[31]
Diesel emission fuel combustion kg CO2 eq.3.16[31]
Fertilizers
UREA (N)kg CO2 eq.1.9[32]
Phosphate (P2O5)kg CO2 eq.1.4[32]
Industrial organic waste compostkg CO2 eq.0.046–0.94 (0.078)[32,33,34]
Plastic pipes 2.2[35]
Emission factor (EF)kg N2O-N kg−1 N0.005[28]
Leaching factor of N (FRACLeach)%0.24[28]
Volatilization of NH3 and NOx (FRACgas)%0.21[28]
Leaching emission factor (EFLeach)kg N2O-N kg−1 N0.011[28]
Volatilization emission factor (EFvolat)kg N2O-N kg−1 N0.005[28]
All the GHG emissions estimated in the systems and expressed as CO2 eq. ha−1 year−1 were converted into C equivalents (kg C eq. ha−1 year−1), as reported in many studies [19,22,36], as follows:
C loss/input = (GHG emissions in CO2 eq. during the process + N2O based CO2 eq. emissions) × 12/44 (stoichiometric coefficients from CO2 to C).
Thus, the CO2 emissions in the atmosphere were converted into carbon loss by the systems, which negatively affected the systems, and therefore they are reported with a negative sign (−C)
Moreover, the carbon stocks/output generated in the systems were determined as:
C stocks/output = C yield + C residues + C fertilizers
where:
C yield: obtained by multiplying the yield dry matter by the head C content;
C residues: obtained by multiplying the residues’ dry matter by the residues’ C content;
C fertilizers: obtained by multiplying the fertilizers’ dry matter by the C content.
Thus, the C stocks/output are represented, even if, in some cases, the temporary stocks of atmospheric CO2 are in organic C, and therefore are reported with a positive sign (+), as reported by Pratibha et al. and Lal [19,22], which are the first and most important basic papers on this matter.
Finally, considering both the C loss/input and C stocks/output, the system carbon difference (kg C eq. ha−1 year−1) and C efficiency indexes were calculated as:
system carbon difference (SCD) = C stocks /output (kg C eq. ha−1 year−1) − C loss (kg C eq. ha−1 year−1),
C efficiency (CE) = C stocks /output (kg C eq. ha−1 year−1)/C loss (kg C eq. ha−1 year−1).

2.4. Statistical Analysis

To analyze the effects of the different fertilization strategies, a parametric analysis of Variance (ANOVA) was performed. The statistical analysis was carried out by using SPSS for Windows, Version 16.0, and the analysis of variance was carried out considering the years and the fertilization treatment as variability factors. The interactions between these two factors were significant (p > 0.05) for many of the parameters investigated, and the data are then shown following the difference between all the combinations among the variability factors. The Duncan Multiple Range Test (DMRT) was used for mean comparisons (p ≤ 0.05).

2.5. Fertilization Cost Analysis

To perform the cost analysis of the compared fertilization strategies, the machines’ ownership and operating costs were evaluated according to Assirelli and Pignedoli [37] and ASAE [38]. The analysis was based on the market values of the machines, standard values reported in the proposed methodology [37], such as machine service life and resale value, and data received from the manager of the experimental farm, such as annual use of machines, workers salary, fuel and lubricant costs (Table 2).
Average data collected during fertilizers (basal and topdressing) spreading, like fuel consumption and working capacity, were used to allow the calculation of operating hourly costs (Table 3). The cost per hectare was thus calculated considering the hourly costs, the working capacity, and the fertilization costs as follows:
hourly costs (€ h−1)/working capacity (ha h−1) + fertilization cost (€ ha−1)
Moreover, the market value of the fertilizers was considered as MC1: 80 € t−1; MC2: assumed 10% higher than MC1; 18-46: 1200 € t−1; Urea: 800 € t−1.

3. Results

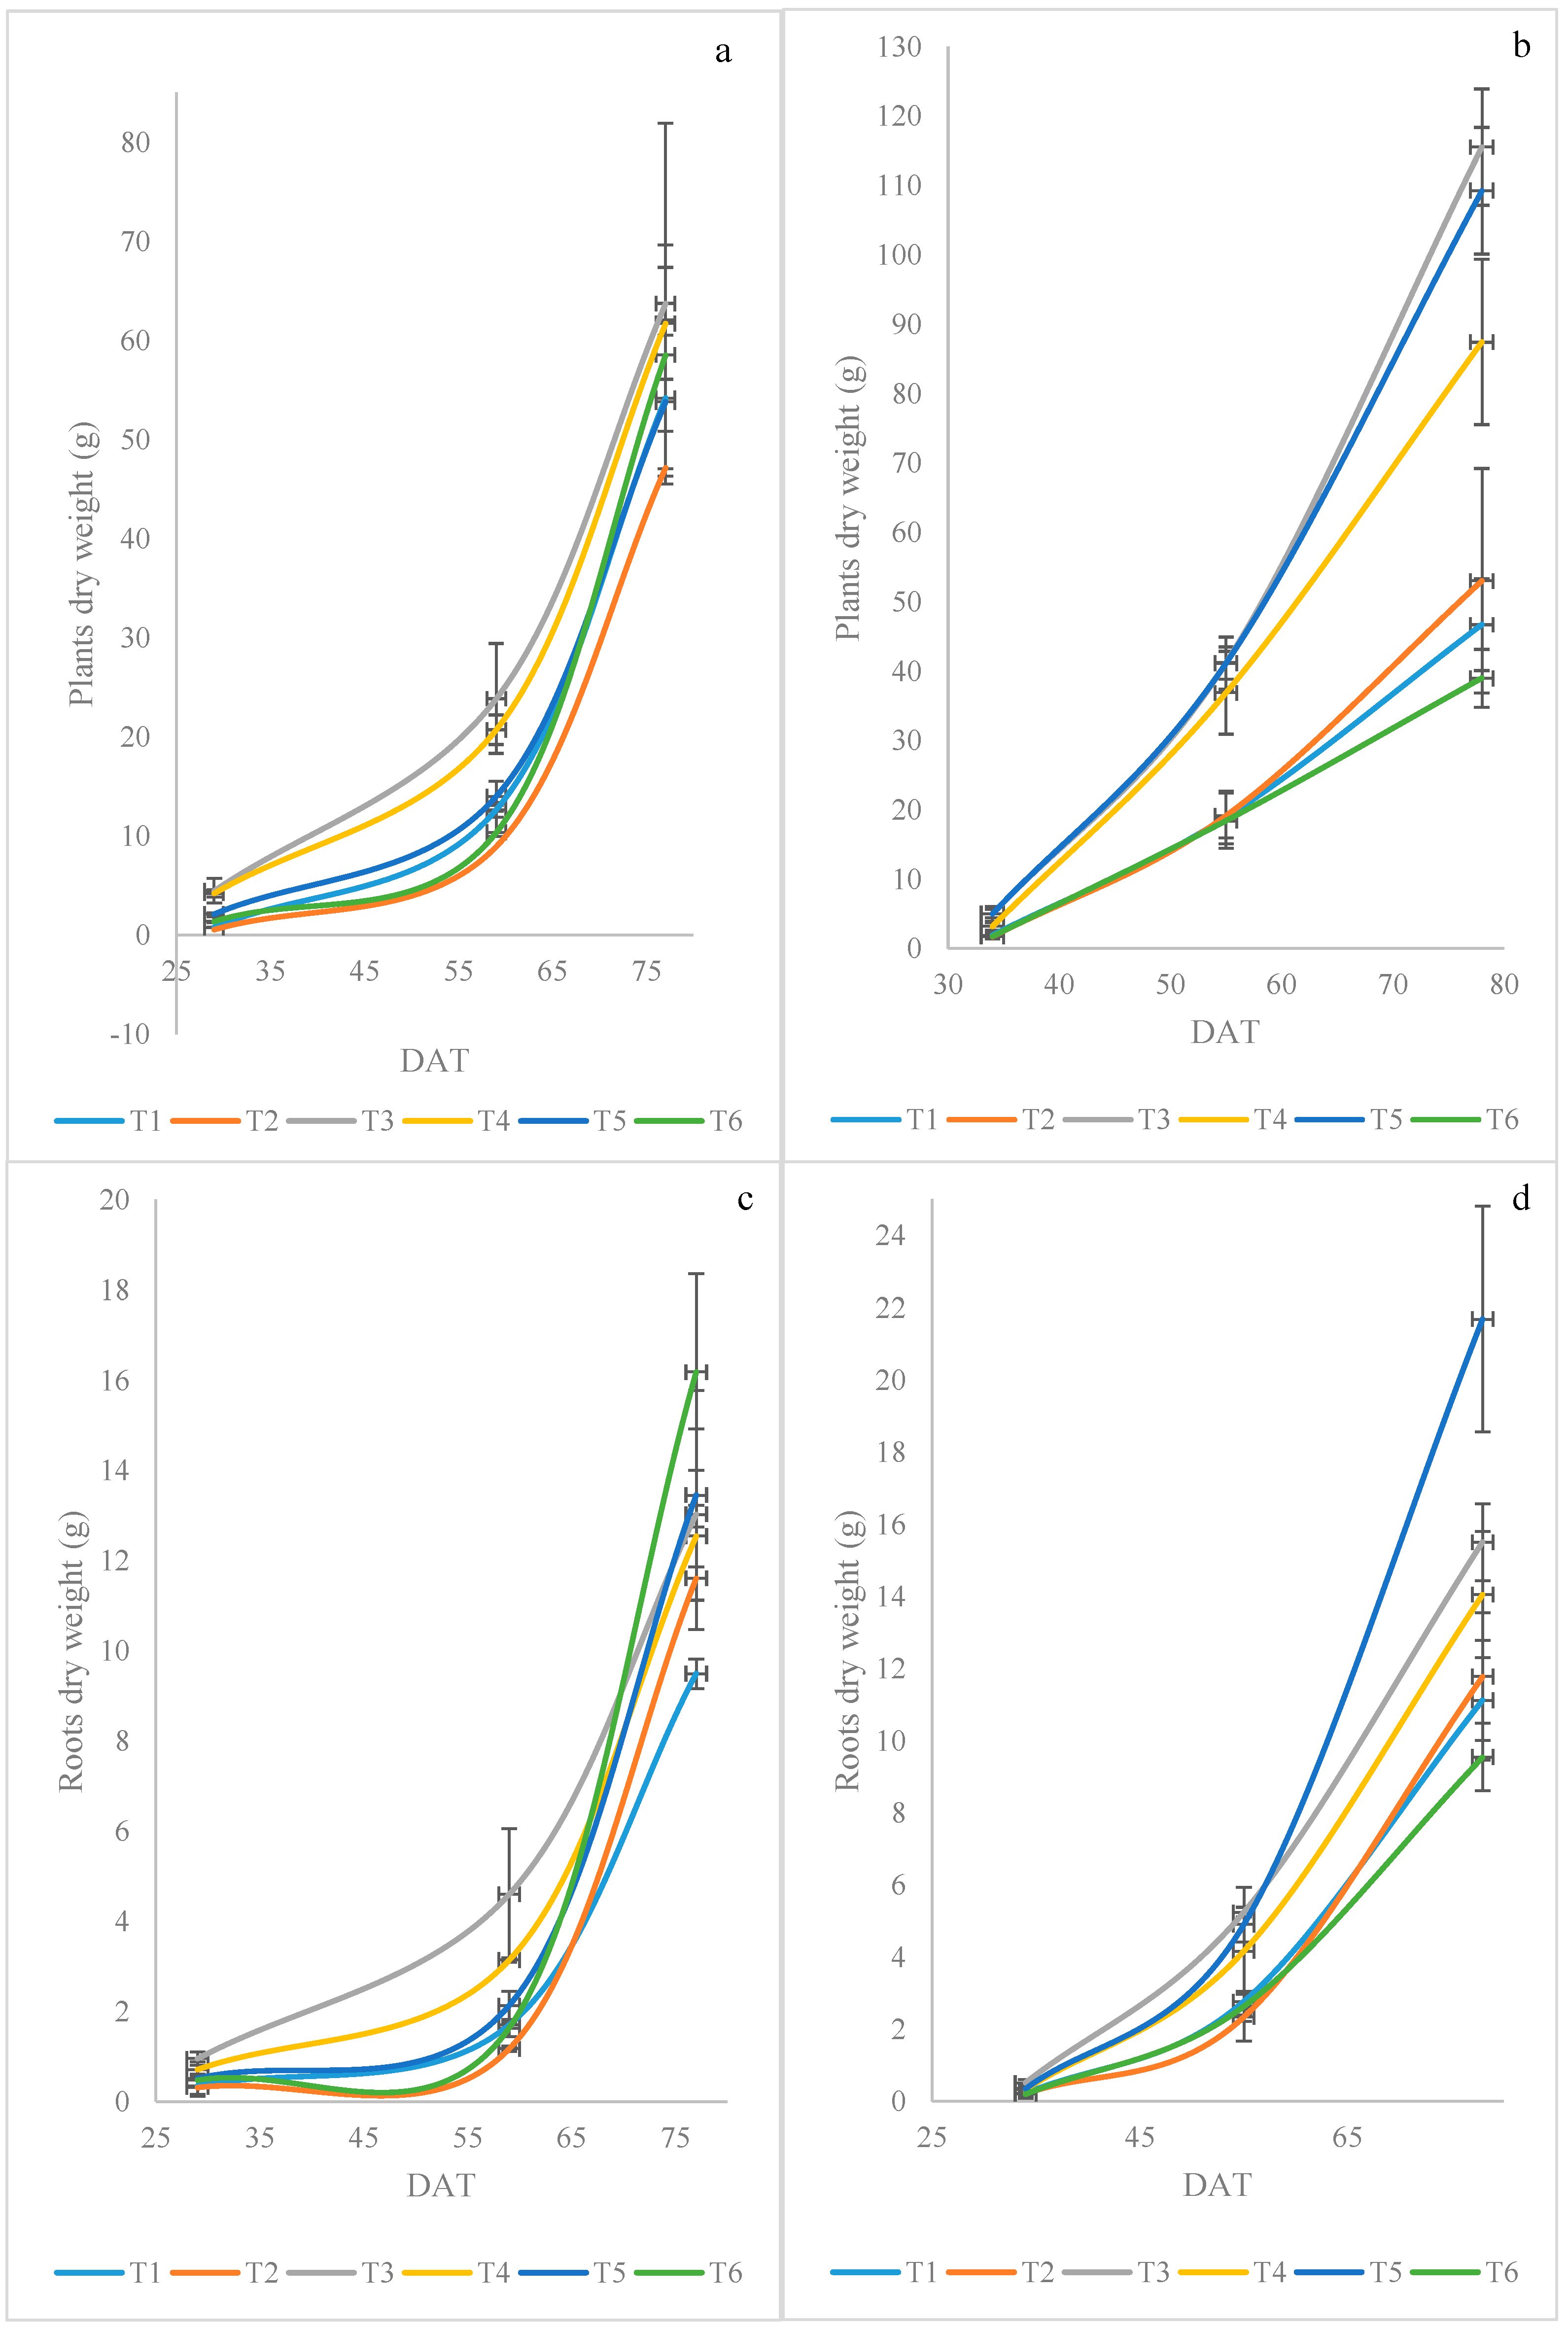
3.1. Weather Conditions and Agronomic Performances

The total amounts of rainfall from August to December were 382 and 265 mm in 2020 and 2021, respectively, compared to 264 mm in the long term. The differences observed during the first season were generated by an extreme rainfall event that occurred in November with 207 mm, compared to 77 mm of the long-term average. However, this event did not impact the crop production, being occurred just after the fennel harvest. The mean temperature of the season was 18 °C in both years, and this value was comparable with the long-term average (17 °C).
Figure 2 reports plant dry weight (Figure 2a,b) and root dry weight (Figure 2c,d) by different fertilization treatments at stages I, II, and III after transplanting (i.e., at about 30, 60, and 75 DAT) for both seasons. During the first season, T3 and T4 treatments reached the highest plant dry weight (Figure 2a), and T2 showed the lowest values during all the growing stages of fennel. During the second season, this parameter was notably higher than the first one at all the growing stages (Figure 2b), showing values higher by +39, +94, and +33% in the first, second, and third stages, respectively, on average of all the treatments. Among the treatments, T3, T4, and T5 reached the highest plant dry weight values, while T6, T1, and T2 showed the lowest one, during all the fennel growth periods. In particular, T6 showed a reduction of −55 and −66% compared to T3, in the second and third growth stages, respectively.
During the first season, the root dry weight of T3 showed the highest value, followed by T4 and T5 in the first and second stages, while in the third stage, the values were comparable in all the treatments, even if T6 had the highest absolute value (Figure 2c). In the second season, the root dry weight reached high values in T5, T3, and T4 in all the stages, with values comparable among these three treatments (Figure 2d), whereas T2, T6, and T1 had statistically lower values than the other treatments.
In Table 4, the treatment effect on fennel aboveground and belowground biomass, marketable yield, and head weight at commercial maturity are reported. In 2020, the highest absolute values of aboveground biomass were found in T3 and T4, but these differences do not statistically differ compared to the other thesis, except for T2. No differences were found in the root biomass except for T1, which showed a significantly lower value. The marketable yield of the T4 reached the highest absolute value, while T2 registered the lowest one. Finally, T3, T4, and T5 treatments showed the highest fennel head weights, which were significantly higher than in T1, T2, and T6.
During 2021, the biomasses were, on average, comparable to those of the first season. Among the different treatments, T2, T3, and T5 had the highest values. The highest root biomass was found in the mineral fertilizer treatment (T5) and in T3 and T4 among organic fertilizers. On the whole average, the marketable yields were comparable to the first season, whereas T3 and T4 showed the best results. Finally, T1 and T6 had the lowest values (similarly as for fennel head weights), which were lower by −31.47 and −23.25% in comparison with T3. This last treatment showed, along with T5, the highest fennel head weights.
Table 5 reports the main C and N contents in the residues and heads of the fennel crop. During 2020, the N content in the residues was statistically higher for T3, T4, and T5 than in the other treatments, whereas no significant differences were detected in 2021. The TOC content, similarly to the N one, showed higher values in T3, T4, and T5 than T1, T2, and T6 during 2020, whereas in 2021, the values were, on the whole, higher than in the previous season and the differences among the treatments were smaller. However, T5 registered the highest TOC content, while the lowest value was found in T6.
In the fennel heads, the N content was notably higher in 2020 than in 2021. Among the treatments, during the first season, T5 registered the highest value as compared to T1. The T2 had the highest N content in 2021, with the average of the other treatments showing a reduction of −34.33% compared to T2. Furthermore, during the first season, T2 showed the highest TOC value, being comparable to T1, while T3 registered the lowest one. In the second season, the values were on average higher than the previous season; T5 showing the highest value while T4 the lowest one.

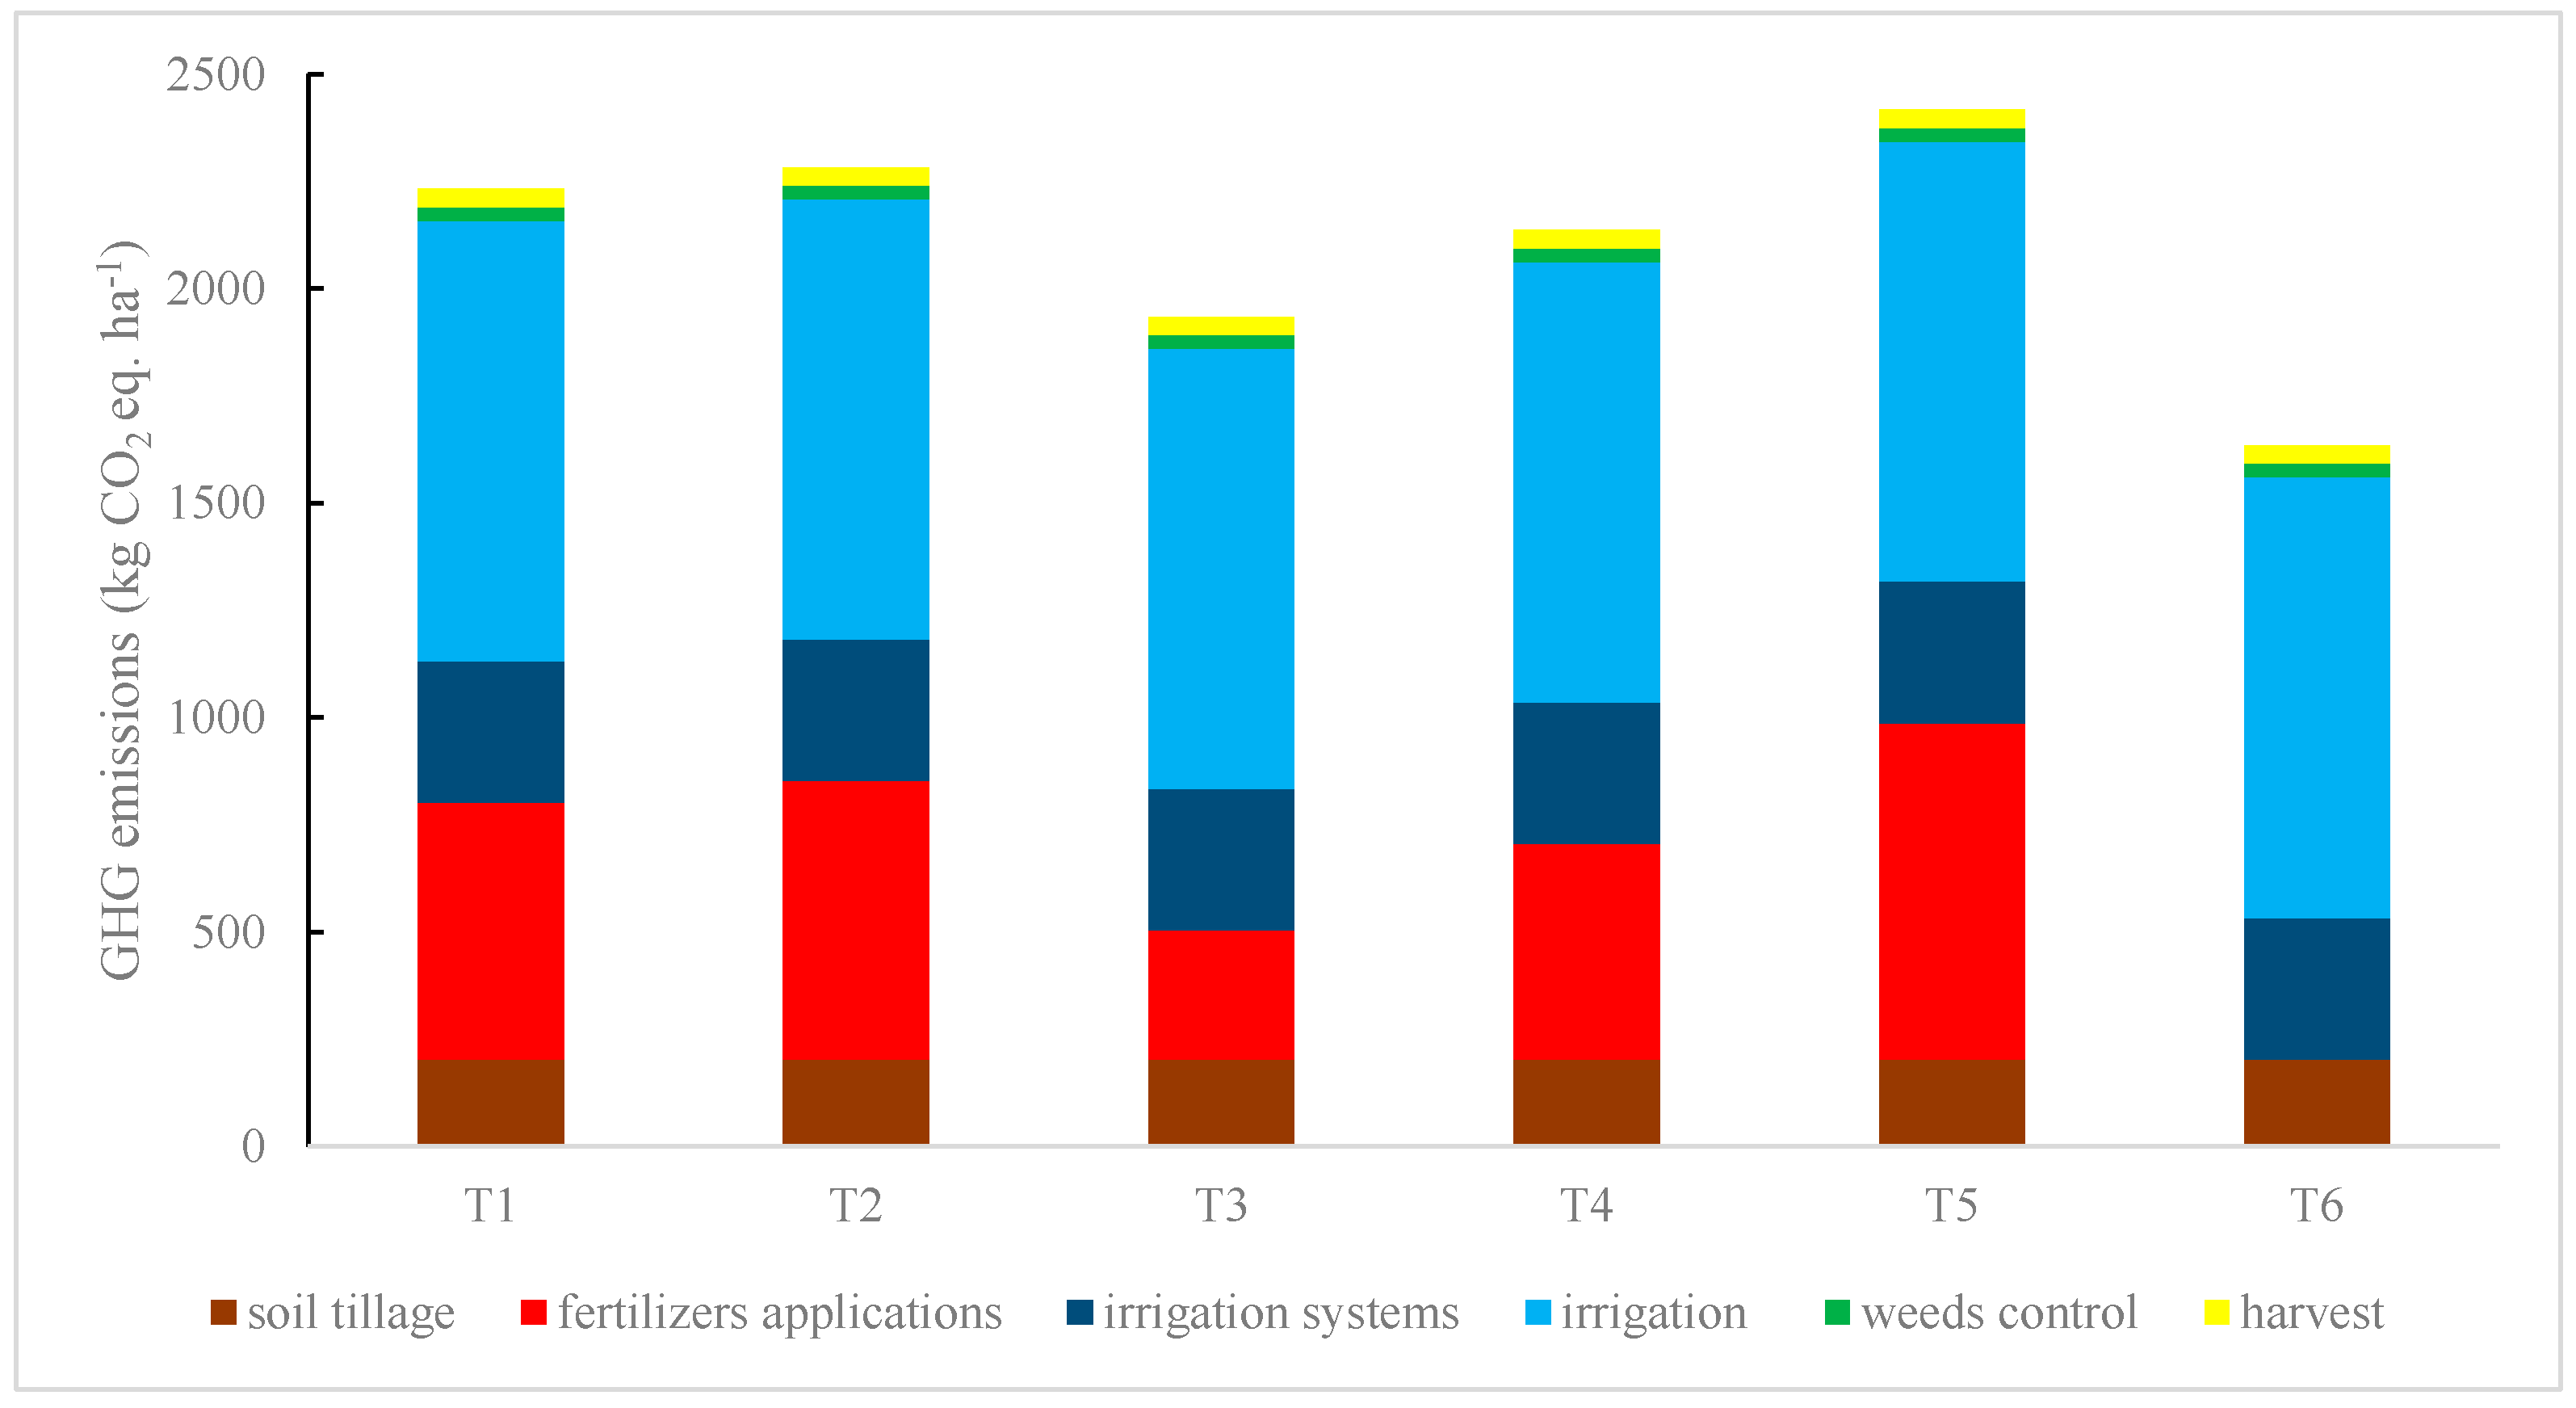
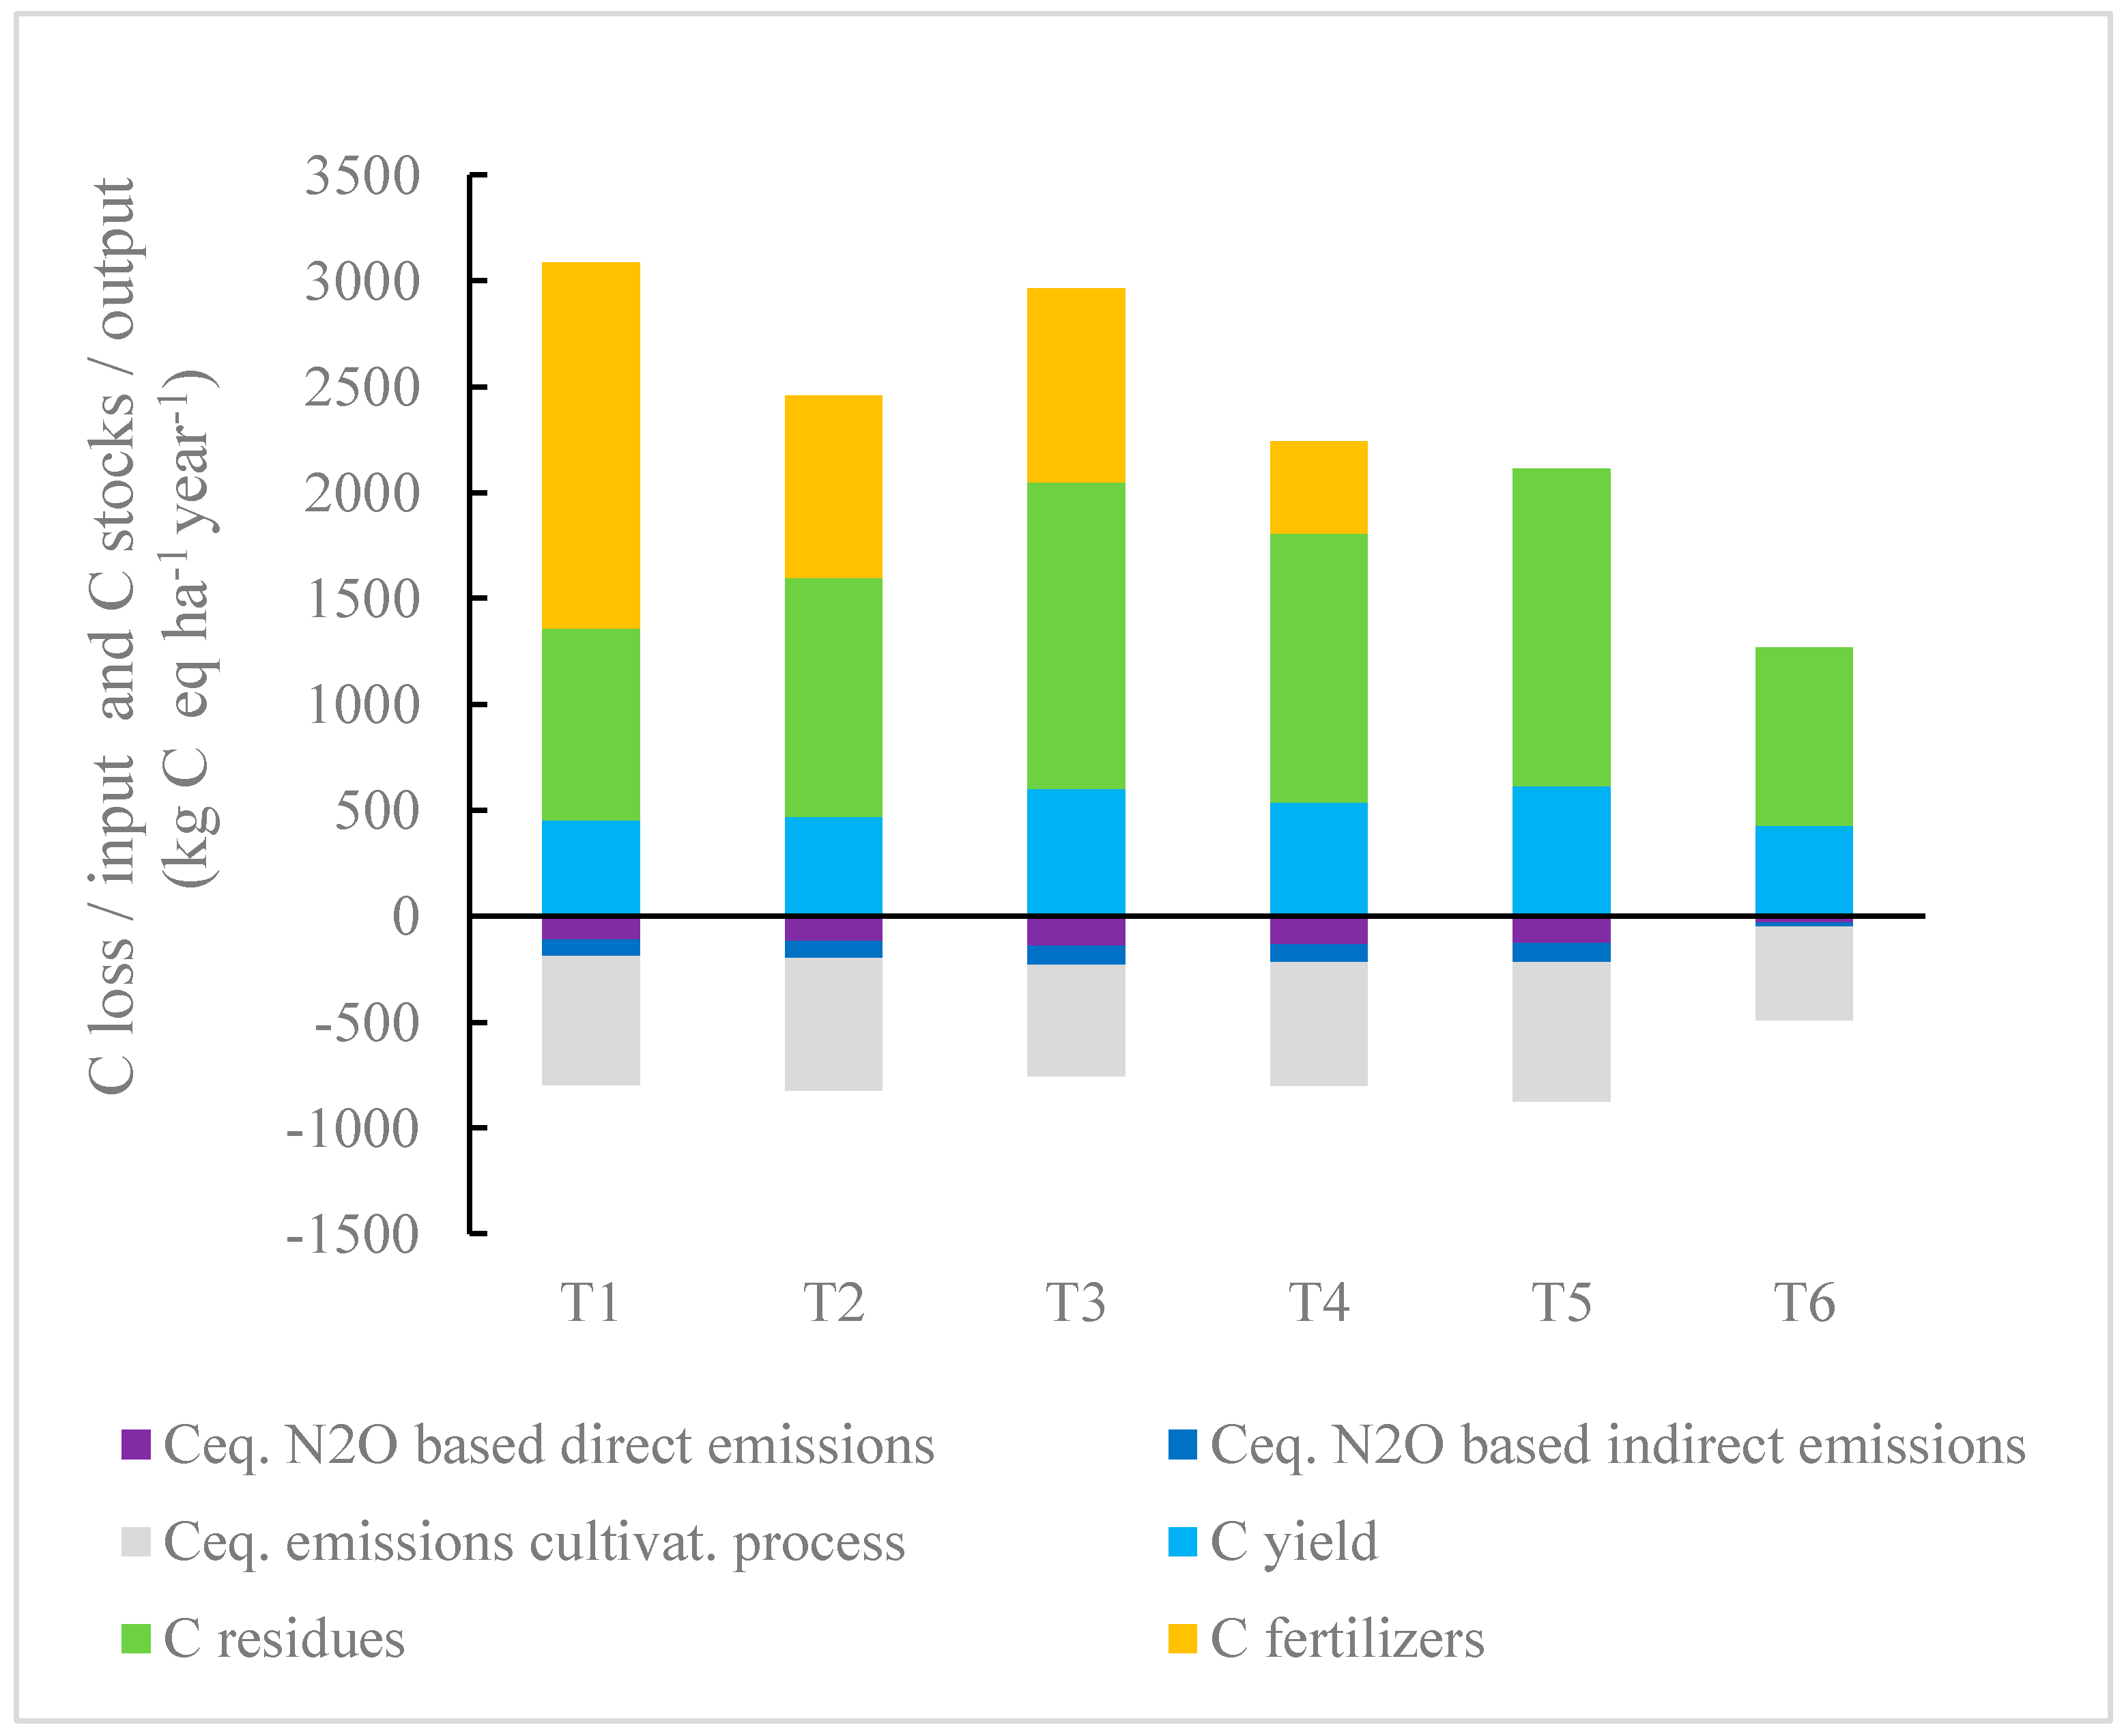
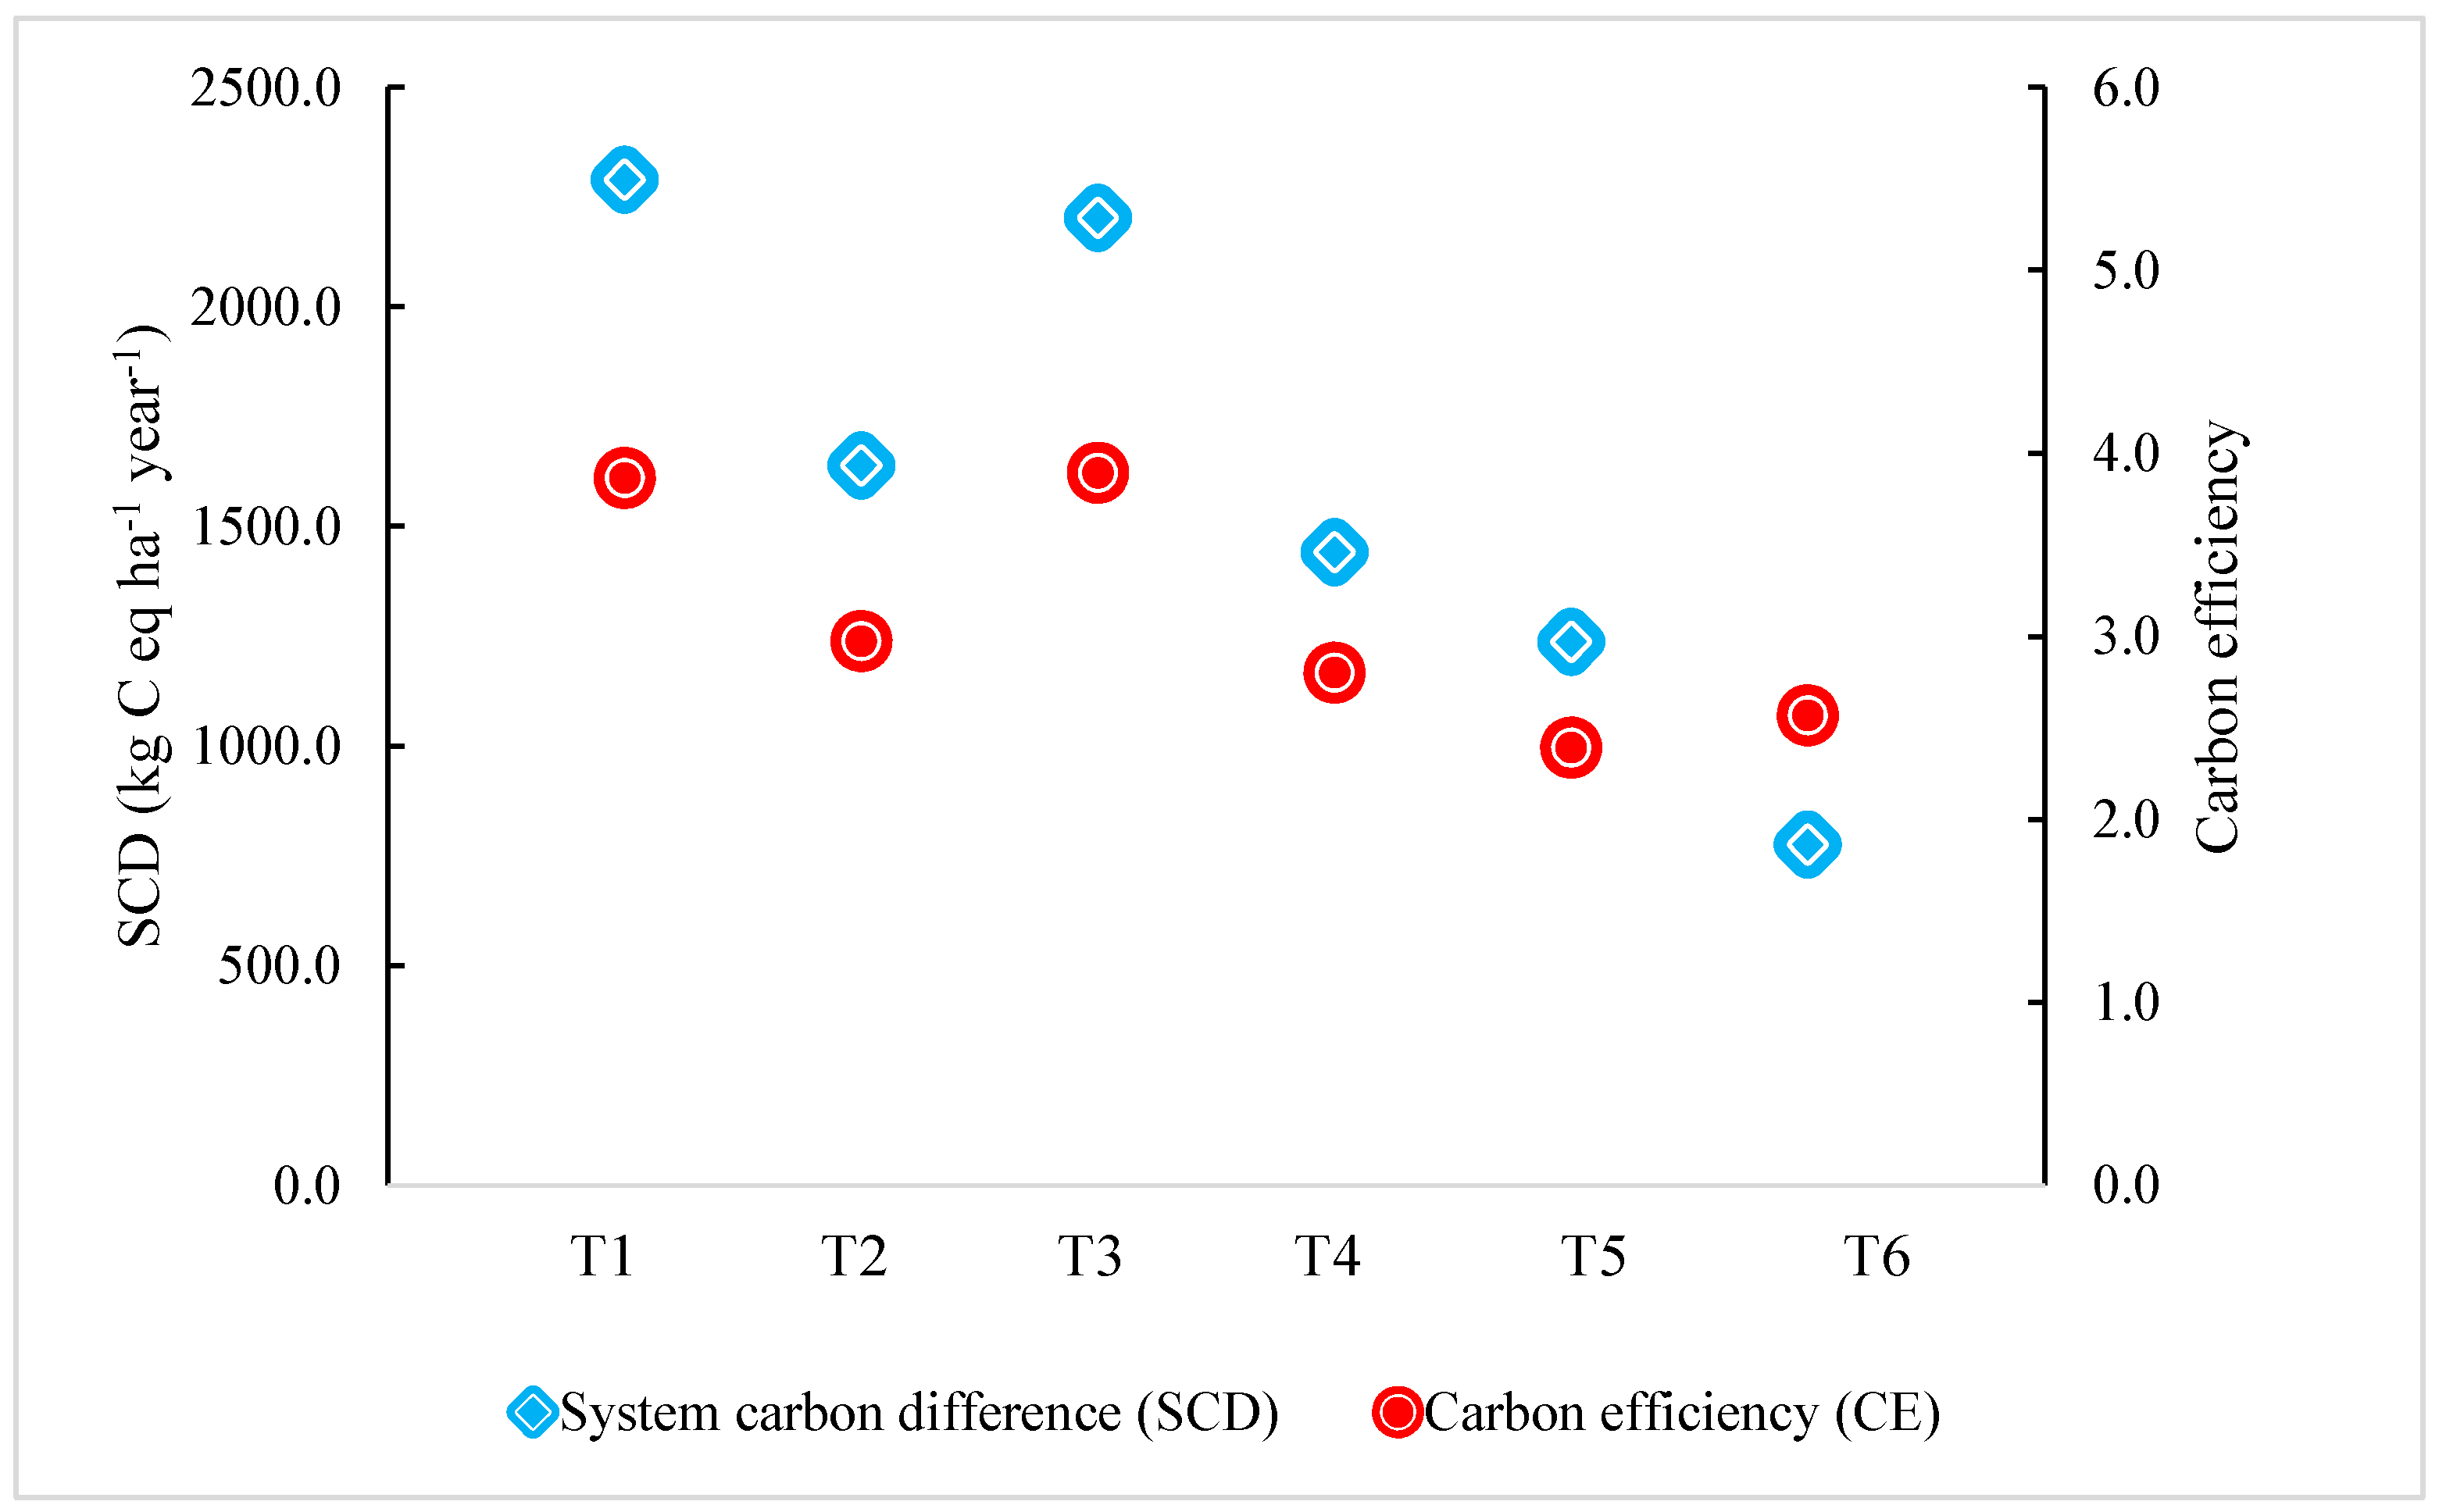
3.2. Sustainability Assessment
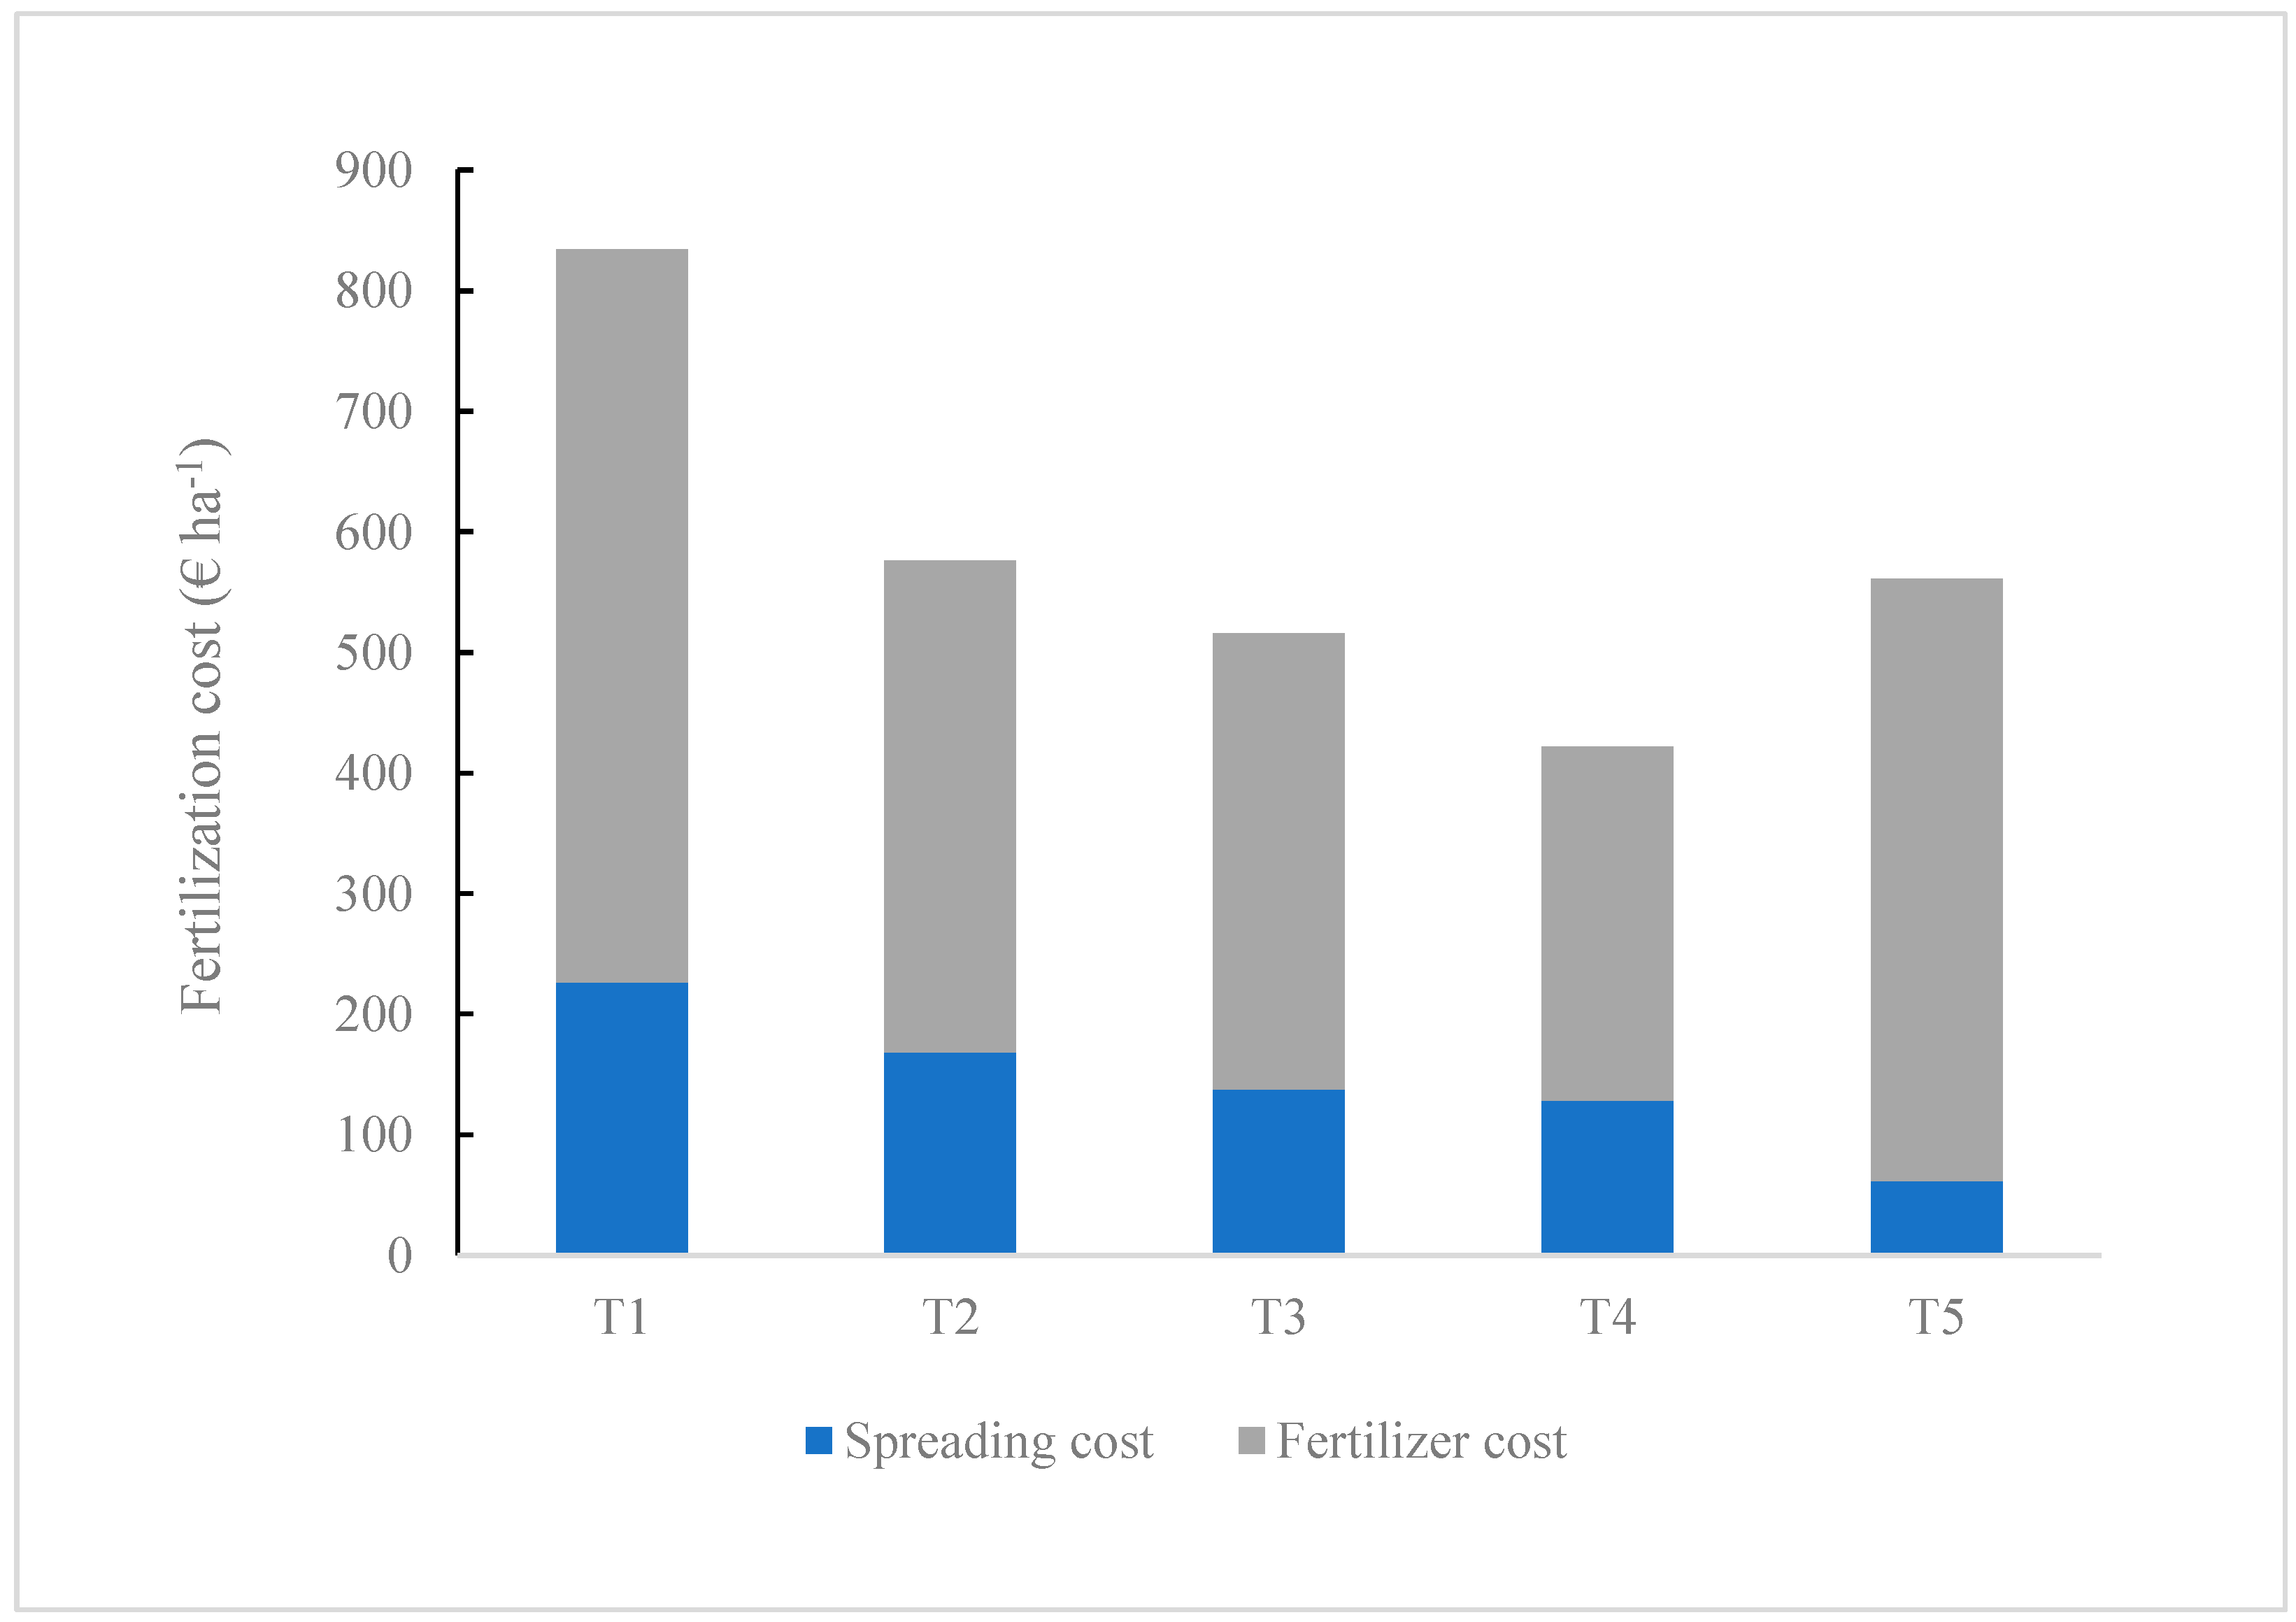
The emissions analysis for the fennel cultivation process revealed that T6 emitted less than the other treatments by 26.80, 28.41, 15.54, 23.51, and 32.41% of CO2 eq. inputs per hectare compared to T1, T2, T3, T4, and T5, respectively (Figure 3). Considering the average of all treatments, the highest emissions were attributed to irrigation (49%), followed by fertilizer application (22%), irrigation systems (16%), and soil tillage (10%) operations. However, the process was the same in all the systems except for fertilizer application, that is, the “variability operation” among different treatments. The highest GHG emission value was found in T5 followed by T2 and T1, which had values of −17.23 and −23.64%, respectively, as compared to T5.
The GWP emissions, related to N2O due to the fertilizer applications and residues decomposition (Table 6), showed the highest value in T3 followed by T4 and T5 (−6.07 and 6.34%, respectively, compared to T3). Moreover, the lowest emissions were found in T6, being −79.82% lower than T3.
The carbon losses are derived by the sum of the CO2 emitted in the cultivation processes and the CO2 eq. related to the N2O emissions were on average higher in T5, followed by T2 and T4 (Figure 4). Conversely, the carbon stocks/output (sum of the carbon in the products, residues, and fertilizers) showed an increase of +4, +25, and +38% in T1 as compared to T3, T2, and T4, respectively, while the lowest stock/output was found in T6. The T1 and T3 treatments reached the best SCD values and were also the most efficient systems (Figure 5), whereas the lowest values of both SCD and efficiency were found in T5 and T6.

3.3. Cost Analysis

The total cost of fertilization (fertilizer + distribution) ranged from about 420 € ha−1 (in T4) to 830 € ha−1 (in T1) (Figure 6). The highest fertilization cost is achieved in T1, being 60% higher than the average of the other treatments. However, by reducing MC1 to 50% (T2), the fertilization cost was very similar to that of mineral fertilization (T5). By contrast, lower costs were achieved for MC2 both in T3 and T4 treatments.
On average, the cost of the fertilizer accounted for 75% of the total fertilization cost, whereas in the case of mineral fertilization (T5), it reached about 90% of the total cost. The T1 showed the highest cost of the fertilizer (about 600 euro ha−1) as well as the highest cost for distribution, followed by the cost of the mineral fertilizer (T5), which, however, had the lowest distribution cost. The T4 treatment had the lowest total cost, having a distribution cost higher than T5.

4. Discussion

The crop growing parameters (plants and roots dry weights) of fennels crop were, overall, similar in T3, T4, and T5 and higher than T1, T2, and T6, indicating that the kind of fertilizer could be crucial for fennel plant growth. In fact, MC2 showed results comparable to mineral fertilization (T5) irrespective of the amount applied (50–100%). The observed differences among the fertilized treatments may possibly be due to both the different and higher values of the C/N ratio in MC1 treatments (T1 and T2). This behavior may lead to a slower mineralization rate and N availability for fennels, as reported in other studies, particularly in our pedoclimatic conditions and in the short term [16,39]. Diacono and Montemurro [16] highlighted that in soils amended with compost, autochthonous microbiological activity can be stimulated and, therefore, a direct positive effect from microorganisms introduced with the compost is presumable. In our case, the MC2 compost, which is enriched with selected microorganisms, could have further promoted soils microbial activities generating differences in soil nutrient availability.
At commercial maturity, the marketable yield parameter and the aboveground and root biomasses confirmed the trend observed during the plants’ growing stages. Both in the first and the second year, the yield of the not fertilized control (T6) statistically equaled the yields of the MC1 treatments (T1 and T2). However, as reported in other studies [36,40], the yield response to compost applications usually increases in the medium or long-term application periods. There is a need to synchronize crop N demand and N supply and/or compost N mineralization (and nutrient availability) to increase N efficiency [41], and this issue occurred mainly in the T3 treatment. This was likely due to the low C/N in MC2, which prevented competition phenomena between plant roots and soil microorganisms for N, thus leading to a value statistically comparable to that of mineral fertilization (T5). This result would confirm the hypothesis that the use of compost, if well managed, can successfully replace mineral fertilization, generally maintaining high and comparable productions [42,43].
The total N content in the fennel residues confirmed the biomass and yield trends. In particular, during the first season, T1 and T2 and the control registered similar values, which were statistically lower than T3, T4, and T5 treatments due to their best nutrient availability. Conversely, the differences were not statistically relevant during the second season. Similar trends were also observed in the C content of residues, even if these differences probably may be generated by the slight change in the plant maturity status at the harvest stage. Armstrong et al. [44] and Patton and Gieseker [45] found that there is an increase of lignin and cellulose complexes in the advanced stages of the cropping cycle, inducing a different net N mineral release [46]. Since in T3, T4, and T5 treatments, the plant cycles were slightly anticipated, our results confirm these findings, and consequently, the composition of C compounds probably differed, with an increase of lignin and cellulose complexes. In the second season, the compost treatments differed from the mineral ones, which showed the highest C content both in residues and heads, despite a lower C stock being found in T5. Again, the composition and slow release of nutrients in T2 induced the highest head N content values in 2021, which was higher also than T5.
The emissions analysis related to the cultivation process revealed that the emissions were higher in T5, followed by T2 and T1 treatments. The observed differences during the fennel cultivation were generated by the different fertilization strategy being one of the most environmentally impactful operations, as reported by other authors [22,36]. In our study, the differences were determined by the higher emissions associated with the conventional mineral fertilizers than the organic ones, even though the distribution impact of the organic fertilizers should be considered higher, because of high doses per unit area. In fact, at the same N distribution rate, the lower the N content (%) and the higher the amount of fertilizer to distribute. However, it is important to consider that in T1 and T3, all the amounts of fertilizers were distributed at one time, about one month before transplanting, while in T2, T4, and T5, the fertilizers were split into two operations. The possibility of making the field operation just once and avoiding top dressing can be crucial for farmers, especially in winter vegetable crops, when field practicability is often limited by waterlogging [18]. In fact, as reported in Figure 1, an extreme rainfall event occurred in November 2020, but without impact, since fennel was harvested just before this extreme event.
The emission coefficients (EC) associated with fertilizers show a huge variability in those used for industrial composting impact estimation, as reported by Walling et al. [32]. This is due to the variable composition of the wastes used and to different composting process technologies. Additional assessment studies are thus required, involving different organic wastes and composting procedures to step up the knowledge of environmental impacts and the long-term advantages of this practice [47]. In any case, it is important to point out that waste valorization through composting, even if generating emissions, avoids the worst impact due to other waste management solutions, such as incineration for energy production [47] or landfilling [32].
The in-field emissions of GHGs are mainly related to microbial processes of (de)nitrification that emits N2O, and these processes are influenced by many factors, including temperature, soil typology, and the availability of N [48,49]. Although these processes naturally occur, the addition of N to soil leads to considerable changes in emissions (amount of GHG/unit) that should be estimated through the EC [28]. The emissions generated after applying fertilizers and derived by the N content in the residues plowed into the soil were directly proportional to the residue amount and N content (except for the not fertilized control). According to Cayuela [50], the same EC was used in the fertilized treatments, and the amount of N was equal in all the treatments. Unfortunately, the EC can be a limiting factor to the accuracy of sustainability assessments, being one of the major sources of variability [51].
The C stocks/output were proportional to the biomass productions (yield and residues) and to the fertilizer typology. The T1 showed the highest total stocks due to the large amount of organic fertilizer, while the T6, which was not fertilized and produced low biomasses, showed the lowest C stocks/output.
The T1 and T3 treatments had the highest SCD and were also the most carbon-efficient systems, because of the highest carbon stocks/output. These outcomes are in agreement with other studies conducted in similar pedoclimatic conditions [18,52], confirming the key role of organic fertilization strategies to enhance the environmental sustainability of the agroecosystems owed to the organic matter management and preservation and to sustain crop production [53]. However, as mentioned above, additional assessment studies are required since there is a large variability in the coefficient used for industrial composting impact estimation.
The total cost of fertilization (fertilizer + distribution) ranged from about 420 to 830 EUR ha−1 (in T4 and T1, respectively), which are values in line with the economic analysis performed by Morra et al. [54] in a compost-based fertilization scenario. The T1 treatment showed fertilization costs about 60% higher than the average of the other treatments. This result was mainly due to a higher amount of fertilizer distributed (from 1.7 to 23 times higher with respect to T3 and T5, respectively), which caused raising both the total cost of fertilizer applied and the cost of distribution. In general, the higher amount of fertilizer needed in the organic treatments, with respect to the mineral ones, increased both the total cost of the fertilizer distributed (up to exceeding the cost of the mineral fertilization in T1) and the cost of distribution. These findings confirmed the results highlighted by Loncaric et al. [55] and Zhai et al. [56].
It should be emphasized that in the organic treatments, the cost of distribution was, on average, 2.7 times higher than in the mineral ones. This behavior was due to the limited loading capacity of the fertilizer spreader, which was not specific for organic amendment, negatively affecting the working times and related costs.
The lowest costs have been achieved with MC2, which is also associated with the best agronomic performances. However, it is not yet a commercial product, and therefore, we estimated that its production cost would be about 10% higher than MC1.
Therefore, our results would confirm the hypothesis that the use of improved compost, if well managed, can replace mineral fertilization, maintaining high and comparable production with affordable costs.

5. Conclusions

The results of this study highlighted that the use of organic amendments is sustainable, from an environmental point of view, due to the high carbon sequestration potential and the possibility of recycling the organic matter while avoiding impacts related to mineral fertilizers. However, further studies are needed to better understand the impact of the industrial composting processes due to the high variability of the coefficient.
Different results have been achieved in terms of yields and costs between the two organic amendments due to their different characteristics (C/N ratio, microorganisms enrichment). In fact, nowadays, organic fertilizers and amendments may drastically differ among them, and a specific knowledge of their utilization (quantity, timing) is needed in order to maximize the results. Especially in short-term application periods (less than 5 years), it is important to understand how to use the organic inputs appropriately to substitute the mineral fertilization and avoid yield loss.
From an economic point of view, although organic matter cost is nowadays comparable or lower than that of mineral fertilizers, the spreading operation is still a negative factor for farmers due to the high quantity of materials to distribute requiring more labor time and specific mechanical tools.
In conclusion, the use of organic amendments, even if environmentally sustainable, is more complex than the use of mineral fertilizers, and further research is required to improve the knowledge about the intrinsic organic fertilizer properties, and the nutrition dynamics (synchronization of nutrient mineralization and release and plant uptake) in different agricultural systems (different soil and climate conditions). Furthermore, from the perspective of precision farming, we need to enhance knowledge about the utilization mode, including the use of densified amendments (pellets) that are more suitable for modern agricultural machinery.

Author Contributions

Conceptualization, M.D., A.P., V.A. and F.M.; methodology, A.P. and V.A.; data curation, A.P.; writing—original draft preparation, M.D., A.P. and V.A.; writing—review and editing, M.D., A.P., V.A., A.M. and F.M.; funding acquisition, M.D. and F.M. All authors have read and agreed to the published version of the manuscript.

Funding

This research has been supported by Tersan Puglia S.p.A., research project FERTORT “Fertilizzanti in rotazioni di lungo periodo”.

Institutional Review Board Statement

Not applicable.

Data Availability Statement

The data are not publicly available due to restrictions in the agreement with the funding private company.

Acknowledgments

The authors wish to acknowledge Angelo Fiore, Rosalba Scazzarriello, Marco Favale, and Angelo Raffaele Quaranta for their technical assistance and field management.

Conflicts of Interest

The authors declare no conflict of interest.

References

  1. Pörtner, H.-O.; Roberts, D.C.; Tignor, M.; Poloczanska, E.S.; Mintenbeck, K.; Alegría, A.; Craig, M.; Langsdorf, S.; Löschke, S.; Möller, V.; et al. Summary for Policymakers. In Climate Change 2022: Impacts, Adaptation, and Vulnerability. Contribution of Working Group II to the Sixth Assessment Report of the Intergovernmental Panel on Climate Change; Cambridge University Press: Cambridge, UK, 2022. [Google Scholar]
  2. Mondal, S. Impact of Climate Change on Soil Fertility. In Climate Change and the Microbiome: Sustenance of the Ecosphere; Springer: Berlin/Heidelberg, Germany, 2021; pp. 551–569. [Google Scholar]
  3. Tilman, D.; Balzer, C.; Hill, J.; Befort, B.L. Global food demand and the sustainable intensification of agriculture. Proc. Natl. Acad. Sci. USA 2011, 108, 20260–20264. [Google Scholar] [CrossRef] [PubMed]
  4. Kopittke, P.M.; Menzies, N.W.; Wang, P.; McKenna, B.A.; Lombi, E. Soil and the intensification of agriculture for global food security. Environ. Int. 2019, 132, 105078. [Google Scholar] [CrossRef] [PubMed]
  5. FAO. Strategy on Climate Change 2022–2031; FAO: Rome, Italy, 2022.
  6. Persiani, A.; Diacono, M.; Montemurro, F. Agroecological practices in organic fennel cultivation to improve environmental sustainability. Agroecol. Sustain. Food Syst. 2023, 47, 668–686. [Google Scholar] [CrossRef]
  7. Ferreira, C.S.; Seifollahi-Aghmiuni, S.; Destouni, G.; Ghajarnia, N.; Kalantari, Z. Soil degradation in the European Mediterranean region: Processes, status and consequences. Sci. Total Environ. 2022, 805, 150106. [Google Scholar] [CrossRef]
  8. González-Ubierna, S.; Jorge-Mardomingo, I.; Carrero-González, B.; de la Cruz, M.T.; Casermeiro, M.Á. Soil organic matter evolution after the application of high doses of organic amendments in a Mediterranean calcareous soil. J. Soils Sediments 2012, 12, 1257–1268. [Google Scholar] [CrossRef]
  9. Diacono, M.; Fiore, A.; Farina, R.; Canali, S.; Di Bene, C.; Testani, E.; Montemurro, F. Combined agro-ecological strategies for adaptation of organic horticultural systems to climate change in Mediterranean environment. Ital. J. Agron. 2016, 11, 85–91. [Google Scholar] [CrossRef]
  10. Scialabba, N.E.H.; Mller-Lindenlauf, M. Organic agriculture and climate change. Renew. Agric. Food Syst. 2010, 25, 158–169. [Google Scholar] [CrossRef]
  11. Diacono, M.; Persiani, A.; Testani, E.; Montemurro, F.; Ciaccia, C. Recycling Agricultural Wastes and By-products in Organic Farming: Biofertilizer Production, Yield Performance and Carbon Footprint Analysis. Sustainability 2019, 11, 3824. [Google Scholar] [CrossRef]
  12. Misslin, R.; Clivot, H.; Levavasseur, F.; Villerd, J.; Soulié, J.C.; Houot, S.; Therond, O. Integrated assessment and modeling of regional recycling of organic waste. J. Clean. Prod. 2022, 379, 134725. [Google Scholar] [CrossRef]
  13. Bulluck, L.R.; Brosius, M.; Evanylo, G.K.; Ristaino, J.B. Organic and synthetic fertility amendments influence soil microbial, physical and chemical properties on organic and conventional farms. Appl. Soil Ecol. 2002, 19, 147–160. [Google Scholar] [CrossRef]
  14. Luo, G.; Li, L.; Friman, V.P.; Guo, J.; Guo, S.; Shen, Q.; Ling, N. Organic amendments increase crop yields by improving microbe-mediated soil functioning of agroecosystems: A meta-analysis. Soil Biol. Biochem. 2018, 124, 105–115. [Google Scholar] [CrossRef]
  15. Navarro, A.S.; Romero, J.A.S.; Sanjuan, M.d.C.S.; Bernardeau, M.A.B.; Delgado Iniesta, M.J. Medium-term influence of organic fertilization on the quality and yield of a celery crop. Agronomy 2020, 10, 1418. [Google Scholar] [CrossRef]
  16. Diacono, M.; Montemurro, F. Long-term effects of organic amendments on soil fertility. A review. Agron. Sustain. Dev. 2010, 30, 401–422. [Google Scholar] [CrossRef]
  17. Vaneeckhaute, C.; Meers, E.; Michels, E.; Buysse, J.; Tack, F.M.G. Ecological and economic benefits of the application of bio-based mineral fertilizers in modern agriculture. Biomass Bioenergy 2013, 49, 239–248. [Google Scholar] [CrossRef]
  18. Persiani, A.; Diacono, M.; Monteforte, A.; Montemurro, F. Agronomic performance, energy analysis, and carbon balance comparing different fertilization strategies in horticulture under Mediterranean conditions. Environ. Sci. Pollut. Res. 2019, 26, 19250–19260. [Google Scholar] [CrossRef]
  19. Pratibha, G.; Srinivas, I.; Rao, K.V.; Raju, B.M.K.; Thyagaraj, C.R.; Korwar, G.R.; Venkateswarlu, B.; Shanker, A.K.; Choudhary, D.K.; Rao, K.S.; et al. Impact of conservation agriculture practices on energy use efficiency and global warming potential in rainfed pigeonpea–castor systems. Eur. J. Agron. 2015, 66, 30–40. [Google Scholar] [CrossRef]
  20. Yousefi, M.; Khoramivafa, M.; Damghani, A.M. Water footprint and carbon footprint of the energy consumption in sunflower agroecosystems. Environ. Sci. Pollut. Res. 2017, 24, 19827–19834. [Google Scholar] [CrossRef]
  21. Aguilera, E.; Guzmán, G.; Alonso, A. Greenhouse gas emissions from conventional and organic cropping systems in Spain. I. Herbaceous crops. Agron. Sustain. Dev. 2015, 35, 713–724. [Google Scholar] [CrossRef]
  22. Lal, R. Carbon emission from farm operations. Environ. Int. 2004, 30, 981–990. [Google Scholar] [CrossRef]
  23. UNESCO-FAO. Bioclimatic Map of the Mediterranean Zone; NS162/III, 22A; UNESCO: Paris, France; FAO: Rome, Italy, 1963; p. 60.
  24. Taxonomy, S. A Basic System of Soil Classification for Making and Interpreting Soil Surveys. Agric. Handb. 1999, 436, 96–105. [Google Scholar]
  25. Istituto Superiore di Sanità. Metodi di analisi utilizzati per il controllo chimico degli alimenti. Raccolta a cura di Massimo Baldini, Fabio Fabietti, Stefania Giammarioli, Roberta Onori, Leucio Orefice e Angelo Stacchini. Rapp. ISTISAN 1996, 96, 341996. (In Italian) [Google Scholar]
  26. Kjeldahl, J. New Method for the Determination of Nitrogen in Organic Matter. Z. Für Anal. Chem. 1883, 22, 366–382. [Google Scholar] [CrossRef]
  27. Springer, U.; Klee, J. Prüfung der Leistungsfähigkeit von einigen wichtigen verfahren zur bestimmung des kohlenstoffs mittels chrom-schwefelsaure sowie vorschlag einer neuen schnellmethode. J. Plant Nutr. Soil Sci. 1954, 64, 1–26. [Google Scholar]
  28. Intergovernmental Panel on Climate Change. 2019 Refinement to the 2006 IPCC Guidelines for National Greenhouse Gas Inventories; IPCC: Geneva, Switzerland, 2019.
  29. Persiani, A.; Diacono, M.; Montemurro, F. Soil hydraulic arrangement and agro-ecological practices in organic rotations: Effects on crop performance, soil properties and carbon balance. Agroecol. Sustain. Food Syst. 2022, 46, 1173–1197. [Google Scholar] [CrossRef]
  30. Guardia, G.; Aguilera, E.; Vallejo, A.; Sanz-Cobena, A.; Alonso-Ayuso, M.; Quemada, M. Effective climate change mitigation through cover cropping and integrated fertilization: A global warming potential assessment from a 10-year field experiment. J. Clean. Prod. 2019, 241, 118307. [Google Scholar] [CrossRef]
  31. Ecoinvent Version 3. 2013. Available online: http://www.ecoinvent.org/database/database.html (accessed on 31 January 2015).
  32. Walling, E.; Vaneeckhaute, C. Greenhouse gas emissions from inorganic and organic fertilizer production and use: A review of emission factors and their variability. J. Environ. Manag. 2020, 276, 111211. [Google Scholar] [CrossRef]
  33. Cadena, E.; Colón, J.; Artola, A.; Sánchez, A.; Font, X. Environmental impact of two aerobic composting technologies using life cycle assessment. Int. J. Life Cycle Assess. 2009, 14, 401–410. [Google Scholar] [CrossRef]
  34. Breitenbeck, G.A.; Schellinger, D. Calculating the reduction in material mass and volume during composting. Compost. Sci. Util. 2013, 12, 365–371. [Google Scholar] [CrossRef]
  35. Martinez-Mate, M.A.; Martin-Gorriz, B.; Martínez-Alvarez, V.; Soto-García, M.; Maestre-Valero, J.F. Hydroponic system and desalinated seawater as an alternative farm-productive proposal in water scarcity areas: Energy and greenhouse gas emissions analysis of lettuce production in southeast Spain. J. Clean. Prod. 2018, 172, 1298–1310. [Google Scholar] [CrossRef]
  36. Assirelli, A.; Pignedoli, S. Costo di esercizio delle macchine agricole. Cent. Rice Prod. Anim. 2005, 5, 1–10. (In Italian) [Google Scholar]
  37. American Society of Agricultural Engineers. Agricultural Machinery Management; ASAE: St. Joseph, MI, USA, 2000; pp. 344–349. [Google Scholar]
  38. Reimer, M.; Kopp, C.; Hartmann, T.; Zimmermann, H.; Ruser, R.; Schulz, R.; Müller, T.; Möller, K. Assessing long term effects of compost fertilization on soil fertility and nitrogen mineralization rate. J. Plant Nutr. Soil Sci. 2023, 186, 217–233. [Google Scholar] [CrossRef]
  39. Persiani, A.; Montemurro, F.; Fiore, A.; Scazzarriello, R.; Diacono, M. On-farm fertilizing materials in organic horticulture: Agronomic performance, energy use and GHG emission evaluation. Arch. Agron. Soil Sci. 2021, 67, 1944–1960. [Google Scholar] [CrossRef]
  40. Erhart, E.; Hartl, W.; Putz, B. Biowaste compost affects yield, nitrogen supply during the vegetation period and crop quality of agricultural crops. Eur. J. Agron. 2005, 23, 305–314. [Google Scholar] [CrossRef]
  41. Montemurro, F.; Diacono, M. Towards a Better Understanding of Agronomic Efficiency of Nitrogen: Assessment and Improvement Strategies. Agronomy 2016, 6, 31. [Google Scholar] [CrossRef]
  42. Altieri, R.; Esposito, A. Evaluation of the fertilizing effect of olive mill waste compost in short-term crops. Int. Biodeterior. Biodegrad. 2010, 64, 124–128. [Google Scholar] [CrossRef]
  43. Baldi, E.; Toselli, M.; Marcolini, G.; Quartieri, M.; Cirillo, E.; Innocenti, A.; Marangoni, B. Compost can successfully replace mineral fertilizers in the nutrient management of commercial peach orchard. Soil Use Manag. 2010, 26, 346–353. [Google Scholar] [CrossRef]
  44. Armstrong, D.G.; Cook, H.; Thomas, B. The lignin and cellulose contents of certain grassland species at different stages of growth. J. Agric. Sci. 1950, 40, 93–99. [Google Scholar] [CrossRef]
  45. Patton, A.R.; Gieseker, L. Seasonal Changes in the Lignin and Cellulose Content of Some Montana Grasses. J. Anim. Sci. 1942, 1, 22–26. [Google Scholar] [CrossRef]
  46. Gebremikael, M.T.; Ranasinghe, A.; Hosseini, P.S.; Laboan, B.; Sonneveld, E.; Pipan, M.; Oni, F.E.; Montemurro, F.; Höfte, M.; Sleutel, S.; et al. How do novel and conventional agri-food wastes, co-products and by-products improve soil functions and soil quality? Waste Manag. 2020, 113, 132–144. [Google Scholar] [CrossRef]
  47. Serafini, L.F.; Feliciano, M.; Rodrigues, M.A.; Gonçalves, A. Systematic Review and Meta-Analysis on the Use of LCA to Assess the Environmental Impacts of the Composting Process. Sustainability 2023, 15, 1394. [Google Scholar] [CrossRef]
  48. Beauchamp, E.G. I confirm. Can. J. Soil Sci. 2011, 77, 113–123. [Google Scholar] [CrossRef]
  49. Butterbach-Bahl, K.; Baggs, E.M.; Dannenmann, M.; Kiese, R.; Zechmeister-Boltenstern, S. Nitrous oxide emissions from soils: How well do we understand the processes and their controls? Philos. Trans. R. Soc. B Biol. Sci. 2013, 368, 20130122. [Google Scholar] [CrossRef] [PubMed]
  50. Cayuela, M.L.; Aguilera, E.; Sanz-Cobena, A.; Adams, D.C.; Abalos, D.; Barton, L.; Ryals, R.; Silver, W.L.; Alfaro, M.A.; Pappa, V.A.; et al. Direct nitrous oxide emissions in Mediterranean climate cropping systems: Emission factors based on a meta-analysis of available measurement data. Agric. Ecosyst. Environ. 2017, 238, 25–35. [Google Scholar] [CrossRef]
  51. Wolf, P.; Groen, E.A.; Berg, W.; Prochnow, A.; Bokkers, E.A.M.; Heijungs, R.; de Boer, I.J. Assessing greenhouse gas emissions of milk production: Which parameters are essential? Int. J. Life Cycle Assess. 2017, 22, 441–455. [Google Scholar] [CrossRef]
  52. Pergola, M.; Persiani, A.; Palese, A.M.; Di Meo, V.; Pastore, V.; D’Adamo, C.; Celano, G. Composting: The way for a sustainable agriculture. Appl. Soil Ecol. 2018, 123, 744–750. [Google Scholar] [CrossRef]
  53. Diacono, M.; Trinchera, A.; Montemurro, F. An Overview on Agroecology and Organic Agriculture Strategies for Sustainable Crop Production. Agronomy 2021, 11, 223. [Google Scholar] [CrossRef]
  54. Morra, L.; Bilotto, M.; Baldantoni, D.; Alfani, A.; Baiano, S. A seven-year experiment in a vegetable crops sequence: Effects of replacing mineral fertilizers with Biowaste compost on crop productivity, soil organic carbon and nitrates concentrations. Sci. Hortic. Amst. 2021, 290, 110534. [Google Scholar] [CrossRef]
  55. Loncaric, R.; Kanisek, J.; Loncaric, Z. Mineral or organic fertilization: Financial aspects. Eur. Sci. J. ESJ 2013, 1, 1857–7881. [Google Scholar]
  56. Zhai, L.; Wang, Z.; Zhai, Y.; Zhang, L.; Zheng, M.; Yao, H.; Lv, L.; Shen, H.; Zhang, J.; Yao, Y.; et al. Partial substitution of chemical fertilizer by organic fertilizer benefits grain yield, water use efficiency, and economic return of summer maize. Soil Tillage Res. 2022, 217, 105287. [Google Scholar] [CrossRef]
Figure 1. Mean monthly rainfall and temperature during the experiment (August 2020–December 2021), in comparison with the long-term averages (1981–2021).
Agriculture 13 01048 g001
Figure 2. Effects of the tested treatments (T1, T2, T3, T4, T5, and T6) on fennel plant dry weight (g) and root dry weight during the first cultivation season (a,c) and the second cultivation season (b,d). Data were collected at 30, 60, and 75 days after transplanting (DAT) in each season. (T1 = 100% MC1; T2 = 50% MC1 + 50% UREA; T3 = 100% MC2; T4 = 50% MC2 + 50% UREA; T5 = 50% of mineral fertilizer 18-46 + 50% UREA; T6 = not fertilized control).
Agriculture 13 01048 g002
Figure 3. GHG emission values (kg CO2 eq. ha-1) for the cultivation process divided by field operation (T1 = 100% MC1; T2 = 50% MC1 + 50% UREA; T3 = 100% MC2; T4 = 50% MC2 + 50% UREA; T5 = 50% of mineral fertilizer 18-46 + 50% UREA; T6 = not fertilized control).
Agriculture 13 01048 g003
Figure 4. Carbon loss/input (emissions) and carbon stocks/output expressed as Kg C eq. ha−1 year−1 in the different analyzed systems (T1 = 100% MC1; T2 = 50% MC1 + 50% UREA; T3 = 100% MC2; T4 = 50% MC2 + 50% UREA; T5 = 50% of mineral fertilizer 18-46 + 50% UREA; T6 = not fertilized control).
Agriculture 13 01048 g004
Figure 5. System carbon difference (Kg C eq. ha−1 year−1) and carbon efficiency in the different analyzed systems (T1 = 100% MC1; T2 = 50% MC1 + 50% UREA; T3 = 100% MC2; T4 = 50% MC2 + 50% UREA; T5 = 50% of mineral fertilizer 18-46 + 50% UREA; T6 = not fertilized control).
Agriculture 13 01048 g005
Figure 6. Fertilization costs: fertilizer and spreading costs. (T1 = 100% MC1; T2 = 50% MC1 + 50% UREA; T3 = 100% MC2; T4 = 50% MC2 + 50% UREA; T5 = 50% of mineral fertilizer 18-46 + 50% UREA; T6 = not fertilized control).
Agriculture 13 01048 g006
Table 2. Economic parameters used for the cost analysis.
UnitTractor
New Holland TN F 80 DT
Fertilizer Spreader
Faza sp 400
Financial costInvestment[€]42,0001500
Service life[y]1010
Service life[h]10,0002000
Resale[%]3818
Resale[€]15,931265.26
Depreciation[€]26,0691235
Annual usage[h y−1]15010
Interest rate[%]33
Workers[n]1
Fixed costsOwnership costs[€ y−1]2606.94123.47
Interests[€ y−1]868.9626.48
Machine shelter[m2]9.123.00
Value of shelter[€ m−2]100.00100.00
Value of shelter[€ y−1]27.369.00
Insurance (0.25%)[€ y−1]105.000.00
Variable costsRepairs and maintenance[€ h−1]0.630.03
Fuel cost[€ l−1]1.20
Lubricant cost[€ l−1]3.03
Worker salary[€ h−1]13.00
Table 3. Fuel consumption and working capacity during basal and topdressing fertilization. (T1 = 100% MC1; T2 = 50% MC1 + 50% UREA; T3 = 100% MC2; T4 = 50% MC2 + 50% UREA; T5 = 50% of mineral fertilizer 18-46 + 50% UREA; T6 = not fertilized control).
TreatmentFuel ConsumptionWorking Capacity
Basal
[l h−1]
Topdressing
[l h−1]
Basal
[ha h−1]
Topdressing
[ha h−1]
T16.0 0.3
T24.56.20.81.0
T34.5 0.8
T44.16.21.04.0
T56.2 4.04.0
Table 4. Aboveground biomass (Mg ha−1), roots biomass (Mg ha−1), marketable yield (Mg ha−1), aboveground biomass dry matter (%), roots dry matter (%), and fennel head weight (g) at commercial maturity in the two-year fennel cultivation. Analysis of variance (ANOVA) of the different analyzed parameters (T1 = 100% MC1; T2 = 50% MC1 + 50% UREA; T3 = 100% MC2; T4 = 50% MC2 + 50% UREA; T5 = 50% of mineral fertilizer 18-46 + 50% UREA; T6 = not fertilized control).
YearTreatmentAboveground Biomass
(Mg ha−1)
Roots Biomass (Mg ha−1)Marketable Yield (Mg ha−1)Fennel Head Weight (g)
2020T139.31ab2.11b18.33ab229.64bc
2020T235.97b2.72a16.11b197.40c
2020T353.47a3.16a21.81ab327.93a
2020T451.39a3.13a23.89a356.67a
2020T542.08ab3.04a20.00ab300.00ab
2020T643.33ab3.17a19.62ab220.77c
2021T132.36bc2.02d18.75b138.59cd
2021T245.14a3.07bc21.88ab190.51bc
2021T347.92a3.40b27.36a256.77a
2021T439.86abc3.35b26.67a189.07bc
2021T542.36ab4.24a21.81ab225.57ab
2021T628.33c2.52cd20.97ab117.23d
Year*n.s****
Treatment**********
Interaction (Year × Treatment)n.s.**n.s.*
Notes: Mean values, in columns, followed by the same letter are not significantly different according to a Duncan test (p = 0.05). n.s., not significant. *, **, ***, Significant at p < 0.05, 0.01 and 0.001, respectively. The probability levels are presented by year, treatment, and their interactions.
Table 5. Total N (%) and Total C (%) in the residues and in the head of fennels at commercial maturity in the two-year crop cultivation. Analysis of variance (ANOVA) of the different analyzed parameters (T1 = 100% MC1; T2 = 50% MC1 + 50% UREA; T3 = 100% MC2; T4 = 50% MC2 + 50% UREA; T5 = 50% of mineral fertilizer 18-46 + 50% UREA; T6 = not fertilized control).
YearTreatmentResiduesHeads
N (%)C (%)N (%)C (%)
Y × T2020T12.12b28.49b1.66b47.59ab
Y × T2020T21.99b30.36b2.25ab49.35a
Y × T2020T33.67a45.18a2.27ab44.48c
Y × T2020T43.61a47.89a2.63ab46.08bc
Y × T2020T53.06a46.02a3.16a46.79b
Y × T2020T62.03b23.55b2.01ab46.90b
Y × T2021T11.99a48.22bc0.24b50.53ab
Y × T2021T22.19a48.13bc0.40a50.04bc
Y × T2021T32.50a48.75bc0.25b48.97d
Y × T2021T42.49a50.78b0.29ab49.68c
Y × T2021T52.33a54.61a0.27b51.09a
Y × T2021T62.11a47.07c0.26b49.92bc
Y***********
T******n.s.***
Interaction (Y × T)******n.s.*
Notes: Mean values, in columns, followed by the same letter are not significantly different according to a Duncan test (p = 0.05). n.s., not significant. *, **, ***, Significant at p < 0.05, 0.01, and 0.001, respectively. The probability levels are presented by year (Y), treatments (T), and their interactions (Y × T).
Table 6. Direct and indirect N2O-based CO2 eq. emissions derived from fertilizers applications and residues decomposition in the different treatments (T1 = 100% MC1; T2 = 50% MC1 + 50% UREA; T3 = 100% MC2; T4 = 50% MC2 + 50% UREA; T5 = 50% of mineral fertilizer 18-46 + 50% UREA; T6 = not fertilized control).
T1T2T3T4T5T6
N2O-Based CO2 eq. Emissionskg CO2 eq. ha−1 year−1kg CO2 eq. ha−1 year−1kg CO2 eq. ha−1 year−1kg CO2 eq. ha−1 year−1kg CO2 eq. ha−1 year−1kg CO2 eq. ha−1 year−1
Direct emissions410435512478477112
Indirect emissions28029433431631659
Leaching emission21623027025325259
Volatilization emission 64646464640
Total GWP690729846795792171
Disclaimer/Publisher’s Note: The statements, opinions and data contained in all publications are solely those of the individual author(s) and contributor(s) and not of MDPI and/or the editor(s). MDPI and/or the editor(s) disclaim responsibility for any injury to people or property resulting from any ideas, methods, instructions or products referred to in the content.

