Article

Characterizing Agronomic and Shoot Morphological Diversity across 263 Wild Emmer Wheat Accessions

1
Food Future’s Institute, School of Health, Education & Environment, Murdoch University, Perth, WA 6150, Australia
2
Department of Genetics and Plant Breeding, Bangladesh Agricultural University, Mymensingh 2202, Bangladesh
3
Department of Plant Sciences, North Dakota State University, Fargo, ND 58108, USA
4
Institute of Evolution, University of Haifa, Haifa 31905, Israel
5
Department of Seed Science & Technology, Bangladesh Agricultural University, Mymensingh 2202, Bangladesh
6
College of Agronomy, Qingdao Agriculture University, Qingdao 266109, China
*
Author to whom correspondence should be addressed.
Agriculture 2023, 13(4), 759; https://doi.org/10.3390/agriculture13040759
Submission received: 5 March 2023 / Revised: 20 March 2023 / Accepted: 21 March 2023 / Published: 25 March 2023
(This article belongs to the Section Genotype Evaluation and Breeding)

Abstract

:
Wild emmer, the direct progenitor of modern durum and bread wheat, has mostly been studied for grain quality, biotic, and abiotic stress-related traits. Accordingly, it should also have a certain amount of diversity for morphological and agronomic traits. Despite having a high chance of huge diversity, it has not been deeply explored. In the current study, 263 wild emmer accessions collected from different regions of Israel, Turkey, Lebanon, and Syria were characterized for a total of 19 agronomic and shoot morphological traits. Three trials were carried out in Western Australia, which demonstrated a large variation in these traits. The average phenotypic diversity (H’) was 0.91 as quantified by Shannon’s diversity index. A high heritability was recorded for most of the traits, where biomass/plant and yield/plant were identified as the most potential traits. Correlation analysis revealed several significant associations between traits, including significant positive correlation between yield and tiller number, first leaf area, spike length, and biomass/plant. The principal component analysis (PCA) demonstrated that most of the traits contributed to the overall observed variability. The cluster analysis categorized 263 accessions into five clusters on average. On the other hand, accessions were categorized into eight populations based on the collection region and a comparative analysis demonstrated considerable variations between populations for plant height, spike length, and flag leaf area. Despite the low yield, several wild emmer accessions demonstrated superior performance compared to modern bread wheat cultivars, when selection was based on combining yield with multiple traits. These observations indicate that wild emmer contains a broad gene pool for several agronomic and shoot morphological traits, which can be utilized for bread and durum wheat improvement.

1. Introduction

Wheat is one of the most important and widely grown crops, which accounts for 8% (0.7 billion tonnes) of the global production of primary crops in recent times [1]. The reason behind worldwide massive cultivation is its capacity to grow in a broad range of weather conditions (temperature: 3 to 32 °C; precipitation: 250 to 1750 mm, moisture condition: dry to seaside; elevation: up to 3000 m above sea level) and in heterogeneous types of soil [2]. Modern wheat is derived through a long evolutionary process, which includes hybridization, polyploidization, domestication, and mutation [3,4]. The evolutionary process started with the formation of wild emmer wheat (Triticum dicoccoides, AABB) through crossing between Triticum urartu (AA) and Aegilops speltoides (BB). Wild emmer is considered the direct progenitor of cultivated emmer (T. dicoccoum), durum (T. durum), and bread wheat (T. aestivum), and it played a central role in wheat domestication [5]. Domestication of wild emmer started around 10,000 years ago in the Fertile Crescent region and it still grows widely across the discontinuous arc of Fertile Crescent, more precisely from Israel to western Iran. Wild emmer accessions can be subdivided into two distinct groups according to geographical distribution: northern (Turkey, Iraq, and Iran) and southern (Israel, Palestine, Lebanon, and southwestern Syria) populations [6,7]. AFLP (Amplified Fragment Length Polymorphism) and RFLP (Restriction fragment length polymorphism) studies suggested that the Karacadag (or Diyarbakir) region in south-eastern Turkey was likely the place for domestication [7]. Another study based on organellar DNA suggested that the southern Levant in north-western Turkey was the place for domestication [8]. Evidence supporting the initiation of domestication in both places was also found, suggesting an independent domestication event in both places followed by expansion and merging [6]. However, distribution of wild emmer was confined to areas with relatively mild winters around the Fertile Crescent region. Studies on geographical variation among different wild emmer accessions revealed that genetic polymorphisms were established before the start of domestication, resulting in a wide variation between and within populations for several traits [9].
The importance of exploring and preserving the genetic diversity of crop species and their wild relatives has been recognized by the foremost agronomists and geneticists [10], for conserving germplasm and selecting desirable genotypes for breeding [11,12,13]. Landraces have always been considered valuable material for studying genetic diversity because of the large genomic variations between and within populations [12]. Moreover, many valuable allelic variations, which were lost gradually through natural evolution, domestication, and breeding, could be recovered by utilizing landraces [14].
While the potential of wild emmer wheat (WEW) in grain quality (protein content, amino acid composition, novel gliadin, and glutenin content and micronutrient mineral content); abiotic stress (herbicide resistance and salt, drought, and heat tolerance); and biotic stress (powdery mildew, fusarium head blight, leaf rust, stem rust, stripe rust, and many more) tolerances have been investigated extensively, the massive variation in morphological traits has been overlooked in many cases [5]. The reason behind this minimal interest toward morphological traits is the difficulty in phenotyping. For example, usually, most wild emmer takes a long time to flower and complete its life cycle. In addition, flowering time is not synchronized, which is a concern for conventional breeding schemes [15]. Similarly, most wild emmer is characterized by prostrate type growth; i.e., tillers grow in a horizontal direction and most of them are tall, which results in lodging. So external mechanical support is needed at flowering time until harvesting to keep them straight, which is inconvenient for large-scale phenotyping. Another concern of wild emmer is that its spikes usually disarticulate into spikelets at maturity, which are known as brittle rachis that makes harvesting difficult [3]. Moreover, spikes consist of persistent enclosed hulls and strong glumes, which makes the threshing very difficult using a threshing machine [16]. Thus, manual threshing is the only way to phenotype grain-related traits, which is a very difficult job for larger sizes of germplasm.
However, despite having many challenges, wild emmer wheat can be a potential source of variations in several shoot morphological and agronomic traits that can be used for the improvement of modern wheat. It is evident that, similar to grain quality and stress-related traits, wild emmer has a huge diversity in agronomic traits [17]. There is a high chance of having a wide range of alleles for shoot morphological and agronomic traits. For example, while most wild emmer accessions are late-flowering, a few early-flowering accessions have the potential genetic source to be utilized further for the improvement of modern wheat [18]. Similarly, another beneficial trait is biomass, as higher biomass means more photosynthesis, which ultimately increases yield [19]. Moreover, wild landraces of wheat were used as fodder by ancient farmers due to higher biomass [20]. Tiller number is another trait that heavily contributes to the total biomass and is directly related to yield [21]. In general, wild emmer produces a high number of tillers despite the fact that many of them are not productive [22]. Shoot angle (angle between tillers and soil surface) is also a trait of interest, which determines the erectness or prostrate growth of any crop and the transition from prostrate to erect was an important domestication event [23]. Similarly, tiller angle (the angle between main culm and side tillers or angle between outermost left and right tillers) is a domestication-indicating trait that has been studied extensively in rice [23,24]. So far, no study has been published until now to explore the diversity of these traits in wild emmer wheat. Spike length is also an important trait that is directly related to yield, which is largely variable in wild emmer that can be potentially utilized to boost the yield of modern wheat. As such, some of the morphological attributes present in wild emmer will be useful for bread wheat improvement. A detailed study on agronomic and shoot morphological traits of wild emmer landraces would generate useful information for wheat breeding.
For understanding the diversity of any particular trait, simple distribution patterns or value ranges are generally used. Shannon’s phenotypic diversity is another way to study the diversity of individual traits and trait combinations [25]. Multivariate analysis is also important to assess large plant populations in identifying genotypes with desirable traits for breeding, organizing core collections, and elucidating the patterns of variation [26]. It has been used to summarize and describe the underlying variation in germplasm collections of many crops such as sorghum, barley, rice, and wheat [26,27]. On the other hand, it is important to identify the accessions with superior performance, not only based on yield but also considering multiple traits contributing to yield. Recently, a new statistical approach named GYT (Genotype by Yield*Trait) biplot was developed for selecting better-performing genotypes [28], where genotypes were evaluated by combining yield with other traits (any traits having breeding value). This approach has been used extensively in several grain crops including bread wheat [29], durum wheat [30], soybean [31], sesame [32], cowpea [33], and many more. This is a graphical, effective, and straightforward tool for the selection of genotypes based on multiple traits [28]. The accessions identified as superior ranked using this method can be used as a potential parent in a breeding program where multiple useful traits can be targeted at the same time.
It has been well documented that the place of origin of wild species has a strong influence on the possession of plant morphological traits [9]. As wild emmer generally grows in the Fertile Crescent, particularly around Eastern Mediterranean countries at the center of origin, it is largely unknown how they perform in other agro-ecological environments. In particular, no study has been published on the performance of wild emmer in Australian conditions, which is essential to utilize such valuable genetic resources in Australian wheat breeding.
The current study was conducted on several agronomic and shoot morphological traits of 263 accessions of wild emmer collected from Turkey, Lebanon, Syria, Iran, and different parts of Israel including EC1 (Evolution Canyon 1, an ideal microsite model for studying evolution [34]). The diversity of the WEW germplasm set for 19 traits in the Australian environment will be discussed, and the potential traits for bread wheat breeding program will be identified.

2. Materials and Methods

2.1. Plant Materials

The experiment was conducted with 263 accessions of wild emmer wheat (Triticum dicoccoides) obtained from the Gene Bank of the Institute of Evolution, University of Haifa, Haifa, Israel. Those accessions were collected from Israel, Turkey, Syria, Lebanon, and Iran (Table 1). Accessions were categorized into 10 populations based on geographical locations [9]. Some accessions from Israel were categorized as “Non-specified”, as the information on the exact collection location of those accessions was not available. All collected accessions were released from biosecurity control following all the necessary procedures set by Department of Agriculture and Water Resource, Government of Western Australia.

2.2. Glasshouse and Field Experiment

Two separate glasshouse experiments were conducted from January to September 2019 (E1: 17 °C temp. and 70% RH) and February to October 2020 (E2: 19 °C temp. and 61% RH) at Murdoch University, Western Australia, following CRD (Completely Randomized Design) layout with six biological replicates of each genotype. Seeds were sown on Petri plate and kept at 4 °C for cold treatment. After three days, uniformly germinated seedlings were transferred into pot (5 L) with soil mixture. One field trial was conducted in South Perth, the experimental farm of the Department of Primary Industries and Regional Development, Western Australia, from June 2020 to December 2020. Before sowing, seeds were kept in cold room (4 °C) for 1 week. The trial design followed a RCBD (Randomized Complete Block Design) with three replications in a 100 cm long single row. Necessary intercultural operations (fertilizer application and weeding) were conducted on a regular basis to maintain a proper growth. High-yielding Australian bread wheat cultivars Suntop, Mace, and Yitpi were used as check cultivars. Just before flowering, external supports were provided using bamboo stick. Whole plants were harvested separately at full maturity and about 5 cm of stem was kept from the ground to record the shoot angle data.

2.3. Data Collection

Data were taken on 19 aboveground important agronomic traits including heading time (HT), flowering time (FT), maturity time (MT), plant height (PH), total tiller number (TTN), effective tiller number (ETN), spike length (SpL), peduncle length (PL), flag leaf area (FLA), second leaf area (SLA), yield per plant (YPP), and biomass per plant (BPP). As wild emmer has brittle rachis, spikes were harvested manually when 50% of them were at physiological maturity [17]. The angles between effective tillers and soil surface (ranging from 0 to 90o) were recorded as shoot angle (SAng), which was recorded from 5 cm of stem kept from ground while harvesting (Supplementary Figure S1A–C). Seed-related traits including thousand kernel weight (TKW), seed length (SL), seed width (SW), seed thickness (ST), and seed area (SA) were recorded using seed count machine. Threshing was performed manually by rubbing between two rough rubber surfaces and threshability was scored on a 1–4 scale [35] where 1 = completely free-threshing with virtually all seed released from the hulls; 2 = mostly free-threshing with a minor portion of the seed remaining hulled; 3 = somewhat difficult to thresh with a major portion of the seed remaining hulled; and 4 = difficult to thresh with only a few seeds being released from the hulls (Supplementary Figure S1D–G). Same person carried out all the threshing work to reduce scoring errors.

2.4. Statistical Analysis

Data were subjected to different types of analysis. Firstly, the descriptive statistics and distribution of all traits were checked to ensure normality of data, followed by an analysis of variation (ANOVA) to determine the effects of genotype, environment (location), and genotype x environment interaction using the statistical software IBM SPSS Statistics version 24.0 (IBM Corp., Armonk, NY, USA). Genotypic variance (GV) and phenotypic variance (PV) were calculated based on the formula given by Johnson et al. [36]. Genotypic coefficient of variations (GCV) and phenotypic coefficient of variations (PCV) were calculated following the formula given by Burton [37]. Heritability in a broad sense (H2b) was estimated using the formula given by Johnson et al. [36]. Genetic advance (GA) was estimated following Johnson et al. [36]. Genetic advance in percent of mean (GA%) was calculated based on Comstock and Robinson [38]. Pearson’s correlation analysis and principal component analysis (PCA) were conducted using the statistical software IBM SPSS Statistics version 24.0 (IBM Corp., Armonk, NY, USA). In PCA, components with eigenvalues >1 were extracted, and the first two principal components (PC1 and PC2) were considered only for generating a two-dimensional graphical representation (loading plot). Traits having a significant contribution to the first principal component (PC1) were incorporated for cluster analysis suggested by Ward’s method based on Squared Euclidean distance [11] using the same software.
For estimation of Shannon’s diversity, entries of a particular trait were classified into five phenotypic groups based on the mean value and standard deviation (SD) as follows: (i) G1: entries with <(Mean-2SD); (ii) G2: entries from >(Mean-2SD) to <(Mean-1SD); (iii) G3: entries from >(Mean-1SD) to <(Mean + 1SD); (iv) G4: entries from >(Mean + 1SD) to <(Mean + 2SD); and (v) G5: entries with >(Mean + 2SD). Shannon’s diversity index (H) of each studied trait was calculated first to find out the phenotypic diversity in the collected accessions using the following formula [25].
H = i = 1 N P i I n P i
where N = Number of phenotypic groups; Pi = Relative frequency of the ith group; and ln = Natural logarithm.
Finally, the average Shannon’s diversity (H’) was estimated using the following formula [25].
H = i = 1 k H i
where H = Shannon’s diversity index and k = Number of total studied traits.
Shannon’s phenotypic diversity was also calculated for each population based on some selected traits using the same formula. Eight populations were considered according to their collection locations: (i) Central area, Israel; (ii) South area, Israel; (iii) West area, Israel; (iv) Non-specified, Israel; (v) Evolutionary Canyon 1 (EC1), Israel; (vi) Turkey; (vii) Lebanon; and (viii) Syria. The North area, Israel, and the Iran populations were excluded from this analysis due to only having two and one accessions, respectively (Table 1). A comparative analysis was conducted to observe the overall performance of different populations based on a suite of selected traits. GGE biplots were drawn using the GenStat package (17th release, VSN International. Hertfordshire, UK) to cluster populations of similar performance based on the selected individual traits.
Superior accessions were selected following GYT (Genotype by Yield*Trait) biplot method [28]. Traits having a highly significant correlation with yield were selected. For preparing GYT table, values of positively correlated traits were multiplied by yield value (e.g., Yield*Effective tiller or Y*ET). On the other hand, yield value was divided by the value of its negatively correlated traits (e.g., Yield/Flowering time or Y/FT). The GYT table was standardized using the following formula so that the mean of each yield–trait combination became 0 and the standard deviation became 1, and this table was named as a standardized table (Supplementary Table S6) [28].
P i j = T i j T j S j
where Pij is the standardized value of accession i for yield–trait combination j in the standardized table, Tij is the original value of accession i for yield–trait combination j in GYT table, Tj is the mean across accessions for yield–trait combination j, and Sj is the standard deviation for yield–trait combination j. Average standardized value of a particular accession for all yield–trait combinations was termed as superiority index and used to rank the accessions. High-yielding popular cultivar Mace, Suntop, and Yitpi were also used here to compare with wild emmer accessions. The average tester coordination (ATC) view of GYT biplot was prepared to show the ranking of top 20 accessions based on superiority index of all yield–trait combinations along with three cultivars from field trial data (E3). The GGE biplot was prepared to observe performance and stability of top 20 accessions across all three trials (E1, E2, and E3). Both GYT biplot and GGE biplot were generated using GenStat package (17th release, VSN International. Hertfordshire, UK).

3. Results

3.1. Diversity in Shoot Morphology

All of the 19 traits showed considerable variation in all 3 environments (Figure 1). A wide range was observed in E1 and E2 for the life-cycle-related traits (HT, FT, and MT), while a narrow range was found in E3. In general, all accessions completed their life cycles earlier in E3 compared to E1 and E2 (Figure 1A–C). A huge diversity was observed in plant height (PH), effective tiller number (ETN), and total tiller number (TTN) in all locations despite the fact that the diversity range varies between the environments (Figure 1D–F). The highest diversity in PH was observed in E1 with the value ranging from 47 to 186 cm (Supplementary Table S1). The ETN also demonstrated a huge variation that was distributed from 1/plant to 14/plant at E2. Likewise, TTN showed a huge diversity with the range from 3/plant to 20/plant at E2.
A considerable diversity was also observed in spike length (SpL) and peduncle length (PL) in all environments, where the highest diversity in SpL was observed in E2 ranging from 4.5 to 11.75 cm, and the highest diversity in PL was observed in E1 ranging from 11 to 76.5 cm (Figure 1G,H; Supplementary Table S1). Similarly, a huge variation was also observed in the flag leaf area (FLA) and second lead area (SLA) in all environments despite the fact that the diversity range varied from environment to environment (Figure 1I,J). The highest diversity for FLA was observed in E2 ranging from 4.35 to 76.73 cm2. Shoot angle (SAng) is an interesting trait with an average of 54.34°. A wide range of shoot angles indicates that the wild emmer germplasm had both the upright and prostrate type of growth (Figure 1K). For yield/plant (YPP), the highest value was observed in E2 with a range from 0.06 to 4.34 g/plant (Figure 1M). A huge variation was also observed in biomass/plant (BPP) in all environments where the highest diversity was observed in E2 ranging from 1.86 to 55.46 g/plant, followed by E1, ranging from 2.52 to 25.52 g/plant (Figure 1L). Finally, the mean value of threshability (T) was around three, which indicates that most of the accessions were somewhat difficult to thresh with a major portion of the seed remaining hulled (Figure 1O). The average coefficients of variation (ACV) were also calculated for all traits, which ranged from 5.86% for SL to 38.19% for YPP, indicating a large improvement potential (Supplementary Table S1).
Analysis of variance (ANOVA) also showed highly significant differences among accessions for all the 19 aboveground traits across all environments (Supplementary Table S2). Genotype–environmental interactions were highly significant for all traits. Different genetic parameters including genotypic variance, phenotypic variance, heritability, genotypic coefficient of variation (GCV), phenotypic coefficient of variation (PCV), genetic advance (GA), and genetic advance as percent of mean (GA%) were measured for all the aboveground traits (Table 2). Genotypic variance ranged from 0.04 (ST) to 1214.5 (HT), whereas phenotypic variance ranged from 0.1 (SW and ST) to 1240.63 (HT). For all traits, the PCV was higher than the GCV, which indicates that the environment played an important role on phenotype. The broad sense heritability (Hb) ranged from 40.86 to 98.4 where high heritability was found for HT (97.88%), FT (98.4%), MT (92%), and BPP (90.63%) and low heritability was found for TTT (52.91%), SL (53.65%), SW (47.61%), and ST (40.86%). The YPP had the highest value for both GCV (40.78%) and PCV (43.98%), whereas SL had the lowest value (GCV%: 6.72 and PCV%: 9.17). The highest GA% was observed for YPP (96.7%) followed by BPP (90.29%), and the lowest was observed in SL (9.7%).
Pearson’s correlation analysis was conducted on three environments, separately, which showed several significant associations between traits (Supplementary Table S3). The patterns of most of the significant associations were similar (positive or negative) in three different environments indicating a strong genetic influence on trait relationships. As expected, highly positive correlations were found between the life-cycle-related traits (HT, FT, and MT), leaf area traits (FLA and SLS), and kernel-related traits (TKW, SL, SW, ST, and SA). In contrast, highly significant negative correlations were found between leaf area trait (FLA) and life-cycle-related traits (HT and FT) in all environments. It is worth mentioning that life-cycle-related traits (HT, FT, and MT) had negative correlations with most of the traits, except for tiller number-related traits (TTN and ETN). On the other hand, the production-related traits, BPP and YPP had significant positive associations with most of the traits except life-cycle-related traits (HT, FT, and MT), and threshability (T). Notably, BPP had positive associations with the life-cycle-related traits in E2. Other contrasting associations include PH with life-cycle-related traits, BPP with threshability, and YPP with SL. Compared with the total associations, there were only a few such contrasting associations.

3.2. Multivariate Analysis

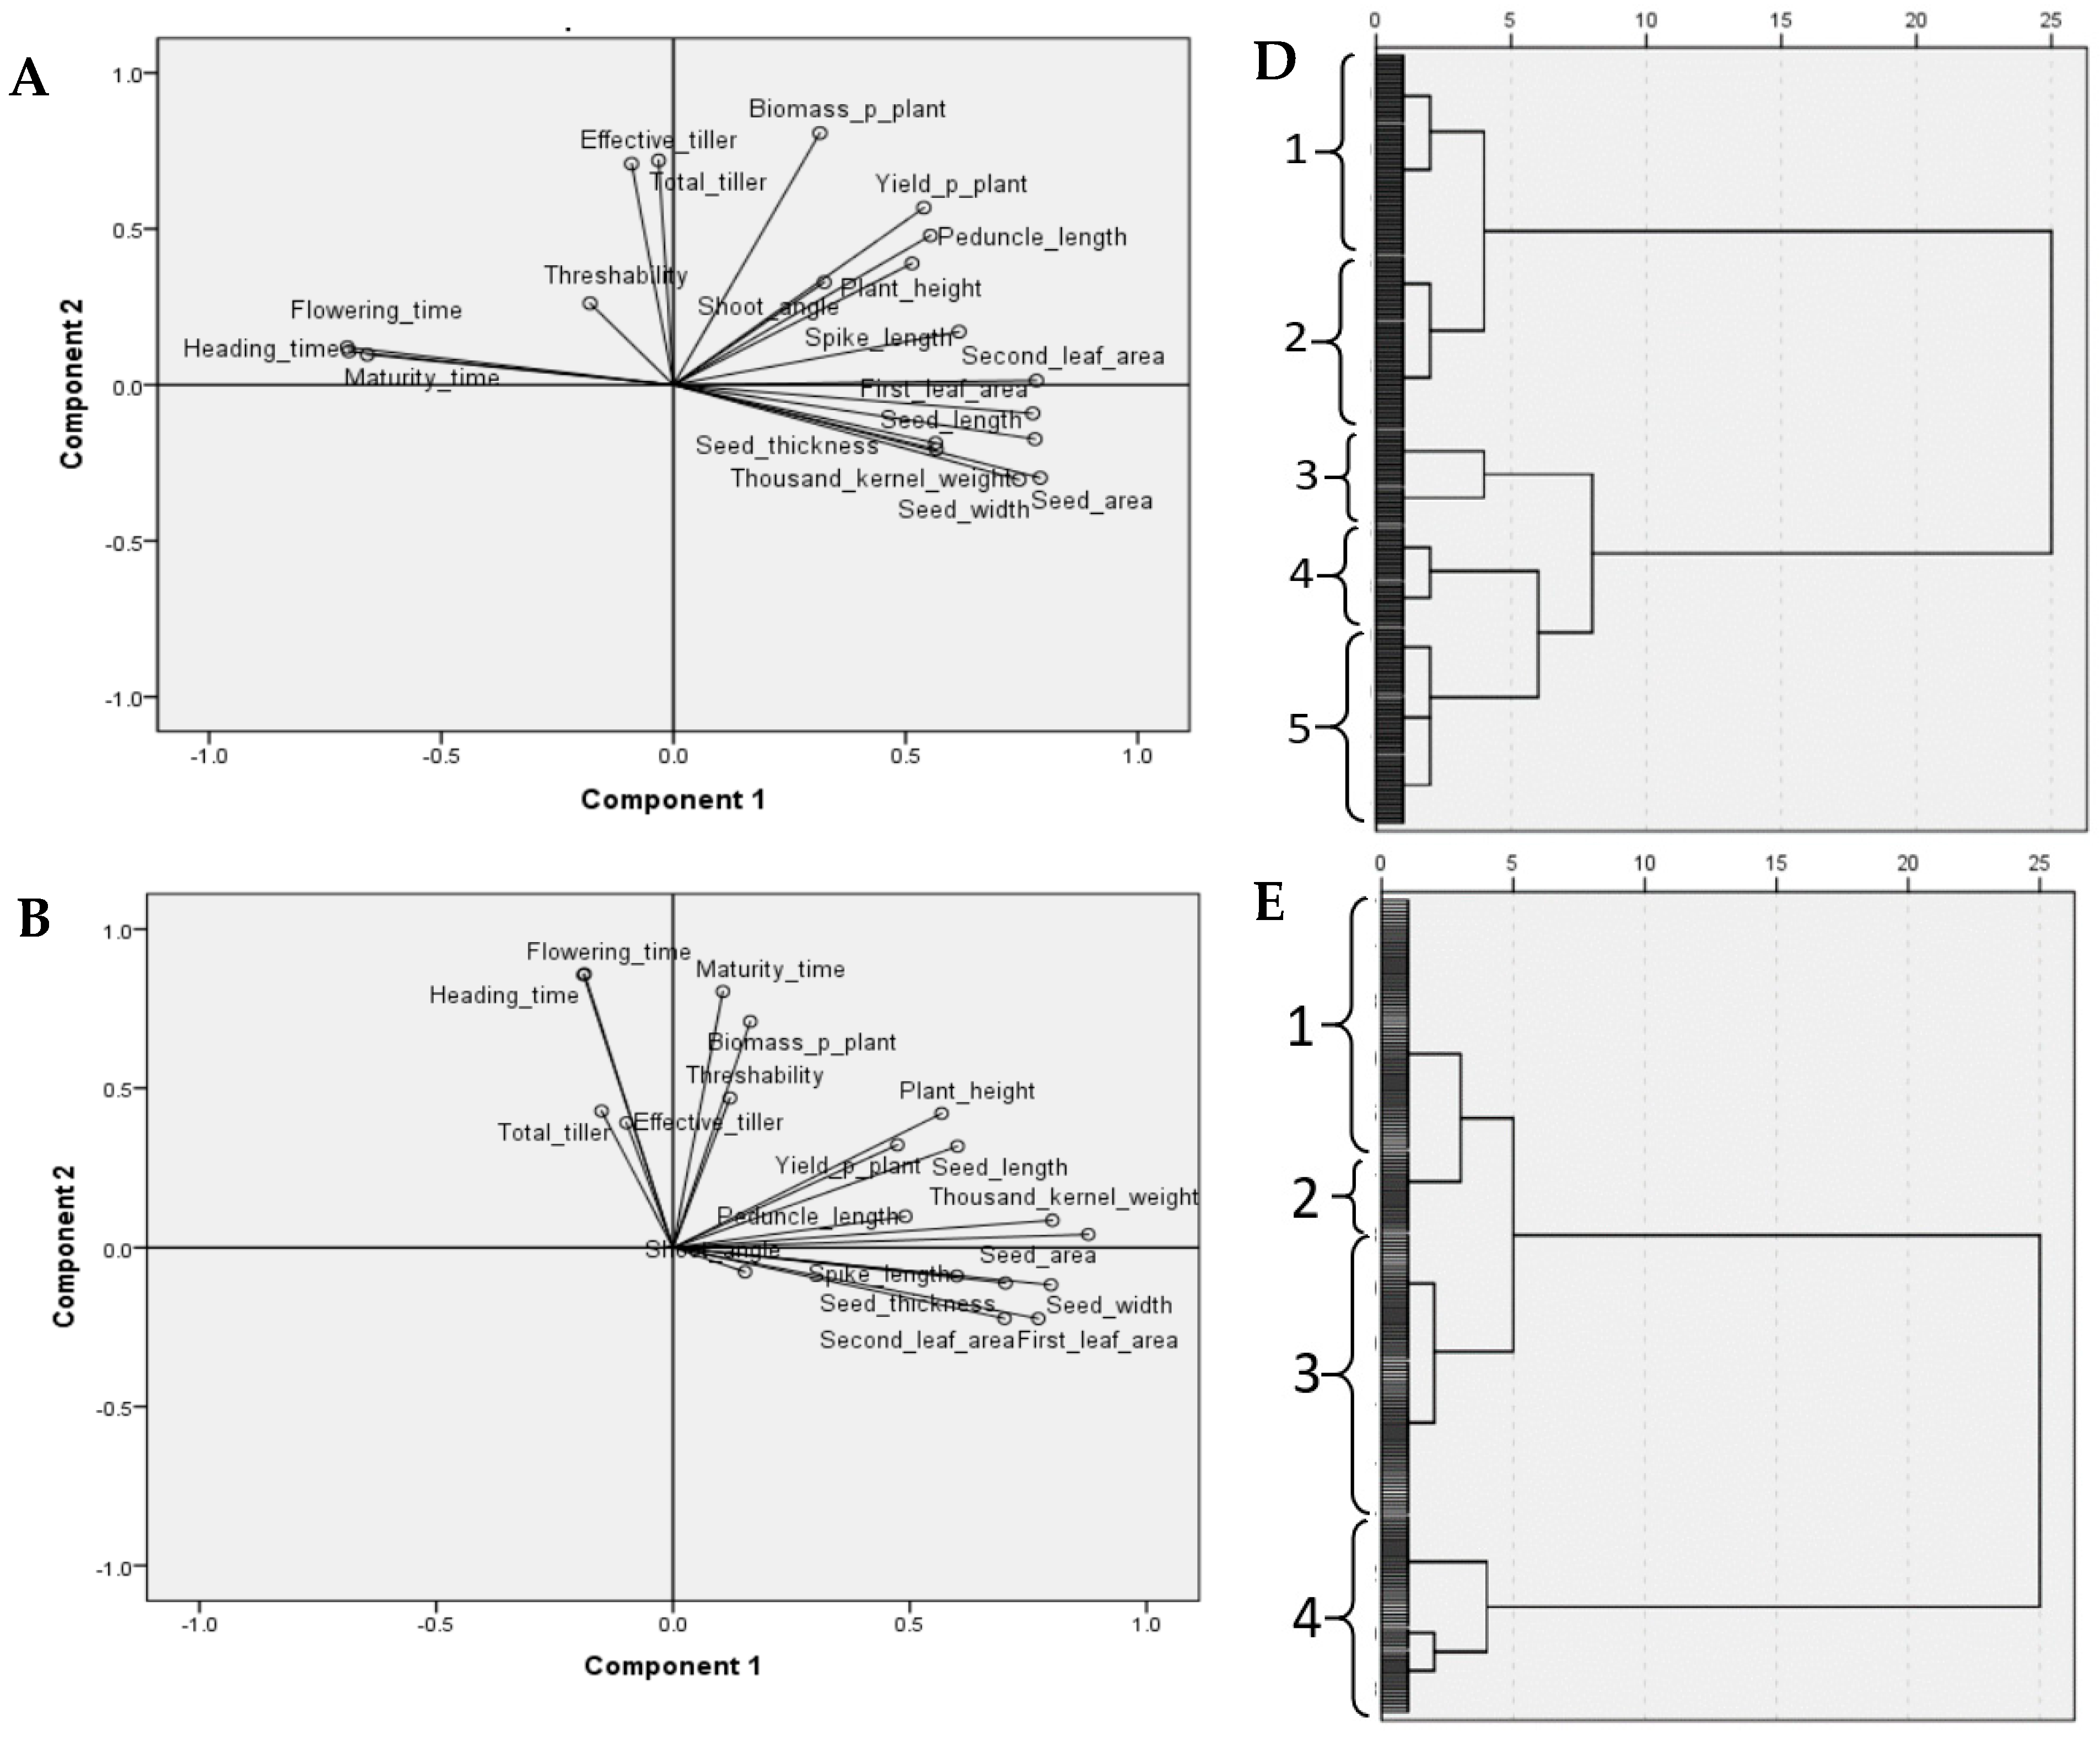
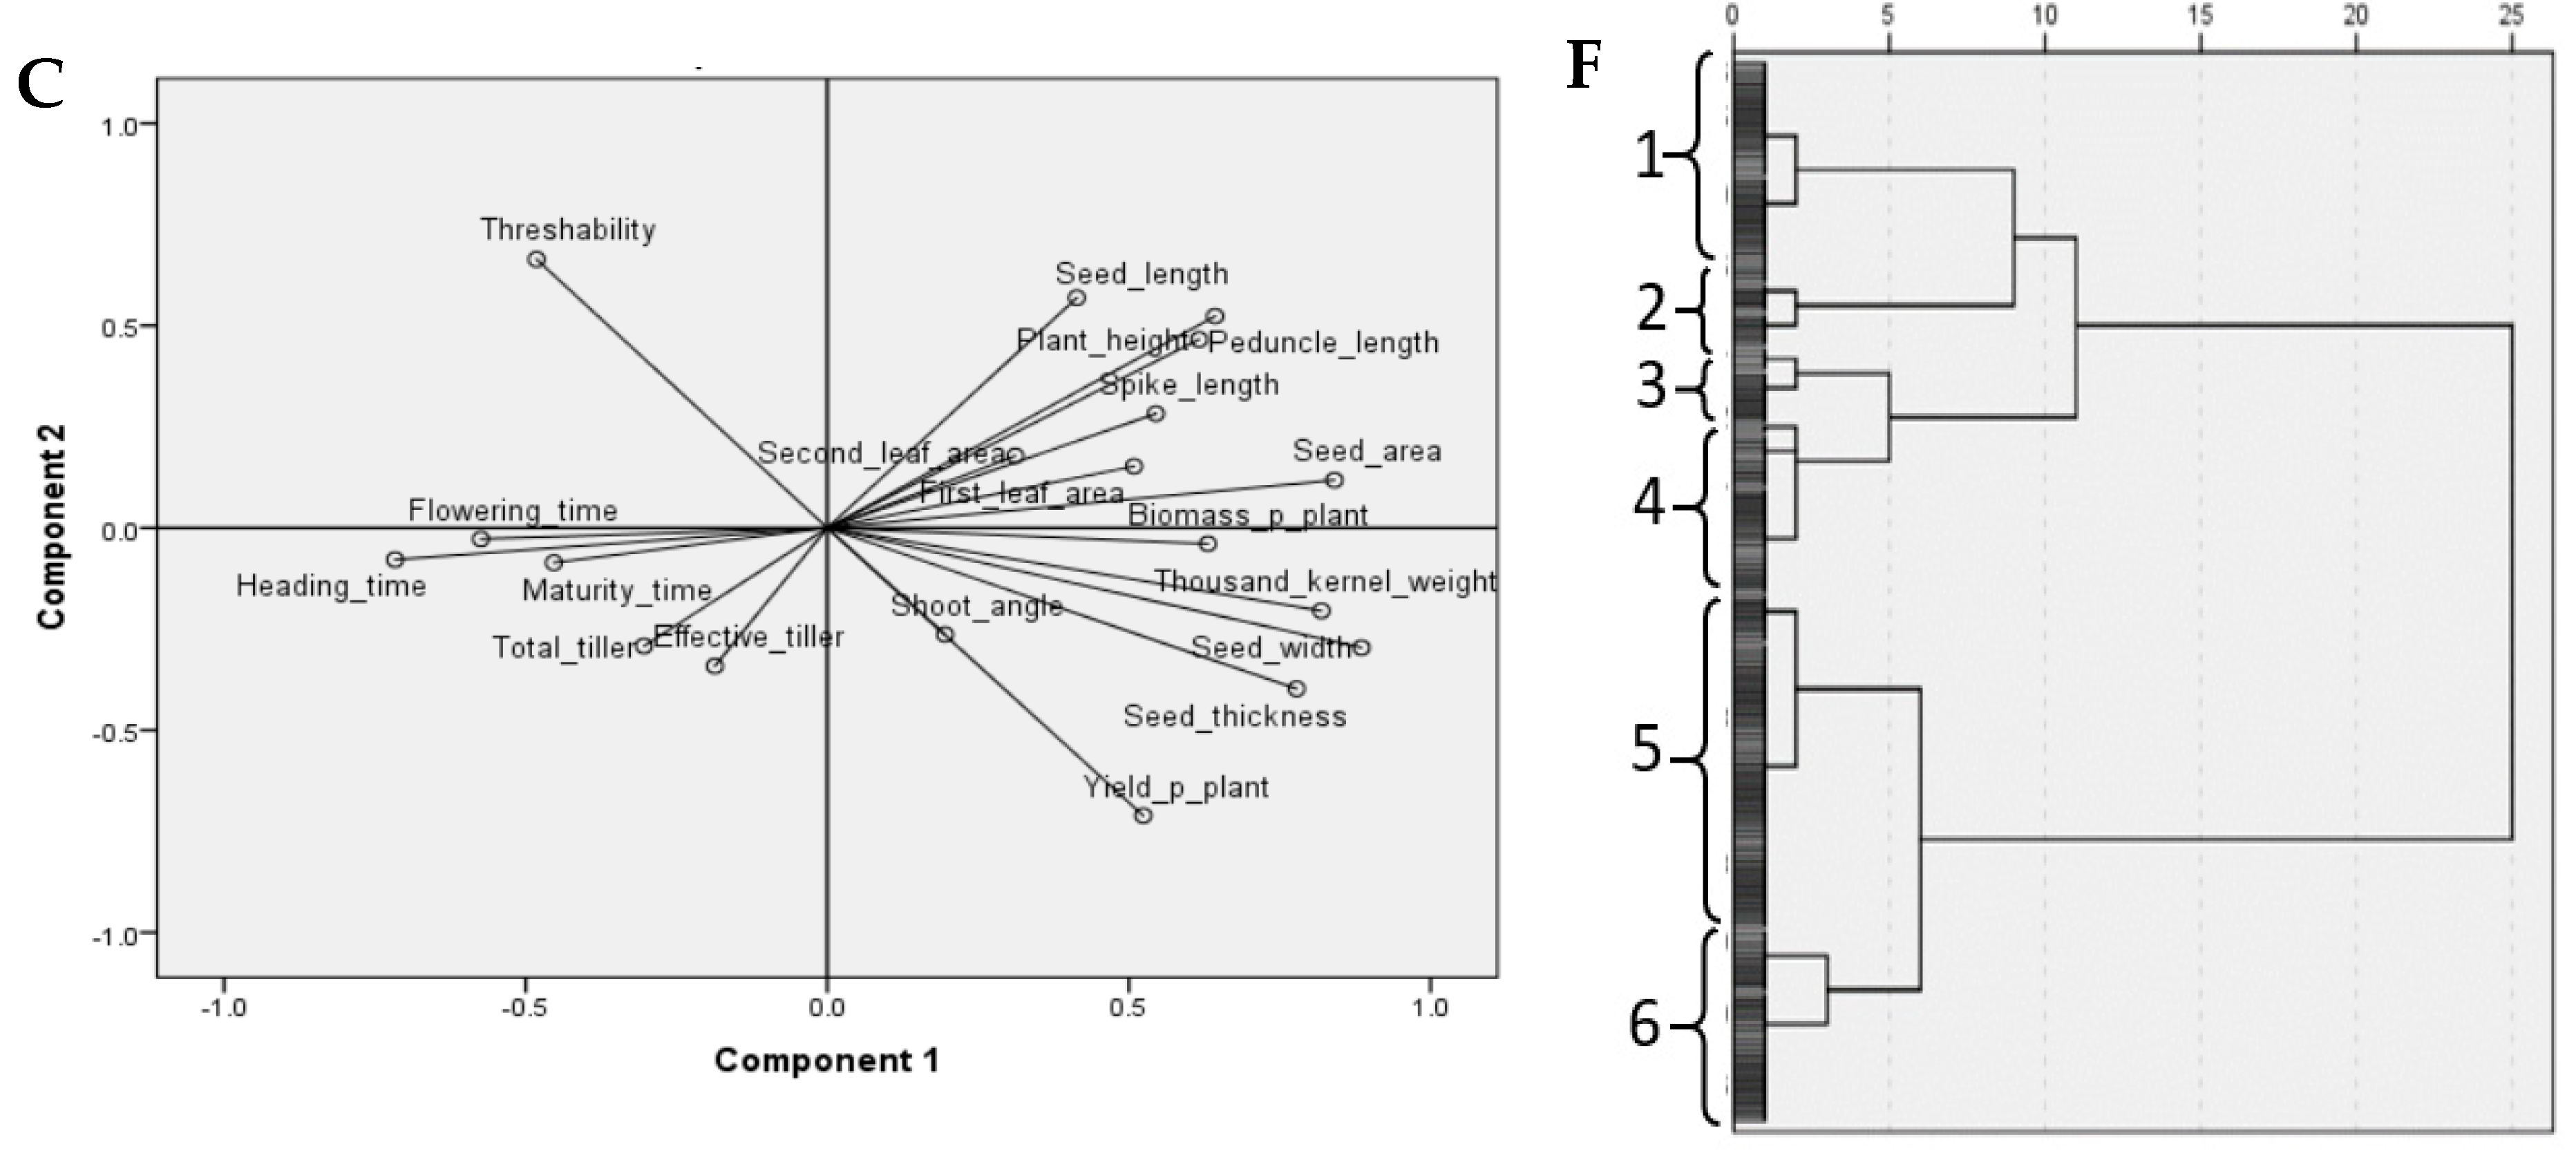
Principal component analysis (PCA) was extracted based on eigenvalues >1. Overall, PH, SpL, PL, FLA, SLA, SAng, BPP, YPP, TKW, SL, SW, ST, and SA appeared as the key traits responsible for the observed total variance. In E1, a total of five components were extracted cumulatively explaining 75.81% of the variance, among which the first component (PC1) had an eigenvalue of 6.53 that explained 34.69% of total variance (Supplementary Table S4). Similarly, a total of five and six components were extracted explaining cumulatively 74.32% and 79.81% of variance for E2 and E3, respectively. The common traits from all three environments with positive loading values to PC1 were PH, SpL, PL, FLA, SLA, SAng, BPP, YPP, TKW, SL, SW, ST, and SA, which means that these traits are mainly responsible for the observed variance. An individual component plot was generated for E1, E2, and E3 considering the first and second principal components (Figure 2A–C). In all cases, two major clusters of traits were formed: positively loaded traits (PH, SpL, PL, FLA, SLA, SAng, YPP, TKW, SL, SW, ST, and SA) and negatively loaded traits (HT, FT, MT, TTT, ETN, and T) with PC1.
Further cluster analysis was conducted separately for the three environments based on the traits with positive loadings in PC1 from the corresponding principal component analysis. This result indicates that clustering patterns of the studied wild emmer accessions varied greatly according to the environmental conditions. Cluster analysis suggested by Ward’s method based on the Squared Euclidean distance matrix grouped accessions into five, four, and six clusters for E1, E2, and E3, respectively (Figure 2D–F). In the case of E1, both the first and fifth clusters accommodated the highest number of accessions (26% each), whereas the third cluster had the lowest, with only 12% of total accessions (Supplementary Table S5). For E2, most of the accession were grouped under cluster 1 (42%), and cluster 4 had the lowest number of accessions (11%). Finally, for E3, cluster 5 had the highest number of accessions (30%) and cluster 2 had the lowest (6%).

3.3. Shannon’s Phenotypic Diversity Index

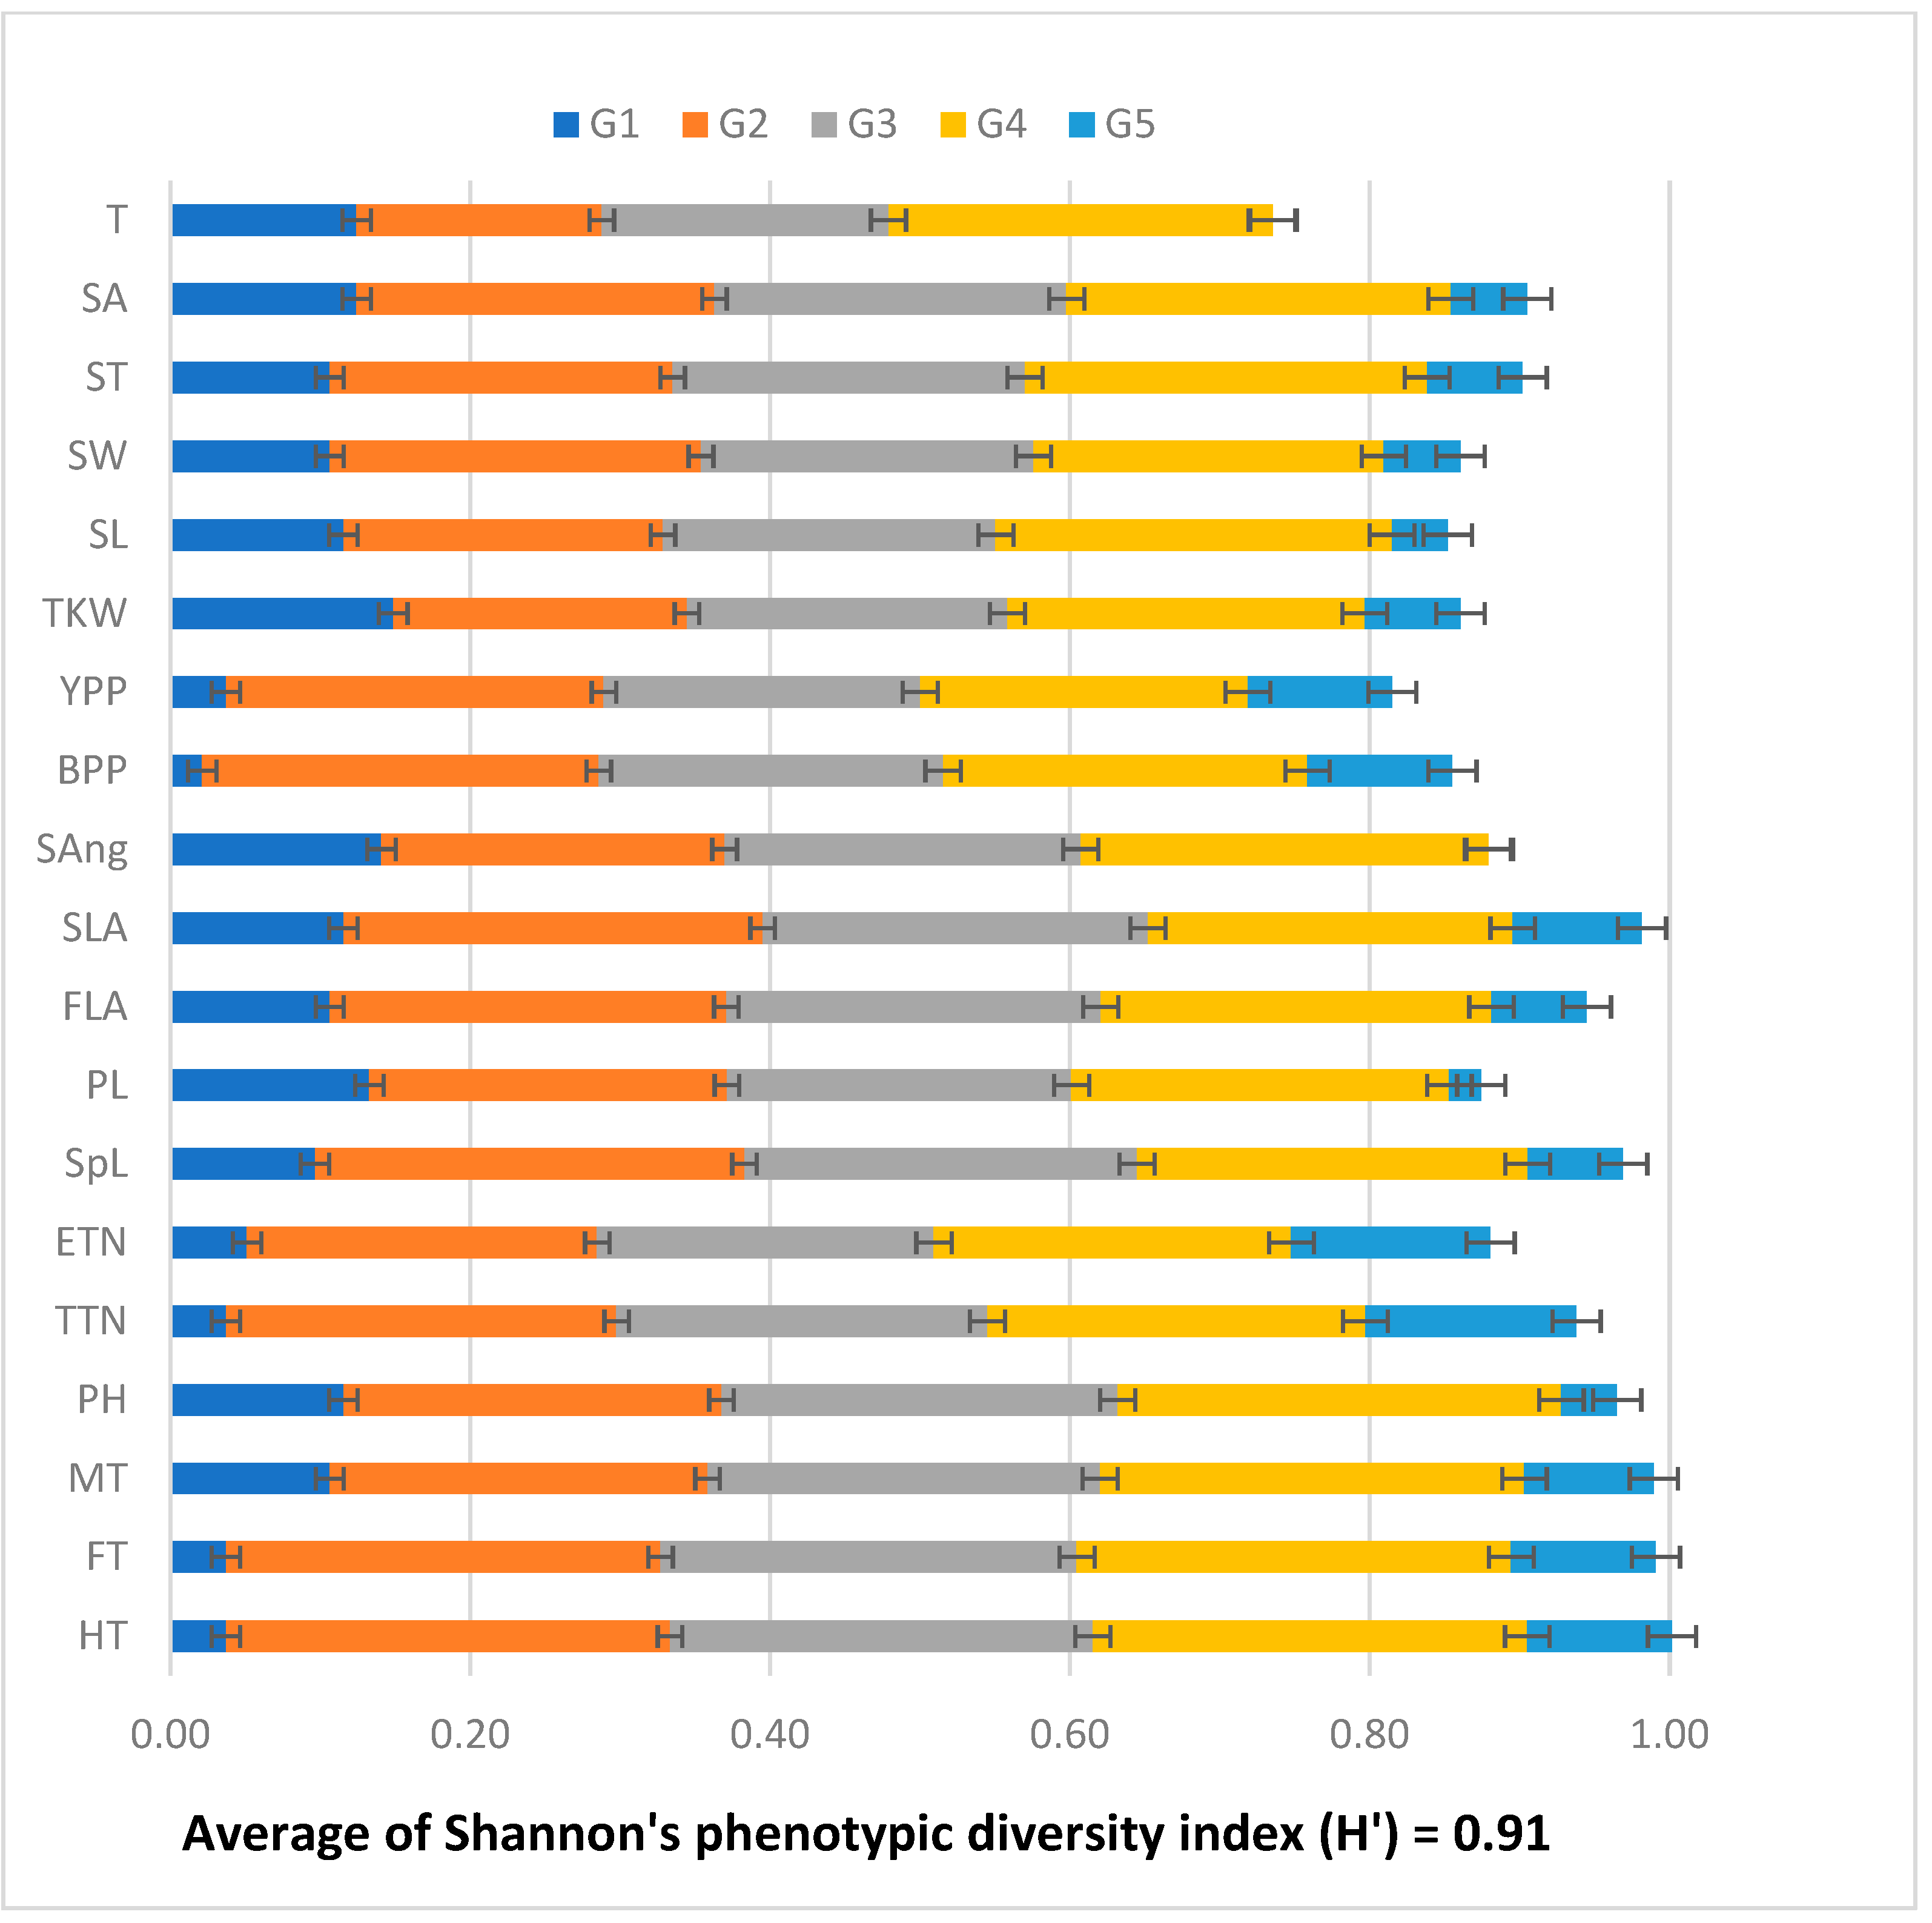
The overall average of Shannon’s phenotypic diversity index (H’) was 0.91, which indicates the presence of a high diversity among accessions considering all traits (Figure 3). The highest diversity was observed in HT followed by FT and MT, indicating a massive diversity across the accessions in plant maturity. PH, SpL, and SLA also demonstrated significant levels of diversity. On the other hand, the WEW accessions were less diversified for the T, followed by YPP and BPP. All of the five groups (G1, G2, G3, G4, and G5) were present in all traits except T and SAng, where the fifth group (G5) was not present.
The average of Shannon’s diversity index (H’) was also calculated individually with the accessions from the same center of origin/location of collection, except North Israel and Iran due to few accessions (Figure 4). All locations were found with highly diversified accessions ranging from 0.79 to 0.92. The highest diversity was found for two populations: Non-specified, Israel, and Lebanon (0.92). Despite having low numbers of accessions, Lebanon had the highest average of Shannon’s diversity index, which indicates that the accessions of Lebanon were more highly diversified than any other populations studied.

3.4. Phenotypic Variability Explained by Accession Origin

A comparative analysis was conducted on all the aboveground traits to observe the overall scenario of different populations. As mentioned before, the North Israel and Iran populations were excluded from this study. A significant difference was observed between the populations (Figure 5). For example, FT and MT varied significantly between populations when the average life cycle period was long due to the environmental influence, i.e., E1 and E2 environments (Figure 5A,B), while it appeared almost uniform in the short life-cycled environment (E3). Notably, accessions of Turkey flowered and completed the life cycle earlier than the others in both E1 and E2, while the accessions of Lebanon and Syria demonstrated longer life cycles in general. A significant variation was also observed among populations for plant height, which was consistent across all environments (Figure 5C). Likewise, Spike length varied significantly among populations and across the environments. Generally, all populations produced bigger spikes in E3 (Figure 5D). It also showed that Central, West, and Non-specified areas of Israel and Turkey exhibited bigger spikes, whereas South Israel and Syria exhibited smaller spikes irrespective of environment. Flag leaf area also varied significantly among all populations of Israel (Central, South, West, EC1, and Non-specified) but showed enormous variability across environments (Figure 5E). On the other hand, accessions of Turkey, Lebanon, and Syria demonstrated fewer variabilities across environments. The shoot angle also varied significantly among populations and environments. Considering all populations, the shoot angle was higher for field trial (E3), followed by E2 and E1. On the other hand, considering all environments, accessions of EC1 showed prostrate-type growths resulting in smaller shoot angles (Figure 5F).
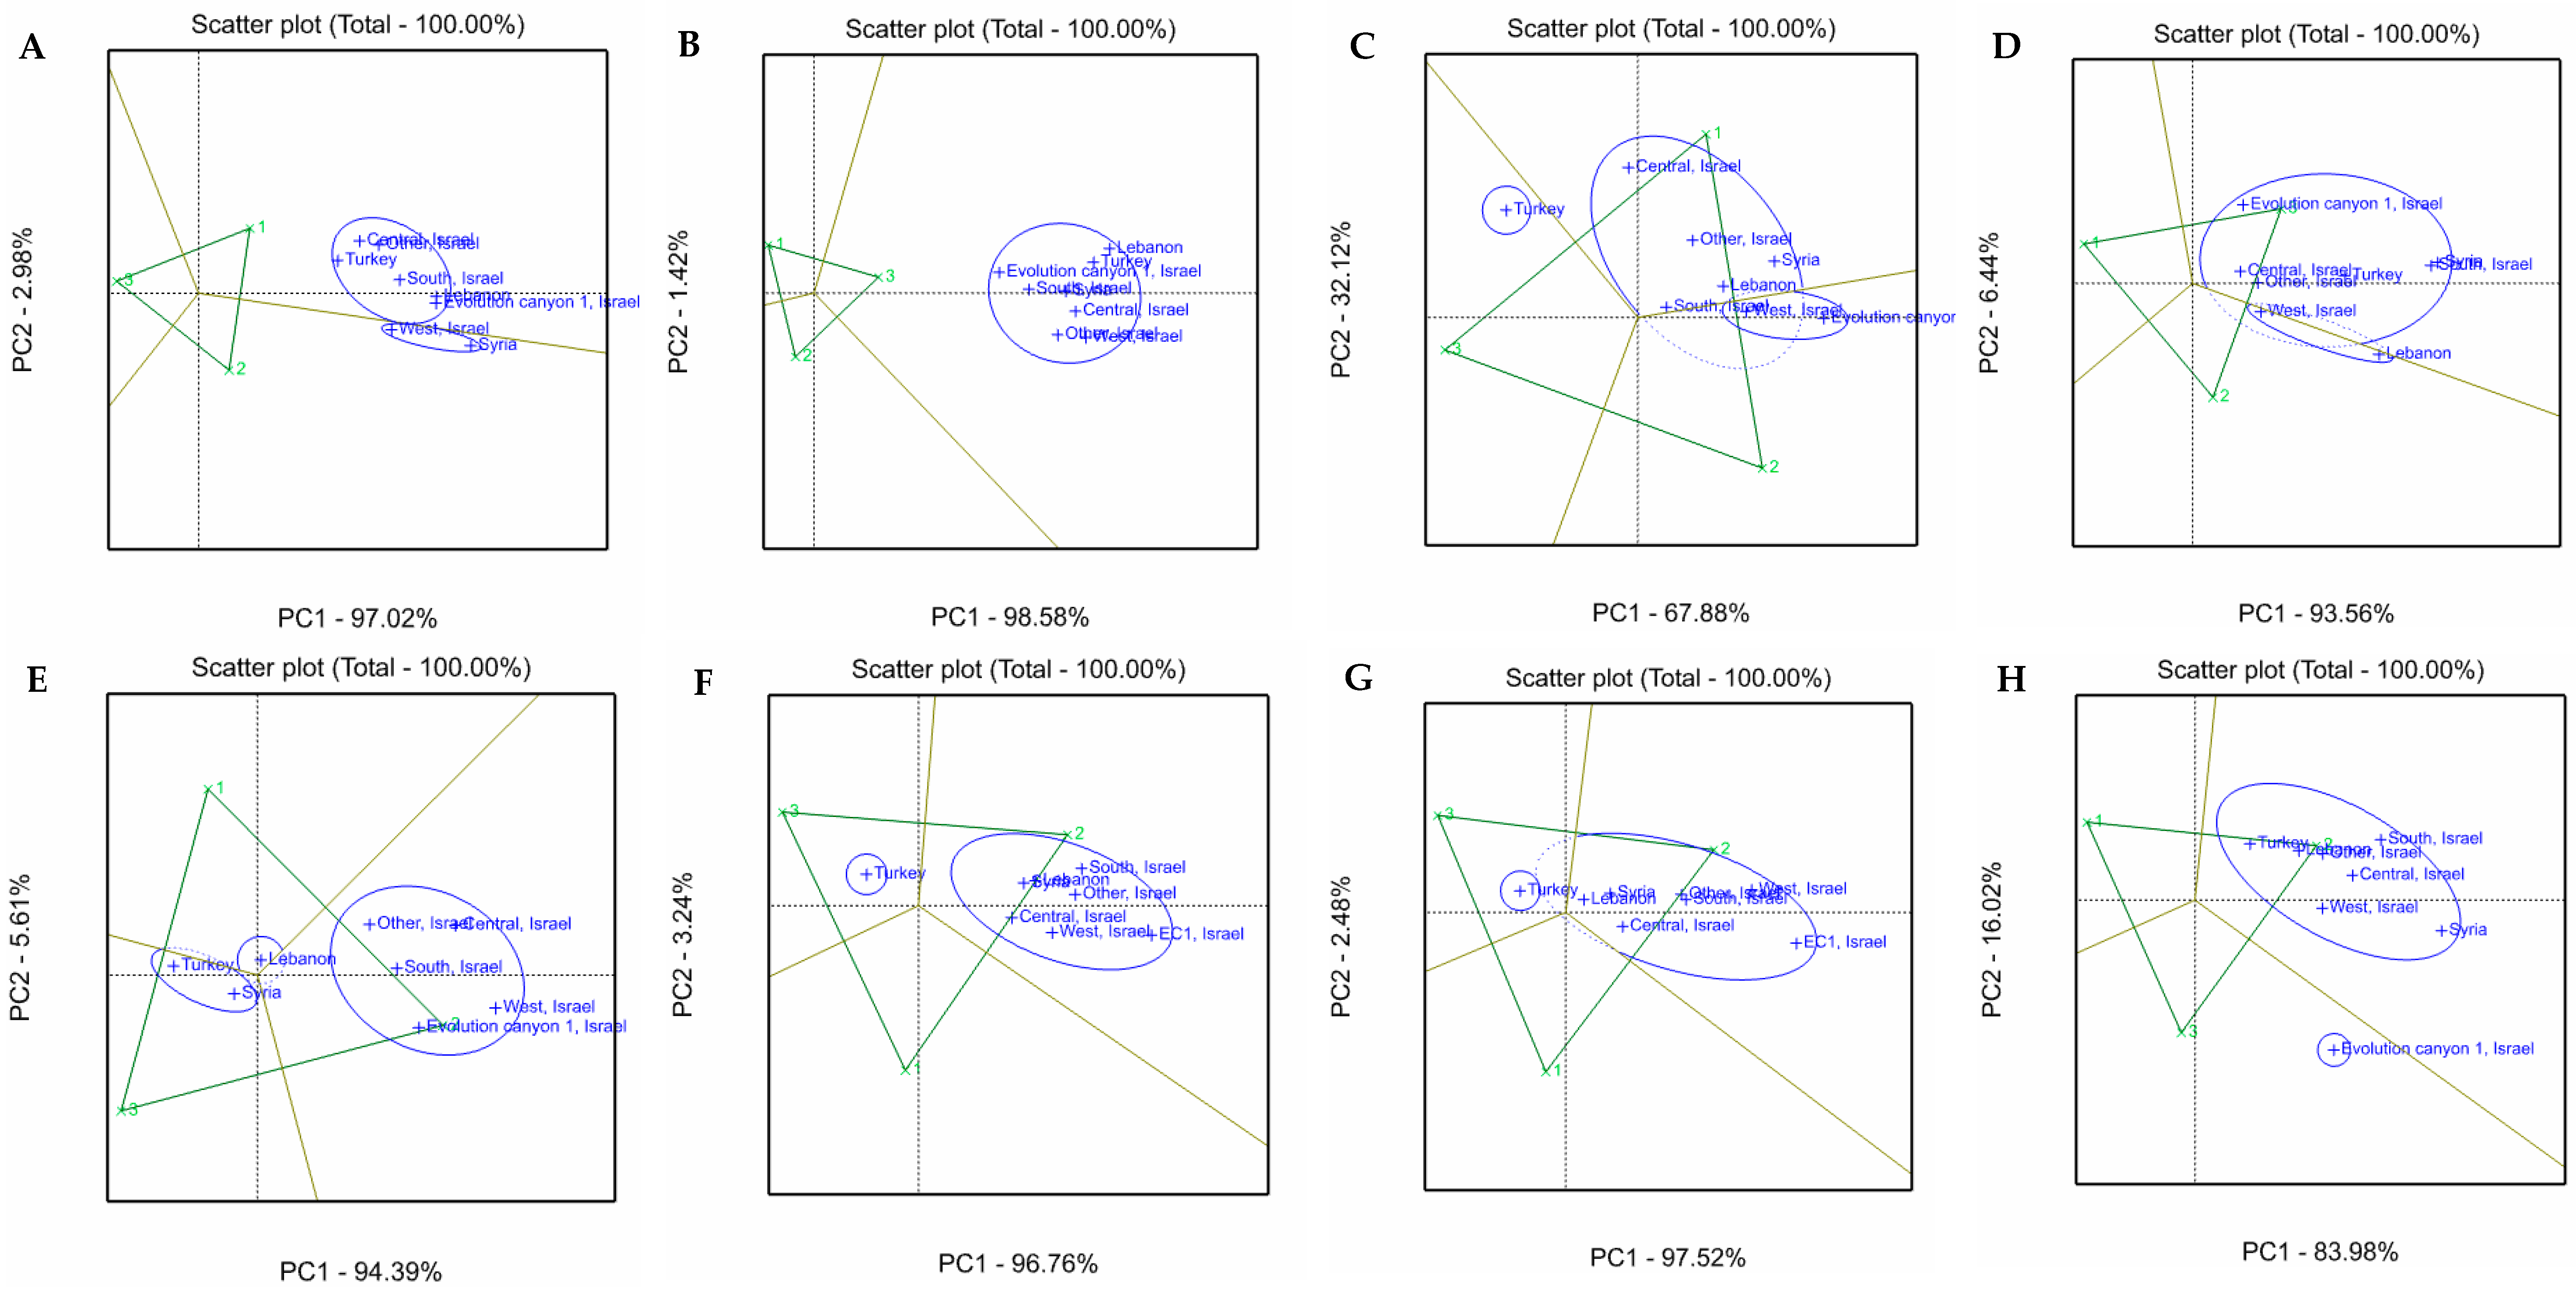
The GGE biplot analysis was based on the performance of different aboveground traits, where populations with similar performances were grouped together into the same mega-populations. Two mega-populations were formed for flowering time, shoot angle, yield/plant, thousand kernel weight, and thresh ability, whereas three mega-populations were formed for plant height and flag leaf area (Figure 6). In most cases, Turkey formed a separate mega-population, particularly for plant height (Figure 6B), flag leaf area (Figure 6E), yield/plant (Figure 6F), and thousand kernel weight (Figure 6G); and accessions of Turkey were found more suitable to field trial (E3), whereas other mega-populations were suitable for either E1 or E2. For flag leaf area (FLA), yield/plant (YPP), and thousand kernel weight (TKW), the first principal coordinate (PC1) efficiently separated the mega-populations (Figure 6E–G). On the other hand, the separation of mega-populations was largely based on the second principal coordinate (PC2) for flowering time (FT) and shoot angle (SA) (Figure 6A,D).

3.5. Ranking Genotype Superiority

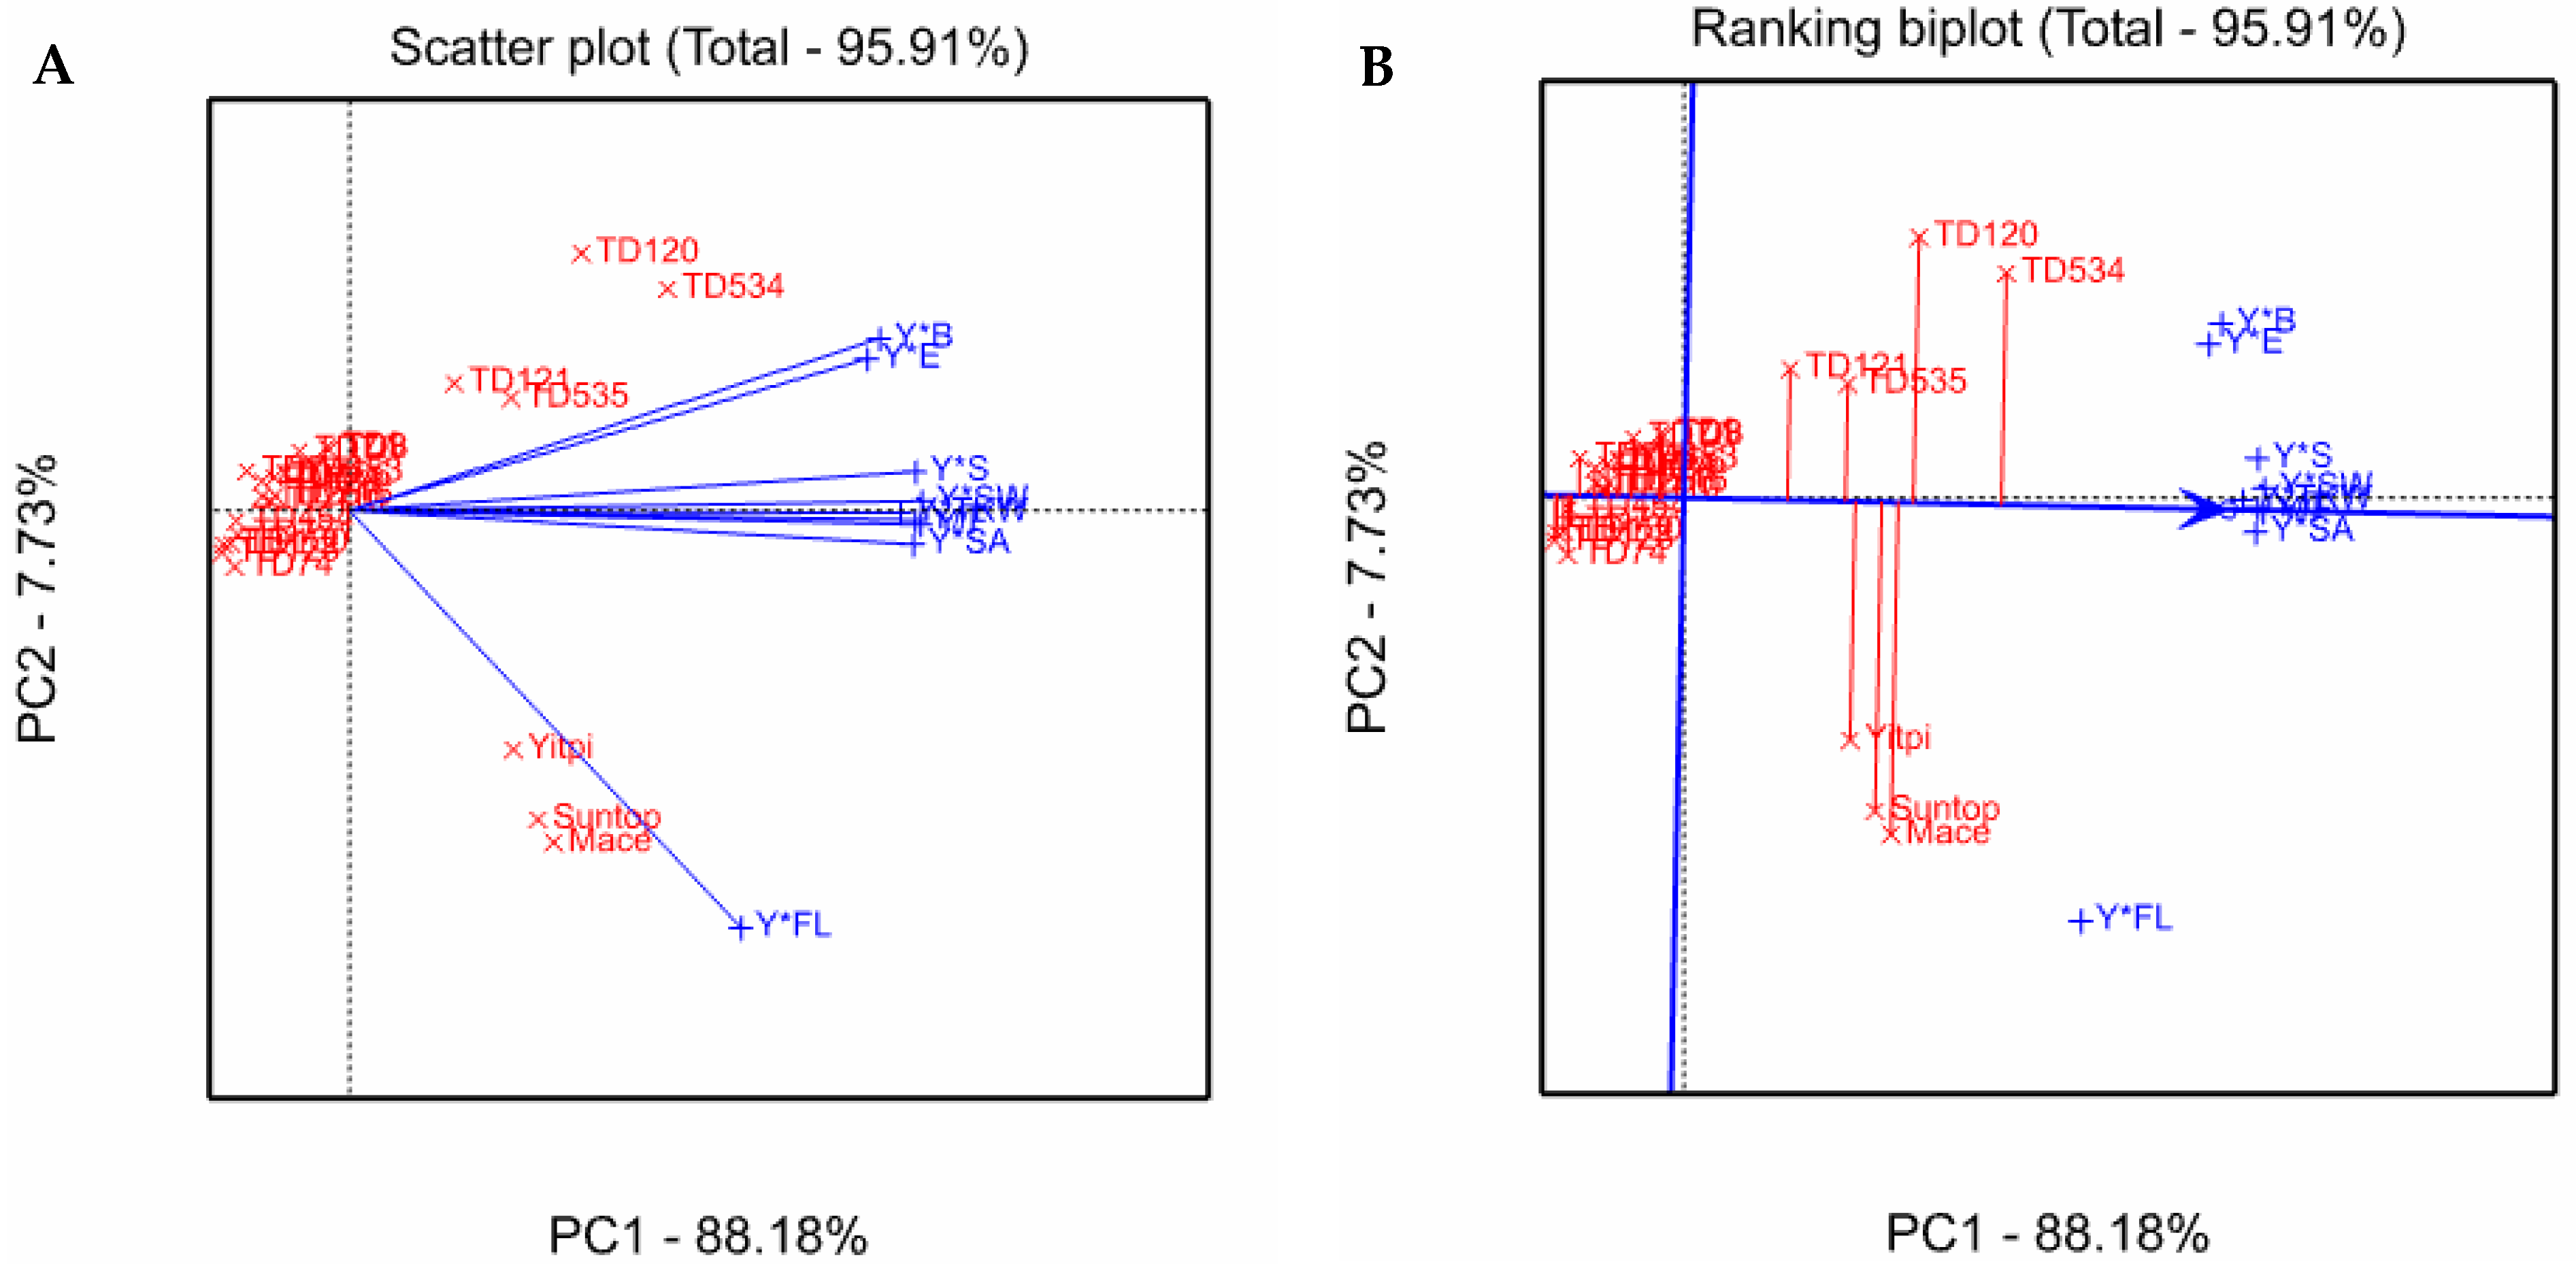
Superior genotypes of wild emmer accessions were ranked using GYT (Genotype by Yield*Trait) biplot analysis. The selected traits include flowering time, effective tiller number, spike length, flag leaf area, shoot angle, biomass/plant, thousand kernel weight, seed width, and threshability due to their significant correlation with yield (Supplementary Table S3). To obtain yield–trait combinations, the yield value was multiplied by trait, i.e., effective tiller number, spike length, flag leaf area, shoot angle, biomass/plant, thousand kernel weight, and seed width, as they are positively associated with yield and termed Y*E, Y*S, Y*FL, Y*SA, Y*B, Y*TKW, and Y*SW, respectively. For flowering time and threshability, the yield value was divided by the trait value as they are negatively associated with yield and termed Y/F and Y/T, respectively.
The superiority index of each accession was calculated from field trial (E3) as the high-yielding bread wheat cultivars (Mace, Suntop, and Yitpi) were only included in this trial as checks (Supplementary Table S6). Performances of some accessions were noticeably better (TD534, TD120, TD535, and TD121). However, a standardized table was calculated for the top 23 genotypes (including 20 wild emmer accessions and 3 check cultivars) for a clear presentation of the GYT biplot (Table 3). The tester vector view of the GYT biplot revealed a strong positive correlation between Y*B and Y*E (Figure 7A). Y/F, Y*S, Y*SA, Y*TKW, Y*SW, and Y/T also had a strong positive correlation with each other. On other hand, Y*FL showed less strong positive correlations with other yield–trait combinations. The ATC (Average Tester Coordination) view of the GYT biplot shows that both TD534 and TD120 performed better than the check cultivars, and the ranking order of some superior genotypes based on yield–trait combinations are TD534 > TD120 > Mace > Suntop > Yitpi > TD535 > TD121 (Figure 7B). Though TD535 and TD121 did not rank better than the check cultivars, they were balanced for all traits, whereas TD534 and TD120 produced higher biomass/plant and effective tiller, but had smaller flag leaf area.
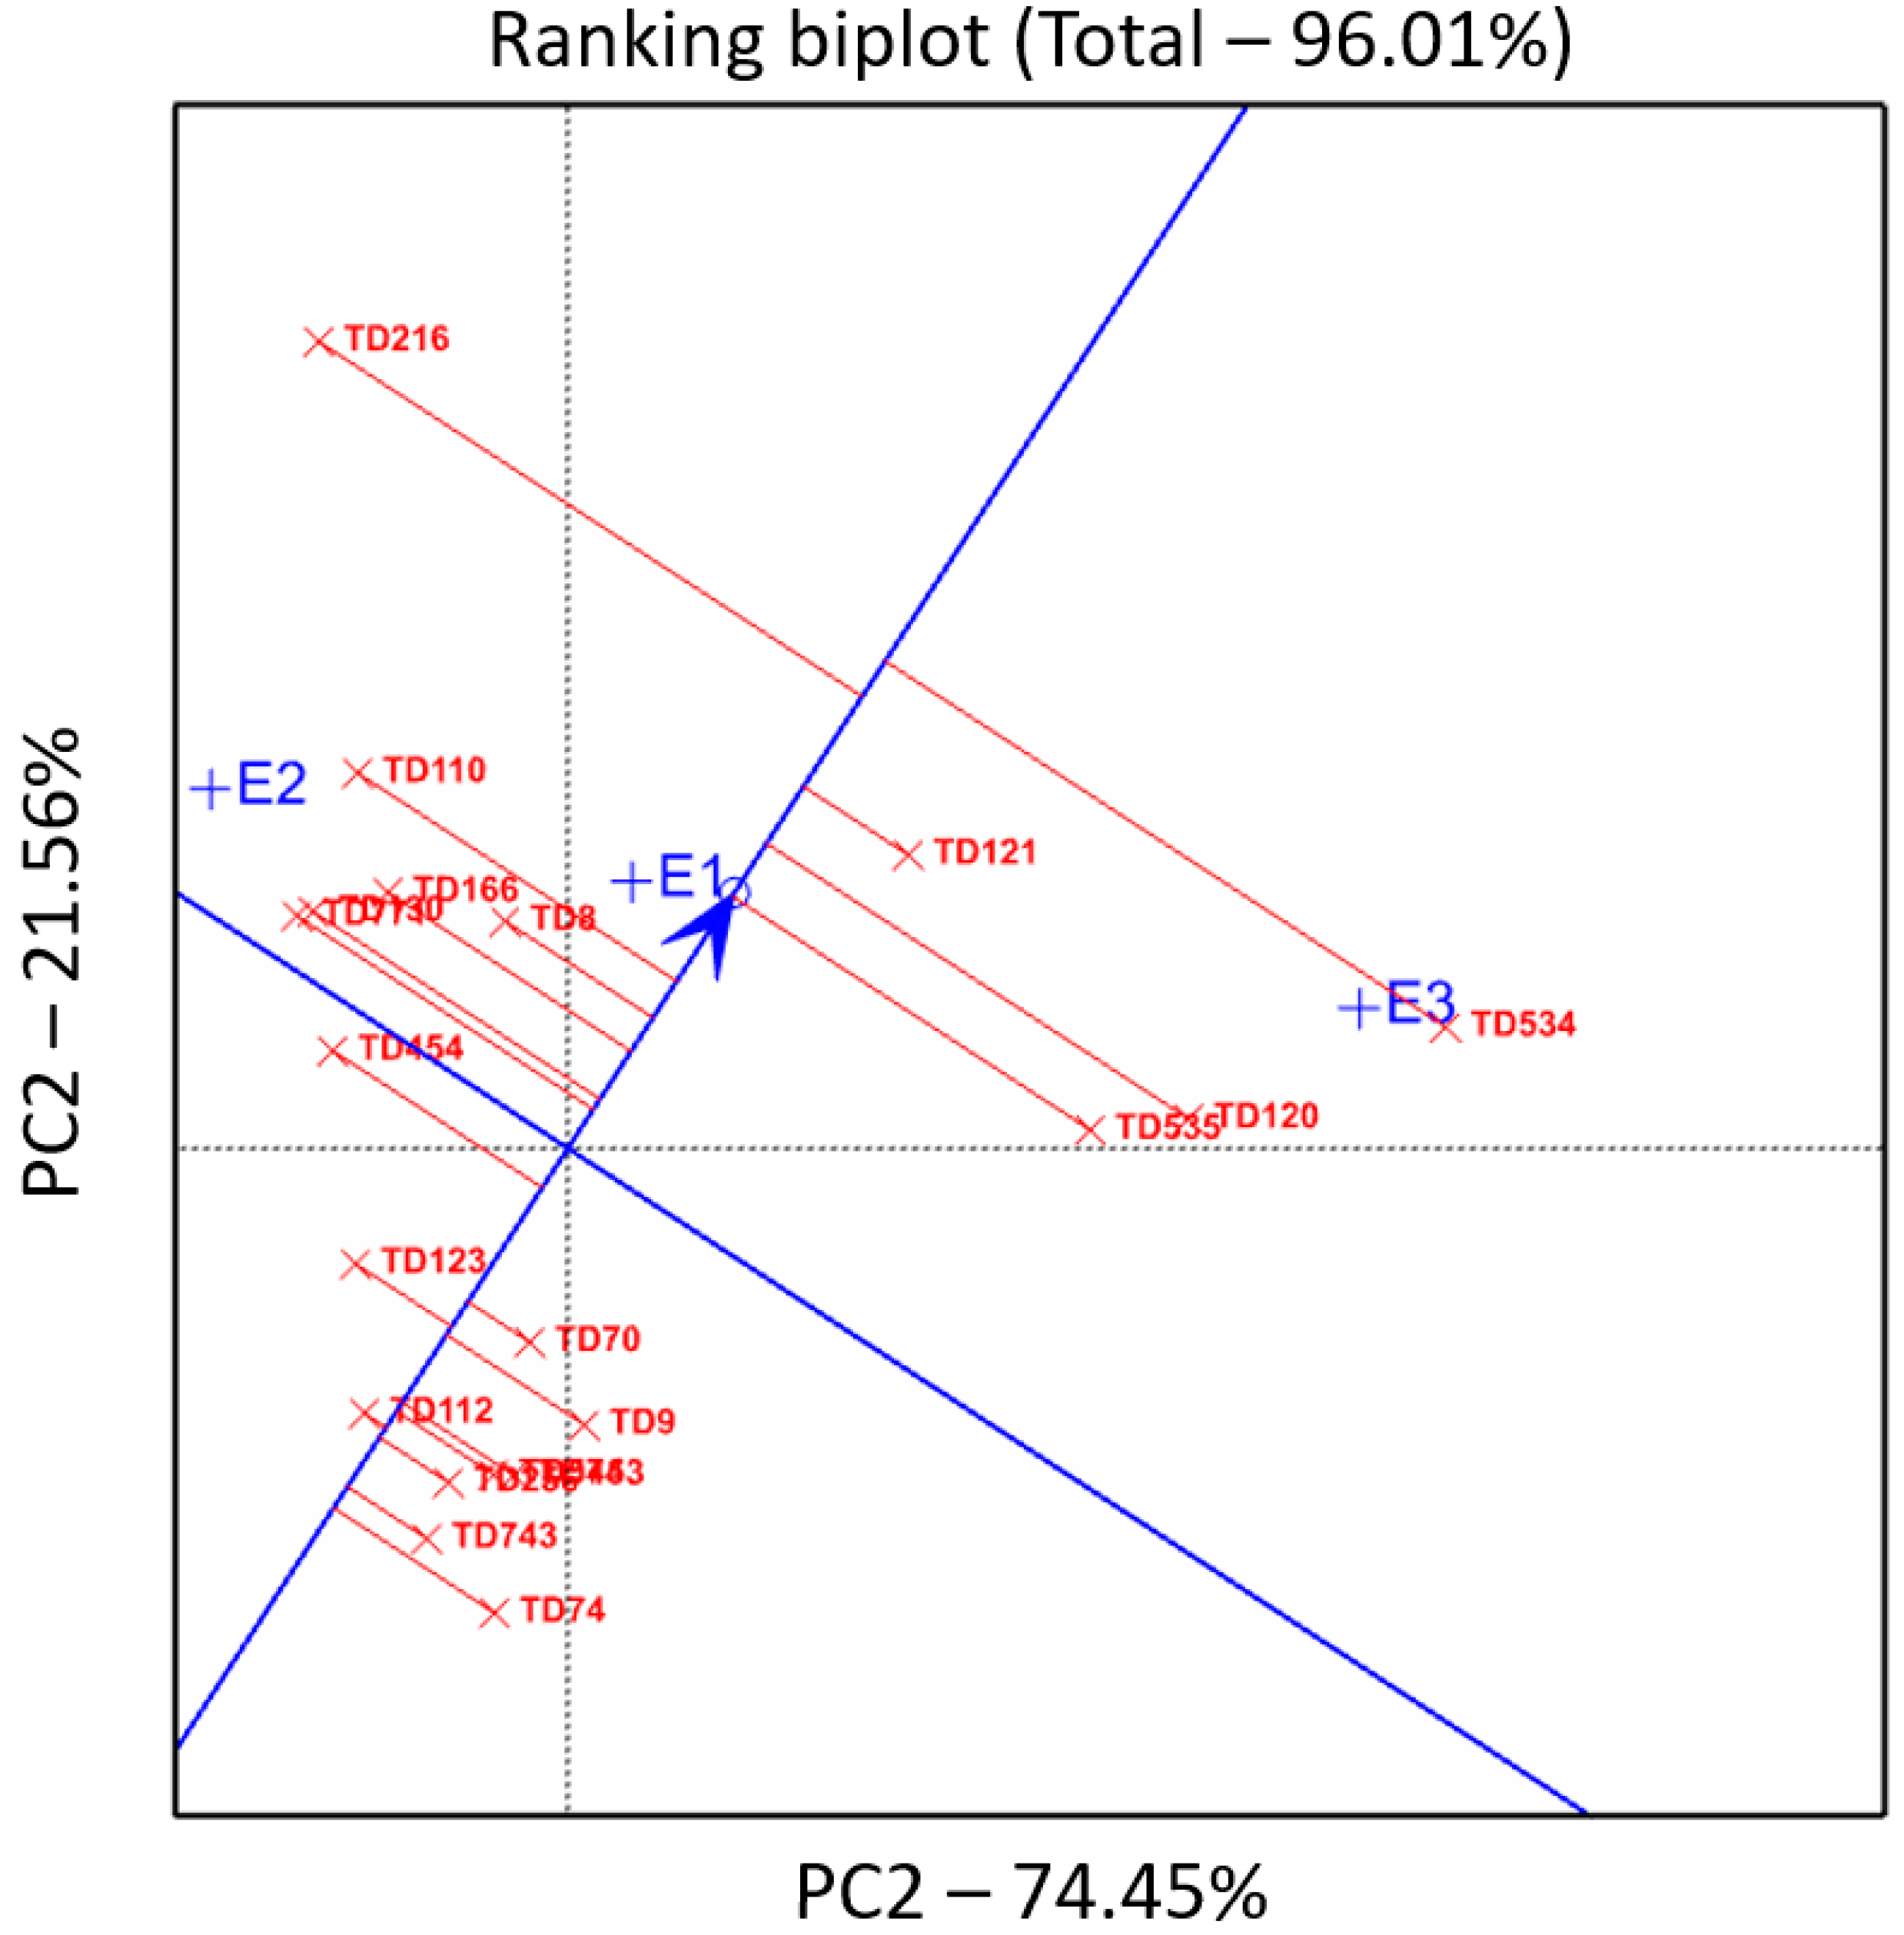
The GYT biplot was conducted only on field trial E3 data as the check cultivars (bread wheat) were used in this environment only. The top 20 wild emmer accessions from this GTY biplot were selected to further conduct a GGE biplot analysis in all three environments (E1, E2, and E3) to observe their performances individually. The ATC view of the GGE biplot showed a clear superior performance of five accessions (TD534, TD216, TD121, TD120, and TD535) over the rest of the accessions (Figure 8). Notably, TD216 ranked lower in the GYT biplot (Figure 7; Table 3) but secured the second position in the GGE plot (Figure 8). This was because TD216 was more suitable for E2, and the GYT plot was made based on the E3 data. However, in the GGE biplot, the ranking order of the top 4 genotypes also changed from the previous one. Here, TD121 performed better than TD120 and TD535, securing the third position from the top. The ranking order of the top five accessions is TD534 > TD216 > TD121 > TD120 > TD535. The performance of TD121 was stable across the environments, whereas TD534, TD120, and TD535 performed better in E3 and TD216 in E2.

4. Discussion

Characterization of diverse genetic resources is important not only for exploring and preserving the germplasm source but also for introducing novel and useful alleles into modern wheat cultivars. Usually, landraces exhibit greater genetic diversity, a higher number of alleles, and potentially new variants compared to modern cultivars [39]. Wild emmer is not an exception to that. Even though molecular markers are largely used in breeding programs, nowadays, morphological markers are still considered the best tool to study genetic diversity [12]. In the current study, an investigation was conducted on 19 major aboveground traits across 263 wild emmer accessions to have a broader view of how those accessions were diversified, which traits can be useful for further breeding, and how the performance of populations varies in the Australian environment.

4.1. Wild Emmer Possesses Wide Variation in Shoot Morphology

All the studied shoot traits of wild emmer showed a wide range of variation in each environment, indicating the first evidence of high genetic variation within the landraces (Figure 1; Supplementary Table S1). Most accessions had considerably higher plant heights, which is common in most of the wheat wild relatives and landraces. Modern wheat, which evolved in the 20th century, has reduced plant height because of the worldwide trend of selecting shorter plants to avoid lodging [40]. In addition to longer plant height, wild wheat landraces are also characterized by late maturity [41]. This lengthy life cycle might be the reason for obtaining higher yield/plant (YPP) in the glasshouse trial (1.05 g/plant in E1 and 1.58 g/plant in E2) compared to the field trial (0.66 g/plant). Though the yield of wild emmer in this study seems better, particularly in the glasshouse trial, it is usually characterized by very poor yield, about only 0.5 g/plant [5]. This means that the cold and humid conditions of the glasshouse were responsible for the late flowering, resulting in a longer vegetative stage and increased yield. Additionally, unlimited plant nutrition boosted plant growth in glasshouse conditions. Biomass/plant was also found higher in the glasshouse trial than in the field trial. Most of the accessions were characterized by higher tiller numbers, indicating significant contributions of straw to biomass. Moreover, most shoot traits of the wild emmer accessions varied from environment to environment, but the presence of a wide variation was evident in every environment. Similar observations were found in wild emmer landraces for grain nutrition-related traits [17] and also in other landraces such as Italian bread wheat accessions [40], Chinese bread wheat landraces [39], and Moroccan durum wheat landraces [42].
The presence of huge diversity in the studied wild emmer germplasm was also confirmed by Shannon’s phenotypic diversity index (H) where the average of Shannon’s phenotypic diversity index (H’) was 0.91, indicating a high variation in all traits (Figure 3). The highest diversity index was observed for life-span-related traits (HT, FT, and MT) with the H value around 1.00. The reason behind such a higher H value could be because accessions were taken from a greater geographical area covering most parts of the Fertile Crescent [27]. For most of the traits, G2, G3, and G4 consist of most accessions, and the number of individuals in each group is very close, whereas G1 and G5 include a relatively smaller number of accessions. This means that while most of the accessions had similarities, a few of them were truly diverse, which could be a good genetic source of diversity. The diversity index value was low for YPP and TKW, which indicates the studied wild emmer accessions were comparatively less diversified for yield-related traits, unlike the other traits. In addition, shoot angles were recorded with a range of 0 to 90°, but no accessions under G5 indicate that most of the studied accessions had a prostrate type of growth. This is common for wild emmer as it has evolved before domestication and the transition from prostrate type to erect type wheat is the result of domestication [12,23]. Similarly, no accessions were found under G5 for threshability, and the majority of the accessions were found under G4, which indicates most of them were hard to thresh.
The presence of a huge variation in all shoot traits in the studied wild emmer germplasm could be important for breeding. For example, flowering time is an important trait for most crop species. While most of the studied wild emmer accessions were late-flowering, a few accessions exhibited quite early flowering of around 57 days (Supplementary Table S1), while hexaploid wheats are typically in the range of 64 to 72 days [43]. This clearly indicates that some wild emmer accessions contain alleles for early flowering. Similarly, spike length is another trait directly related to yield. In the current study, the highest value recorded for spike length was 12.5 cm (Supplementary Table S1); while it usually ranged from 5 to 10 cm in hexaploid cultivars [44]. Flag leaf area is also an important trait since it is the major photosynthetic organ that accumulates assimilates during the grain-filling period [45]. Modern hexaploid wheat cultivars are characterized by flag leaf areas around 34 to 40 cm2 [43,44], whereas most of the studied wild germplasm had a larger flag leaf with the highest value being 76 cm2 (Supplementary Table S1). Likewise, the biomass of a plant is also very important as it has a direct impact on yield. More biomass means more photosynthetic area and more photosynthesis means more storage food, i.e., grain yield. [19]. The highest value of BPP in the current study was 55.46 g (Supplementary Table S1), whereas it ranged only from 8 to 15 g in hexaploid wheat cultivars [43]. Similarly, effective tiller number is another trait that also has an influence on yield. Wild emmer wheat is usually characterized by a high number of tillers, which is not an exception in the current study. Some accessions have up to 14 effective tillers (Supplementary Table S1), whereas in the hexaploid cultivar, it varies from 5 to 8 per plant. Notably, most wild emmer accessions only had 50% effective tillers. The non-effective tillers constitute a large portion of the total biomass, resulting in a high volume of straw. In ancient days, wild landraces were used for straw for the purpose of animal feed [20]. As grain yield was the main target during the domestication process, landraces with high biomass but poor yield were discarded, while landraces with high yield regardless of the biomass were selected in the domestication process.
Clearly, wild emmer has high biomass, high tillering capacity, and a large flag leaf area, but its yield is surprisingly low. Despite having several sources of assimilates, it either cannot efficiently use the photosynthetic area or cannot transport assimilates from source to sink. On the other hand, modern hexaploidy cultivars have a high yield with comparatively low biomass, which suggests the efficient use of absorbed light and transport of assimilates from source to sink. Therefore, if the alleles responsible for high biomass, high tillering capacity, or larger flag leaf area can be identified and incorporated into modern wheat cultivars, there will be a chance of a massive increase in wheat yield. Similarly, alleles for early flowering and larger spike length can also be introduced into modern cultivars. Since wild emmer is cross-compatible with both durum wheat and bread wheat [17], significant improvement in modern cultivars is potentially possible by using the gene pool of wild emmer populations. Several studies have reported alleles from wild emmer accessions that were transferred into bread or durum wheat, such as Pm16 for powdery mildew resistance [46], Yr15 for stripe rust resistance [47], and Gpc-B1 for grain protein content [48].

4.2. Some Traits of Wild Emmer with Potential Breeding Value

Surely, all the studied shoot traits of wild emmer have wide variations. It is important to identify the traits with potential breeding value since evaluating heritable and non-heritable elements of the total genetic variability in a base population is essential for breeding [49,50]. Exploring components of variations such as GCV, PCV, heritability, and genetic advance is essential to estimate the heritable portion of the total genetic variability [51]. For all traits, the PCV values were slightly higher than the GCV value (Table 2), which indicates that the environment has a low impact on traits [25,49]. In addition to GCV and PCV, the estimation of heritability is more helpful as it indicates that the scope of a trait can be improved through selection [52]. In the current study, high broad sense heritability (>60%) was observed for almost all traits (except TTN, ETN, SL, and ST), which indicates that the genotypic effect constitutes the major portion of phenotypic variance; i.e., there is a high possibility of improving these traits by breeding [25,49]. However, heritability together with genetic advance is more accurate to predict genetic gain through selection in advanced generations compared to heritability estimates alone [53]. It is worth mentioning that in the current study, high heritability was observed for HT, FT, MT, PH, and Sang, but with low GA%, whereas biomass/plant (BPP) and yield/plant (YPP) had high estimates for both heritability and genetic advance. This suggests that the additive gene effect is the major component of the observed heritability, and maximum improvement is possible for BPP and YPP through selection [53]. A similar result was found in a worldwide tetraploid durum wheat collection in Iran [25], but the opposite result was found in a Bulgarian winter bread wheat collection [49].
BPP and YPP have been identified as the traits having the most potential for maximum improvement; so, their relationship with other traits was explored by correlation analysis. BPP had a significant positive correlation in E2, but a significant negative correlation in E3 with the life-span-related traits (HT, FT, and MT) (Supplementary Table S3). This indicates all accessions took a longer time to complete the life cycle in the glasshouse trial, resulting in higher biomass. However, YPP had a significant negative correlation with the life-span-related traits in both glasshouse and field trials, which indicates a longer life cycle of wild emmer might produce high biomass, but its impact on yield is not prominent. Supporting previous studies, both BPP and YPP had significant positive correlations with spike length and flag leaf area [43], but surprisingly, FLA has a significant negative association with HT and FT, which means that despite having a longer vegetative stage, wild emmer did not produce larger FLA. Rather, it produced more tillers since positive significant correlations were observed between TTN with all the life-cycle-related traits. Most importantly, TTN had a positive significant correlation with YPP, even higher than the r value between FLA and BPP. This indicates tillering capacity played a significant role in the yield of wild emmer, even more than flag leaf area. This is an interesting observation of this study, because in modern cultivars, only the effective tillers have a positive impact on grain yield, but in wild emmer, non-spike tillers also have a positive effect on grain yield. Most of the wild emmer accessions have prostrate growth; i.e., the growth of the plant in a horizontal direction, which provides more photosynthetic area and might result in an increased yield. However, further research is needed to uncover the real reason.
Despite yield being the main criterion for identifying superior genotypes, it is not the best trait to focus on for wild emmer as its yield is low. Combing other useful traits with yield such as the GYT (Genotype by Yield*Trait) method is more efficient where the superiority of a genotype was measured by combining yield with other important traits [28]. According to the GYT method, some wild emmer accession such as TD534 and TD120 demonstrated outstanding performance, even better than some modern cultivars such as Mace, Yitpi, and Suntop (Table 3). The main reasons behind their outstanding performance were early flowering and high biomass for TD534, and a higher number of effective tillers and high biomass for TD120. Worldwide wheat production has reached its saturation point. Increasing biomass could be a potential way to increase production as biomass is highly correlated with yield. A genotype such as TD534 can be a useful material for breeding where the purposes are earliness and high biomass. Similarly, other superior-ranking genotypes (TD120, TD535, and TD121) are also good materials for breeding. These top four genotypes belong to the Turkey (TD534 and TD535) and Central Israel (TD120 and TD121) populations, indicating that the other accessions from these two populations need to be explored more as their performance was far better than the other populations in Australian field conditions.

4.3. Performances of the Wild Emmer Populations in the Australian Environment Is Trait-Specific

Comparative analysis showed trait-specific variance among the studied eight populations of wild emmer germplasm (Figure 5). For example, in the case of plant height, spike length, and flag leaf area, considerate differences among the populations were found, which were also consistent with the environment. On the other hand, accessions from four different countries (Israel, Turkey, Lebanon, and Syria) demonstrated variation in flowering time and maturity time. However, all the populations within Israel flowered and completed their life cycle at an almost similar time. According to the literature, variation in flowering time is evident even within Israel such as the wild emmer from Gitit (Central, Israel), which flowers in February and matures in March, whereas that from Mt. Hermon (North Israel), flowers in April and matures in May [5]. In the current study, it may be that the differences in flowering times among populations of Israel were not prominent because they share the same microclimatic and geographic environment.
The grouping of similar populations into a mega-population and the suitability of newly formed mega-populations in different Australian environments (E1, E2, and E3) were also trait-specific (Figure 6). In the case of plant height, yield/plant, and thousand kernel weight, the Turkey population formed a separate mega-population and the rest of the populations formed either one or two mega-populations. The separate Turkey mega-population was found more suitable for field trial (E3) while the other mega-populations were suitable for either E1 or E2. In general, wild emmer grows vigorously on the cool and humid slopes of Turkey and the hot and dry valleys of Israel [54]. However, contrasting results were found in the current study; i.e., accessions from Turkey were more suitable for the hot and dry conditions of E3, and accessions from Israel, Syria, and Lebanon were more suitable for the cool and humid conditions of E1 and E2. This may be due to a strong G x E interaction. Other environmental factors such as soil condition, elevation, salinity, day, and night temperature variation, etc., might have made this alteration, and a detailed investigation is needed to find the actual reason for this contrasting result.
Lebanon had the highest Shannon’s diversity index value, and those from Syria had the lowest (Figure 4). Landraces covering a wide geographic area usually have wide diversity and our study also supports this concept; e.g., the diversity index of all accessions (Israel, Turkey, Lebanon, and Syria) is 0.91, whereas the Israel population alone is 0.87. Similar to our study, the diversity index is quite high (1.01) in a worldwide collection of durum wheat covering a wide geographic area of 15 countries whereas it was only 0.89 in Iranian landraces of durum wheat [25]. Within Israel, the highest H’ (0.92) was found in Non-specified Israel populations because the accessions are from all over the country. The second highest diversity index was found in Central Israel populations (0.90) and the lowest diversity index was found in South Israel populations (0.80). Similarly, a study on the vernalization response of wild emmer demonstrated the presence of large variations in the central populations, whereas the variations were relatively low in the southern populations [9].

5. Conclusions

Wild emmer has been studied previously for qualitative, biotic, and abiotic stress-related traits. In this study, we have conducted a detailed investigation of 19 agronomic and shoot morphological traits, all of which demonstrated large diversities. Some of the accessions were found promising with early flowering, higher tiller number, larger spike, bigger first leaf area, and higher biomass. This means the studied wild emmer germplasm has a unique and useful gene pool that can be incorporated into modern cultivars. This study also revealed that wild emmer collected from different locations performed differently in Australian environments, indicating a strong genotype–environment interaction. Moreover, modern wheat is characterized by a high-yielding capacity but further improving yield is difficult due to the existing morphological regime. Altering the morphological features by utilizing novel gene pools from wild emmer germplasm can potentially be an effective way for yield improvement.

Supplementary Materials

The following supporting information can be downloaded at https://www.mdpi.com/article/10.3390/agriculture13040759/s1, Figure S1: Phenotyping of shoot angle (A, B and C) and threshing (D, E, F and G). Shoot angle means average of angle between effective tillers and soil surface (almost 90o (A), around 45° (B) and close to 0° (C)). Scoring of threshability at a scale of 1 to 4 where 1 = completely free-threshing with virtually all seed released from the hulls (D), 2 = mostly free-threshing with a minor portion of the seed remaining hull (E), 3 = somewhat difficult to thresh with a major portion of the seed remaining hulled (F), and 4 = difficult to thresh with only a few seeds being released from the hulls (G); Table S1: Descriptive data including mean, average coefficients of variation (AVC%) and range for 19 above ground traits in three environments (E1, E2 and E3) along with their average value; Table S2: Analysis of variance (ANOVA) table for above ground traits in three environments of 263 wild emmer accessions; Table S3: Pearson’s correlation between different shoot traits in E1, E2 and E3; Table S4: Principal component analysis for above ground traits of three environments; Table S5: Grouping of accessions using cluster analysis based on principal component analysis performed in three environments separately. Table S6: Standardized genotype by yield*trait (GYT) data along with superiority index. Top 23 ranked genotypes are highlighted here. The trait abbreviations are: Y: Yield; F: Flowering time; E: Effective tiller number; S: Spike length; FL: Flag leaf area; SA: Shoot angle; B: Biomass/plant; TKW: Thousand kernel weight; SW: Seed width and T: Threshability.

Author Contributions

S.R. conducted experimental trials, collected data, performed data analysis, and prepared the first draft. S.I. sourced plant material, conceptualized experimental design, provided supervision, and edited manuscript. E.N. provided plant material from Israel. M.A.U.S. and Q.L. helped to set up the trials and to collect data. R.K.V. edited the manuscript. W.M. provided supervision, managed funding, and revised the manuscript. All authors have read and agreed to the published version of the manuscript.

Funding

This research was funded by MIPS (Murdoch university Postgraduate Scholarship).

Institutional Review Board Statement

Not applicable.

Data Availability Statement

Not applicable.

Acknowledgments

Authors would like to acknowledge State Agricultural Biotechnology Centre (SABC) for providing laboratory and glasshouse facilities, and Department of Primary Industries and Regional Development (DPIRD) for providing field trial facilities.

Conflicts of Interest

The authors declare no conflict of interest.

References

  1. FAO. World Food and Agriculture—Statistical Yearbook 2020; FAO: Rome, Italy, 2020. [Google Scholar]
  2. Enghiad, A.; Ufer, D.; Countryman, A.M.; Thilmany, D.D. An Overview of Global Wheat Market Fundamentals in an Era of Climate Concerns. Int. J. Agron. 2017, 2017, 3931897. [Google Scholar] [CrossRef]
  3. Avni, R.; Nave, M.; Barad, O.; Baruch, K.; Twardziok, S.O.; Gundlach, H.; Hale, I.; Mascher, M.; Spannagl, M.; Wiebe, K. Wild emmer genome architecture and diversity elucidate wheat evolution and domestication. Science 2017, 357, 93–97. [Google Scholar] [CrossRef] [PubMed]
  4. Rahman, S.; Islam, S.; Yu, Z.; She, M.; Nevo, E.; Ma, W. Current progress in understanding and recovering the wheat genes lost in evolution and domestication. Int. J. Mol. Sci. 2020, 21, 5836. [Google Scholar] [CrossRef]
  5. Peng, J.; Sun, D.; Peng, Y.; Nevo, E. Gene discovery in Triticum dicoccoides, the direct progenitor of cultivated wheats. Cereal Res. Commun. 2013, 41, 1–22. [Google Scholar] [CrossRef]
  6. Jorgensen, C.; Luo, M.C.; Ramasamy, R.; Dawson, M.; Gill, B.S.; Korol, A.B.; Distelfeld, A.; Dvorak, J. A High-Density Genetic Map of Wild Emmer Wheat from the Karaca Dag Region Provides New Evidence on the Structure and Evolution of Wheat Chromosomes. Front Plant Sci 2017, 8, 1798. [Google Scholar] [CrossRef]
  7. Matsuoka, Y. Evolution of polyploid Triticum wheats under cultivation: The role of domestication, natural hybridization and allopolyploid speciation in their diversification. Plant Cell Physiol. 2011, 52, 750–764. [Google Scholar] [CrossRef]
  8. Gornicki, P.; Zhu, H.; Wang, J.; Challa, G.S.; Zhang, Z.; Gill, B.S.; Li, W. The chloroplast view of the evolution of polyploid wheat. New Phytol. 2014, 204, 704–714. [Google Scholar] [CrossRef]
  9. Kato, K.; Mori, Y.; Beiles, A.; Nevo, E. Geographical variation in heading traits in wild emmer wheat, Triticum dicoccoides. I. Variation in vernalization response and ecological differentiation. Theor. Appl. Genet. 1997, 95, 546–552. [Google Scholar]
  10. Plekhanova, E.; Vishnyakova, M.A.; Bulyntsev, S.; Chang, P.L.; Carrasquilla-Garcia, N.; Negash, K.; von Wettberg, E.; Noujdina, N.; Cook, D.R.; Samsonova, M.G. Genomic and phenotypic analysis of Vavilov’s historic landraces reveals the impact of environment and genomic islands of agronomic traits. Sci. Rep. 2017, 7, 4816. [Google Scholar] [CrossRef]
  11. Khodadadi, M.; Fotokian, M.H.; Miransari, M. Genetic diversity of wheat (Triticum aestivum L.) genotypes based on cluster and principal component analyses for breeding strategies. Aust. J. Crop Sci. 2011, 5, 17–24. [Google Scholar]
  12. Mengistu, D.K.; Kiros, A.Y.; Pè, M.E. Phenotypic diversity in Ethiopian durum wheat (Triticum turgidum var. durum) landraces. Crop J. 2015, 3, 190–199. [Google Scholar] [CrossRef]
  13. Talini, R.F.; Brandolini, A.; Miculan, M.; Brunazzi, A.; Vaccino, P.; Pè, M.E.; Dell’Acqua, M. Genome-wide association study of agronomic and quality traits in a world collection of the wild wheat relative Triticum urartu. Plant J. 2020, 102, 555–568. [Google Scholar] [CrossRef]
  14. Bohra, A.; Kilian, B.; Sivasankar, S.; Caccamo, M.; Mba, C.; McCouch, S.R.; Varshney, R.K. Reap the crop wild relatives for breeding future crops. Trends Biotechnol. 2021, 40, 412–431. [Google Scholar] [CrossRef]
  15. Peng, J.; Ronin, Y.; Fahima, T.; Röder, M.S.; Li, Y.; Nevo, E.; Korol, A. Domestication quantitative trait loci in Triticum dicoccoides, the progenitor of wheat. Proc. Natl. Acad. Sci. USA 2003, 100, 2489–2494. [Google Scholar] [CrossRef]
  16. Zaharieva, M.; Ayana, N.G.; Hakimi, A.A.; Misra, S.C.; Monneveux, P. Cultivated emmer wheat (Triticum dicoccon Schrank), an old crop with promising future: A review. Genet. Resour. Crop Evol. 2010, 57, 937–962. [Google Scholar] [CrossRef]
  17. Chatzav, M.; Peleg, Z.; Ozturk, L.; Yazici, A.; Fahima, T.; Cakmak, I.; Saranga, Y. Genetic diversity for grain nutrients in wild emmer wheat: Potential for wheat improvement. Ann. Bot. 2010, 105, 1211–1220. [Google Scholar] [CrossRef]
  18. Law, C.; Sutka, J.; Worland, A. A genetic study of day-length response in wheat. Heredity 1978, 41, 185–191. [Google Scholar] [CrossRef]
  19. Simkin, A.J.; López-Calcagno, P.E.; Raines, C.A. Feeding the world: Improving photosynthetic efficiency for sustainable crop production. J. Exp. Bot. 2019, 70, 1119–1140. [Google Scholar] [CrossRef]
  20. Rawashdeh, N.K.; Haddad, N.I.; Al-Ajlouni, M.M.; Turk, M.A. Phenotypic diversity of durum wheat (Triticum durum Desf.) from Jordan. Genet. Resour. Crop Evol. 2007, 54, 129–138. [Google Scholar] [CrossRef]
  21. Stanley, J.D.; Mehring, G.H.; Wiersma, J.J.; Ransom, J.K. A Standardized Method for Determining Tillering Capacity of Wheat Cultivars. Am. J. Plant Sci. 2020, 11, 604. [Google Scholar] [CrossRef]
  22. Huang, L.; Feng, L.; He, Y.; Tang, Z.; He, J.; Sela, H.; Krugman, T.; Fahima, T.; Liu, D.; Wu, B. Variation in stripe rust resistance and morphological traits in wild emmer wheat populations. Agronomy 2019, 9, 44. [Google Scholar] [CrossRef]
  23. Tan, L.; Li, X.; Liu, F.; Sun, X.; Li, C.; Zhu, Z.; Fu, Y.; Cai, H.; Wang, X.; Xie, D. Control of a key transition from prostrate to erect growth in rice domestication. Nat. Genet. 2008, 40, 1360–1364. [Google Scholar] [CrossRef]
  24. Dong, H.; Zhao, H.; Xie, W.; Han, Z.; Li, G.; Yao, W.; Bai, X.; Hu, Y.; Guo, Z.; Lu, K. A novel tiller angle gene, TAC3, together with TAC1 and D2 largely determine the natural variation of tiller angle in rice cultivars. PLoS Genet. 2016, 12, e1006412. [Google Scholar] [CrossRef]
  25. Mohammadi, R.; Amri, A. Phenotypic diversity and relationships among a worldwide durum wheat (Triticum turgidum L. var. durum) germplasm collection under rainfed conditions of Iran. Crop Pasture Sci. 2013, 64, 87–99. [Google Scholar] [CrossRef]
  26. Hailu, F.; Merker, A.; Belay, G.; Johansson, E. Multivariate analysis of diversity of tetraploid wheat germplasm from Ethiopia. Genet. Resour. Crop Evol. 2006, 53, 1089–1098. [Google Scholar] [CrossRef]
  27. Chakravorty, A.; Ghosh, P.; Sahu, P. Multivariate analysis of phenotypic diversity of landraces of rice of West Bengal. J. Exp. Agric. Int. 2013, 3, 110–123. [Google Scholar] [CrossRef]
  28. Yan, W.; Frégeau-Reid, J. Genotype by Yield* Trait (GYT) Biplot: A novel approach for genotype selection based on multiple traits. Sci. Rep. 2018, 8, 8242. [Google Scholar] [CrossRef]
  29. Ghaedrahmati, M. Assessment of relationships among traits and selection of superior bread wheat genotypes using genotype by yield× trait biplot method. Cereal Res. 2020, 10, 61–72. [Google Scholar]
  30. Mohammadi, R. Genotype by yield* trait biplot for genotype evaluation and trait profiles in durum wheat. Cereal Res. Commun. 2019, 47, 541–551. [Google Scholar] [CrossRef]
  31. Woyann, L.G.; Meira, D.; Zdziarski, A.D.; Matei, G.; Milioli, A.S.; Rosa, A.C.; Madella, L.A.; Benin, G. Multiple-trait selection of soybean for biodiesel production in Brazil. Ind. Crops Prod. 2019, 140, 111721. [Google Scholar] [CrossRef]
  32. Boureima, S.; Abdoua, Y. Genotype by Yield* Trait Combination Biplot Approach to Evaluate Sesame Genotypes on Multiple Traits Basis. Turk. J. Field Crops 2019, 24, 237–244. [Google Scholar] [CrossRef]
  33. de Oliveira, T.R.A.; de Amaral Gravina, G.; de Moura Rocha, M.; de Alcântara Neto, F.; da Cruz, D.P.; de Oliveira, G.H.F.; da Costa Jaeggi, M.E.P.; Rocha, R.S. GYT biplot analysis: A new approach for cowpea line selection. J. Exp. Agric. Int. 2019, 41, 1–9. [Google Scholar] [CrossRef]
  34. Nevo, E. Genetic resources of wild emmer, Triticum dicoccoides, for wheat improvement in the third millennium. Isr. J. Plant Sci. 2001, 49, 77–92. [Google Scholar] [CrossRef]
  35. Faris, J.D.; Zhang, Z.; Chao, S. Map-based analysis of the tenacious glume gene Tg-B1 of wild emmer and its role in wheat domestication. Gene 2014, 542, 198–208. [Google Scholar] [CrossRef]
  36. Johnson, H.W.; Robinson, H.; Comstock, R. Estimates of genetic and environmental variability in soybeans 1. Agron. J. 1955, 47, 314–318. [Google Scholar] [CrossRef]
  37. Burton, G.W. Quantitative inheritance in grasses. Pro VI Int. Grassl Cong. 1952, 1952, 277–283. [Google Scholar]
  38. Comstock, R.; Robinson, H. Genetic parameters, their estimation and significance. In Proceedings of the 6th International Grassland Congress, State College, PA, USA, 17–23 August 1952; pp. 248–291. [Google Scholar]
  39. Liu, Y.; Lin, Y.; Gao, S.; Li, Z.; Ma, J.; Deng, M.; Chen, G.; Wei, Y.; Zheng, Y. A genome-wide association study of 23 agronomic traits in Chinese wheat landraces. Plant J. 2017, 91, 861–873. [Google Scholar] [CrossRef]
  40. Ormoli, L.; Costa, C.; Negri, S.; Perenzin, M.; Vaccino, P. Diversity trends in bread wheat in Italy during the 20th century assessed by traditional and multivariate approaches. Sci. Rep. 2015, 5, 8574. [Google Scholar] [CrossRef]
  41. Gurcan, K.; Demirel, F.; Tekin, M.; Demirel, S.; Akar, T. Molecular and agro-morphological characterization of ancient wheat landraces of turkey. BMC Plant Biol. 2017, 17, 171. [Google Scholar] [CrossRef]
  42. Zarkti, H.; Ouabbou, H.; Udupa, S.M.; Gaboun, F.; Hilali, A. Agro-morphological variability in durum wheat landraces of Morocco. Aust. J. Crop Sci. 2012, 6, 1172–1178. [Google Scholar]
  43. Al-Habbar, Z. Improve Nitrogen Use Efficiency of Wheat Cultivars under Western Australian Conditions. Ph.D. Thesis, Murdoch University, Murdoch, Australia, 2018. [Google Scholar]
  44. Sultana, N. Characterization of TaNAC-S Gene in Australian Wheat Cultivars in Relation to Senescence and Nitrogen Stress Response. Ph.D. Thesis, Murdoch University, Murdoch, Australia, 2020. [Google Scholar]
  45. Ali, M.; Hussain, M.; Khan, M.; Ali, Z.; Zulkiffal, M.; Anwar, J.; Sabir, W.; Zeeshan, M. Source-sink relationship between photosynthetic organs and grain yield attributes during grain filling stage in spring wheat (Triticum aestivum). Int. J. Agric. Biol 2010, 12, 509–515. [Google Scholar]
  46. Chen, X.; Luo, Y.; Xia, X.; Xia, L.; Chen, X.; Ren, Z.; He, Z.; Jia, J. Chromosomal location of powdery mildew resistance gene Pm16 in wheat using SSR marker analysis. Plant Breed. 2005, 124, 225–228. [Google Scholar] [CrossRef]
  47. Hovmøller, M. Sources of seedling and adult plant resistance to Puccinia striiformis f. sp. tritici in European wheats. Plant Breed. 2007, 126, 225–233. [Google Scholar] [CrossRef]
  48. DePauw, R.; Townley-Smith, T.; Humphreys, G.; Knox, R.; Clarke, F.; Clarke, J. Lillian hard red spring wheat. Can. J. Plant Sci. 2005, 85, 397–401. [Google Scholar] [CrossRef]
  49. Desheva, G.; Kyosev, B. Genetic diversity assessment of common winter wheat (Triticum aestivum L.) genotypes. Emir. J. Food Agric. 2015, 27, 283–290. [Google Scholar]
  50. Shukla, S.; Bhargava, A.; Chatterjee, A.; Srivastava, A.; Singh, S. Genotypic variability in vegetable amaranth (Amaranthus tricolor L. for foliage yield and its contributing traits over successive cuttings and years. Euphytica 2006, 151, 103–110. [Google Scholar] [CrossRef]
  51. Shashikala, S. Analysis of Genetic Diversity in Wheat. Ph.D. Thesis, University of Agricultural Sciences GKVK, Banglore, Imdia, 2006. [Google Scholar]
  52. Robinson, H.; Comstock, R.E.; Harvey, P. Estimates of heritability and the degree of dominance in corn. Agron. J. 1949, 41, 353–359. [Google Scholar] [CrossRef]
  53. Anshuman, V.; Dixit, N.; Sharma, S.; Marker, S. Studies on heritability and genetic advance estimates in maize genotypes. Biosci. Discov. 2013, 4, 165–168. [Google Scholar]
  54. Özkan, H.; Willcox, G.; Graner, A.; Salamini, F.; Kilian, B. Geographic distribution and domestication of wild emmer wheat (Triticum dicoccoides). Genet. Resour. Crop Evol. 2011, 58, 11–53. [Google Scholar] [CrossRef]
Figure 1. Box plot of the distributions of some aboveground traits including (A) heading time, HT (in days); (B) flowering time, FT (in days); (C) maturity time, MT (in days); (D) plant height, PH (in cm); (E) total tiller number, TTN; (F) effective tiller number, ETN; (G) spike length, SpL (in cm); (H) peduncle length, PL (in cm); (I) flag leaf area, FLA (in cm2); (J) second leaf area, SLA (in cm2); (K) shoot angle, SAng (in degrees); (L) biomass/plant, BPP (in gm); (M) yield/plant, YPP (in gm); (N) thousand kernel weight, TKW (in gm); and (O) threshability, T (scored on a 1–4 scale; 1 = completely free-threshing and 4 = difficult to thresh). E1, E2, and E3 on X axis represent three experimental environments as detailed in the Materials and Methods section.
Agriculture 13 00759 g001
Figure 2. Component plot produced from principal component analysis on the aboveground traits of wild emmer accessions for E1 (A), E2 (B), and E3 (C); Biplot vectors are trait factor loadings for PC1 and PC2. Dendrogram shows grouping of accessions into clusters for E1 (D), E2 (E), and E3 (F) using corresponding principal component analysis.
Agriculture 13 00759 g002aAgriculture 13 00759 g002b
Figure 3. Graphical presentation of Shannon’s diversity index (H) based on each studied trait. Error bar denotes mean ± SD.
Agriculture 13 00759 g003
Figure 4. Graphical representation on average of Shannon’s phenotypic diversity index (H’) for different populations. Error bar denotes mean ± SD.
Agriculture 13 00759 g004
Figure 5. Performance of different populations in three environments (E1, E2, and E3) based on Flowering time (A), Maturity time (B), Plant height (C), Spike length (D), Flag leaf area (E), and Shoot angle (F). Error bar denotes mean ± SD.
Agriculture 13 00759 g005
Figure 6. GGE biplot analysis for the population effect of wild emmer accessions in three environments using Flowering time (A), Plant height (B), Spike length (C), Shoot angle (D), Flag leaf area (E), Yield/plant (F), Thousand kernel weight (G), and Threshability (H) performance. Green points indicate environment (1, 2, and 3 for E1, E2, and E3, respectively); blue color represents populations: Central, South, West, EC1, and Non-specified (mentioned as Other) of Israel; Turkey, Lebanon, and Syria.
Agriculture 13 00759 g006
Figure 7. The Tester Vector view (A) and the Average Tester Coordinates/ATC view (B) of genotype by yield*trait (GYT) biplot showing association among the yield–trait combinations and ranking the genotypes based on the superiority index. The trait codes are Y: Yield; F: Flowering time; E: Effective tiller number; S: Spike length; FL: Flag leaf area; SA: Shoot angle; B: Biomass/plant; TKW: Thousand kernel weight; SW: Seed width, and T: Threshability.
Agriculture 13 00759 g007
Figure 8. The ATC (Average Tester Coordinates) view of GGE biplot of yield–trait combination for the top 20 accessions in three environments (E1, E2, and E3) to rank them based on superiority index and to observe their stability across environments.
Agriculture 13 00759 g008
Table 1. List of populations and number of accessions studied from each population along with their collection region.
PopulationsCollection LocationTotal Number of Accessions Studied
a.
Israel
Central areaQazrin3129
Yehudiyya77
Gamla4
Rosh-Pinha4
Tabigha41
South areaMt. Gilboa117
Mt. Gerizim5
Gitit2
Kokhav-Hashahar1
Taiyiba1
Sanhedriyya2
Bet-Meir2
J’aba3
West areaAmirim211
Nesher1
Beit-Oren3
Daliyya3
Bat-Shelomo2
North areaMt. Hermon2
Evolutionary canyon 1 13
Non-specified 41
b.
Turkey
14
c.
Lebanon
16
d.
Syria
19
e.
Iran
1
Total263
Table 2. Genetic diversity parameters for 19 aboveground traits of wild emmer accessions.
TraitsGenotypic VariancePhenotypic VarianceGCVPCVHbGAGA%
HT1214.351240.6321.8322.0697.8897.9461.35
FT1161.731180.5920.620.7798.497.7559.08
MT629.09683.8311.0411.5192103.945.74
PH347.55417.6214.8716.383.2239.0931.19
TTN2.053.8721.6829.8152.912.4837.62
ETN0.991.725.1532.9458.311.9248.45
SpL0.891.4812.5416.1560.312.1828.95
PL88.16131.9218.6622.8366.8319.6839.12
FLA75.6910834.4541.1570.0817.4269
SLA77.74105.427.5632.0973.7618.2156.91
Sang190.52233.5124.326.981.5927.8649.04
BPP10.711.8133.8935.6090.638.7290.29
YPP0.210.2440.7843.9885.981.0796.19
TKW26.0834.3418.4421.1775.9310.6138.31
SL0.350.666.729.1753.650.869.7
SW0.050.18.3112.0447.610.311.62
ST0.040.18.4413.2140.860.2811.84
SA2.934.2611.3613.7168.753.0420.17
T0.30.4518.2322.2667.010.8829.36
GCV: Genotypic coefficient of variation; PCV: Phenotypic coefficient of variation; Hb: Heritability in broad sense; GA: Genetic advance, GA%: Genetic advance in percent mean.
Table 3. Standardized genotype by yield*trait (GYT) data along with superiority index for the top 23 genotypes. The trait abbreviations are Y: Yield; F: Flowering time; E: Effective tiller number; S: Spike length; FL: Flag leaf area; SA: Shoot angle; B: Biomass/plant; TKW: Thousand kernel weight; SW: Seed width, and T: Threshability.
GenotypesY/FY*EY*SY*FLY*SAY*BY*TKWY*SWY/TMean
(Superior-ity Index)
TD5342.431.872.270.351.893.022.912.491.972.13
TD1201.462.341.89−0.091.922.170.841.531.891.55
Mace1.611.181.102.911.510.591.321.401.431.45
Suntop1.500.581.112.531.460.581.471.361.381.33
Yitpi0.960.381.422.071.500.720.891.111.321.15
TD5351.341.301.210.030.820.861.621.351.181.08
TD1210.631.301.01−0.230.840.480.330.691.180.69
TD8−0.17−0.540.01−0.420.120.48−0.24−0.12−0.50−0.15
TD9−0.240.18−0.30−0.42−0.12−0.10−0.04−0.11−0.32−0.16
TD70−0.43−0.26−0.16−0.39−0.540.16−0.38−0.42−0.66−0.34
TD453−0.480.08−0.64−0.50−0.38−0.61−0.55−0.42−0.47−0.44
TD216−0.45−0.22−0.64−0.43−0.63−0.61−0.44−0.57−0.57−0.51
TD166−0.56−0.10−0.73−0.51−0.53−0.57−0.73−0.55−0.37−0.52
TD110−0.50−0.91−0.44−0.44−0.66−0.20−0.51−0.50−0.68−0.54
TD574−0.70−0.09−0.65−0.50−0.55−0.66−0.78−0.72−0.71−0.59
TD256−0.59−0.37−0.83−0.49−0.62−0.62−0.48−0.64−0.72−0.60
TD743−0.80−0.08−0.89−0.55−1.12−0.69−0.54−0.82−0.78−0.70
TD771−0.79−1.01−0.83−0.47−0.83−0.71−0.65−0.77−0.77−0.76
TD454−0.89−1.06−0.63−0.54−0.66−0.62−0.99−0.91−0.65−0.77
TD74−0.76−1.22−0.76−0.44−0.66−0.97−0.75−0.73−0.76−0.78
TD130−0.82−1.05−0.83−0.50−0.83−0.90−0.72−0.84−0.79−0.81
TD112−0.87−1.21−0.84−0.49−1.06−0.79−0.77−0.87−0.80−0.85
TD123−0.89−1.08−0.84−0.50−0.87−1.03−0.83−0.96−0.81−0.87
Mean0.00.00.00.00.00.00.00.00.0-
SD1.01.01.01.01.01.01.01.01.0-
Disclaimer/Publisher’s Note: The statements, opinions and data contained in all publications are solely those of the individual author(s) and contributor(s) and not of MDPI and/or the editor(s). MDPI and/or the editor(s) disclaim responsibility for any injury to people or property resulting from any ideas, methods, instructions or products referred to in the content.