Article

Predicting the Occurrence and Risk Damage Caused by the Two-Spotted Spider Mite Tetranychus urticae (Koch) in Dry Beans (Phaseolus vulgaris L.) Combining Rate and Heat Summation Models for Digital Decisions Support

1
Department of Agriculture, School of Agricultural Sciences, University of Western Macedonia, 53100 Florina, Greece
2
Telecommunication Networks and Advanced Services Laboratory, Department of Electrical and Computer Engineering, University of Western Macedonia, 50103 Kozan, Greece
*
Author to whom correspondence should be addressed.
Agriculture 2023, 13(4), 756; https://doi.org/10.3390/agriculture13040756
Submission received: 18 February 2023 / Revised: 20 March 2023 / Accepted: 22 March 2023 / Published: 24 March 2023
(This article belongs to the Special Issue Hardware and Software Support for Insect Pest Management)

Abstract

:
In this work, we use developmental rate models to predict egg laying activity and succession of generations of T. urticae populations under field conditions in the Prespa lakes region in Northern Greece. Moreover, the developmental rate model predictions are related to accumulated heat summations to be compared with actual bean damage and to generate pest-specific degree-day risk thresholds. The oviposition was predicted to start at 57.7 DD, while the first peak in egg laying was estimated to be at 141.8 DD. The second and third peak in egg production were predicted to occur at 321.1 and 470.5 DD, respectively. At the degree-day risk threshold, half development of the first summer generation was estimated at 187 DD and 234 DDm while for the second, it was estimated at 505 DD and 547 DD for 2021 and 2022, respectively. According to the model predictions, no significant differences were observed in the mean generation time (total egg to adult development) of T. urticae between the two observation years (t = 0.01, df = 15, p = 0.992). The total generation time was estimated at 249.3 (±7.7) and 249.2 (±6.7), for 2021 and 2022, respectively. The current models will contribute towards predictions of the seasonal occurrence and oviposition of T. urticae to be used in pest management decision-making. Moreover, the development of population model is a prerequisite for the buildup and implementation of smart plant protection solutions.

1. Introduction

Common bean (Phaseolus vulgaris L.) is one of the most important pulses worldwide due to its high protein content, fiber, and other essential minerals for humans [1]. In Greece, beans are the most important pulses, providing the backbone of the traditional Mediterranean diet where cultivated area has increased in recent years [2]. National production of dry beans covers 50% of the consumption and is concentrated in the region of Western Macedonia. They are cultivated during spring and summer, at high altitudes and cool temperatures. In the region of Western Macedonia, more than 2500 ha of dry beans are cultivated, which makes the region the first producer at a national level with an average annual production approaching 6000 tons [3]. In particular, almost 43% of this production comes from the Prespa lakes region. For the year 2019, 1050 ha were cultivated with the annual quantity produced amounting to 2500 tons.
It can be characterized as monoculture since it occupies most of the arable land (1050 out of a total of 1800 ha), in particular, 83% of the irrigated land in the region. Dry bean cultivation is essential for the local economy as 80% of the gross revenue of the region’s crop production, and 75% of the income, crop, and animal production come from this specific crop. At the same time, bean cultivation employs more than 90% of the active population of the region. Local landraces of three species are used in the region—the “Plake”, the “Elefantes”, and “Gigantes” type—which are white large-seeded beans of the indeterminate climbing type with a continuous flowering that needs support. Through the long-term cultivation in this specific environment and the local cultivation techniques applied, the high quality of the end-product formed their unique characteristics with a Protected Geographical Indication (PGI) designation from the EU [4,5].
Nevertheless, in order to maintain a high yield in dry-bean productions as well as to produce a quality product, the pests must be controlled on a regular basis. In the area of Prespes, the most important arthropod pests are the two-spotted spider mites, Tetranychus urticae Koch 1836 and the old-world (African) bollworm Helicoverpa armigera, followed occasionally by thrips [6]. Due to the absence of predictive models, the control of Τ. urticae is usually carried out when the leaf damage is extensive and not during the initial stages of the population growth, in particular, the period in which the hibernating females lay their first eggs.
The spider mite T. urticae has a worldwide distribution including mostly Europe, Asia, and North and South America, feeding on approximately 1500 described plant species of 70 genera [7]. It is regarded as a native species of the temperate climate zone, but is also found in subtropical regions [8]. The species overwinters as a fertilized female in fields, under dry leaves on the ground and other locations that provide enough shelter. When weather conditions are favorable, the fertilized females produce females, while the unfertilized produce males. Typically, mites puncture the underside of green leaves and draw out their contents. When conditions are favorable for growth and development, T. urticae feeds heavily and reproduces fast-causing significant leaf damage resulting in a considerable decrease in dry bean yield production [9].
The life cycle of T. urticae includes four developmental stages: egg, larval, nymph, and adult. However, due to their rapid biological cycle, there is an overlap of generations in which different stages of mite development are observed. Environmental factors, particularly temperature, but also precipitation, relative humidity, and the sunshine, have a big impact on the ecology of the two-spotted spider mite. Under favorable temperature conditions, i.e., 27.5 to 32.5 °C, the pest develops from egg to adult in 7 to 8 days, and one female can deposit more than 100 eggs [10]. The type of host, plant nutrition status, leaf age, and moisture stress also influence development and reproduction of T. urticae [11]. However, in temperate climates, females enter into diapause, a physiological state a period in which they do not feed or deposit eggs until environmental conditions are favorable for a resumption of their feeding and reproductive activity [12,13]. Consequently, finding the time point when diapause ends and overwintering females lay their first eggs is crucial for implementing control actions to suppress further population development and mitigating oncoming leaf damage. This event can be further considered as a starting point to model the total egg-to-adult development as well as the successive T. urticae generations throughout the growth season. These models can be used to study the impact of various factors on spider mites, such as changes in the environment and the introduction and use of pesticides. The model results form the basis of algorithms to be used as part of decision support systems to inform about insect pest management actions. Providing a modeling framework for understanding and predicting the evolution of spider mite population dynamics can improve the sustainability and efficiency of pesticides application and control action practices. Consequently, the development and application of models will contribute to the comprehensive and early season fight against this important pest.
In previous work, we have focused on developing digital decision models to manage H. armigera [14], yet we have hesitated to develop similar work for T. urticae despite its importance to dry-bean production. This was due to the particular ecology of mites in relation to insects, which is characterized, among others, by a large reproductive potential, overlapping generations, mite-specific feeding and reproductive behavior [8]. Moreover, T. urticae, due to its small size, cannot be observed with the help of traps and lures to be used along with weather data to develop phenology models, as in the case of most insect pests. Usually, under field conditions, no distinct generations are observed as in other pests until a certain point where the initial plant damage occurs. The first physical damage in leaves is evidenced by chlorotic discoloration. As a result, consequently, different approaches should be applied to their modeling compared to traditional insect phenology models.
In this work, we are interested in predicting the time of appearance of Τ. urticae in dry bean crops in Northern Greece. For this, we implemented two mathematical approaches for modeling T. urticae populations in a complementary manner. The first approach was based on a combination of temperature-driven non-linear developmental rate, egg fecundity, and survivorship models to simulate egg production by overwintering adults and succeeding generations. The second used heat summations to estimate thermal thresholds which are related to the simulated egg production as well as the actual damage observed in the experimental fields. Despite the complexity of this approach, it was preferred because of the necessity to generate and predict not only the time of actual leaf damage caused by T. urticae under field conditions, but also the critical times of egg production for the overwintering and the following generations. Finally, based on the proposed modeling approach, among our aims was the development of an algorithm that consisted of a submodule to be used as part of a digital decision support system (DSS) for dry bean plant protection.

2. Materials and Methods

2.1. Study Site, Weather Data, and Heat Summations

Data were collected throughout the years 2021 and 2022 from four experimental dry bean farms, 0.4–0.7 ha each, located in the Prespa lakes in the prefecture of Florina in Northern Greece. Two of the farms were under conventional cultivation receiving the region-specific pesticide treatments according to a regular calendar schedule, except for the cultivation rows where the pheromone traps were placed. The two other experimental farms were under organic cultivation without receiving any pesticide application. Due to the presence of the Prespa lakes, the climate is classified as Cfb according to the Köppen-Geiger’s climate classification, which is characterized as temperate with dry warm summers with at least three times as much precipitation in the wettest month of winter as in the driest month of summer, and where the driest month of summer receives less than 30 mm of rain [15].
Real-time weather data including mean, minimum and maximum temperatures, precipitation, and relative humidity were collected through a network of meteorological stations that are placed in the area of the experimental bean farms [14]. Furthermore, since the delimitation of infestation levels depended on the progression of T. urticae diapause termination and population resumption in relation to favorable heat conditions, we estimated the physiological time until the first individuals and related leaf damage appearance under field conditions (see Section 2.3 for details). The average method or linear model was used to calculate daily degree days from minimum–maximum air temperature data. In all cases, degree days were accumulated after the 1st of January. We used lower temperature thresholds from other published studies considering that these are closer to the total development of the species with a lower developmental threshold TL = 9.42 °C and an upper threshold TU = 34.4 °C [16]. For producing seasonal predictions of population dynamics, we chose three meteorological stations throughout the Prespa lakes region, from which we extracted hourly temperature data [6].

2.2. T. urticae Leaf Infestation, Sampling, and Damage Assessment

Field observations were performed during 2021 and 2022, two times per week, starting after dry bean sowing from mid-to-late April until the start of September in order to detect the first active T. urticae individuals and related leaf damage. The presence and identification of the first overwintering female individuals and eggs was performed on the spot in the field with the help of an auxiliary lens by randomly inspecting 15–30 plants per experimental farm at each of the scheduled times during the season. Furthermore, we applied a stratified in-field sampling protocol to capture the time evolution of T. urticae infestations and asses the related degree of leaf damage. Similar to a weighted average, this method of sampling has the advantage of estimating the degree of leaf damage characteristics in the sample that are proportional to the overall population [17]. Let L = 1, 2, …, i denote the number of strata, Ni be the total number of sample units in strata i, and N is the total number of sample units in the entire population. Then, the population mean, μ, is estimated as follows [18,19]:
μ ^ = 1 N N 1 μ ^ 1 + N 2 μ ^ 2 + + N L μ ^ L = 1 Ν ι = 1 L N i μ ^ i
The variance, s ^ , of the mean μ ^ is an estimation of the overall population variance from each strata i through L:
s ^ = 1 N 2 N 1 2   N 1 n 1 N 1 s 1 2 n 1 + + N L 2 N L n L N L s L 2 n L   = 1 N 2 ι = 1 L N i 2   N i n i N i s i 2 n i
While the standard error of μ ^ is s ^ :
SE ( μ ^ ) = 1 N 2 ι = 1 L N i 2   N i n i N i s i 2 n i
Finally, let W L refer to the stratum weight of stratum L i , which corresponds to the proportion of the total population damage contained in the subpopulation defined by the stratum L i [18]:
W L = N h N
We used three strata per inspected plant, thus L = 3 and each of one corresponding to a different height: lower, middle, and upper parts of the plant, with a distance of 30–50 cm between them depending on plant growth. In each bean plant sampling unit, we counted the total number of leaves and sampled randomly 15 leaves from each stratum to detect T. urticae infestations. The time evolution of the leaf damage was quantified according to a damage scale [20], but slightly modified to be divided into five scores instead of four as usually proposed. These scores were as follows: (1) for normal green leaves, with no apparent mite damage; (2) for paler green leaves, with some evident yellow mottling in approximately 1/4 of the leaf; (3) more prevalent yellow mottling covering the half area of the leaf, or 2/4 of the leaves; (4) more prevalent yellow mottling, tending to cover the 3/4 of the leaf surface with a few necrotic areas and 5 extensively mottled leaves, covering all parts and usually with numerous necrotic areas.

2.3. Modeling the Occurrence of T. urticae

To gain insides of the population dynamics of T. urticae under field conditions and predict its occurrence and succession of generations throughout the growth season, we implemented two similar mathematical approaches in a complementary manner [19]. The first approach simulates the physiological age of adults and egg production using rate summations, whilst the second is using heat summations to estimate the thermal units that correspond to the appearance of different stages of development estimated with the first approach as well as the actual leaf damage. Conceptually, the rate-summation approach adds fractions of development per unit time in relation to changing environmental temperatures [21,22]. The second approach assumes a linear relationship between development rate and temperature and estimates the number of degree-days (or thermal units) required to complete development. Moreover, since T. urticae displays a facultative reproductive diapause in females only, which is induced by short-day photoperiods experienced during pre-imaginal development, we used as )the critical time length (CTL) of 11.5 h light as a condition of which 50% of the adult females have terminated diapause as a starting point for the rate and heat summations [23]. The selection of this value was not arbitrary; rather, it was based on published work conducted with Greek strains of the species [23]. This is because diapause intensity may vary depending on the geographic region. Both modeling approaches are described in brief below.

2.3.1. Rate Summation Modeling of T. urticae

We apply the Lactin-2 model to simulate the physiological age of overwintered T. urticae adults [24]:
r T i = e ρ T i e ρ T M T M T Δ T + λ
where r(t) is the developmental rate (day−1), T temperature (°C), ρ constant defining the developmental rate at optimum temperature, λ constant forcing the curve to intercept with the x-axis to estimate the lower developmental threshold, ΔΤ constant temperature range between Topt and TM, where Topt the optimal temperature of development (i.e., the temperature at which the rate takes its highest value), and TM the highest temperature developmental threshold [24]. The above equation was selected among available non-linear developmental rate models first because it is among the few which have been parameterized for T. urtiacae [25]; secondly it involves parameters that can be interpreted biologically [26]. To describe the nonlinear relationship between adult female developmental rate and temperature, we used parameters published by Vangansbeke et al. (2015) [27] as follows: ρ = 0.0068, Τmax = 40.9589, λ = −1.0741 and ΔT = 1.9220. The model was generated   T i T L = 10   ° C to exclude negative developmental rate values.
To simulate the physiological age of total immature development (i.e., egg to adult of the succeeding generations), we applied the same model (Equation (7)) using parameters published by Farazmand (2020) [28] for T. urticae growth studies performed under seven constant temperatures. The parameters values are, respectively, ρ = 0.0068, Τmax = 52.156, λ = −1.063, and ΔT = 1.9220 [28].

2.3.2. Physiological Age

The physiological age P x i was obtained by accumulating the rates computed with the development model r T i . as an input of temperature T i °C from the starting day (0) to the n-th day, estimated as follows [25]:
P x i = n 1 n i r ( T i )
Since the data are discrete, the statement holds [25] as follows:
P x i = n 1 n i r ( T i ) ~ i = 0 n r T i
where r T i . development rate at temperature T (K) of ith time step. The progress of physiological age, P x i , of female spider mite adults uses as a starting time the day on which the physiological time threshold, K, is completed and corresponds to the first damage occurred in the bean fields. Once the accumulated developmental rate equals 1, the physiological age of overwintering mites is completed, and individuals start to lay the eggs of the first generation.

2.3.3. Temperature-Dependent Fecundity Model

To model oviposition, we applied a productivity function describing the total number of eggs that each female produces. Since there is no information concerning the number of fertilized eggs, we account for the total fecundity which is expressed as the expected number of eggs laid per female during her whole lifespan and as a function of an extreme value function temperature [29]:
f T = a e 1 + b T k e ( b T / k
where f T is the total number of eggs produced by a female adult at temperature T (average), α is the maximum reproductive capacity, b corresponds to the temperature at which the maximum reproduction occurs, and k is a gradient calibration parameter (i.e., steepness). We used parameter values published by Kim and Lee (2003) [29] with α = 45.6550, b = 25.8064, and k = 8.3097. Moreover, since we are interested in the time at which egg production occurs (e.g., phenology), as well as for simplicity’s sake, we do not account for age-specific fecundity in this work.

2.3.4. Age-Specific Cumulative Oviposition and Survivorship Rate Models

The age-specific oviposition rate is the proportion of the total lifetime reproductive potential that elapses during each time period [30,31]. We applied the two-parameter Weibull function as proposed and parameterized by Kim and Lee (2003) [29]:
p P x i = 1 e P x i a β
where p P x is the cumulative proportion of eggs laid by physiological age Px by a female adult, while α = 0.6083 and β = 2.5573 are fitted constants according to Kim and Lee (2003) [29].
The age-specific survival rate is the proportion alive at any given age (time) [30] and can be described using exponential [32], Gompertz [33,34], or Weibull functions [31,32,33,34,35,36,37,38]. In this study, we applied a sigmoid function that was parameterized and used by Kim and Lee (2003) [29] to describe the age-specific survival distribution of T. urticae:
s P x i = 1 1 + e γ P x i δ
where s(Px) is the proportion of live females at the physiological age Px, γ = 0,9688 is the physiological age at 50% survival, and δ = −0.1925 is the parameter defining steepness of the equation.

2.3.5. Total Oviposition Model and Cumulative Eggs Laid by T. urticae

The number of eggs laid by a female adult at ith time (i.e., physiological age Pxi) is the product of the temperature-dependent total fecundity f T , the age-specific cumulative oviposition rate p P x i , and the age-specific survival rate s P x i [29]:
g f T , p P x i , s P x i f T p P x i + 1 p P x i s P x i + s P x i + 1 2 ,     i 1 , P x 0 = 0
where P x i + 1 and p P x i are the physiological ages obtained through the accumulation of the aging rates derived by the female aging model f T to the i-th, respectively [39,40].
In order to model and simulate the eggs produced from the individuals of the succeeding generations, we applied the same approach, this time using a non-linear egg to adult developmental model. In all cases, we assumed invariable developmental and reproductive rates for each generation through the year.

2.3.6. Heat Summation Modeling of T. urticae

Using the (CTL) of 11.5 h light as Biofix, we estimated the degree days under field conditions for the appearance of the first Τ. urticae populations, as well as the corresponding leaf symptoms and their evolution in the experimental bean fields. Additionally, since it was virtually impossible to observe the first eggs laid by T. urticae under field conditions, as well as the evolution of the succeeding generations, we estimated the degree-days of the different physiological events as simulated with the rate summation model. We measured all heat summations according to the linear model, which is a product of time and the degrees of temperature above the threshold temperature [41]:
D D = 0 t T t T m i n d t
However, Equation (12) cannot be computed analytically and must instead be numerically integrated by breaking the time interval (t) into a number (n) of small increments so that [42] the following is the case:
D D = 0 t T t T m i n d t 0 t [ T t T m i n ] Δ t
where T is the average temperature for day t and T m i n = 7.11   ° C the lower temperature threshold for the development of overwintering adults. DDs were estimated for the start and end of oviposition by overwintering adults for each of the generations.

3. Results

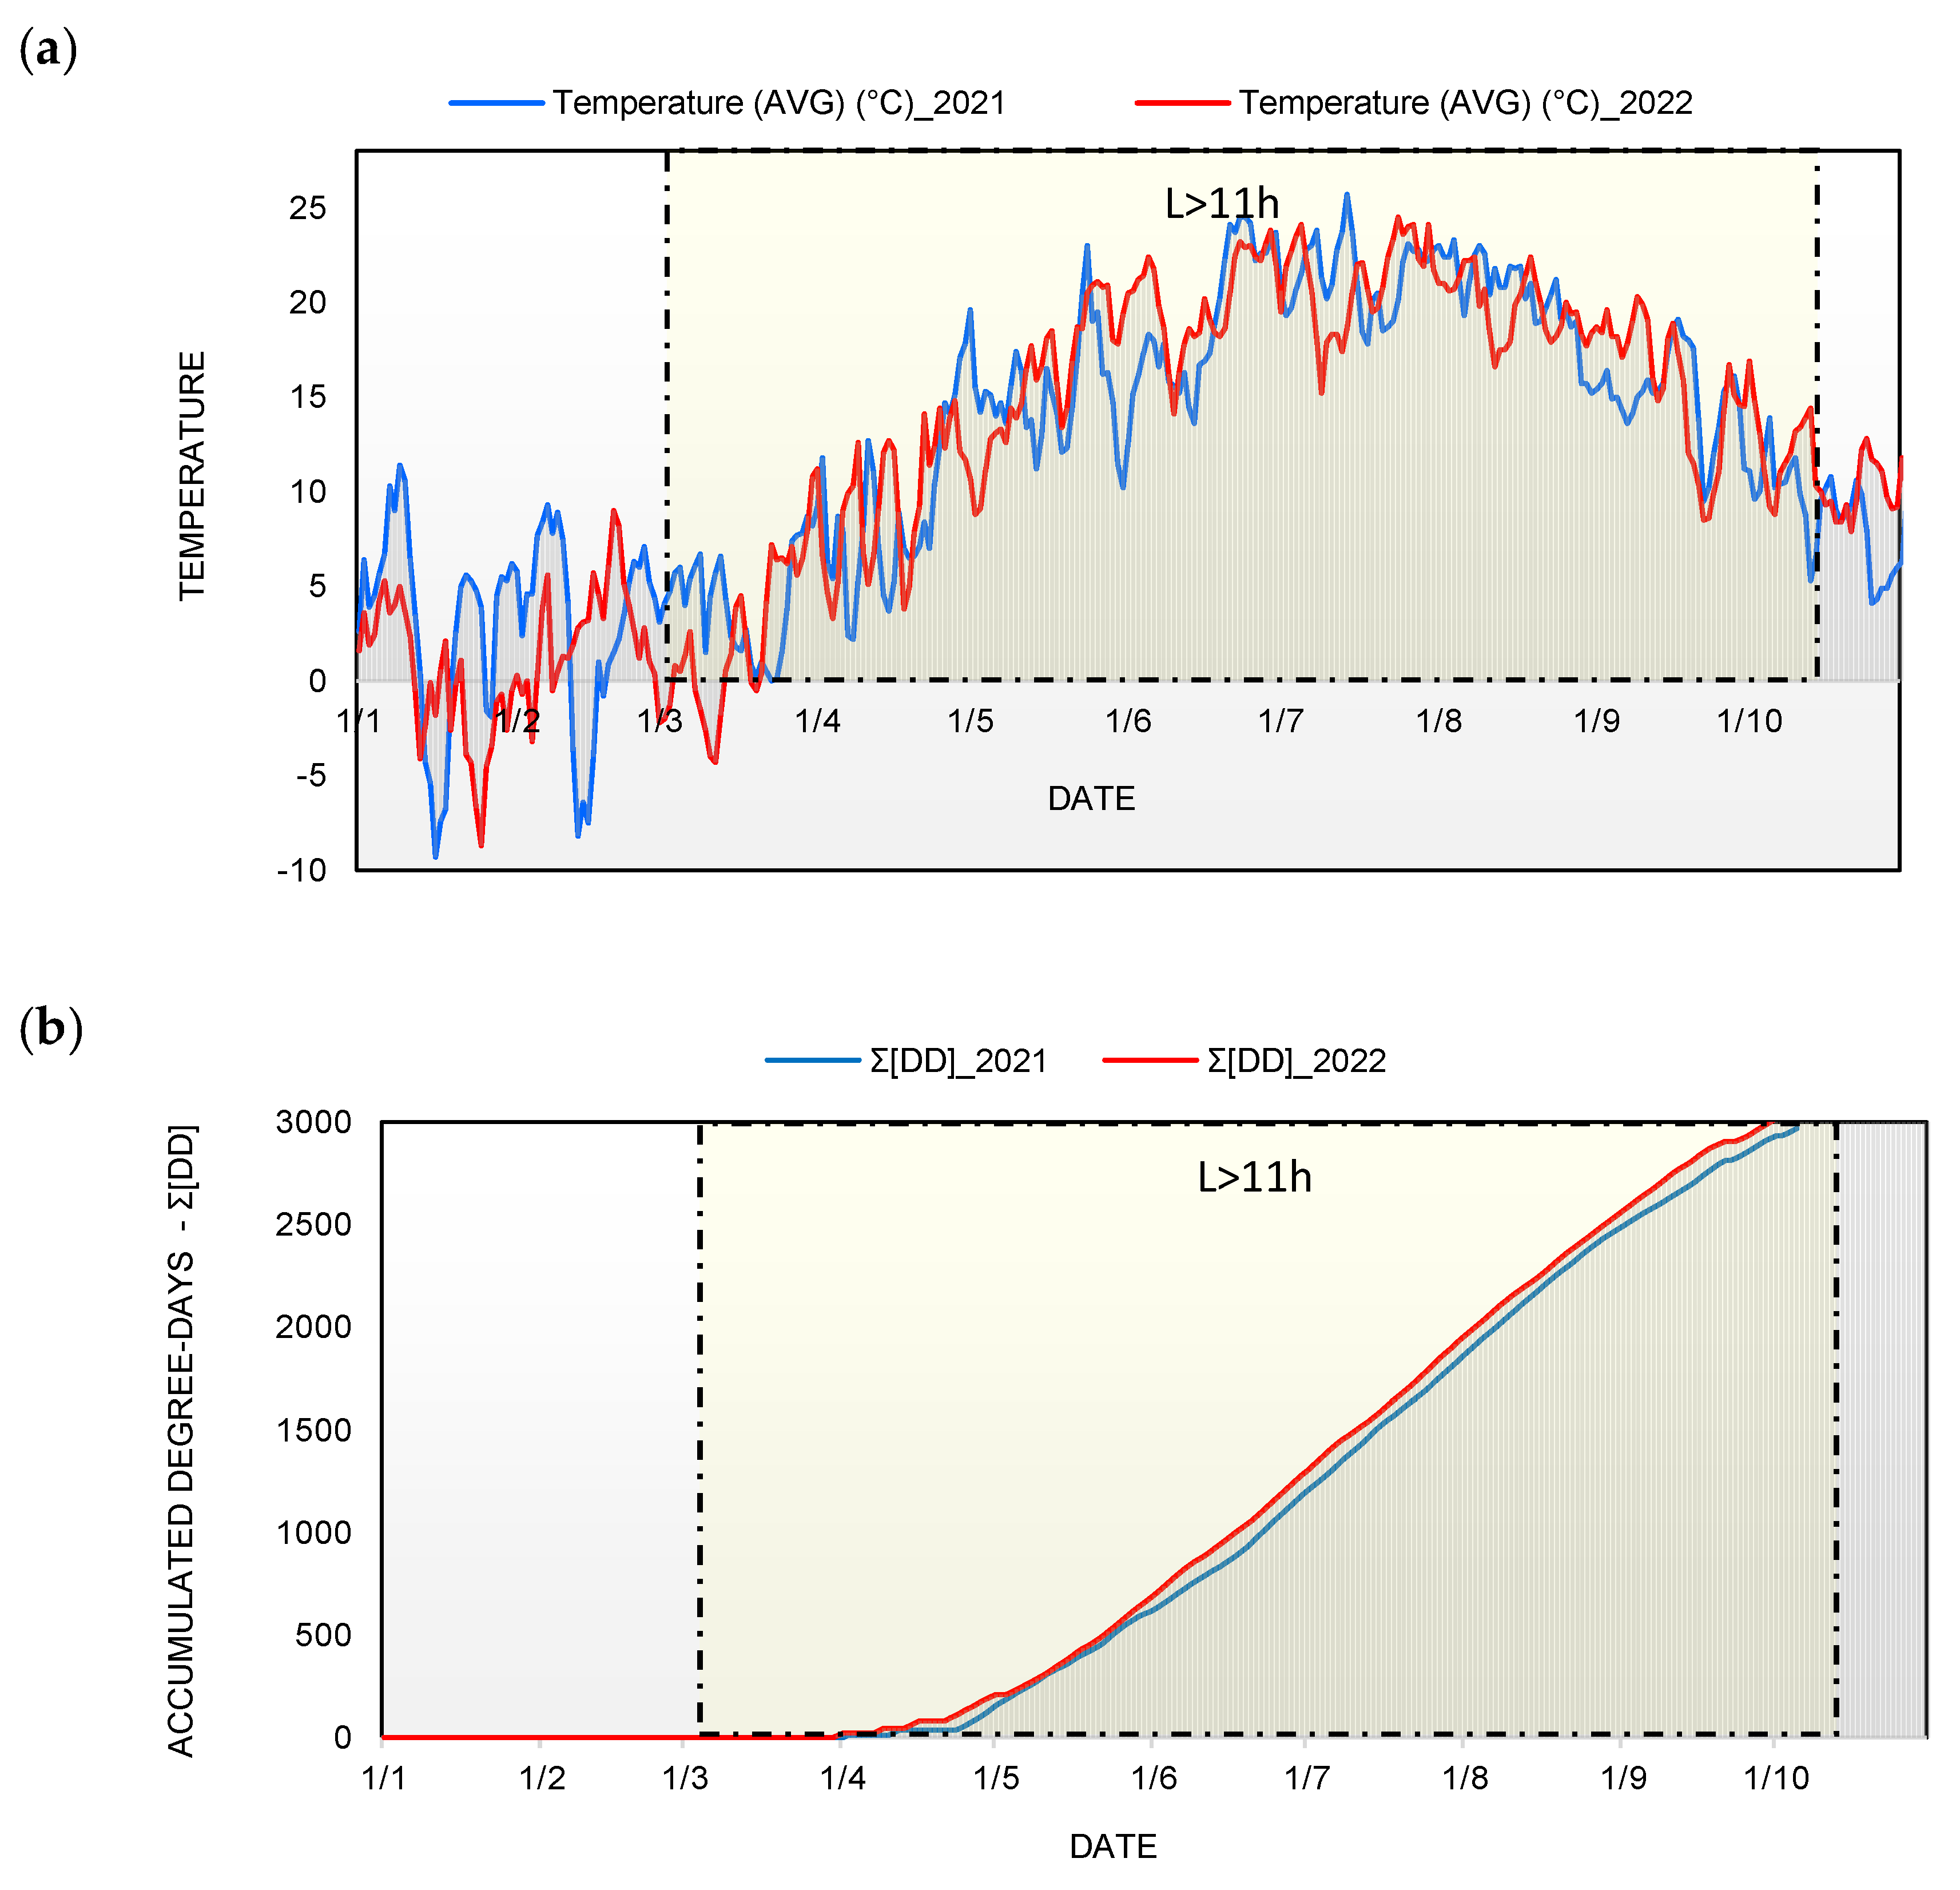
3.1. Suitability of Weather Conditions and Heat Summations

Figure 1a shows the average temperatures recorded during 2021 and 2022 in the region of Prespa lakes in Northern Greece, as well as the period where temperatures were higher than the lower developmental threshold of T. urticae. In addition, the figure shows the period (e.g., date) in which the photoperiod was critical for diapause termination and diapause induction. We observed favorable temperatures for the development of the species in mid-April; however, in both growth seasons (2021 and 2022), the average daily field temperatures were consistently above the lower developmental threshold of T. urticae (10°) from May to September. Thus, the degree-days were accumulated mainly from the middle of May onwards even though the photoperiod was favorable much earlier (Figure 1b). This was expected because the Prespa lakes area is at a high altitude, and the region is considered one of the coldest areas in Greece. Thus, unlike other continental regions of Greece, favorable climatic conditions for the development of T. urticae appear much later, with a delay close to a month.

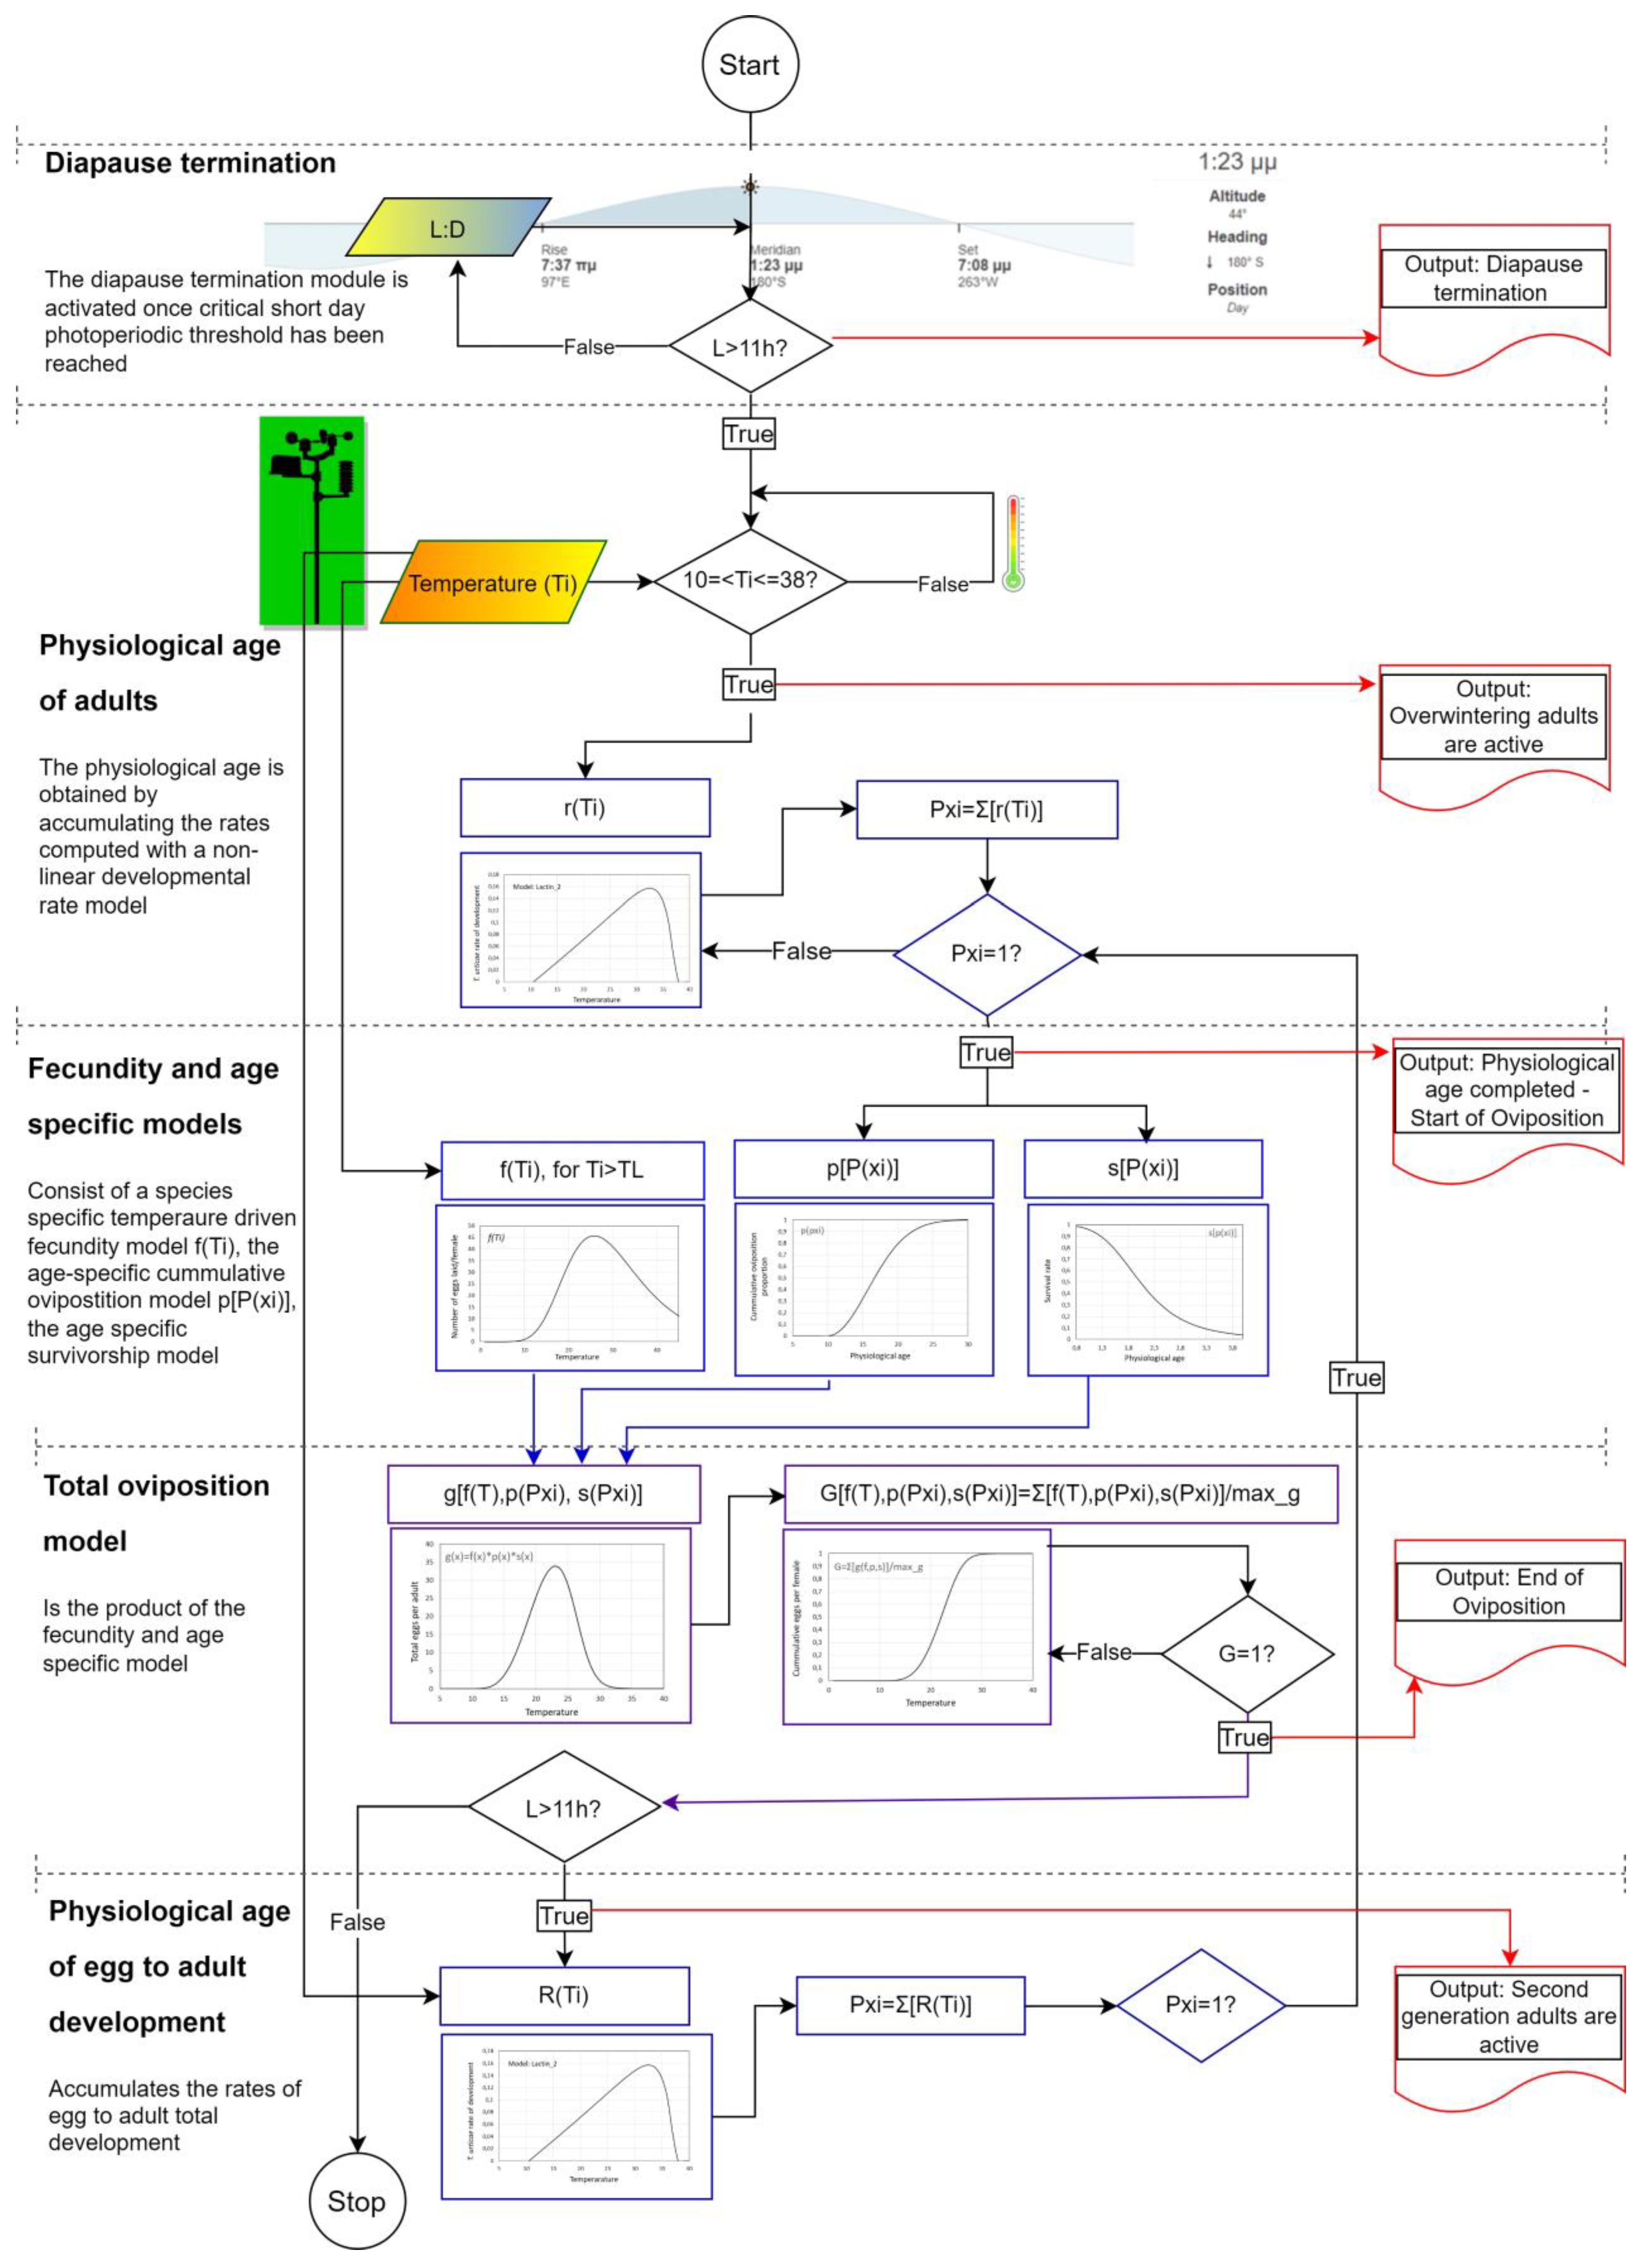
3.2. Overall Model Struction and Model Flow

The rate and heat summation models formed the basis for the development of an algorithm aiming at predicting the growth of the pest in real time. For threshold temperatures below a minimum of 10 °C, the development rate of T. urticae was set to zero as well as higher temperatures (above 38 °C). As described in Figure 2, the input for the non-linear rate summation model was the temperature time series, whilst for the total egg production, the physiological age summation model. The simulation process started from the overwintering females and then increased based on the non-linear rate model for each time step and temperature data until it reached 1, according to the physiological age summations (Equation (2)). Once the time of egg production was reached and the first eggs were laid, the model was run again, this time using the egg-to-adult non-linear developmental rate equation and so on. The model performed the previous steps again and again until the environmental conditions were not favorable for development and reproduction. Furthermore, the model simulates the time and duration of each generation, the number of eggs produced per female, and the number of completed generations per year. The related decision-support output are alerts related to important phenological events such as diapause termination, reactivation of females, and start and end of egg production for each generation.

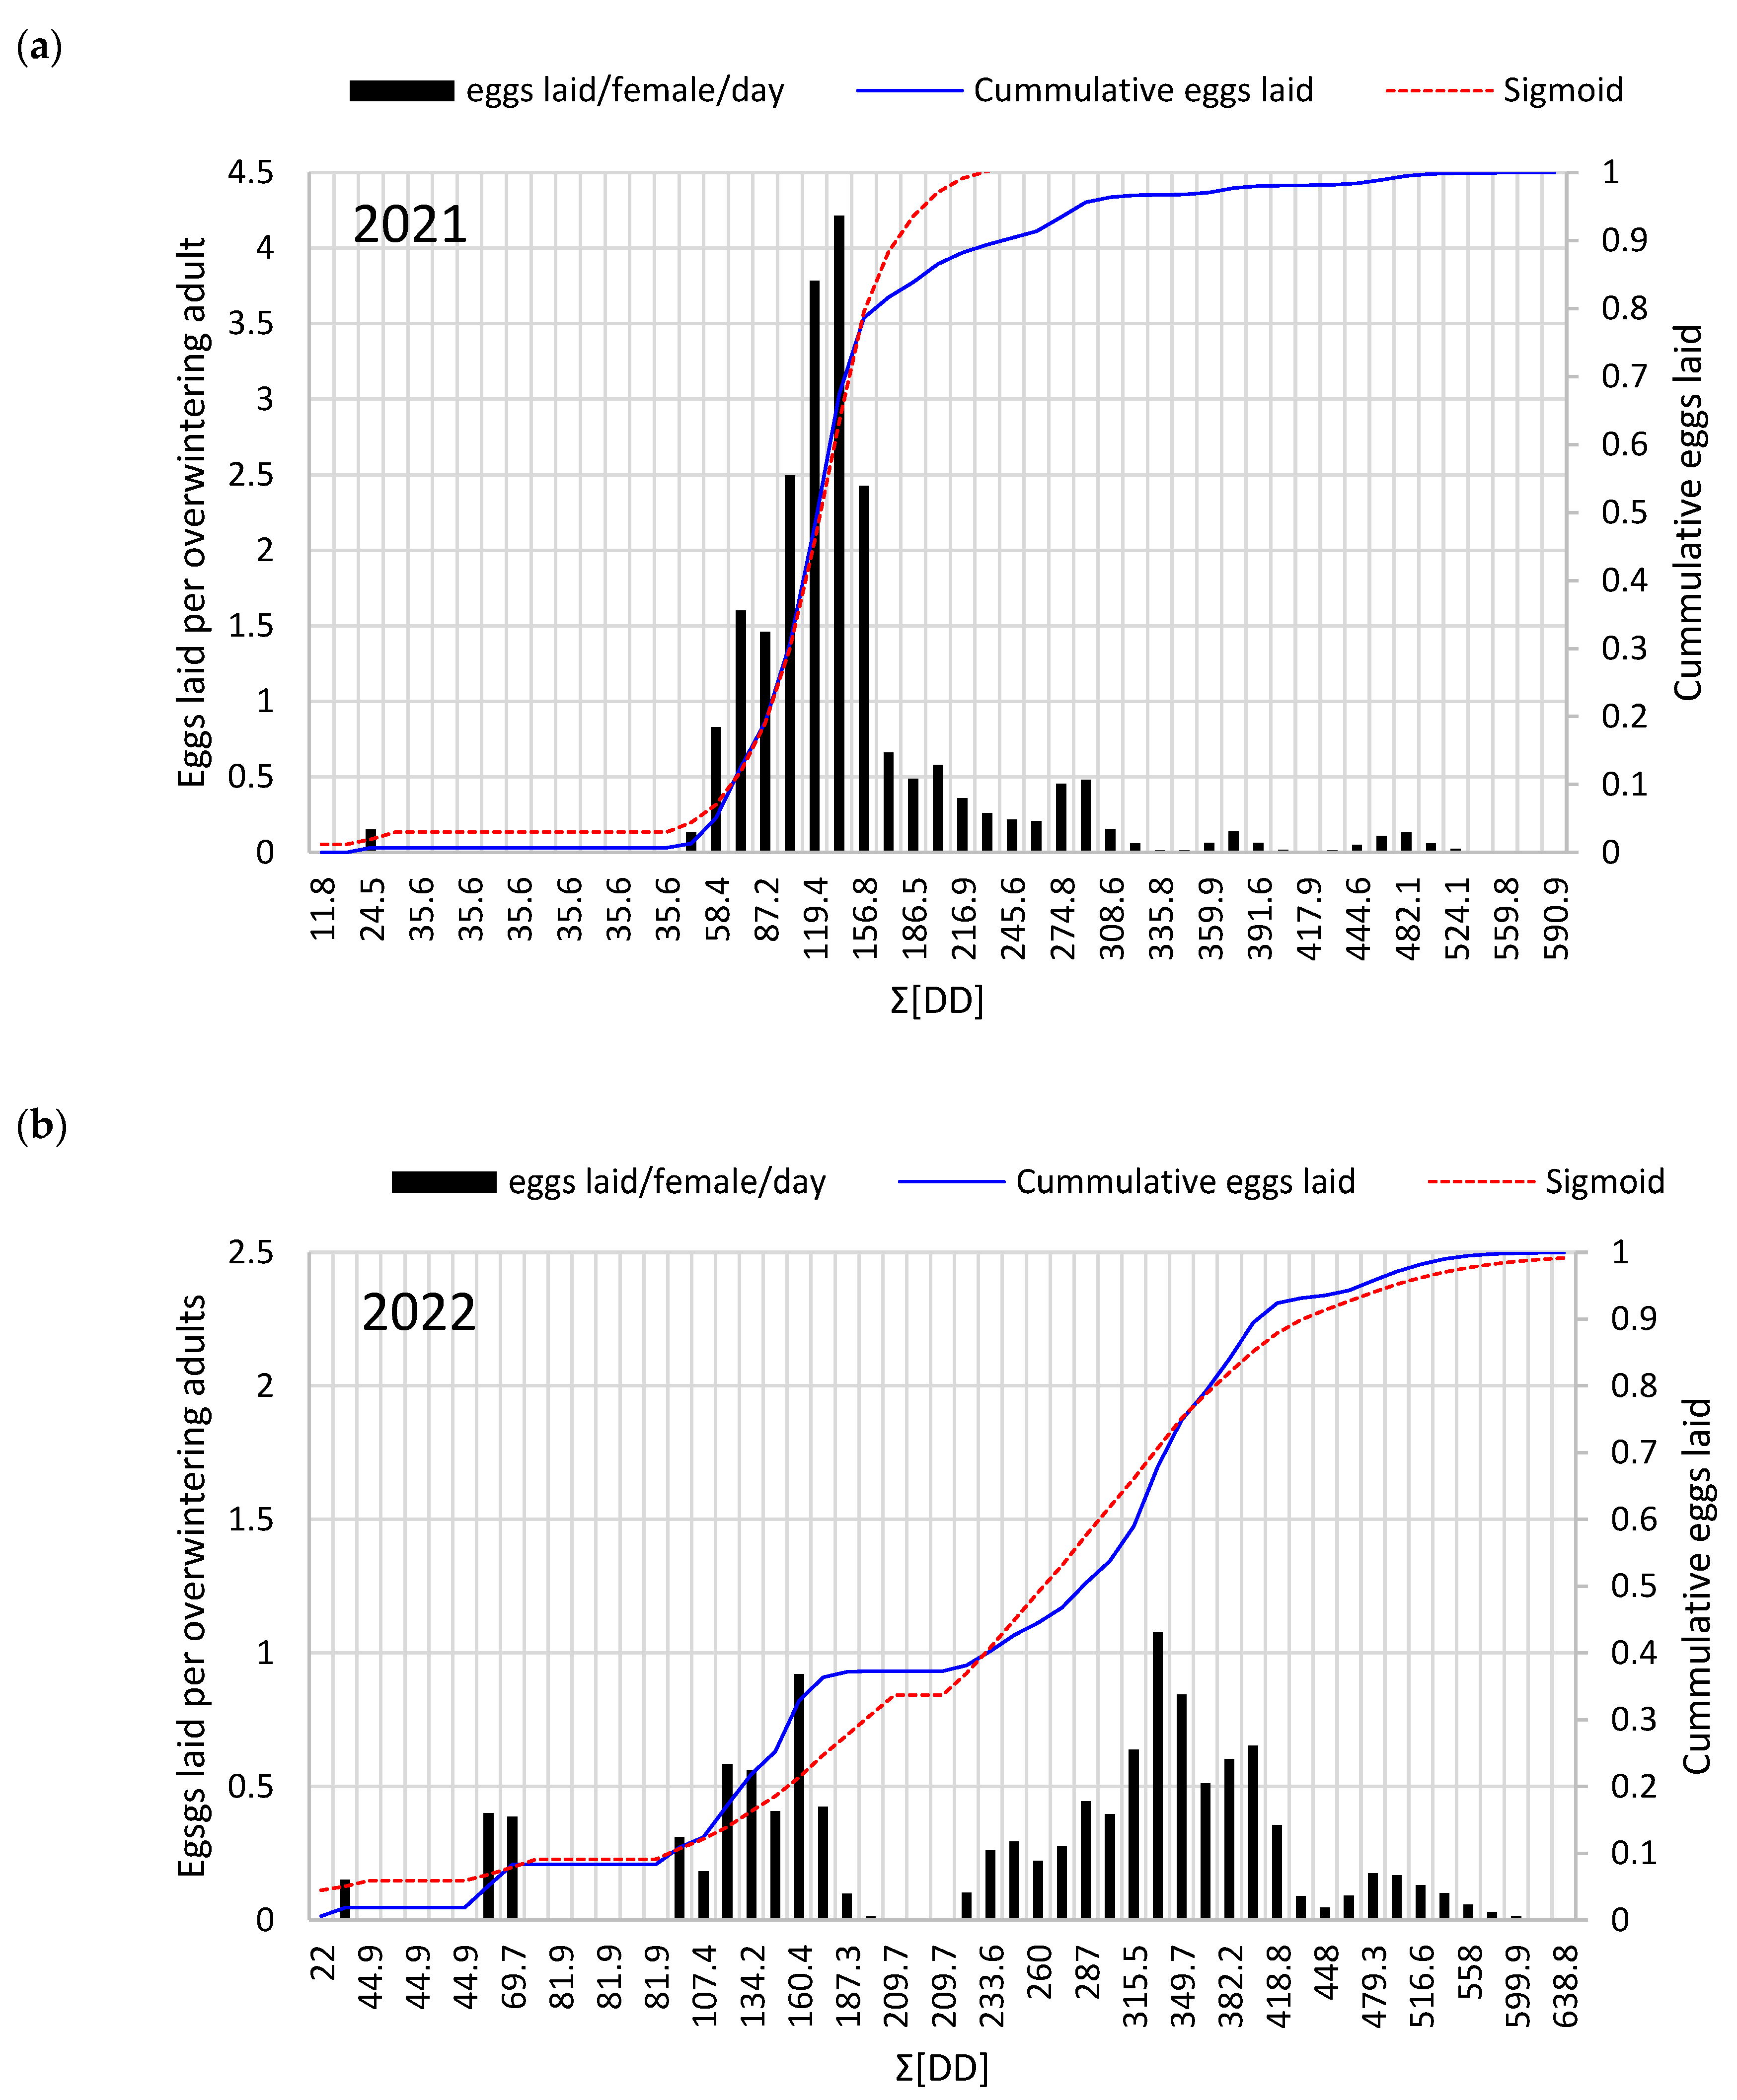
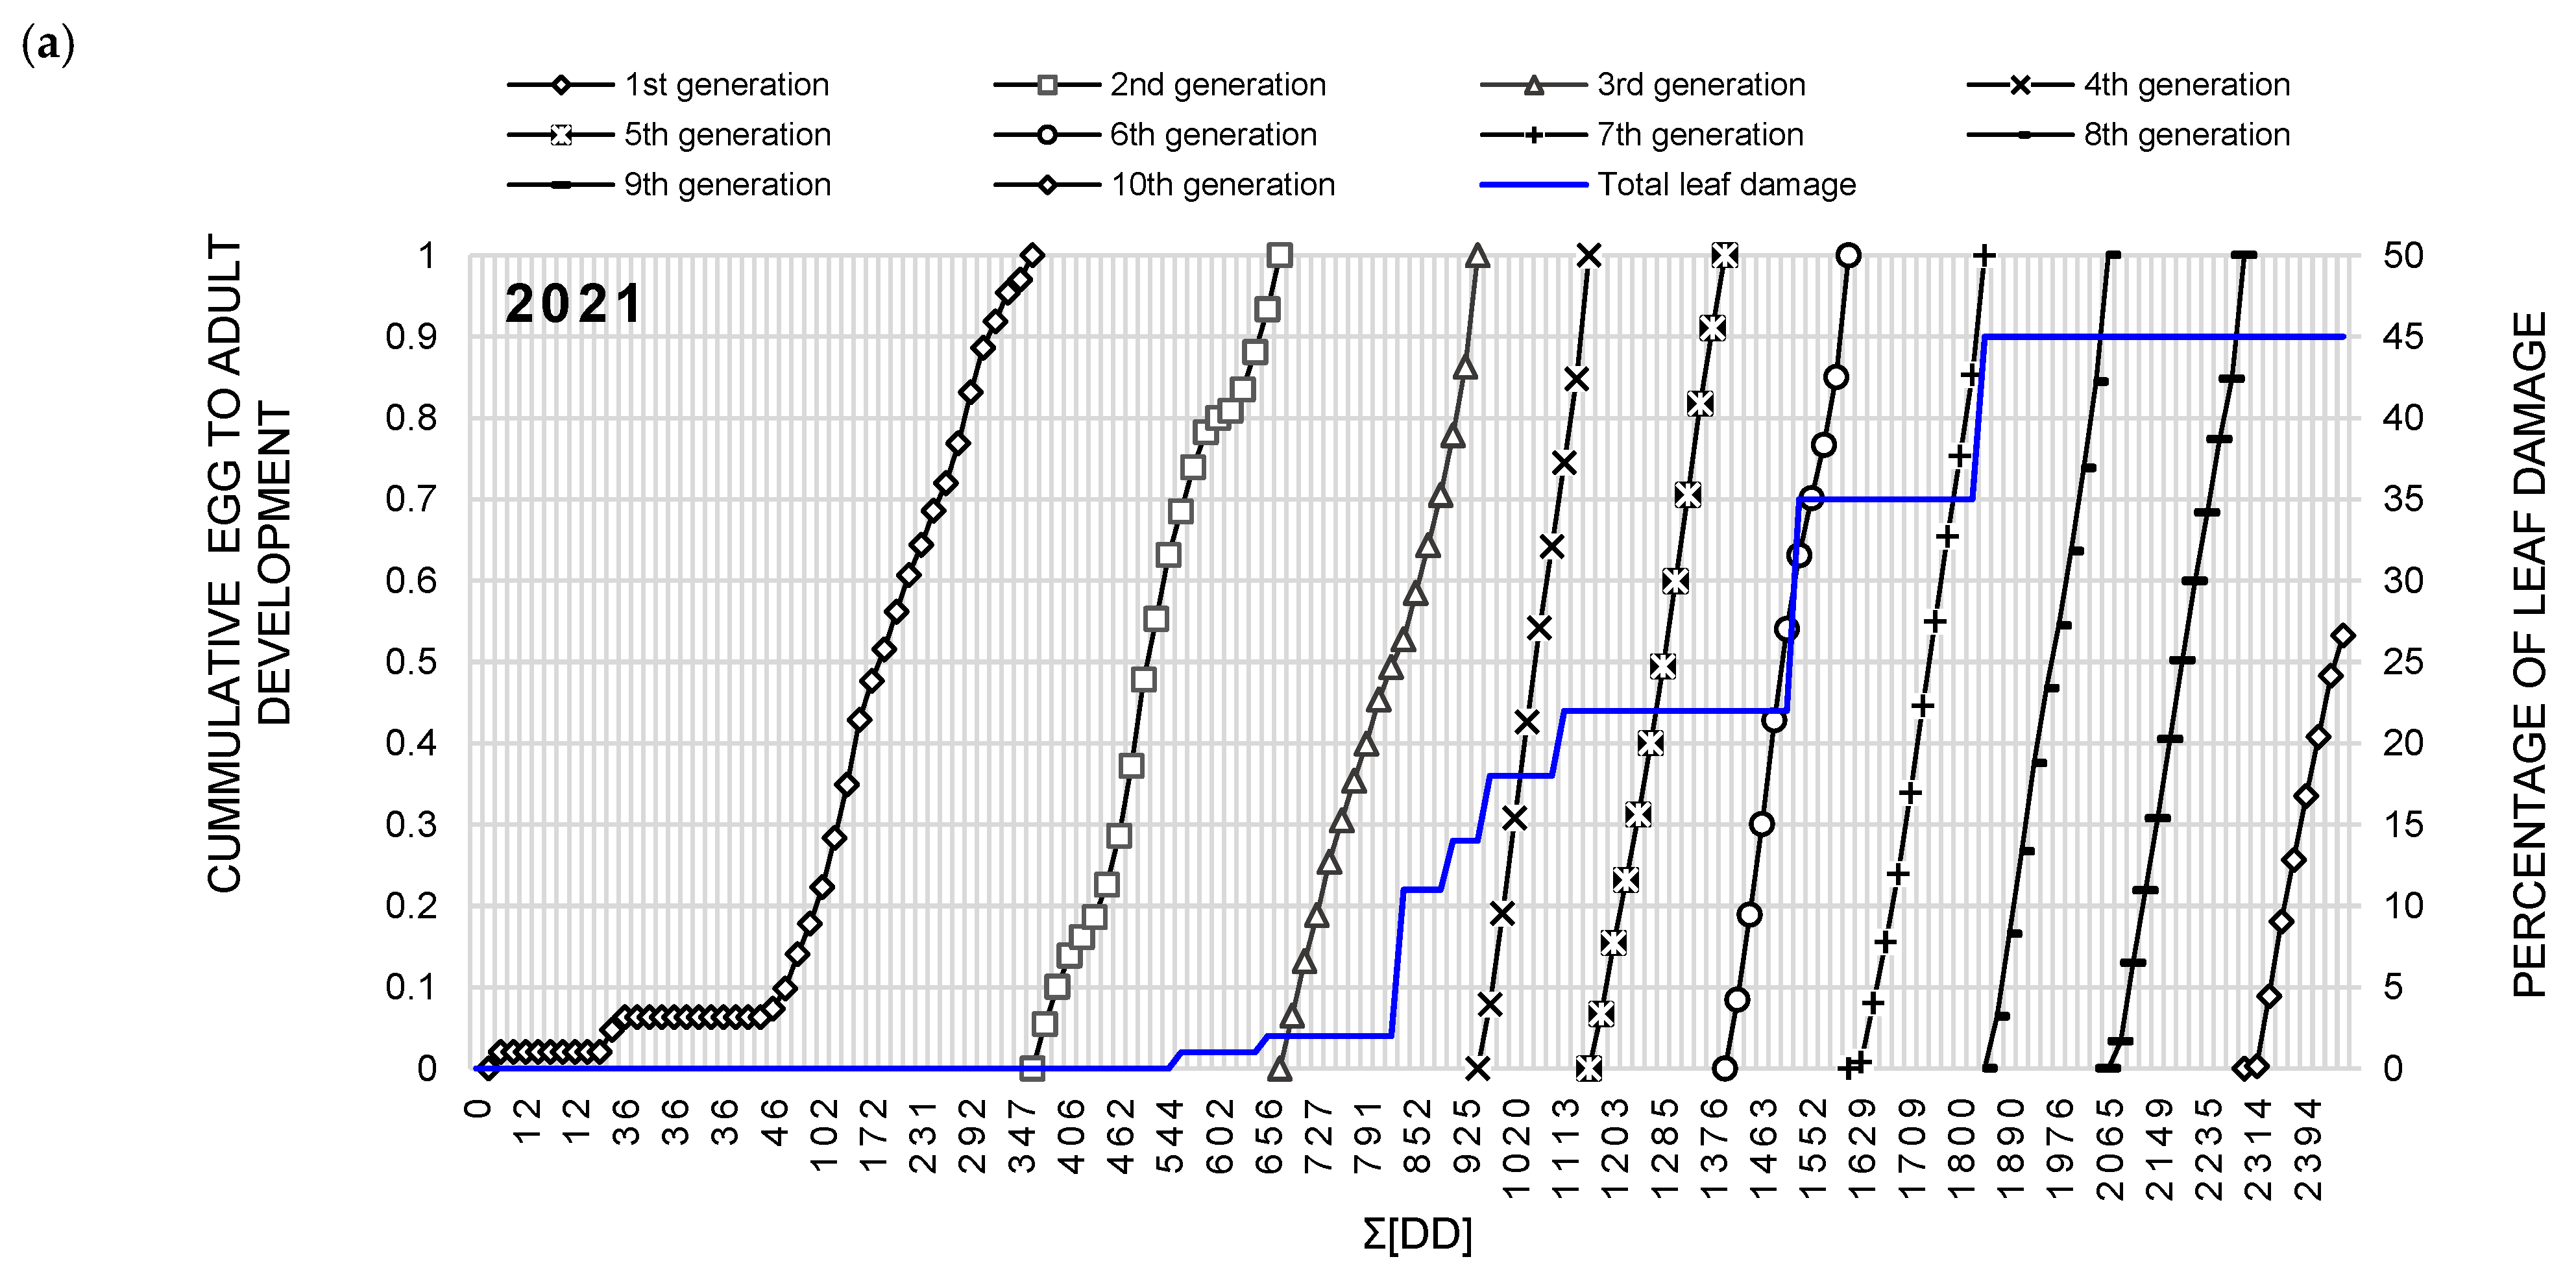
3.3. T. urticae Diapause Termination and Female Total Oviposition Patterns

Initiation of oviposition and its course after the completion of diapause by adult T. urticae females and according to the total oviposition model during 2021 and 2022 is shown in Figure 3a,b. These simulations were carried out using real-time data collected from a network of meteorological stations in the study area and provide insight into the end of diapause and the evolution of egg production. In addition, to be able to compare the course of the total oviposition per overwintering female between the different study areas (not shown here since we give pooled data) and also between the different experimental years of observation instead of a calendar scale, we used physiological time using the linear degree-day model. We also show the empirical cumulative distribution of eggs laid as well as that of a sigmoid model in order to facilitate the visual comparison between the two observation years as well as to improve calculation of critical degree-day risk thresholds (Table 1). For comparison, the number of eggs was scaled to a ratio of probability 1 against the respective peak numbers of each case (e.g., 2021 and 2022) since the actual adult population levels for egg population simulation could not be estimated in the field. During both observation years, trends of the predicted egg population of females of the overwintering generation pursued some days earlier in relation to the first significant lesions that were observed on the bean leaves (i.e., higher than 10%). This is to be expected since the presence of the first eggs and corresponding hatchlings, although feeding on the plant, may not cause noticeable damage. On the contrary, as the population increases and we observe overlapping generations, the plant damage become noticeable. This lag period was observed in both growing seasons. During the later season, the model outputs deviated little from the actual observation in the succeeding days of the growth seasons and the model prediction of the succeeding generations generally depicted the observed T. urticae population occurrence and related field damage. Moreover, it is worth noting that egg-laying patterns were more evenly distributed during 2021 and are characterized by a large maximum followed by a smaller one compared to that of 2022 characterized by two periods of high egg laying activity. Despite this, in both years, the simulated peaks of egg laying, regardless of size, seemed to occur at the same physiological time. Differences in egg laying abundance patterns during early summer might be related to the fact that temperatures were higher in early summer (i.e., June) during 2022 compared to 2021, and due to the small differences in temperature between the two years of observation, which can cause the prolongation of ovulation for a longer period. Table 1 shows the ordinal (linear) heat summation (degree-days) risk thresholds of egg laying events (i.e., peak in egg laying) of overwintering T. urticae females according to the simulated total fecundity rate summation model. The oviposition was predicted to start at 57.7 DD, while the first peak in egg laying was estimated to be 141.8 DD. The second and third peak in egg production was predicted to occur on 321.1 and 470.5 DD, respectively.
The predicted physiological age of total spider mite immature development (i.e., egg to adult of the succeeding generations) for the growth season of 2021 and 2022 is depicted in Figure 4a,b, respectively. According to the physiological rate model, T. urticae completed eight to nine generations from early May until late August (Figure 4). It is worth noting that the first noticeable bean damage (~10%) was observed after the prediction of the second summer generation. In addition, we did not notice any difference in leaf damage between the three plant leaf strata, thus deciding to pool the leaf damage data to increase sampling space. The leaf damage increased, reaching the highest infestation at the time that the rate summation model predicted after the seventh T. urticae generation. The fact that the first infestations did not coincide with the appearance of the first Τ. urticae generation could be explained by the fact that the populations at the start of the season (i.e., individuals of the first generation) were too low to cause significant damage. However, as populations increased due to the succession of generations, we observed a corresponding increase in plant infestation. As we plan in the future to integrate the current modeling tool into a real-time decision-making system, we scaled the developmental rate predictions of the succeeding generations over a degree-day physiological time scale to establish heat degree-day risk threshold to be compared with other related studies. As in the case of predicting the egg laying of overwintering females, this correspondence allowed us to compare between our simulated developmental rates predictions of T. urticae population dynamics with heat summations estimated according to the linear heat summation model. Table 2 presents the thermal thresholds for each year as well as for combined data. For temperatures below or above the threshold temperatures, no development was cumulatively added. The degree-day risk interval where the half of the development of the first summer generation was completed was estimated at 187 DD and 234 DD for 2021 and 2022, respectively, while that of the second generations was estimated at 505 DD and 547 DD. According to the model predictions, no significant differences were observed in the mean generation time (total egg to adult development) of T. urticae between the two observation years (t = 0.01, df = 15, p = 0.992). Degree days were estimated at 249.3 (±7.7) and 249.2 (±6.7), for 2021 and 2022, respectively.

4. Discussion

The spider mite T. urticae is among the most important pests in agriculture and often has a negative impact on the productivity and quality of bean crops. The species hibernates as a fertilized female, in well-sheltered places in the field, under dry leaves on the ground and in other places that offer sufficient protection. Overwintering females end hibernation in early spring and lay their eggs. The species has four stages: the egg, the larva (hexapod), the second larva, and the immature female. Spider mite management in the bean plant involves monitoring for the pest and signs of damage to detect infestations and take actions [43,44]. However, when actions are taken at the point where extensive leaf damage is visible, it is often too late since the crop has already suffered irreversible damage. Ideally, pest management actions should be carried on early in the season when eggs are laid and the first summer generations start. Nevertheless, since overwintering individuals, as well as the first eggs laid after diapause termination, are difficult to detect and the first individuals do not cause considerable damage, most farmers miss this time point and take actions too late.
In this work, we are combining two temperature-driven modeling approaches. The first approach is using a model of egg laying as well as an egg-to-adult developmental rate model [45]. The second approach is using heat summations, which are further used as a scaling factor to be related with the predictions generated from the developmental rate model and the actual damage [41]. The model of egg laying comprises three essential temperature-dependent components: total fecundity, age-specific oviposition rate, and age-specific survival rate [40]. Total fecundity model uses temperature as an input, and these two age-specific models use physiological age as an input that is a sum of the outputs from female aging model with mean temperatures of each day from adult emergence. The output of both models is generated into a heat summation insect physiological scale, rather than into calendar days, to extract degree-day heat thresholds. The prediction of egg production and the succession of generations can contribute to the achievement of optimal control T. urticae with minimal impact on the environment. Moreover, the current models will be part of a decision support system, which is developed for bean cultivation in Northern Greece, used to predict potential pest outbreaks, helping farmers to manage bean pests before they cause significant damage [6]. The models can also be used to evaluate the effectiveness of different bean management strategies and to identify the most effective methods of pest control.
Concerning the modeling approach, it is worth noting that, in practice, both models, the developmental rate and the heat summation model, can be used separately. However, the heat (or thermal) summation approach has the advantage of estimating thermal thresholds that can be compared with other works because it is expressed in terms of degree days [14,41]. In addition, it can be applied more easily by the producers since it essentially requires the calculation of the degree days and not the combination of complex equations, as in the case of the total egg production model. This was a second reason to decide to use and finally relate the two modeling approaches to provide forecasts in degree days rather than calendar time. Furthermore, given that it is not always possible in practice to find the time of the end of diapause as well as of the deposition of the first eggs (they are very small both in size and number), we calculated this interval after combining simulations and leaf infestation data caused by T. urticae at the point which is visible. On the number and duration of T. urticae generations, they depended upon the particular location of the research and the methods used for heat summations. For instance, the duration of egg-to-adult T. urticae generation time as estimated in the current work, although higher, is close to that estimated by Herbert (1982) in the US [46]. On the other hand, it is higher than that of Carey et al., 1982 [47] as well as compared to that of Karami–Jamour and Shishehbo (2012) [48] with populations from Iran and that of Ju et al., 2008 in Korea [49]. However, we cannot make an absolute comparison of our results since the first two papers used a different heat summation calculation method. Furthermore, while most other studies are based on laboratory data, it is known that significant variations can be observed in the population dynamics of field populations compared to those reared in the laboratory. One other source of variability of the mean generation time is the host plant since it can have a significant effect on insect growth and development [50]. Different host plants can provide different nutrition levels, thereby affecting T. urticae growth, survival, and reproduction [51,52].
To ensure the validity and accuracy of the proposed rate and heat summation results, it is essential to use precise and reliable temperature data and to determine temperature thresholds for each stage of development through experimental or field observations. To address the first challenge, we employed high-quality weather data from a network of meteorological stations installed at the experimental sites instead of relying on free or remote-sensed data. For the second factor, i.e., determining the temperature thresholds and parameters of the non-linear growth models, we researched relevant literature and collected field data. Further insight into the accuracy and validity of the rate and heat summation models was obtained by validating their predictions through field observations, although we intend to test more years and regions.
Based on the calculated developmental rate models and actual field temperature data, the continuous development for T. urticae was calculated and summed (for temperatures below or above the threshold temperatures) and generated more than 10 generations from May till late August. These predictions are in accordance with other studies which confirm that T. urticae has a fast life cycle that is favored by dry and warm conditions with temperatures close to 30–32 °C and very low relative humidity [52,53]. Furthermore, under these conditions, its biological cycle is very short (5–7 days) and overlapping generations are observed. Moreover, the actual leaf damage caused by T. urticae started during the period when the model predicted the end of the second and the start of the third generation, while the highest leaf infestations were observed when the model predicted the fourth and fifth spider mite generation. This makes sense, since as generations proceed during the growth season, the spider mite population and their feeding activity increase, which are causing a more widespread leaf injury (discoloration) to the bean plant. Other factors that might affect mite population and damage development are host type [54,55] abrupt temperature fluctuations, high relative humidity, and heavy rainfall [56,57]. Stress conditions of the host and plant defenses can also reduce their mite feeding activity, but also fecundity and survival, keeping populations and relative plant damage at low levels [58].
Nevertheless, despite any inherent ecological constrains that might affect mite abundance and related bean damage, temperature is by far the most predominant factor; therefore, the current work provides useful information for predicting the time of egg production and succession of mite generations. Moreover, our study provides an alternative to most modeling approaches using field data rather than laboratory growth studies.
From a pest management standpoint, the models developed in this study can be used to predict the timing of spider mite outbreaks to apply pesticides only when they are most effective at saving money and minimizing environmental impact. Additionally, the current model prediction and the necessity of pesticides application will take into account the prior confirmation of actual mite population damage as verified by unmanned aerial vehicles (UAVs). In this context, the study demonstrates the importance of T. urticae risk thresholds for the development and operation of real-time decision support systems for pest management. To date, the model we implemented as well as the developed degree-day risk thresholds will be further validated and integrated into VELOS, a novel cloud-based smart ecosystem for precise farming and pest management of bean farms. VELOS leverages Information and Communication Technologies such as Internet of Things, Artificial Intelligence, Big Data analytics, and Unmanned Aerial/Ground Vehicles for extracting knowledge to provide an integrated solution to support decision-making, efficiently managing pesticide application and its scheduling [59]. The pest risk threshold subsystem of VELOS will drive the activation of other VELOS subsystems (e.g., UAVs and UGVs), while it will constitute a verification of the output of the pest prediction subsystem.
Compared to other modeling approaches, it is worth noting the basic characteristics and differences of the current approach. Some recent improved pest prediction models, for example, use machine-learning algorithms, which are usually trained on large insect population datasets and environmental factors to identify population patterns and make predictions. Raghavendra et al. [60], for instance, focused on the weather-based prediction of pests in cotton by using different prediction model machine learning algorithms such as multiple linear regression (REG) and generalized linear model (GLM). Shang et al. [61] proposed a prediction model to predict the occurrence of insect pests by combining two machine-learning algorithms, artificial neural network (ANN) and genetic algorithm (GA), while in Damos et al. [62], autoregressive recurrent and focused time-delay ANNs are applied on large phenology data set to predict outbreaks of important arthropod vectors.
However, despite being potentially more efficient than traditional statistical models [63], these modeling approaches may not work well when the datasets are limited. Conceptually, they are computing models designed to process information through dynamic state responses to external inputs [64], and thus do not include any rate models with biologically interpretable parameters. The current modeling approaches are useful because they take into account the effect of temperature on insect development in a deterministic manner, thereby improving the accuracy and usefulness of insect population predictions with limited data sets, backed by a strong theoretical background.
On the other hand, the accuracy of the heat summation models relies on the accuracy and consistency of temperature data. Small variations in temperature can affect insect development and emergence, making it important to use accurate and high-quality temperature data. Additionally, the current models are species specific, meaning that a separate model must be developed for each pest species. These models require several inputs, including base temperature and degree-day thresholds, which must be determined through experimental or field observations [41]. This process can be time consuming and resource intensive, particularly for less common or newly discovered insect species for which parameters are not available. One other constraint of the current approach is that it does not take into account other climatic variables such as humidity, nutrition, as well as crowding and competition at different density levels and in different patch sizes. Nevertheless, while plant nutrition and irrigation concerns may affect the growth and development of T. urticae, this mainly relates to the occurrence of damage rather than the prediction outputs of the models, which are solely driven by temperature.
In this context, a future key research question is whether traditional heat and rate summation models and modern machine learning techniques differ in terms of the accuracy of their predictions for a certain pest and area. Furthermore, although temperatures are a driving factor of pest population dynamics, it is inof our special interest to test whether we can improve the predictions by incorporating more variables (i.e., host plant nutrition, water conditions). This is the focus of our next study.

5. Conclusions

In the present work, we aimed to predict the development of spider mite populations under field conditions to be further used in decision-making and rational pest management. We combined rate and heat summation models estimating problematic metrics of phenology patterns such as the start of egg and peak of egg laying and the onset of successive generations of T. urticae. Additionally, the approach resulted in the development of degree-day thresholds to be used as a rational tool for predicting the most important phenological events of T. urticae. The performance and accuracy of the predictions was assessed by examining the actual leaf damage caused by T. urticae in four experimental bean cultivations. Compared to other studies, the advantage of the current thresholds is that we have developed them using field data. Despite the inherent limitations of the current work, we expect that the present study will fill the gap of the absence of modeling of T. urticae phenological events in a bean crop and provide algorithms and risk thresholds that are necessary to develop digital plant protection systems for the rational management of spider mites, thus reducing the hazards of synthetic chemicals.

Author Contributions

Conceptualization, P.D. and F.P.; methodology, software and computing, P.D.; experimentation, data collection and validation E.T., P.D. and F.P.; formal analysis and data curation, P.D.; writing—original draft preparation, P.D.; review and editing, P.D., F.P., T.K. and M.L.; project supervision, F.P.; project administration and funding acquisition, M.L. All authors have read and agreed to the published version of the manuscript.

Funding

This research has been co-financed by the European Regional Development Fund of the European Union and Greek national funds through the Operational Program Competitiveness, Entrepreneurship and Innovation (project code MIS 5047196).

Institutional Review Board Statement

Not applicable.

Data Availability Statement

Experimental data are available upon request.

Conflicts of Interest

The authors declare no conflict of interest. The funders had no role in the design of the study; in the collection, analyses, or interpretation of data; in the writing of the manuscript; or in the decision to publish the results.

References

  1. Uebersax, M.A.; Cichy, K.A.; Gomez, F.E.; Porch, T.G.; Heitholt, J.; Osorno, J.M.; Kamfwa, K.; Snapp, S.S.; Bales, S. Dry beans (Phaseolus vulgaris L.) as a vital component of sustainable agriculture and food security—A review. Legume Sci. 2022, 5, e155. [Google Scholar] [CrossRef]
  2. Papathanasiou, F.; Ninou, E.; Mylonas, I.; Baxevanos, D.; Papadopoulou, F.; Avdikos, I.; Sistanis, I.; Koskosidis, A.; Vlachostergios, D.N.; Stefanou, S.; et al. The Evaluation of Common Bean (Phaseolus vulgaris L.) Genotypes under Water Stress Based on Physiological and Agronomic Parameters. Plants 2022, 11, 2432. [Google Scholar] [CrossRef] [PubMed]
  3. Hellenic Statistical Authority. 2019. Available online: https://www.statistics.gr/ (accessed on 1 October 2022).
  4. Vakali, C.; Baxevanos, D.; Vlachostergios, D.N.; Tamoutsidis, E.; Papathanasiou, F.; Papadopoulos, I. Genetic characterization of agronomic, physiochemical, and quality parameters of dry bean landraces under low-input farming. J. Agric. Sci. Technol. 2017, 19, 757–767. [Google Scholar]
  5. Prespa: Agriculture and Environment, Society for the Protection of Prespa (SPP). 2009. Available online: https://www.spp.gr/oemn%20en.pdf (accessed on 5 January 2023).
  6. Damos, P.; Tsikos, E.; Louta, M.; Papathanasiou, F. Towards the development of a smart plant protection solution for improved pest management of dry beans (Phaseolus vulgaris L.) in Northern Greece Proceedings. Proceedings 2021, 68, x. [Google Scholar]
  7. Bolland, H.R.; Gutierrez, J.; Flechtmann, C.H.W. (Eds.) World Catalogue of the Spider Mite Family (Acari:Tetranychidae); Brill: Leiden, The Netherlands, 1998. [Google Scholar]
  8. Jakubowska, M.; Dobosz, R.; Zawada, D.; Kowalska, J. A Review of Crop Protection Methods against the Twospotted Spider Mite—Tetranychus urticae Koch (Acari: Tetranychidae)—With Special Reference to Alternative Methods. Agriculture 2022, 12, 898. [Google Scholar] [CrossRef]
  9. Ahmadi, M.; Fathipour, Y.; Kamali, K. Population growth parameters of Tetranychus urticae (Acari: Tetranychidae) on different bean varieties. J. Entomol. Soc. Iran 2007, 26, 1–10. [Google Scholar]
  10. Laing, J.E. Life history and life table of Tetranychus urticae Koch. Acarologia 1969, 11, 32–42. [Google Scholar]
  11. Puspitarini, R.D.; Fernando, I.; Rachmawati, R.; Hadi, M.S.; Rizali, A. Host plant variability affects the development and reproduction of Tetranychus urticae. Int. J. Acarol. 2021, 47, 381–386. [Google Scholar] [CrossRef]
  12. Gotoh, T. Termination pattern of diapauze in Tetranychus urticae Koch (Acari: Tetranychidae) in Sapporo. Appl. Entomol. Zool. 1986, 21, 480–481. [Google Scholar] [CrossRef] [Green Version]
  13. Vacante, V. The Handbook of Mites of Economic Plants: Identification, Bio-Ecology and Control; CABI International: Wallingford, UK, 2016; pp. 1–890. [Google Scholar]
  14. Damos, P.; Papathanasiou, F.; Tsikos, E.; Kyriakidis, T.; Louta, M. Bayesian Non-Parametric Thermal Thresholds for Helicoverpa armigera and Their Integration into a Digital Plant Protection System. Agronomy 2022, 12, 2474. [Google Scholar] [CrossRef]
  15. Köppen, W. Klassification der Klimate nach Temperatur, Niederschlag and Jahreslauf. Petermanns Geogr. Mitt. 1918, 64, 193–203, 243–248. [Google Scholar]
  16. Riahi, E.; Shishehbor, P.; Nemati, A.N.; Saeidi, Z. Temperature Effects on Development and Life TableParameters of Tetranychus urticae (Acari: Tetranychidae). J. Agr. Sci. Technol. 2013, 15, 661–672. [Google Scholar]
  17. Singh, R.; Mangat, N.S. Stratified Sampling. In Elements of Survey Sampling. Kluwer Texts in the Mathematical Sciences; Springer: Dordrecht, Germany, 1996; Volume 15. [Google Scholar]
  18. Steven, K.; Thompson, S.K. Stratified sampling. In Sampling; Wiley Series in Probability and Statistics; Walter, A.S., Wilks, S.S., Eds.; John Wiley & Sons: Hoboken, NJ, USA, 2012. [Google Scholar]
  19. Garrett, G. In Encyclopedia of Social Measurement. 2005. Available online: https://www.sciencedirect.com/topics/mathematics/stratified-sample (accessed on 18 November 2022).
  20. Morrill, W.L.; Shepard, B.M. Methods for Measuring Crop Losses by Insects. In Encyclopedia of Entomology; Capinera, J.L., Ed.; Springer: Dordrecht, Germany, 2008. [Google Scholar] [CrossRef]
  21. Wagner, T.L.; Wu, H.I.; Feldman, R.M.; Share, P.J.H.; Coulson, R.N. Multiple-cohort Approach for Simulating Development of Insect Populations Under Variable Temperatures. Ann. Entomol. Soc. Am. 1985, 78, 691–704. [Google Scholar] [CrossRef]
  22. Ghosh, J.B. A rate summation model of temperature dependent development with stochastic extensions. Math. Model. 1987, 8, 170–171. [Google Scholar] [CrossRef] [Green Version]
  23. Koveos, D.S.; Kroon, A.; Veerman, A. Geographical variation of diapause intensity in the spider mite Tetranychus urticae. Physiol. Entomol. 1993, 18, 50–56. [Google Scholar] [CrossRef]
  24. Lactin, D.J.; Holliday, N.J.; Johnson, D.L.; Craigen, R. Improved rate model of temperature-dependentdevelopment by arthropods. Environ. Entomol. 1995, 24, 68–75. [Google Scholar] [CrossRef]
  25. Stinner, R.E.; Gutierrez, A.P.; Butler, G.D., Jr. An algorithm for temperature depended growth rare simulation. Can. Entomol. 1974, 106, 519–524. [Google Scholar]
  26. Wagner, T.; Hsin, W.; Sharpe, P.; Schoolfield, R.M.; Coulson, R. Modeling insect developmental rates: A literature review and application of a biophysical model. Ann. Entomol. Soc. Amer. 1984, 77, 208–220. [Google Scholar] [CrossRef]
  27. Vangansbeke, D.; Audenaert, J.; Nguyen, D.T.; Verhoeven, R.; Gobin, B.; Tirry, L.; De Clercq, P. Diurnal Temperature Variations Affect Development of a Herbivorous Arthropod Pest and its Predators. PLoS ONE 2015, 10, e0124898. [Google Scholar] [CrossRef] [Green Version]
  28. Farazmand, A. Effect of the temperature on development of Tetranychus urticae (Acari: Tetranychidae) feeding on cucumber leaves. Int. J. Acarol. 2020, 46, 381–386. [Google Scholar] [CrossRef]
  29. Kim, D.S.; Lee, J. Oviposition model of overwintering adult Tetranychus urticae (Acari: Tetranychidae) and mite phenology on the ground cover in apple orchards. Exp. Appl. Acarol. 2003, 31, 191–2008. [Google Scholar] [CrossRef]
  30. Curry, C.L.; Feldman, R.M. Mathematical Foundations of Population Dynamics; Texas A&M University Press: College Station, TX, USA, 1987; 240p. [Google Scholar]
  31. Kim, J.S.; Jung, C.; Lee, J.H. Parameter estimation fort the temperature-dependent development model of Tetranychus urticae Koch: Immature development. J. Asia-Pac. Entomol. 2001, 4, 123–129. [Google Scholar] [CrossRef]
  32. Mack, T.P.; Smith, J.W., Jr. Modeling insect recruitment. In Basics of Insect Modeling; Goodenough, J.L., McKinion, J.M., Eds.; American Society of Agricultural Engineers: St. Joseph, MI, USA, 1992; pp. 155–169. [Google Scholar]
  33. Mack, T.P.; Smith, J.W., Jr.; Reed, R.B. Mathematical model of the population dynamics of the lesser cornstalk borer, Elasmopalpus lignosellus (Lepidoptera: Pyralidae). Ecol. Modell. 1987, 39, 267–286. [Google Scholar] [CrossRef]
  34. Birley, M. The estimation of insect density and instar survivorship functions from census data. J. Anim. Ecol. 1977, 46, 497–510. [Google Scholar] [CrossRef]
  35. Clements, A.N.; Paterson, G.D. The analysis of mortality and survival rates in wild populations of mosquitoes. J. Appl. Ecol. 1981, 18, 373–399. [Google Scholar] [CrossRef]
  36. Readshaw, J.L.; van Gerwen, A.C.M. Age-specific survival, fecundity and fertility of the adult blow fly in relation to crowding, protein food and population cycles. J. Anim. Ecol. 1983, 52, 879–887. [Google Scholar] [CrossRef]
  37. Bartlett, P.W.; Murray, A.W.A. Modeling adult survival in the laboratory of diapause and nondiapause colorado beetle, Leptinotarsa decemlineata (Coleoptera: Chrysomelidae) from Normandy, France. Ann. Appl. Biol. 1986, 108, 487–501. [Google Scholar] [CrossRef]
  38. Madden, L.V.; Nault, L.R.; Heady, S.E.; Styer, W.E. Effect of temperature on the population dynamics of three Dalbulus leafhopper species. Ann. Appl. Biol. 1986, 108, 475–485. [Google Scholar] [CrossRef]
  39. Marchiorio, C.A.; Foerster, L.A. Modeling of Plutella xylostella L. (Lepidoptera: Plutellidae): Climate change may modify pest incidence levels. Bul. Entomol. Res. 2012, 102, 489–496. [Google Scholar] [CrossRef]
  40. Choi, K.S.; Samayoa, A.C.; Hwang, S.Y.; Huang, Y.B.; Ahn, J.J. Thermal effect on the fecundity and longevity of Bactrocera dorsalis adult and their improved oviposition model. PLoS ONE 2020, 15, e0235910. [Google Scholar] [CrossRef]
  41. Damos, P.; Savopoulou-Soultani, M. Development and statistical evaluation of models in forecasting major lepidopterous peach pest complex for integrated pest management programs. Crop Prot. 2010, 29, 1190–1199. [Google Scholar] [CrossRef]
  42. Goodsman, D.W.; Aukema, B.H.; McDowell, N.G.; Middleton, R.S.; Xu, C. Incorporating variability in simulations of seasonally forced phenology using integral projection models. Ecol. Evol. 2018, 8, 162–175. [Google Scholar] [CrossRef] [Green Version]
  43. Jeppson, L.R.; Keifer, H.H.; Baker, E.W. Mites Injurious to Economic Plants; University of California Press: Berkeley, CA, USA, 1975. [Google Scholar]
  44. Takafuji, A.; Ozawa, A.; Nemoto, H.; Gotoh, T. Spider Mites of Japan: Their Biology and Control. Exp. Appl. Acarol. 2000, 24, 319–335. [Google Scholar] [CrossRef]
  45. Pakyari, H.; Amir-Maafi, M.; Dong-Soon, K.; Enkegaard, A. Oviposition Model of Scolothrips longicornis Fed on Two-Spotted Spider Mite. Acad. J. Entomol. 2012, 5, 65–72. [Google Scholar]
  46. Herbert, H.J. Biology, life tables, and innate capacity for increase of the twospotted spider mite, Tetranychus urticae (Acarina: Tetranychidae). Can. Ent. 1982, 113, 371–378. [Google Scholar] [CrossRef]
  47. Carey, J.R.; Bradley, J.W. Developmental rates, vital schedules, sex ratios, and life tables for Tetranychus urticae, T. turkestani and T. pacificus (Acarina: Tetranychidae) on cotton. Acarologia 1982, 23, 333–345. [Google Scholar]
  48. Karami-Jamour, T.; Shishehbor, P. Development and life table parameters of Tetranychus turkestani (Acarina: Tetranychidae) at different constant temperatures. Acarologia 2012, 52, 113–122. [Google Scholar] [CrossRef]
  49. Ju, K.; Sangkoo, L.; JeongMan, K.; YoungRip, K.; TaeHeung, K.; Jisoo, K. Effect of Temperature on Development and Life Table Parameters of Tetranychus urticae Koch (Acari:Tetranychide) Reared on Eggplants. Korean J. Appl. Entomol. 2008, 47, 163–168. [Google Scholar]
  50. Rott, A.S.; Ponsonby, D.J. The effects of temperature, relative humidity and hostplant on the behaviour of Stethorus punctillum as apredator of the two-spotted spider mite, Tetranychus urticae. BioControl 2000, 45, 155–164. [Google Scholar] [CrossRef]
  51. Taghizadeh, R.; Chi, H. Demography of Tetranychus urticae (Acari: Tetranychidae) under different nitrogen regimes with estimations of confidence intervals. Crop Prot. 2022, 155, 105920. [Google Scholar] [CrossRef]
  52. Sohrabi, F.; Shishehbor, P. Effects of host plant and temperature on growth and reproduction of the strawberry spider mite, Tetranychus turkestani Ugarov and Nikolski (Acari: Tetranychidae). Syst. Appl. Acarol. 2008, 13, 26–32. [Google Scholar] [CrossRef]
  53. Chauhan, R.K.; Shukla, A. Population dynamics of two spotted spider mite, Tetranychus urticae Koch on French bean (Phaseolus vulgaris L.). Int. J. Plant Prot. 2016, 9, 536–539. [Google Scholar] [CrossRef]
  54. Osman, M.A.; Zamzam, M.; Dhafar, A.; Alqahtani, A.M. Biological responses of the two-spotted spider mite, Tetranychus urticae to different host plant, Arch. Phytopath. Plant Prot. 2019, 52, 1229–1238. [Google Scholar]
  55. Saeid, S.; Najafabadi, M. Comparative biology and fertility life tables of Tetranychus urticae Koch (Acari: Tetranychidae) on different common bean cultivars, Int. J. Acarol. 2012, 38, 706–714. [Google Scholar]
  56. Rao, K.S.; Vishnupriya, R.; Ramaraju, K.; Poornima, K. Effect of abiotic factors on the population dynamics of two spotted spider mite, Tetranychus urticae Koch and its predatory mite, Neoseiulus longispinosus (Evans) in Brinjal Ecosystem. J. Exp. Zool. 2018, 21, 797–800. [Google Scholar]
  57. Kanika, R.G.; Geroh, M. Impact of Weather Parameters on the Population Dynamics of Tetranychus urticae Koch on Field Grown Cucumber. Ann. Biol. 2014, 30, 140–145. [Google Scholar]
  58. Santamaria, M.E.; Arnaiz, A.; Rosa-Diaz, I.; González-Melendi, P.; Romero-Hernandez, G.; Ojeda-Martinez, D.A.; Garcia, A.; Contreras, E.; Martinez, M.; Diaz, I. Plant Defenses Against Tetranychus urticae: Mind the Gaps. Plants 2020, 9, 464. [Google Scholar] [CrossRef] [Green Version]
  59. Louta, M.; Papathanasiou, F.; Damos, P.; Ploskas, N.; Dasygenis, M.; Kyriakidis, T.; Dimokas, N.; Balafas, V.; Chatzisavvas, A.; Karampelia, I.; et al. Intelligent Pesticide and Irrigation Management in Precision Agriculture: The case of VELOS Project. In Proceedings of the HAICTA 2022, Athens, Greece, 22–25 September 2022; pp. 91–99. [Google Scholar]
  60. Raghavendra, K. Weather based prediction of pests in cotton. In Proceedings of the International Conference on Computational Intelligence and Communication Networks, Bhopal, India, 14–16 November 2014. [Google Scholar]
  61. Shang, Y.; Zhu, Y. Research on intelligent pest prediction of based on improved artificial neural network. In Proceedings of the Chinese Automation Congress (CAC), Xi’an, China, 30 November–2 December 2018. [Google Scholar]
  62. Damos, P.; Tuells, J.; Caballero, P. Soft Computing of a Medically Important Arthropod Vector with Autoregressive Recurrent and Focused Time Delay Artificial Neural Networks. Insects 2021, 12, 503. [Google Scholar] [CrossRef]
  63. Saleem, R.M.; Kazmi, R.; Bajwa, I.S.; Ashraf, A.; Ramzan, S.; Anwar, W. IOT-Based Cotton Whitefly Prediction Using Deep Learning. Sci. Program. 2021, 2021, 8824601. [Google Scholar] [CrossRef]
  64. Olden, J.D.; Jackson, D.A. Illuminating the “black box”: A randomization approach for understanding variable contributions in artificial neural networks. Ecol. Model. 2002, 154, 135–150. [Google Scholar] [CrossRef]
Figure 1. Field recordings of average daily temperatures (a) and accumulative degree days (b) during the growth seasons of 2021 and 2022 in the region of Prespa lakes in Northern Greece, and the respective dates were temperature and photoperiod conditions are favorable for T. urticae development.
Agriculture 13 00756 g001
Figure 2. Conceptual rate summation model scheme and related algorithm developed for simulating and predicting T. urticae phenology in dry bean cultivations under field conditions. The model consists of accumulating the development rate every day from the egg laying date. The development of a given stage is completed when the accumulation of development rate reaches one, and then the same calculation is made for the following larval stages. The beginning (first day of development of the first individual who reached the stage), the end (last day of development of the last individual who reached the stage), and the mean duration of each instar, as well as the percentage of individuals therein, were also calculated.
Agriculture 13 00756 g002
Figure 3. Simulated T. urticae egg production model output and related during the dry bean growth season of (a) 2021 and (b) 2022 in the region Prespa lakes in Northern Greece.
Agriculture 13 00756 g003
Figure 4. Simulated total egg-to-adult development of T. urticae and succession of generations according to the developmental rate summation model output scaled over the linear heat summations (degree days) and comparison with actual plant damage caused by T. urticae in dry bean during 2021 (a) and 2022 (b).
Agriculture 13 00756 g004aAgriculture 13 00756 g004b
Table 1. Ordinal (linear) heat summation (degree-days) risk thresholds of reproductive 3.4. Suitability of weather conditions and heat summations.
Degree-Days of Overwintering T. urticae Egg Laying Events
YearStart of OvipositionFirst Egg PeakSecond Egg PeakThird Egg PeakPooled Egg Peak
202157137.2292.2461.7123.8
202258,4146.5332479.3265.7
Pooled57.7141.8321.1470.5194.75
Table 2. Degree-day developmental heat summation risk thresholds of total egg to adult T. urticae development in respect to corresponding predictions generated by the developmental rate summation model.
YearPhenological EventT. urticae GenerationMean
1st 2nd 3rd 4th 5th 6th 7th 8th 9th
2021Half of first generation *187505822104412951513174519672193
Total generation time *278280274258237233235220229249.3 (±7.7)
2022Developmental threshold234547792104812711519174419692195
Total generation time300257250239225252224239256249.2 (±6.7)
PooledDevelopmental threshold2015268071046128315161744.519682194
Total generation time289268.5262248.5231242.5229.5229.5242.5249.8 (±5)
Disclaimer/Publisher’s Note: The statements, opinions and data contained in all publications are solely those of the individual author(s) and contributor(s) and not of MDPI and/or the editor(s). MDPI and/or the editor(s) disclaim responsibility for any injury to people or property resulting from any ideas, methods, instructions or products referred to in the content.

