Article

Comparative Primary Metabolite Profiling of Setaria viridis Reveals Potential Markers to Water Limitation

by
Fernanda Alves de Freitas Guedes
1,2,†,
Luana Beatriz dos Santos Nascimento
2,*,†,
Mara Priscila Costa
2,
Andrew Macrae
2,3,
Marcio Alves-Ferreira
1,2,
Camila Caldana
4 and
Fernanda Reinert
2,5
1
Departamento de Genética, Instituto de Biologia, Universidade Federal do Rio de Janeiro (UFRJ), Av. Prof Rodolpho Paulo Rocco, s/n–CCS, Rio de Janeiro 21941-970, RJ, Brazil
2
Programa de Pós-Graduação em Biotecnologia Vegetal, Universidade Federal do Rio de Janeiro (UFRJ), Av. Carlos Chagas Filho, s/n–CCS, Rio de Janeiro 21941-590, RJ, Brazil
3
Instituto de Microbiologia Paulo de Góes, Universidade Federal do Rio de Janeiro (UFRJ), Rio de Janeiro 21941-901, RJ, Brazil
4
National Center for Research in Energy and Materials (CNPEM), Campinas 13083-100, SP, Brazil
5
Departamento de Botânica, Instituto de Biologia, Universidade Federal do Rio de Janeiro (UFRJ), Av. Prof Rodolpho Paulo Rocco, s/n–CCS, Rio de Janeiro 21941-970, RJ, Brazil
*
Author to whom correspondence should be addressed.
These authors contributed equally to this work.
Agriculture 2023, 13(3), 660; https://doi.org/10.3390/agriculture13030660
Submission received: 26 January 2023 / Revised: 11 February 2023 / Accepted: 13 February 2023 / Published: 11 March 2023

Abstract

:
Growing varieties with higher water-use efficiency is crucial to address water limitation in agriculture. Breeding programs often resort to model plants, and Setaria viridis has been consolidating its position as a model for C4 grasses. However, we lack a detailed analysis of drought-induced metabolic changes in S. viridis. To partially redress this, we assessed the primary metabolic profile of roots, leaves, and panicles in response to three watering levels. Five-day-old seedlings were submitted to water-limiting conditions for 25 days when samples were harvested. GC-MS-based analysis revealed that each plant organ had a specific metabolic profile, with TCA intermediates altered in above- and underground parts. The sPLS-DA analysis allowed clear separation of the water regimes for the three organs. Of the 36 most important metabolites, only four (sucrose, glycerol-3P, gluconate and adenine) were shared by all plant organs. A subset of 12 metabolites, including proline, were further evaluated as drought bioindicator candidates, with galactinol and gluconate emerging for vegetative parts while alanine seems informative of aerial part water status. In general, water limitation decreased the content of nitrogen compounds in aboveground tissues and increased the amounts of carbohydrates, especially in the sink organs. This study adds to our understanding of the metabolic responses of grasses to water limitation and identified potential bioindicators for drought in different plant organs.

1. Introduction

The ability of plants to respond efficiently to water availability is crucial for survival and productivity. Restrictions in water supply can result in biomass reduction, crop yield losses, and hinder or greatly impact plant growth and development [1,2,3]. When exposed to environmental changes, plants may alter their metabolic pathways to return to their homeostasis condition, a process called acclimation [4]. Water stress often triggers changes in content of carbohydrate alcohols (e.g., mannitol, sorbitol), soluble carbohydrates (e.g., sucrose, glucose), amino acids (e.g., proline, glycine, betaine, adenine) [5] and secondary metabolites [5,6]. They can act as adjustment osmolytes, osmoprotectants, antioxidants (scavengers of reactive oxygen species—ROS) and/or defense metabolites [7].
Besides varying according to environmental conditions, plant species, and developmental stages, the physiological and metabolic responses to drought can differ among plant parts. This variation may be a result of surrounding environments and/or organ-specific functions in plant development and physiology [2,8,9]. Drought affects shoot physiology by triggering stomatal closure, which changes the water use efficiency, transpiration, and relative water content. At the root level, drought reduces water-uptake capacity and triggers changes in root length and density [9]. As such, each plant organ has distinct strategies to cope with and survive water limitation. Nevertheless, the adaptations of different plant organs to drought have barely been studied.
The metabolic responses of plants to water deficit go beyond the accumulation of a restricted group of metabolites. In this sense, a metabolomic approach is suitable to study plant abiotic responses, offering a broad picture of metabolic profiles under contrasting environmental conditions, and also identifying metabolic signatures of water deficit [1,6,7,10,11].
Our metabolic and molecular knowledge of plants under water stress is mainly centered on eudicot species, such as Arabidopsis thaliana. However, the extension of Arabidopsis responses to monocotyledonous crop species is limited [3], especially to those with C4 metabolism. As such, studies on C4 model plants aiming to elucidate the metabolic profile for a given level of water limitation are necessary to widen the knowledge of early response to drought and potentially guide breeders through selection of more resistant grass crops, such as maize and sugarcane. Setaria viridis (L.) Beauvois, popularly known as green millet, has been receiving special worldwide attention during the last decade as a model plant to study grasses with C4 photosynthetic metabolism [12] and C4 bioenergy grasses [13].
Despite the existence of studies focused on responses of S. viridis to water stress [12,14], a detailed analysis of changes in the metabolite profile and in different plant organs has not been conducted. The aim of this study was to assess the primary metabolic profile of roots, leaves and panicles of S. viridis grown under contrasting levels of water availability—from seedling to flowering initiation. The results obtained here will help to elucidate the metabolic behavior of this model C4 species in response to water limitation, with potential implications for related crop productivity.

2. Materials and Methods

2.1. Plant Material and Water Treatments

Seeds of Setaria viridis (accession A10.1) were allowed to germinate in petri dishes for four days (one day at 5 °C followed by three days at 22 °C and photoperiod of 16/8 h light/dark) under 550 μmol m−2 s−1. Five-day-old seedlings were individually planted in plastic pots (200 mL) in a mixture of pit-like substrate and vermiculite (4:1). One hundred plants, randomly distributed on the greenhouse benches of the Postgraduation Program of Plant Biotechnology, grew for 20 days under natural light and one of three conditions of water availability during the months of May to June in Rio de Janeiro (Brazil). The control treatment consisted of watering the plants every 2–3 days, bringing them back to 100% of the soil pot capacity (SPC) level. The total weight used to calculate SPC was previously determined for pot + soil. Plants were watered with a commercial Hoagland plant nutrient solution twice at weekly intervals. Plants submitted to the two water-reduced treatments received 50% and 25% of the water (in weight) given to the control plants. Plants were randomized along the benches every watering day. Plants reached the flowering stage around the 21st DAP (day after planting).

2.2. Sampling, Yield and Stomata Conductance

On the sampling day (25th DAP), we sampled two subsets of plants per treatment: five plants were used for total plant dry weight and stomatal conductance measurements, while 20 plants were used for metabolite profiling (pooled samples of five plants per replicate). Stomatal conductance was measured in the latest fully expanded leaf in the middle of the morning using a porometer (SC1, Decagon®, São Paulo, Brazil).

2.3. Metabolite Extraction and Gas Chromatography Coupled with Mass Spectrometry Analysis (GC-MS)

To investigate the metabolic profiles, we separately harvested roots (R), leaves (L—leaves plus culm) and panicles (P—panicles plus stalks) at the 25th DAP. For each plant organ and water treatment, five biological replicates were analyzed, each replicate comprising five plant samples. The biological replicates were ground to a fine powder in liquid nitrogen and lyophilized. The dried ground tissue (50 mg) was extracted in 1 mL of a precooled (−15 °C) mixture of MTBE:methanol:water 3:1:1 (v/v/v), as previously described [15]. The organic phase (100 μL) was dried and derivatized [16]. Samples (1 μL) were analyzed on an Agilent® 7890 gas chromatograph coupled with a LecoPegasus 2 time-of-flight mass spectrometer (LECO, St. Joseph, MI, USA) [17]. Chromatograms were exported from LecoChroma TOF software® (version 3.25) to R software®. Peak detection, retention time alignment, and library matching were performed using the Target Search R-package® [18]. Metabolites were quantified by the peak intensity of a selective mass. Metabolite intensities were normalized by dividing the dry weight, followed by the sum of total ion count and log2 transformation to be statistically evaluated by a discriminant analysis approach.

2.4. sPLS-DA Analysis

We used Metaboanalyst® v3 online (http://www.metaboanalyst.ca/ last accessed on 14 February 2023 http://www.metaboanalyst.ca/ (accessed on 14 February 2023) [19]) for the sparse partial least squares—discriminant analysis (sPLS-DA). The sPLS-DA algorithm was used because it can reduce the number of variables in metabolomic data, producing a robust and easy-to-interpret model. The missing values of the peak intensity input table were replaced by small values (half of the minimum positive value found in the data set). No additional filtering, normalization, transformation, or data scaling were carried out. We maintained the program default parameters (a model of five components and 10 variable—metabolites—in each component). To evaluate the performance of the model, 5-fold cross-validation (CV) was performed, and the classification error rate obtained from 10 independent CV runs were averaged. To further assess the differences among the samples and for bioindicator selection, we focused on the metabolites whose absolute loading values were >0.40 in sPLS-DA components 1 and 2. We explain the metabolite behavior according to the water treatment for each plant organ.

2.5. Statistical Analysis

Stomatal conductance, plant productivity and the content of the metabolites of plants grown under the three water treatments were statistically analyzed by one-way ANOVA, followed by Tukey’s post hoc test, using Statistic 7®.

3. Results and Discussion

3.1. Reduced Water Availability Decreases Biomass and Stomatal Conductance in Setaria

Water is one of the major limiting resources of plant productivity and the need of guiding parameters for plant breeders is the primary driving force for the characterization of model-plant responses to contrasting levels of water [2,3]. Firstly, we measured the plant dry weight and the stomatal conductance of S. viridis plants grown at 100% (control), 50% and 25% SPC (Supplemental Figure S1).
The two reduced levels of water supply significantly decreased the aboveground productivity by approximately 50%, without differences between the two water limiting treatments (Table 1). Consistently, the stomatal conductance decreased drastically when irrigation was limited to 50% and 25% of SPC (Table 1).
Stomatal closure in response to water constraint is one of the main factors that limits photosynthesis [20,21]. The observed reduction in stomatal conductance induced by water-shortage treatments (Table 1) indicates that S. viridis responses to water availability include stomatal closure and photosynthesis sacrifice, which directly reflect on reduced biomass accumulation. Similar results of 50% decreasing of stomatal conductance and dry biomass production was observed for some accessions of S. viridis submitted to water limitation in previous studies, showing a similar degree of impairment in net photosynthesis [22].
In our study, despite restrictions in carbon supply due to the two water-limited regimes, no shift in the vegetative-reproductive transition was observed in S. viridis, with plants submitted to all water regimes entering the reproductive phase around the 21st DAP. Saha and coworkers [22] observed that accession A10.1 was able to initiate flowering during the progression of water-deficit treatment. Taken together, these results suggest that S. viridis accession A10.1 may overcome the water constraints, even when prematurely imposed, and maintain the duration of its developmental phases. Additionally, the day length might have contributed to the onset of reproductive stage in S. viridis irrespective of water availability, since it is considered to be a major factor governing this species’ reproduction [12].

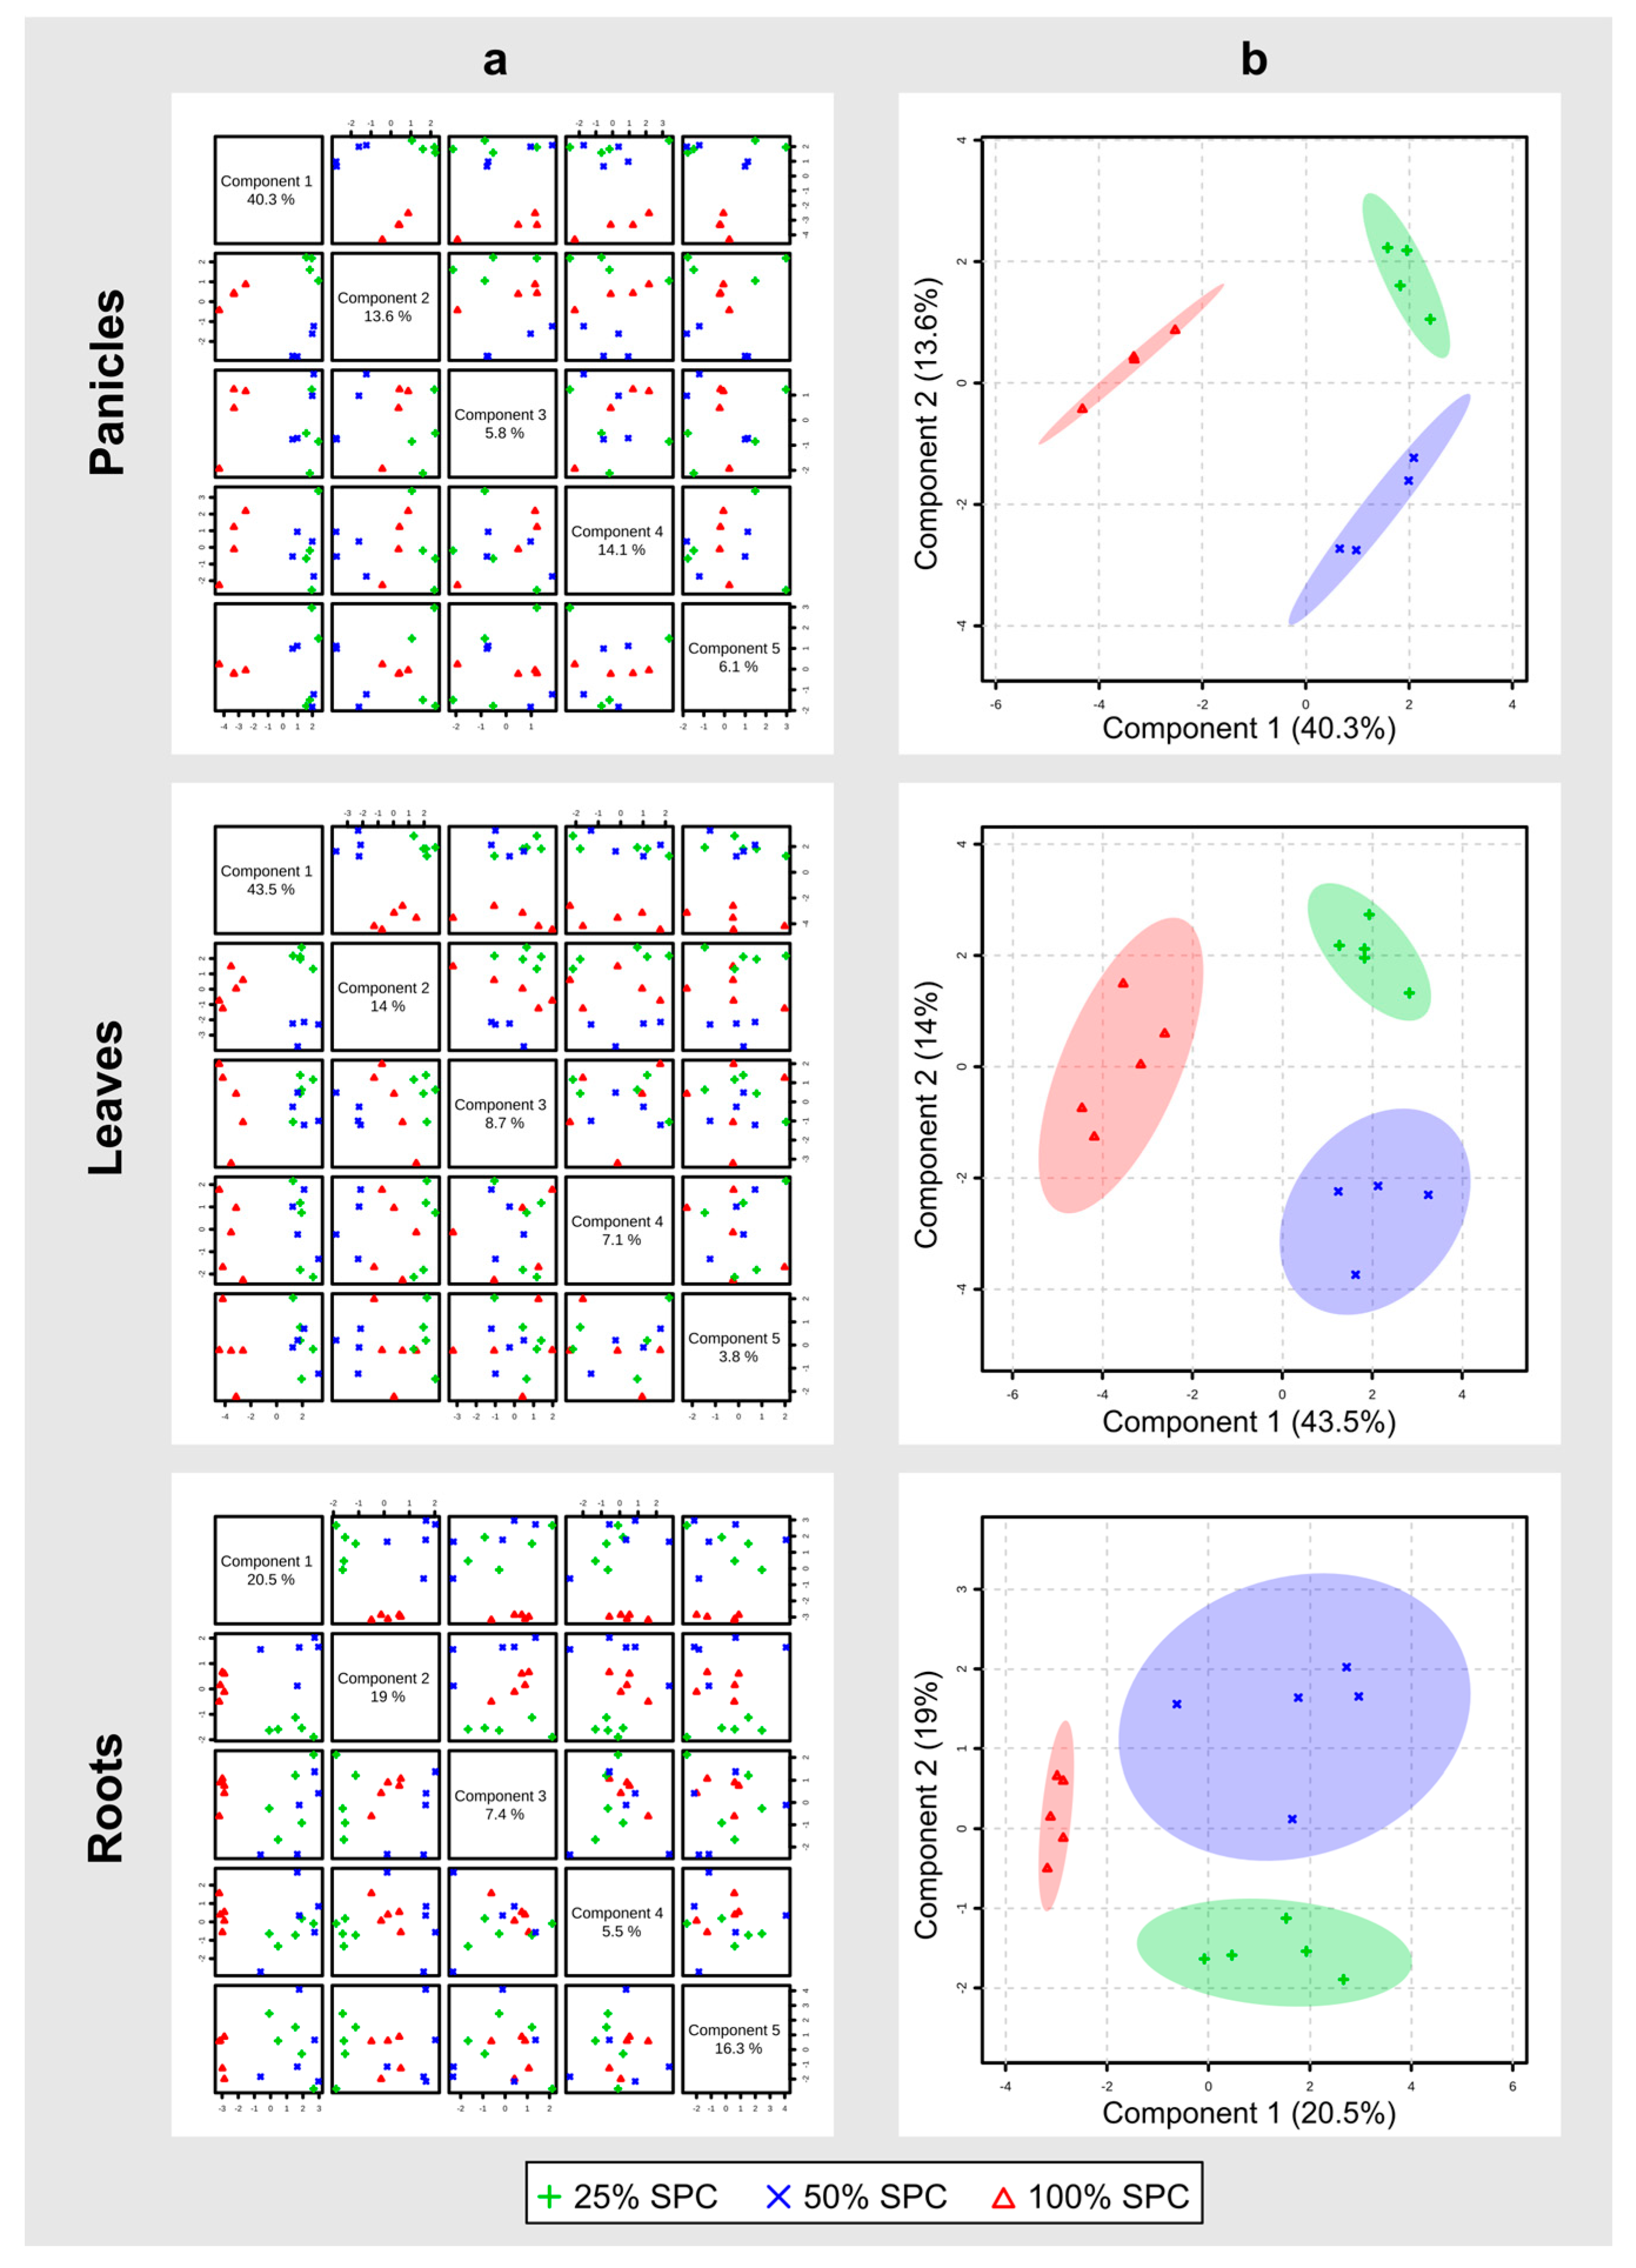
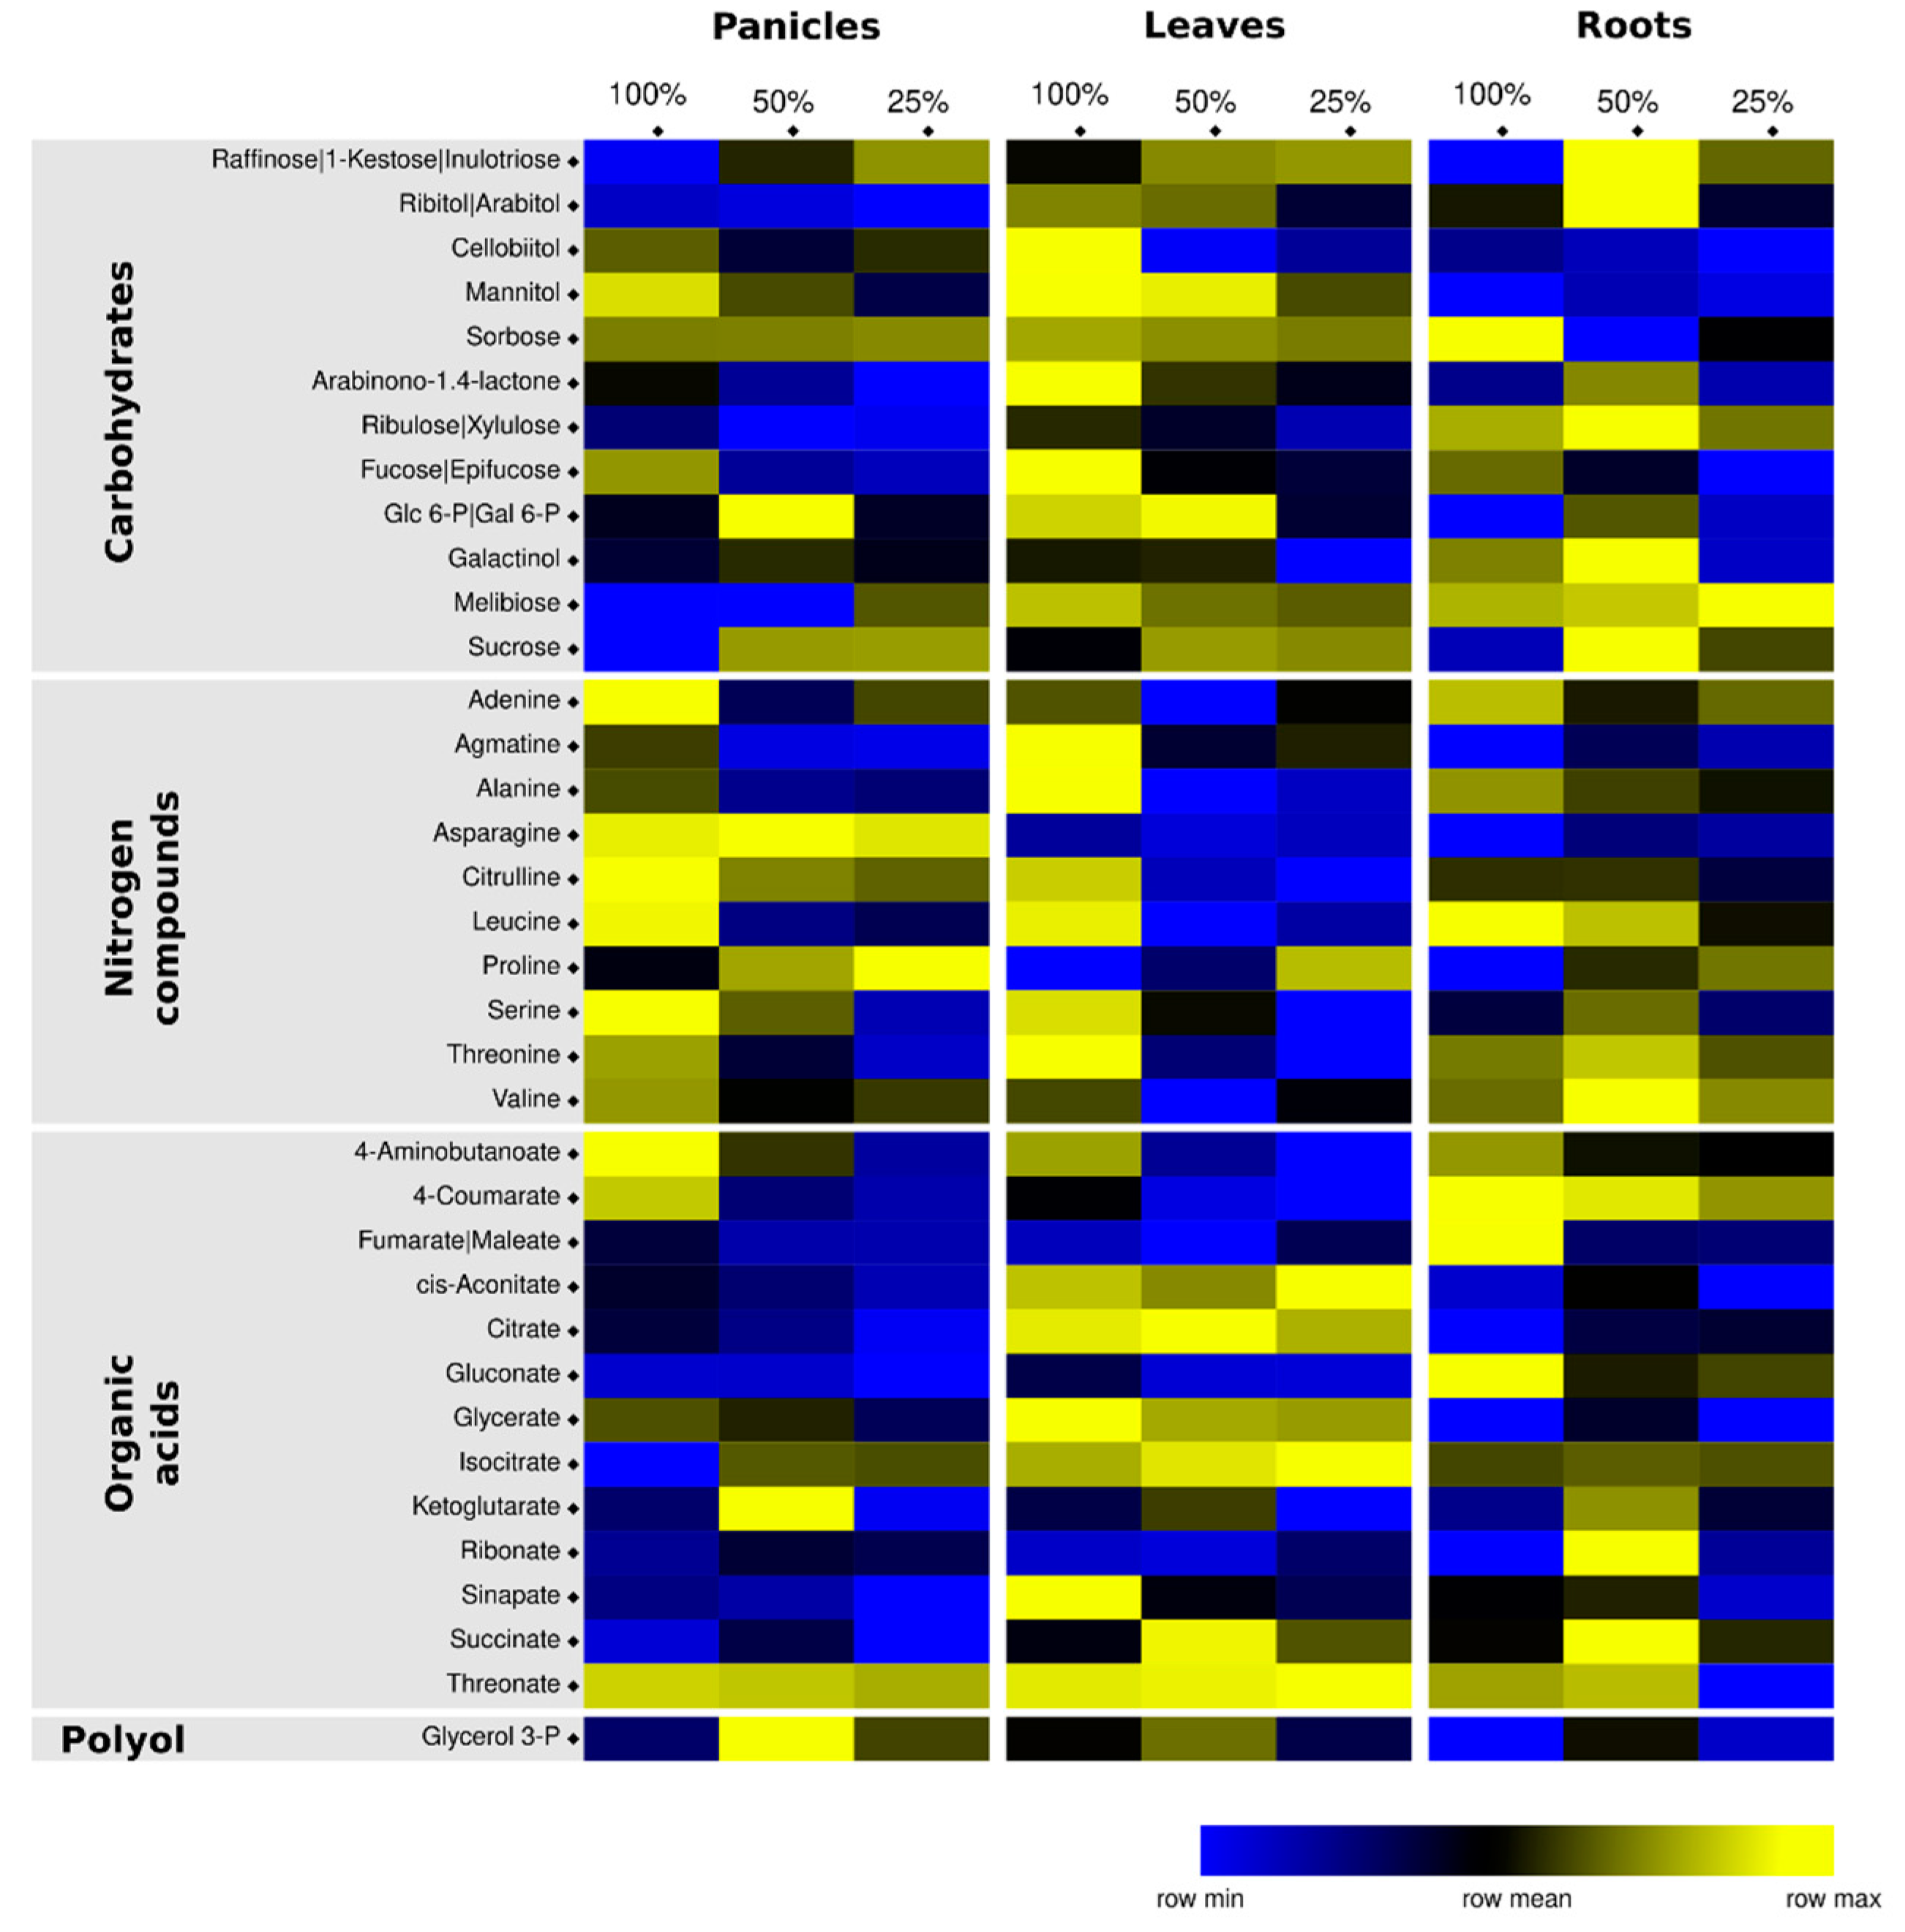
3.2. Metabolomics Analysis Highlights Organ-Specific Changes in Response to Drought

Using a GC-MS analysis, we were able to identify and determine the relative concentration of 61 metabolites (Supplemental Table S1) for three plant organs (R, L, and P) and three watering treatments (100%, 50% and 25% SPC). This set of metabolites was used as input for sPLS-DA analysis [23,24], a method increasingly applied to omics analysis, such as metabolomics [9,25,26]. An sPLS-DA variant assumes sparsity, meaning that a small number of features, such as metabolites, could explain an observed biological effect [27,28].
First, the comparison of metabolites of well-watered (control) samples revealed a clear separation of leaves, panicles, and roots (Supplemental Figure S2a), reinforcing the intuitive notion of organ-specific metabolite profiles underlying their specialized morphology and functions. Among the metabolites that contributed most to separate the organ samples (absolute loading scores >0.40) (Supplemental Figure S2b), tricarboxylic acid cycle (TCA) intermediates (cis-aconitate, isocitrate and ketoglutarate) exhibited higher levels in leaves, while galactinol content was higher in roots. According to our results, higher levels of asparagine, homoserine and cysteine were characteristic of panicles (Supplemental Figure S2b). During the reproductive phase, flowers, fruits, and seeds are a great sink for N, which is transported from the sources mainly as amino acids. Asparagine is one of the most abundant amino acids transported to the sink organs in a range of plants [29,30].
To investigate the metabolic changes triggered by water limitation, the sPLS-DA analysis was performed separately for each plant organ (Figure 1). Missing values comprised 3.4%, 3.8% and 10.3% for panicles, leaves and roots, respectively. The analysis was performed by using the default number of sPLS-DA components (PC) (five) and variables (metabolites) per component (10). The estimate of classification error rate showed that this parameter setting resulted in the smallest error rate for all organs (Supplemental Figure S3), with the error rate of leaves close to zero even for a lower number of components. The most important metabolites (absolute loading scores >0.40) for all five components are shown in Supplemental Table S2.
In panicles, the five PCs explained 79.9% of total metabolite variation, with PC1 and PC2 together contributing with 53.9%. Similarly, in leaves, 77.1% of variation was explained by all PCs and the first two PCs represented 57.5% of observed variation for the water treatments. For roots, less variation could be explained by the PC components (68.7% for all five components and 39.5% for first and second components together). Nevertheless, the sPLS-DA method results showed a clear discrimination between plants developed under the three water regimes and for all the evaluated plant organs (Figure 1b). Additionally, the sPLS-DA panicle clusters (Figure 1b) were the narrowest, followed by those of leaves and roots, which might reflect natural metabolite variance in different organs of S. viridis plants.
Since PC1 and PC2 together explained 40–60% of observed differences among treatments, the metabolites assigned to these components in panicles, leaves and roots were studied further (Figure 2; Supplemental Figure S4). They comprised a total of 36 metabolites, subsequently classified as carbohydrates (12), nitrogen compounds (10), organic acids (13) and polyol (1) (Figure 2). The different classes of primary metabolites play important roles in water–stress response. According to the literature, carbohydrates and polyols [31] can act as osmolytes, helping to keep membrane integrity and cell turgor. Moreover, these metabolites are a source of energy [32,33]. Nitrogen compounds, especially amino acids, are important osmoregulants, besides being used as precursors for protein synthesis [33]. Organic acids, on the other hand, regulate the pH and osmotic potential of plant cells, and play roles in energy metabolism [34].
Organ-specific responsive primary metabolites in S. viridis were identified in this study. The highest amount of responsive specific metabolites was observed in roots (8; 22.22%), followed by leaves (5; 13.89%) and panicles (3; 8.33%) (Figure 3; Supplemental Table S3). The greater similarity between leaves and panicles may be at least partially explained by the fact that roots, as an underground tissue, grow in an entirely different environment from the aerial parts. Often, roots are in direct contact with the soil, being responsible for absorbing essential resources such as water and nutrients. Roots also monitor the above ground environment [35,36]. Conversely, shoots are the major photosynthetic sites, besides being involved in circadian clock function and reproduction [36]. Each physiological and developmental role of these diverse plant parts is explained by their morphoanatomy, biochemistry and metabolic profile.
In agreement with our results, the metabolic responses to drought generally differ between shoots and roots [2]. Commonly, the metabolites shift in opposite directions in specific plant organs [2]. Metabolite production and modulation is the major mechanism for osmotic regulation in response to water availability [37]. Indeed, specific knowledge about the metabolites involved in water–stress responses can point to potential candidate pathways to be manipulated to develop plants that are more resistant to the adverse effects of decreasing water availability [38].
Among the 36 water-limitation-responsive metabolites in S. viridis, four (11.11%) were shared between the three plant organs (Figure 3 and Figure 4), including the high-scoring sucrose and gluconate.
Water limitation increased sucrose levels in above- and underground parts of S. viridis, independently of the treatment (Figure 4a). Similarly to starch in Arabidopsis, sucrose may serve as a carbon source in S. viridis [39]. Sucrose and other sugars are also important signal molecules in the regulation of stress responses and tolerance mechanisms in plants [36]. The metabolism of abscisic acid (ABA), a critical hormone for drought response, can be altered by hexose signals originating from sucrose cleavage [40]. Increased sucrose levels in response to water deficit have been reported for wheat cultivars [41,42]. Sugar content increases in response to mild [5] and severe water stresses [2], playing an important role in osmotic adjustment as compatible solute. By reducing the osmotic stress, sugars hamper the reduction of cell turgor, stabilizing membranes and subcellular structures [43].
The increase in sucrose level in response to water limitation was noticeable in the roots, but especially in the panicles of S. viridis (p < 0.001) (Figure 4a). The increment in sucrose content in panicles is probably related to its breakdown and translocation (remobilization) to reproductive parts to overcome their energetic demand. Sucrose is the main sugar loaded and transported in the phloem over long distances [44]. Sucrose and other carbohydrates have already been shown to be remobilized to panicles when there is a decrease in carbon assimilation, as generally occurs in plants submitted to water stress [45,46]. Reduced carbon assimilation could be a consequence of the observed reduction in stomatal conductance (Table 1). Approximately twice as much sucrose in the three organs when plants developed under both conditions of limited water supply highlights the multiple roles of this sugar for S. viridis. Sucrose was shown to function as a signal and energy source for flowering [47]. Our hypothesis is that the increased levels of sucrose in the panicle would ensure the energy requirement for reproduction, which is in accordance with the observed maintenance of the blooming time for S. viridis plants under water limitation.
Gluconate was another metabolite responsive to water limitation shared by the different plant organs, and particularly important to the vegetative parts in S. viridis. Its content significantly decreased in response to the water limitation in leaves and roots, without differences between the two water-restriction conditions (pL = 0.92, pR = 0.90; Figure 4). Gluconate have been reported in soybean and wheat plants in response to different types of stress [25,38,48,49,50]. Gluconate may act as a powerful chelator of metallic ions [51], and its decrease might affect antioxidant potential under low water availability. This compound is an intermediate that can redirect the carbon flow from glycolysis into the pentose phosphate pathway (PPP) to provide NADPH for antioxidant activity [48,50,52].
Adenine abundance significantly decreased in the 50% SPC-treated panicles, leaves and roots, followed by an increase at 25% SPC, particularly noticeable in the aerial parts (p < 0.001) (Figure 4a) in this study. Adenine, which is the main nucleotide for energy metabolism, showed a reduction in response to water deficit in Rangpur lime (Citrus limonia) roots [53].
A possible relationship among the four shared metabolites is shown in Figure 4b. For the sake of simplicity, intermediates of glycolysis and PPP are not shown. The proposed model suggests that the fate of glucose, which originates from sucrose breakdown, may differ in vegetative and reproductive organs of S. viridis plants grown with different water supply. While water limitation activates the glycolysis in panicles, the carbon flow seems to be affected by the PPP in vegetative parts. The PPP has a role in the antioxidant defenses not only by generating NADPH2 but also feeding the phenylpropanoid pathways [52]. Further investigation is necessary to assess the role of PPP in S. viridis adaptation to water limitation.
Taken together, our results show that S. viridis plants can reprogram their metabolism in an organ-specific way to deal with limited water supply from early developmental stages. Changes in sugar metabolism and carbon flow were observed in vegetative and reproductive organs of S. viridis plants.

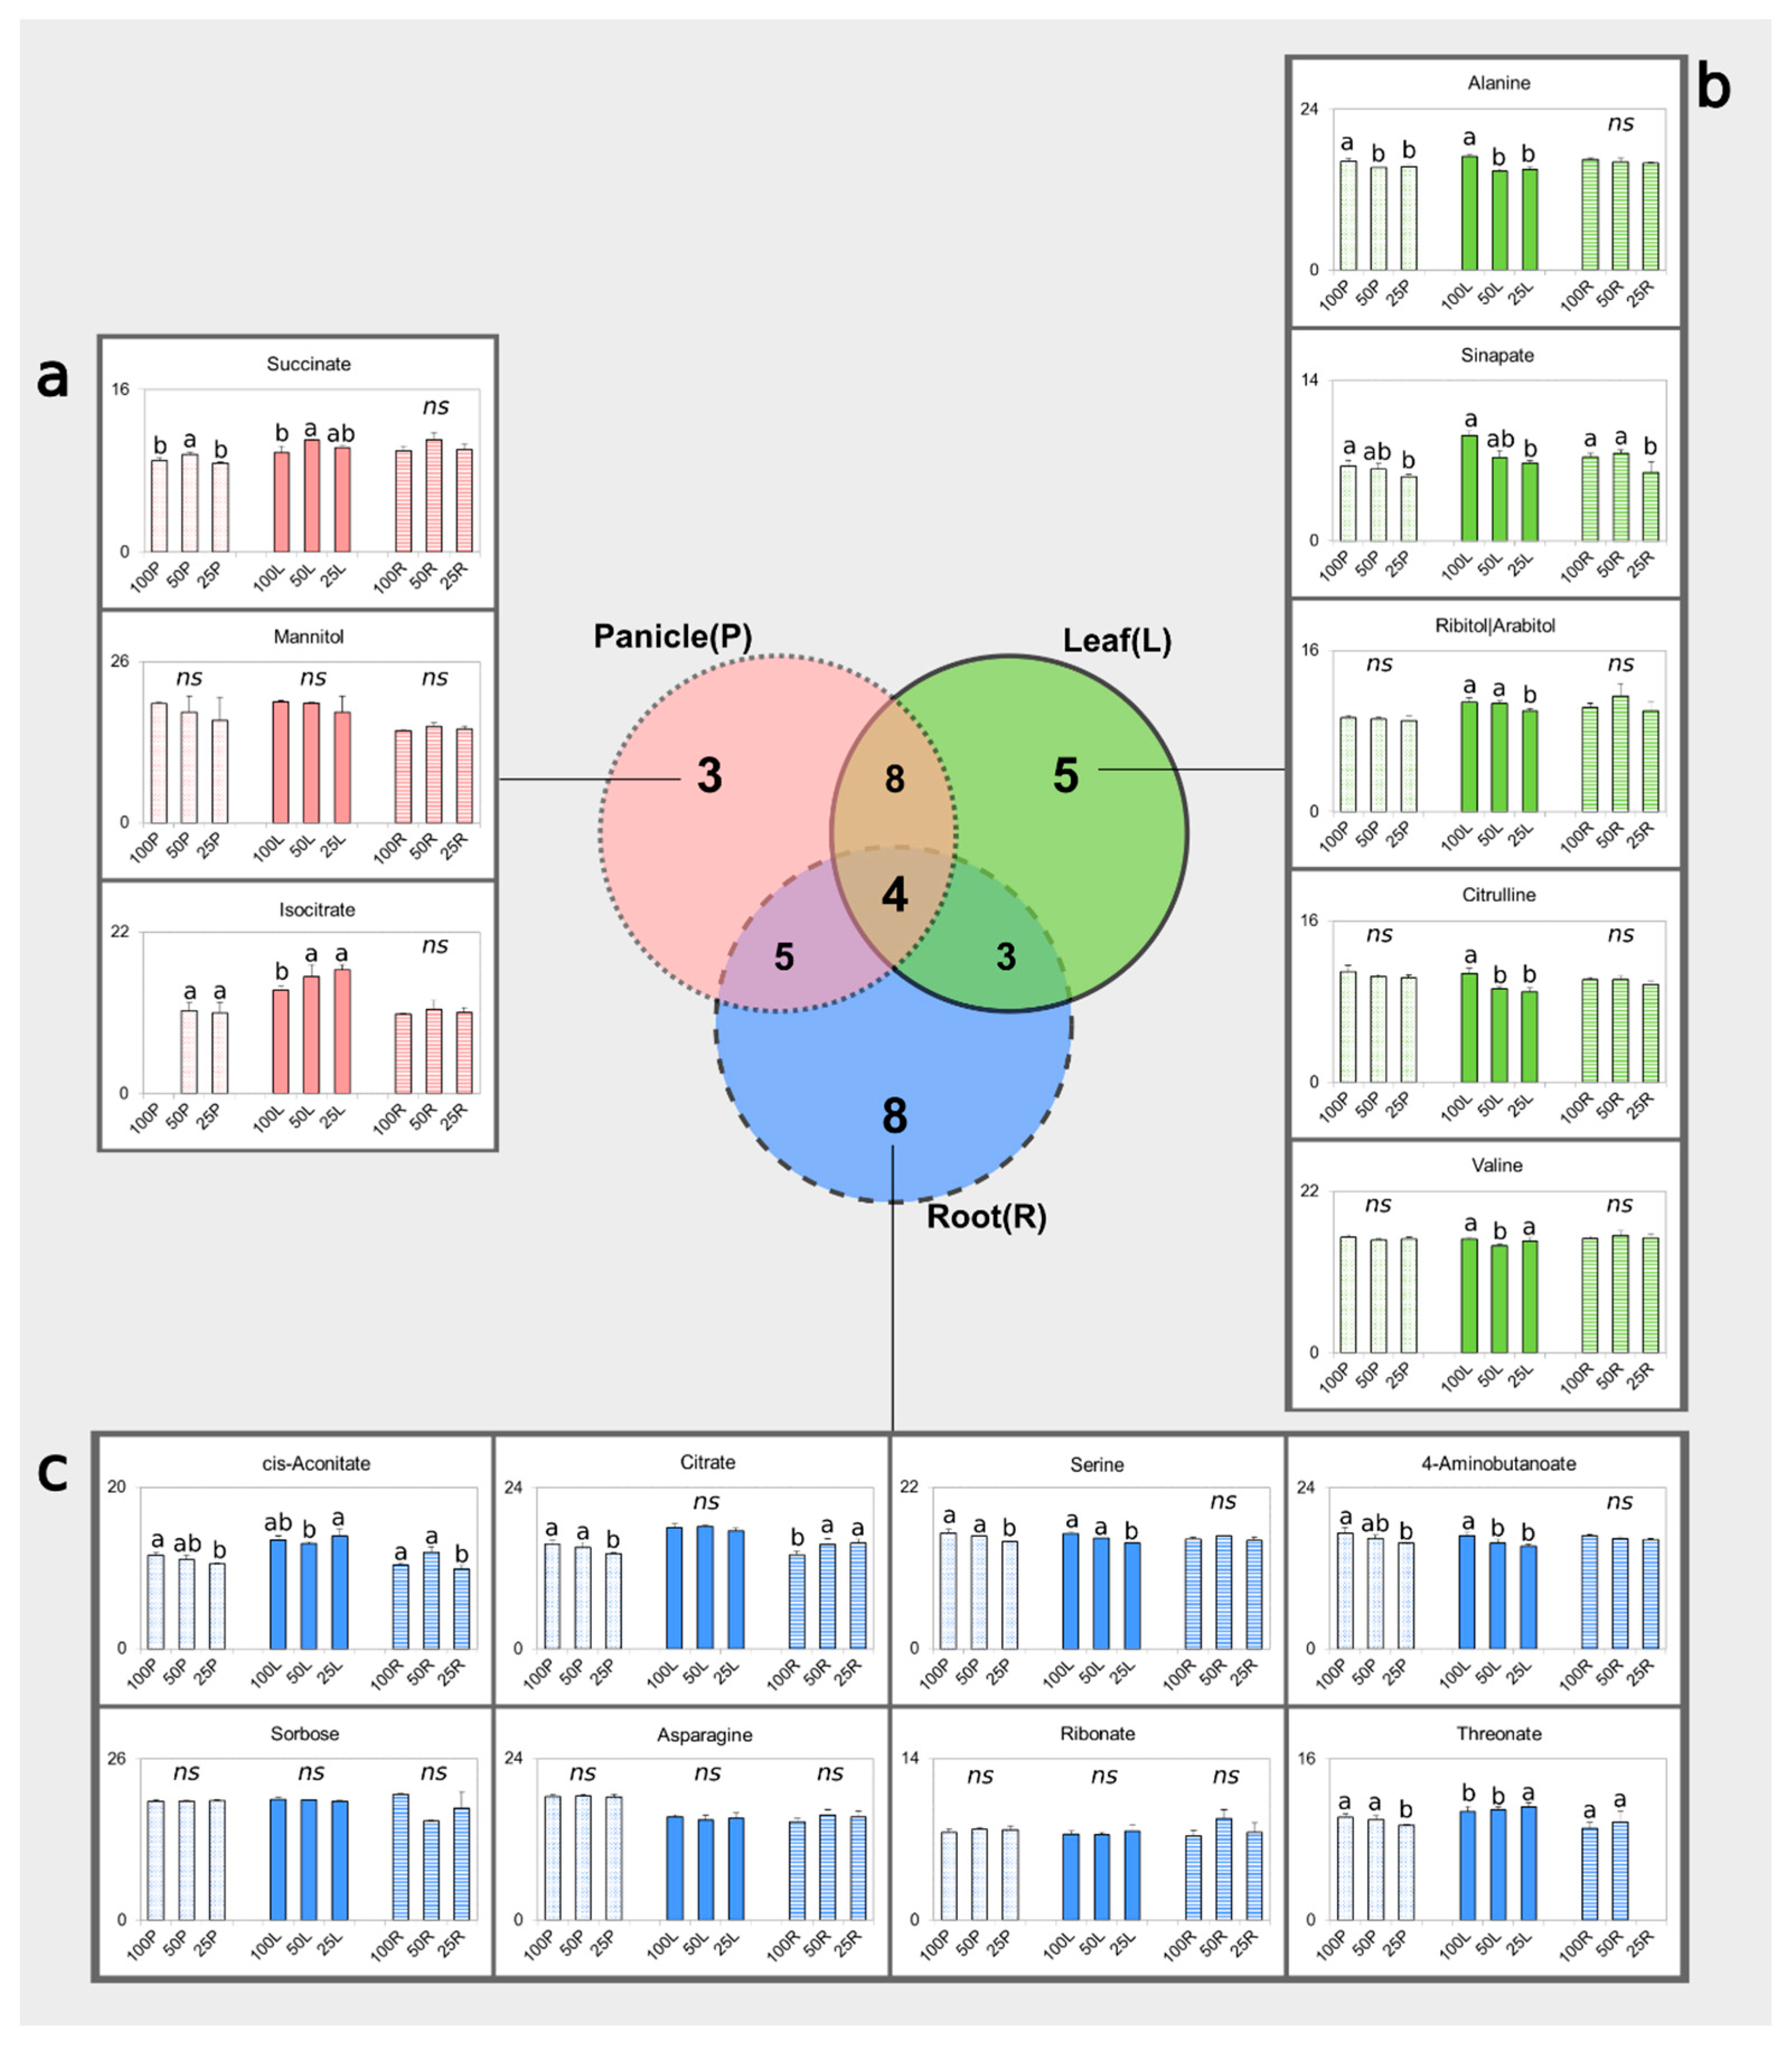
3.3. Identification of Potential Water-Deprivation Bioindicators

The S. viridis metabolites were also mined for water-limitation bioindicator candidates. Bioindicators are metabolites that reflect the plant’s health status and can assist in management decisions [11,31].
The S. viridis metabolites shown in the Venn diagram (Figure 3) show the 12 compounds with absolute loading score >0.40 (Supplemental Figure S4) selected as potential drought bioindicators (Figure 5). As a whole, univariate analysis confirmed the significance of selected metabolites, reinforcing their association with the S. viridis responses to water shortage. Interestingly, 11 of the 12 bioindicators candidates showed statistical significance in leaves, indicating the suitability of this organ to monitor water limitation in S. viridis plants.
For aerial parts, alanine appeared to be a good drought bioindicator candidate (absolute loading values were >0.40), exhibiting significantly reduced levels even for milder water limitation in panicles and leaves, but no significant changes in roots (Figure 5). Similarly, drought-induced changes were observed for agmatine and fucose. Together with 2-oxoglutarate, alanine is synthesized from glutamate and pyruvate by alanine aminotransferases (AlaAT). These enzymes can also catalyze the reaction in the opposite direction [54,55]. In Arabidopsis, AlaAT genes were shown to be mainly expressed in vascular tissues of shoots and roots [56]. Additionally, the conversion of alanine into pyruvate seems to play a role during the hypoxia and post-hypoxia response. During stress, the carbon flux goes from carbon storage compounds to alanine, while alanine is mobilized during the recovery and carbon flux is directed towards the TCA cycle [54,55,56]. Taken together, these results suggest that alanine participates in the S. viridis drought response and hence may serve as a water status indicator, especially in leaves.
Galactinol, a raffinose family oligosaccharide (RFO), emerged as a potential bioindicator for vegetative parts. This was the only candidate with score >0.40 in two S. viridis organs. Galactinol levels significantly decreased in leaves and roots under severe water limitation (Figure 5). At the same time, raffinose levels increased with increased water limitation (Figure 2), suggesting that galactinol might be used to synthesize raffinose in response to drought in S. viridis. Previous studies in Arabidopsis and rice have shown that galactinol is involved in plant responses to drought, possibly functioning as an osmoprotectant [57,58]. RFOs were previously found to be early and highly responsive to drought in these species [5]. Gluconate, putatively associated with changes in the carbon flow in response to drought (see the previous section), also seems to be useful for monitoring water status in vegetative parts of S. viridis (Figure 5).
Besides the well-known drought marker proline, changes in sucrose, adenine and cis-aconitate were statistically significant (Figure 5). Changes in the abundance of sucrose and adenine were already discussed (see Figure 4). Despite the statistical significance, changes in cis-aconitate levels differed in plant organs, framing a more complex scenario. Severe limitation of water (25% SPC) reduced cis-aconitate levels in panicles in comparison to well-watered plants. In leaves and roots, 25% SPC stress caused increased and decreased cis-aconitate levels, respectively, in comparison to the 50% SPC. Complex patterns were also observed for other bioindicators that are TCA intermediates, illustrating the intricate mechanisms regulating this pathway. Additionally, this result strongly suggests that the TCA cycle is altered in response to water deprivation in above- and underground, vegetative, and reproductive parts of S. viridis plants.

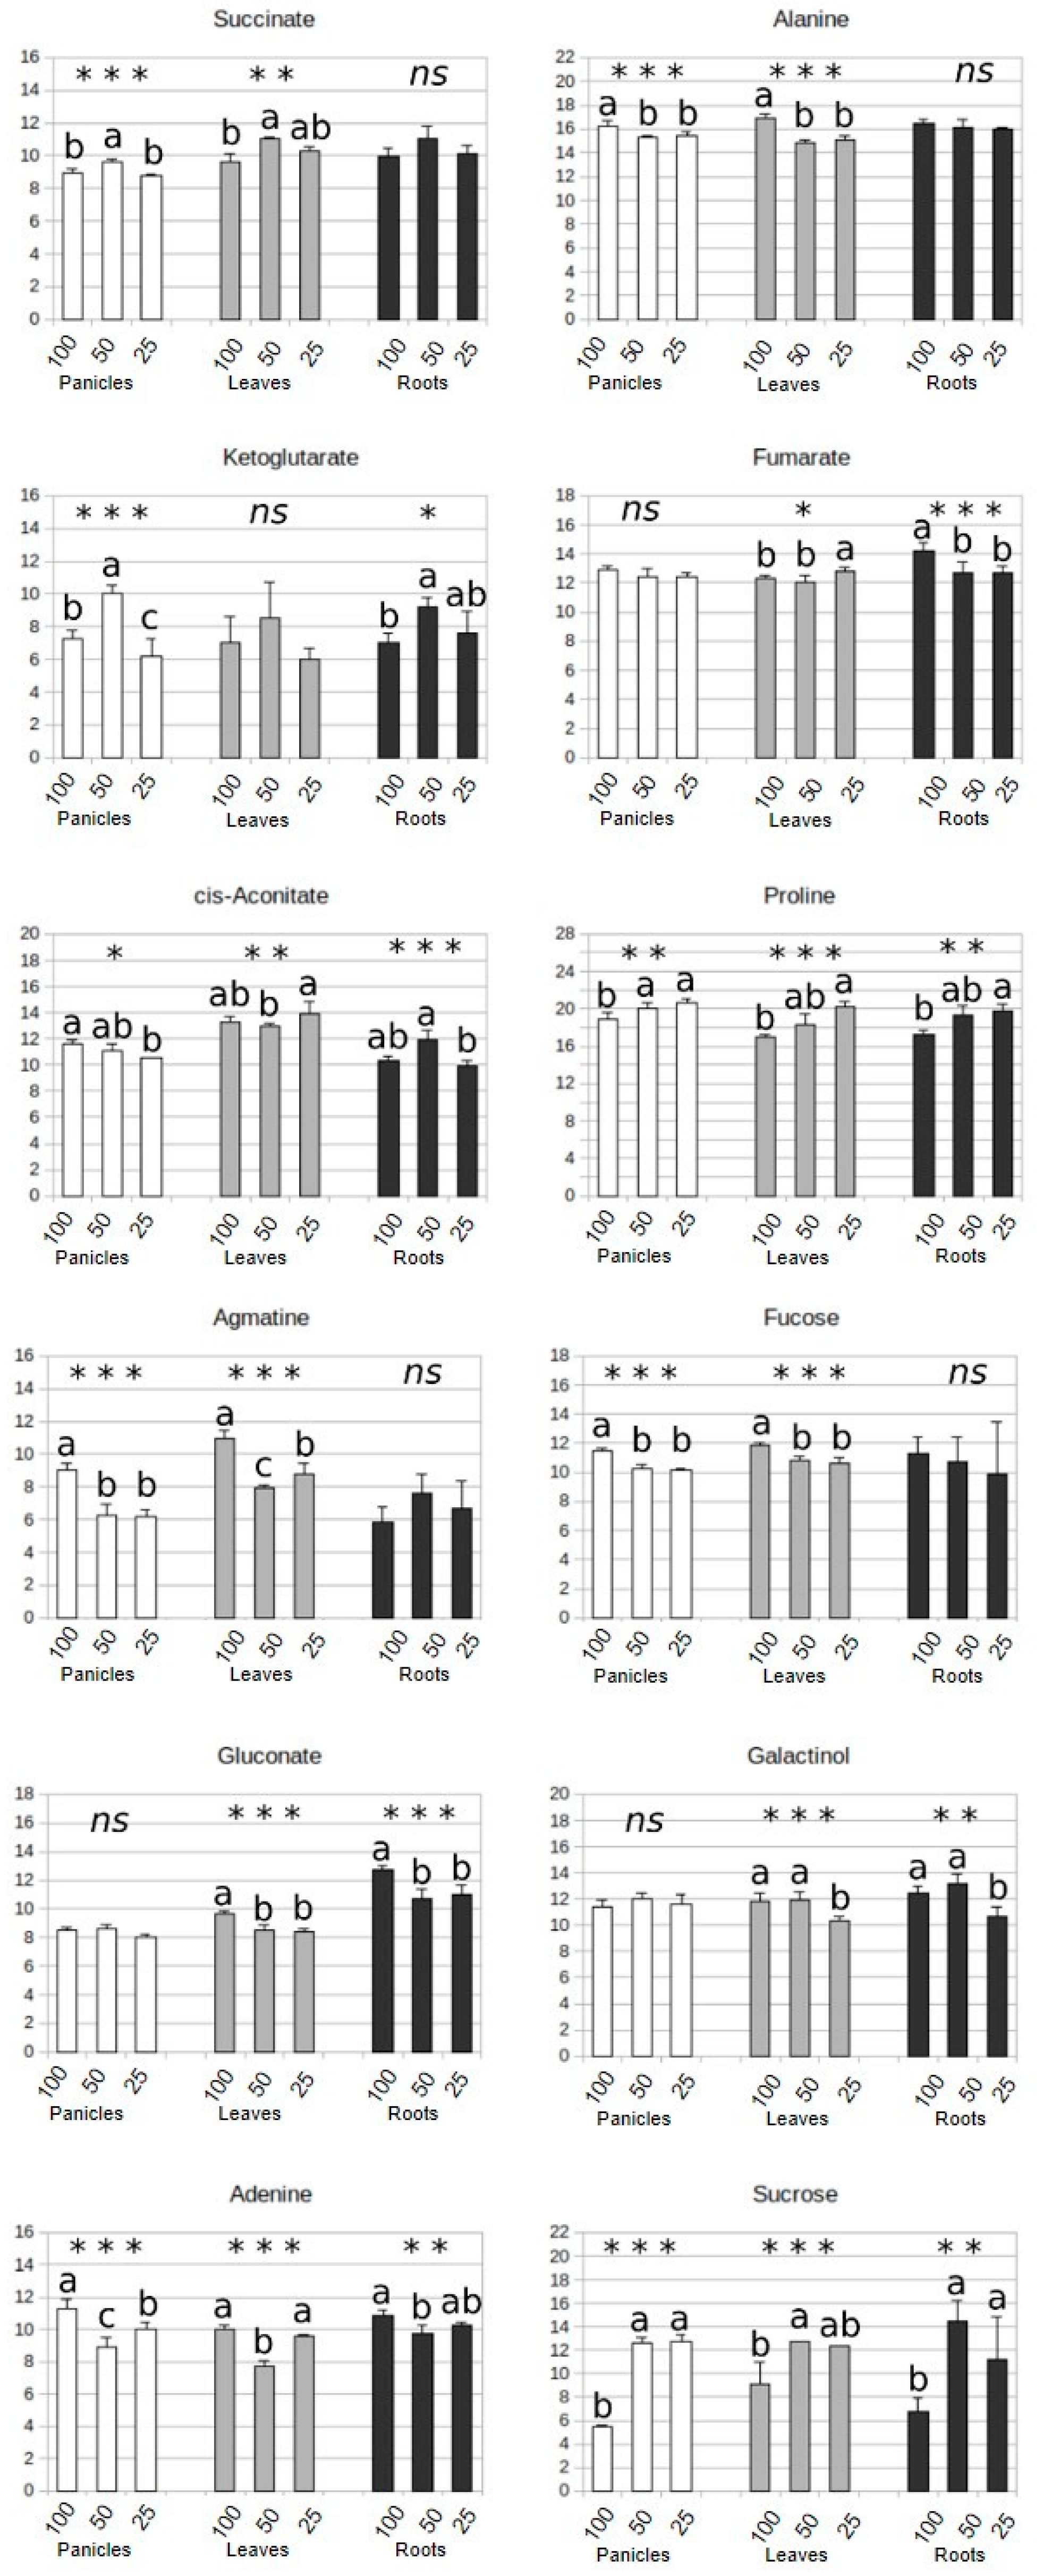
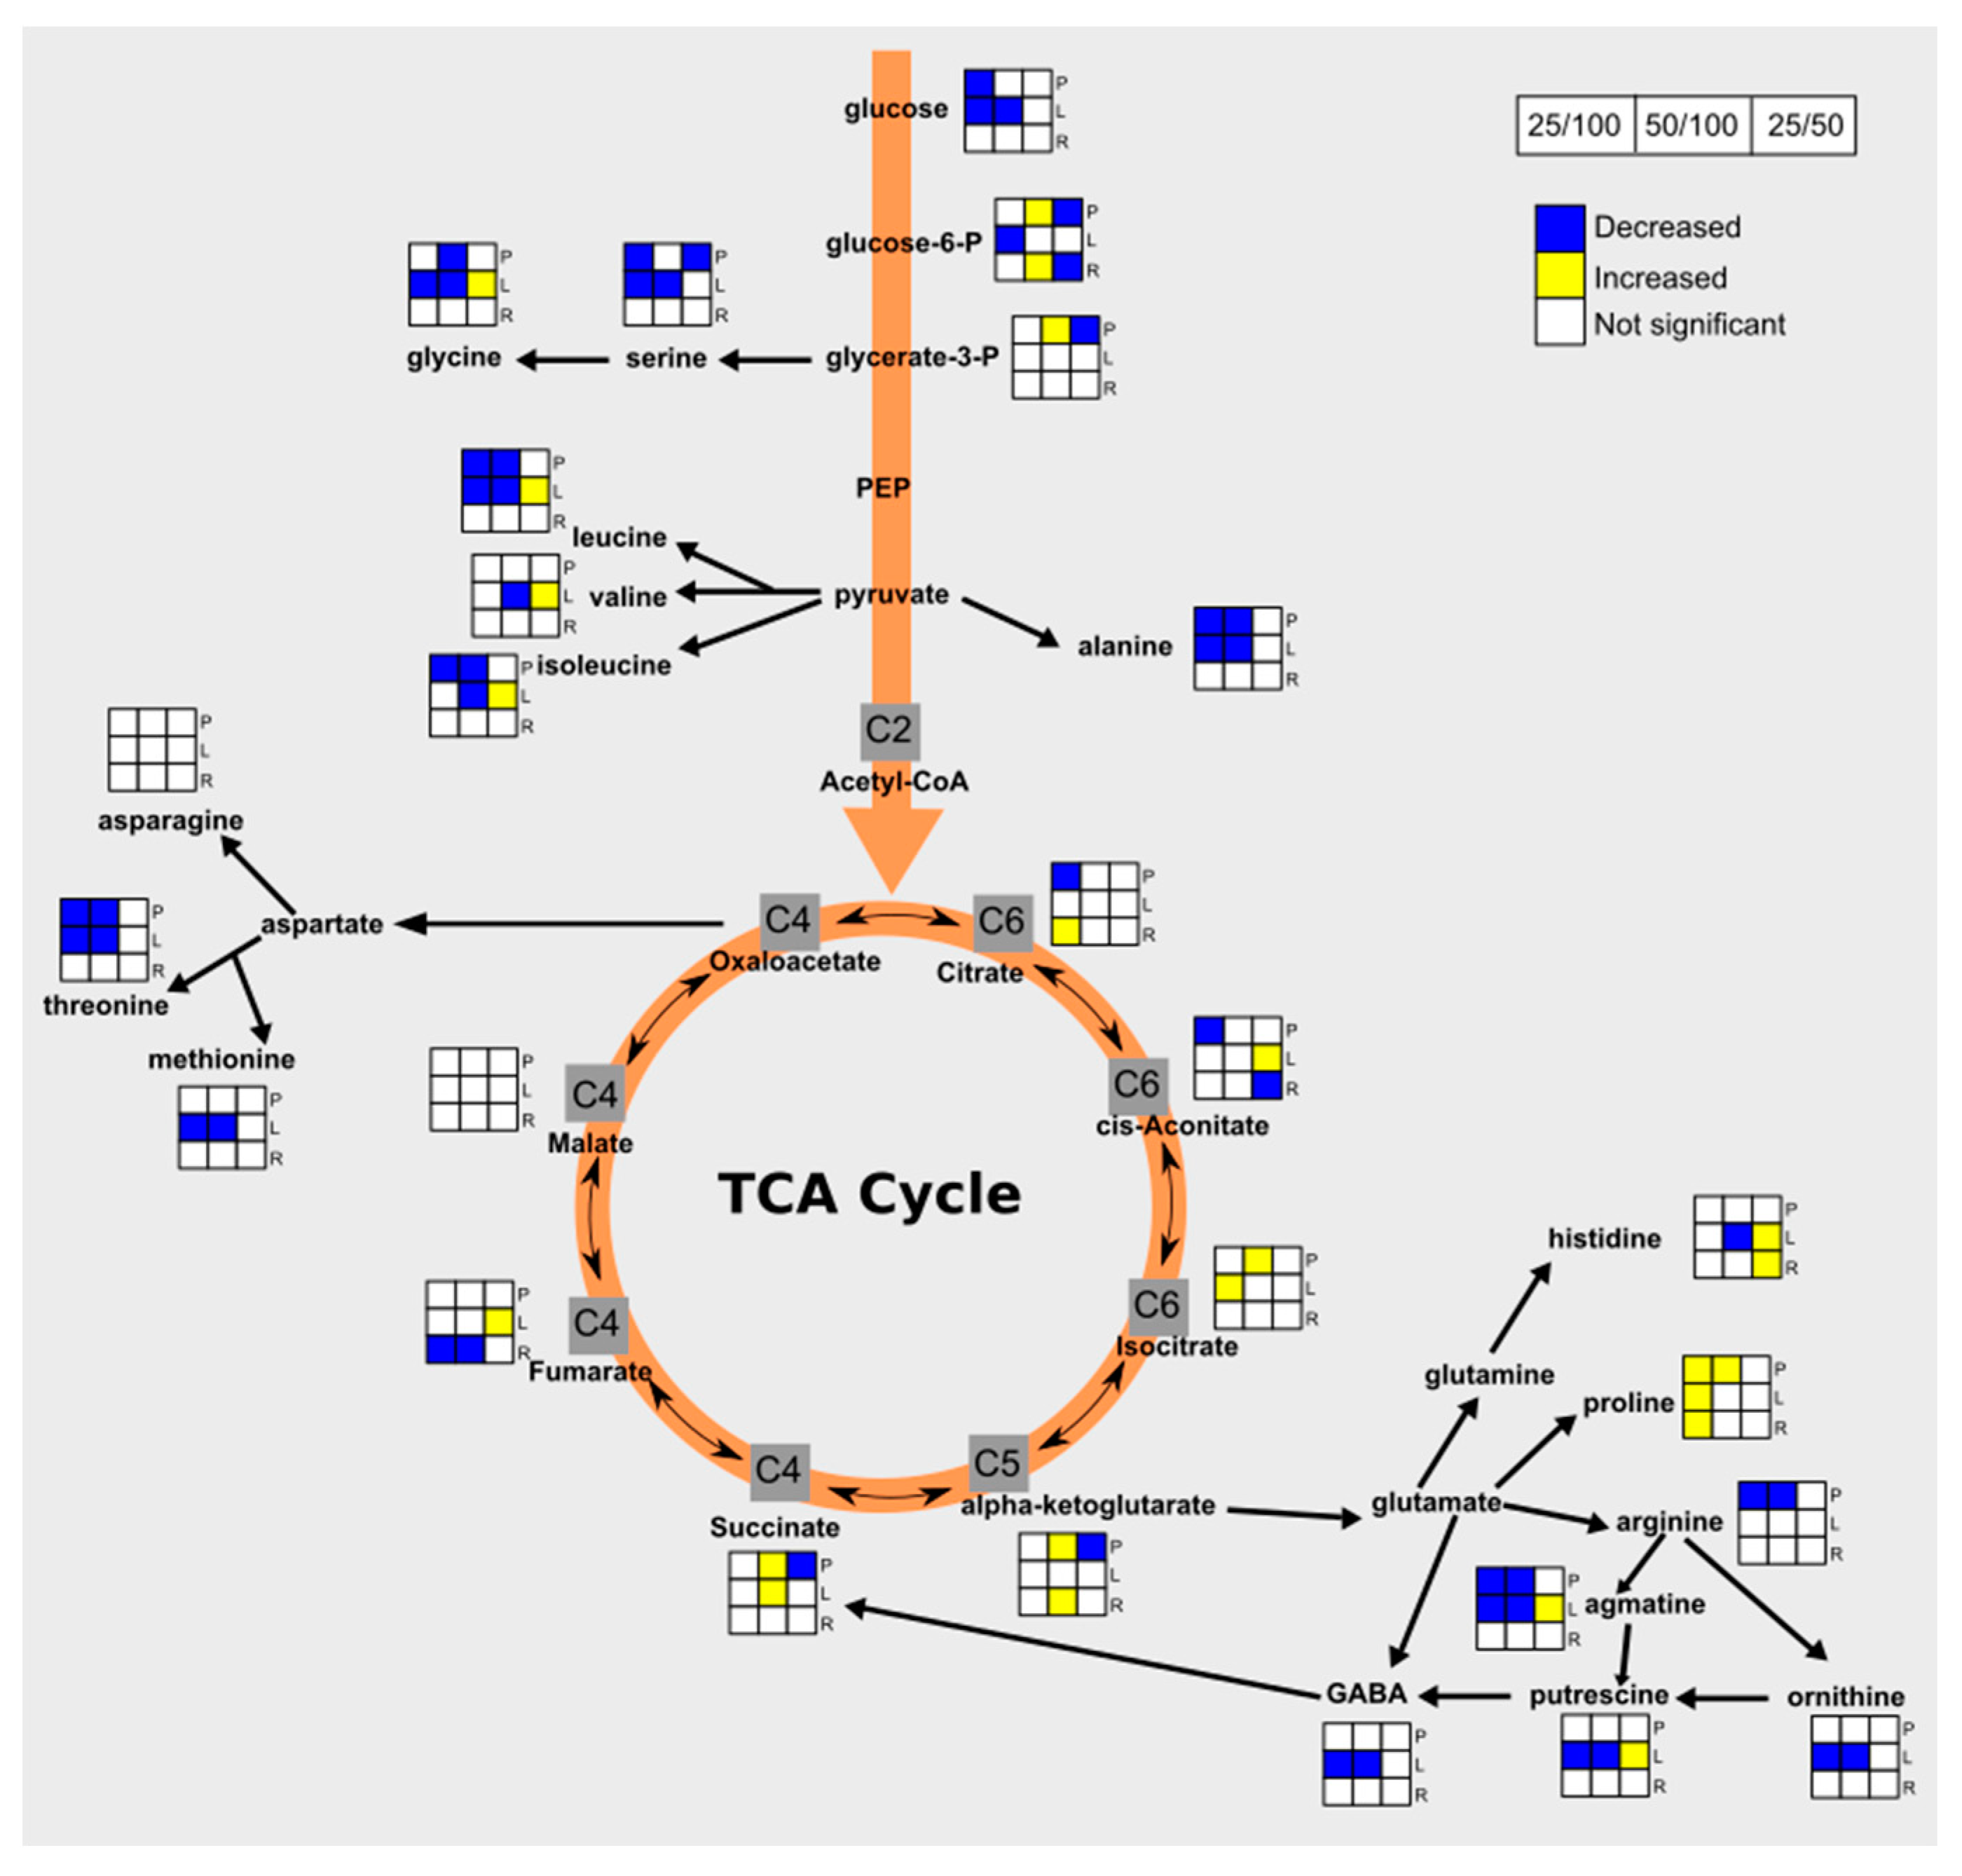
3.4. Drought Impacts Free Amino Acid Levels and TCA Pathway

Free amino acid contents were altered by water limitation (Figure 6) in S. viridis. Previous studies indicate that accumulation of amino acids such as proline and γ-aminobutyric acid (GABA) occur later than sugars [5]. The severe water limitation (25% SPC) significantly increased proline levels in all evaluated organs of S. viridis plants in comparison to the control (Figure 4 and Figure 5). This compound, known as a “drought marker,” is commonly produced not only in response to drought but also to other stress conditions in many plant species [59].
The accumulation of proline and other amino acids is commonly observed in roots of plants submitted to drought [60]. The increase in proline content in response to water stress was already described for aerial parts of several accessions of S. viridis [22]. Proline acts as an osmoprotectant, contributing to maintain the cellular redox balance by quenching electrons that could damage cell constituents [38]. Moreover, this metabolite acts in osmotic adjustment [59] by regulating the osmotic potential of cells and promoting the stabilization of proteins and membranes [61].
S. viridis branched-chain amino acid (BCAA) content was also altered by the water limitation (Figure 6). Leucine and isoleucine levels were significantly reduced in leaves and panicles of plants submitted to the milder (50% SPC) water limitation. Conversely, in leaves, the BCAA levels were even higher in the most severe condition. These results show that the modulation of BCAA content is important for the S. viridis response to water limitation.
BCAAs, as well as proline and GABA, have already been shown to accumulate in an ABA-dependent manner in Arabidopsis plants submitted to dehydration stress [62]. The modulation of BCAA compounds (e.g., leucine, isoleucine and valine) in response to water deficit has been reported in a wide range of species [1,5,26,37,62,63,64,65,66]. Huang and Jander [65] showed that drought-increased BCAA levels reverted to normal after removal of the stress. These amino acids are used as the carbon skeleton to sustain TCA under stress conditions [64]. ZmASR1, a member of abscisic acid-, stress-, and ripening-induced (ASR) group of proteins, when overexpressed in maize triggers a reduction in BCAA compounds in both well-watered and water-deficit conditions. ASR proteins accumulate during plant developmental processes and in response to stress. Surprisingly, this transgenic maize showed higher tolerance to water deprivation [66]. Besides biosynthesis, BCAA catabolism may also play a role in modulating their levels in response to drought [67]. A hypothesis is that an increased degradation of BCAAs under water deprivation could provide an alternative carbon source for the TCA cycle [64]. Additionally, they can play a role in the detoxification mechanism by maintaining a free BCAA pool at levels compatible with cellular homeostasis during stress situations [68].
As with free amino acid levels, the TCA pathway can be regulated in response to water deprivation [63]. Aconitate, ketoglutarate and succinate are important intermediates of the TCA cycle (Figure 6), a crucial pathway of respiratory metabolism involved in ATP biosynthesis [69]. Increases in the production of these TCA metabolites in response to lower water availability were observed in different plant species and can be related to higher tolerance against drought [5,33,38]. The accumulation behavior of each of these metabolites differed among one another [5], but they might help to keep energy production under water-limited conditions. Their accumulation seems to be induced by ABA [33] and accompanied by the accumulation of sugars and alcohol sugars [10]. We observed higher panicle levels of isocitrate, ketoglutarate and succinate at the middling water level (50% SPC). Severe water limitation (25% SPC) caused a further decrease of ketoglutarate and succinate abundance in comparison to 50% SPC (Figure 6). Significant decreases in aconitate and succinate in response to severe drought have been documented for other species [33].
Fumarate, another important TCA intermediate, had the highest abundance under the most drastic water regime (25% SPC, Figure 6). Interestingly, in roots, the fumarate level was significantly decreased by both water treatments.
Another noteworthy compound is the non-protein amino acid GABA. It is known that GABA can be metabolized into succinate, hence fueling the TCA cycle in a pathway known as the GABA shunt [70,71]. Results obtained here show that the GABA level was significantly reduced at the same time that succinate content was increased by the mild water shortage (50% SPC) in S. viridis leaves. Kinnersley and Turano [72] reported that the GABA shunt pathway stimulation in response to the increased requirement of TCA cycle intermediates may play a role in plant survival during drought through the biosynthesis of secondary metabolites. Further investigation is necessary to confirm if the GABA shunt pathway is activated by drought in S. viridis.

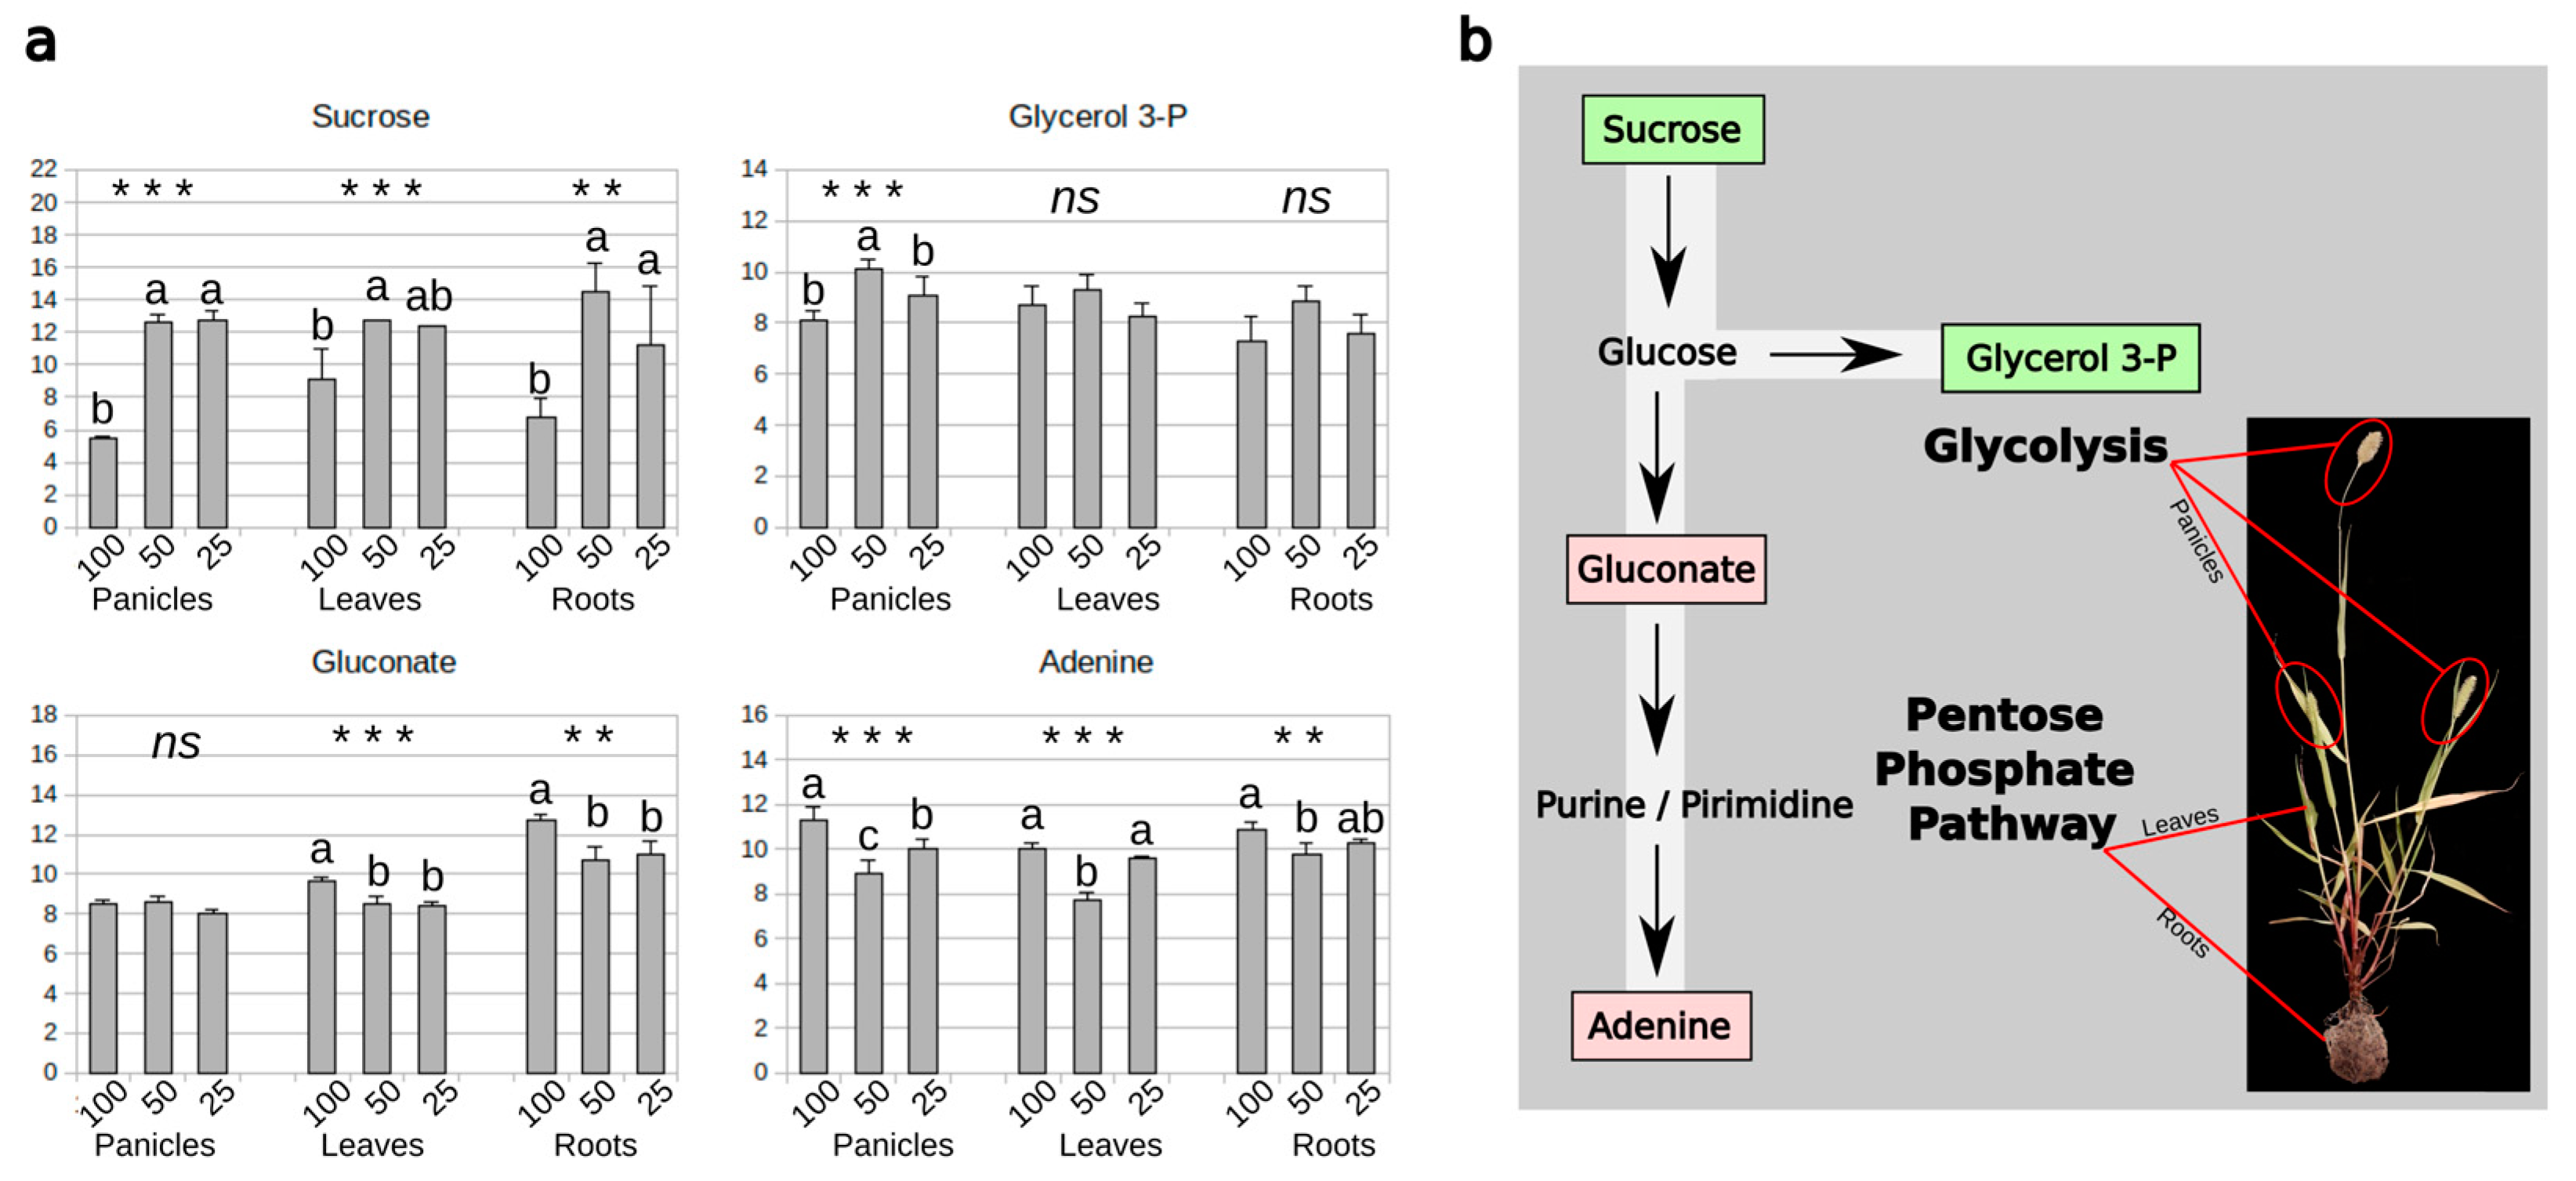
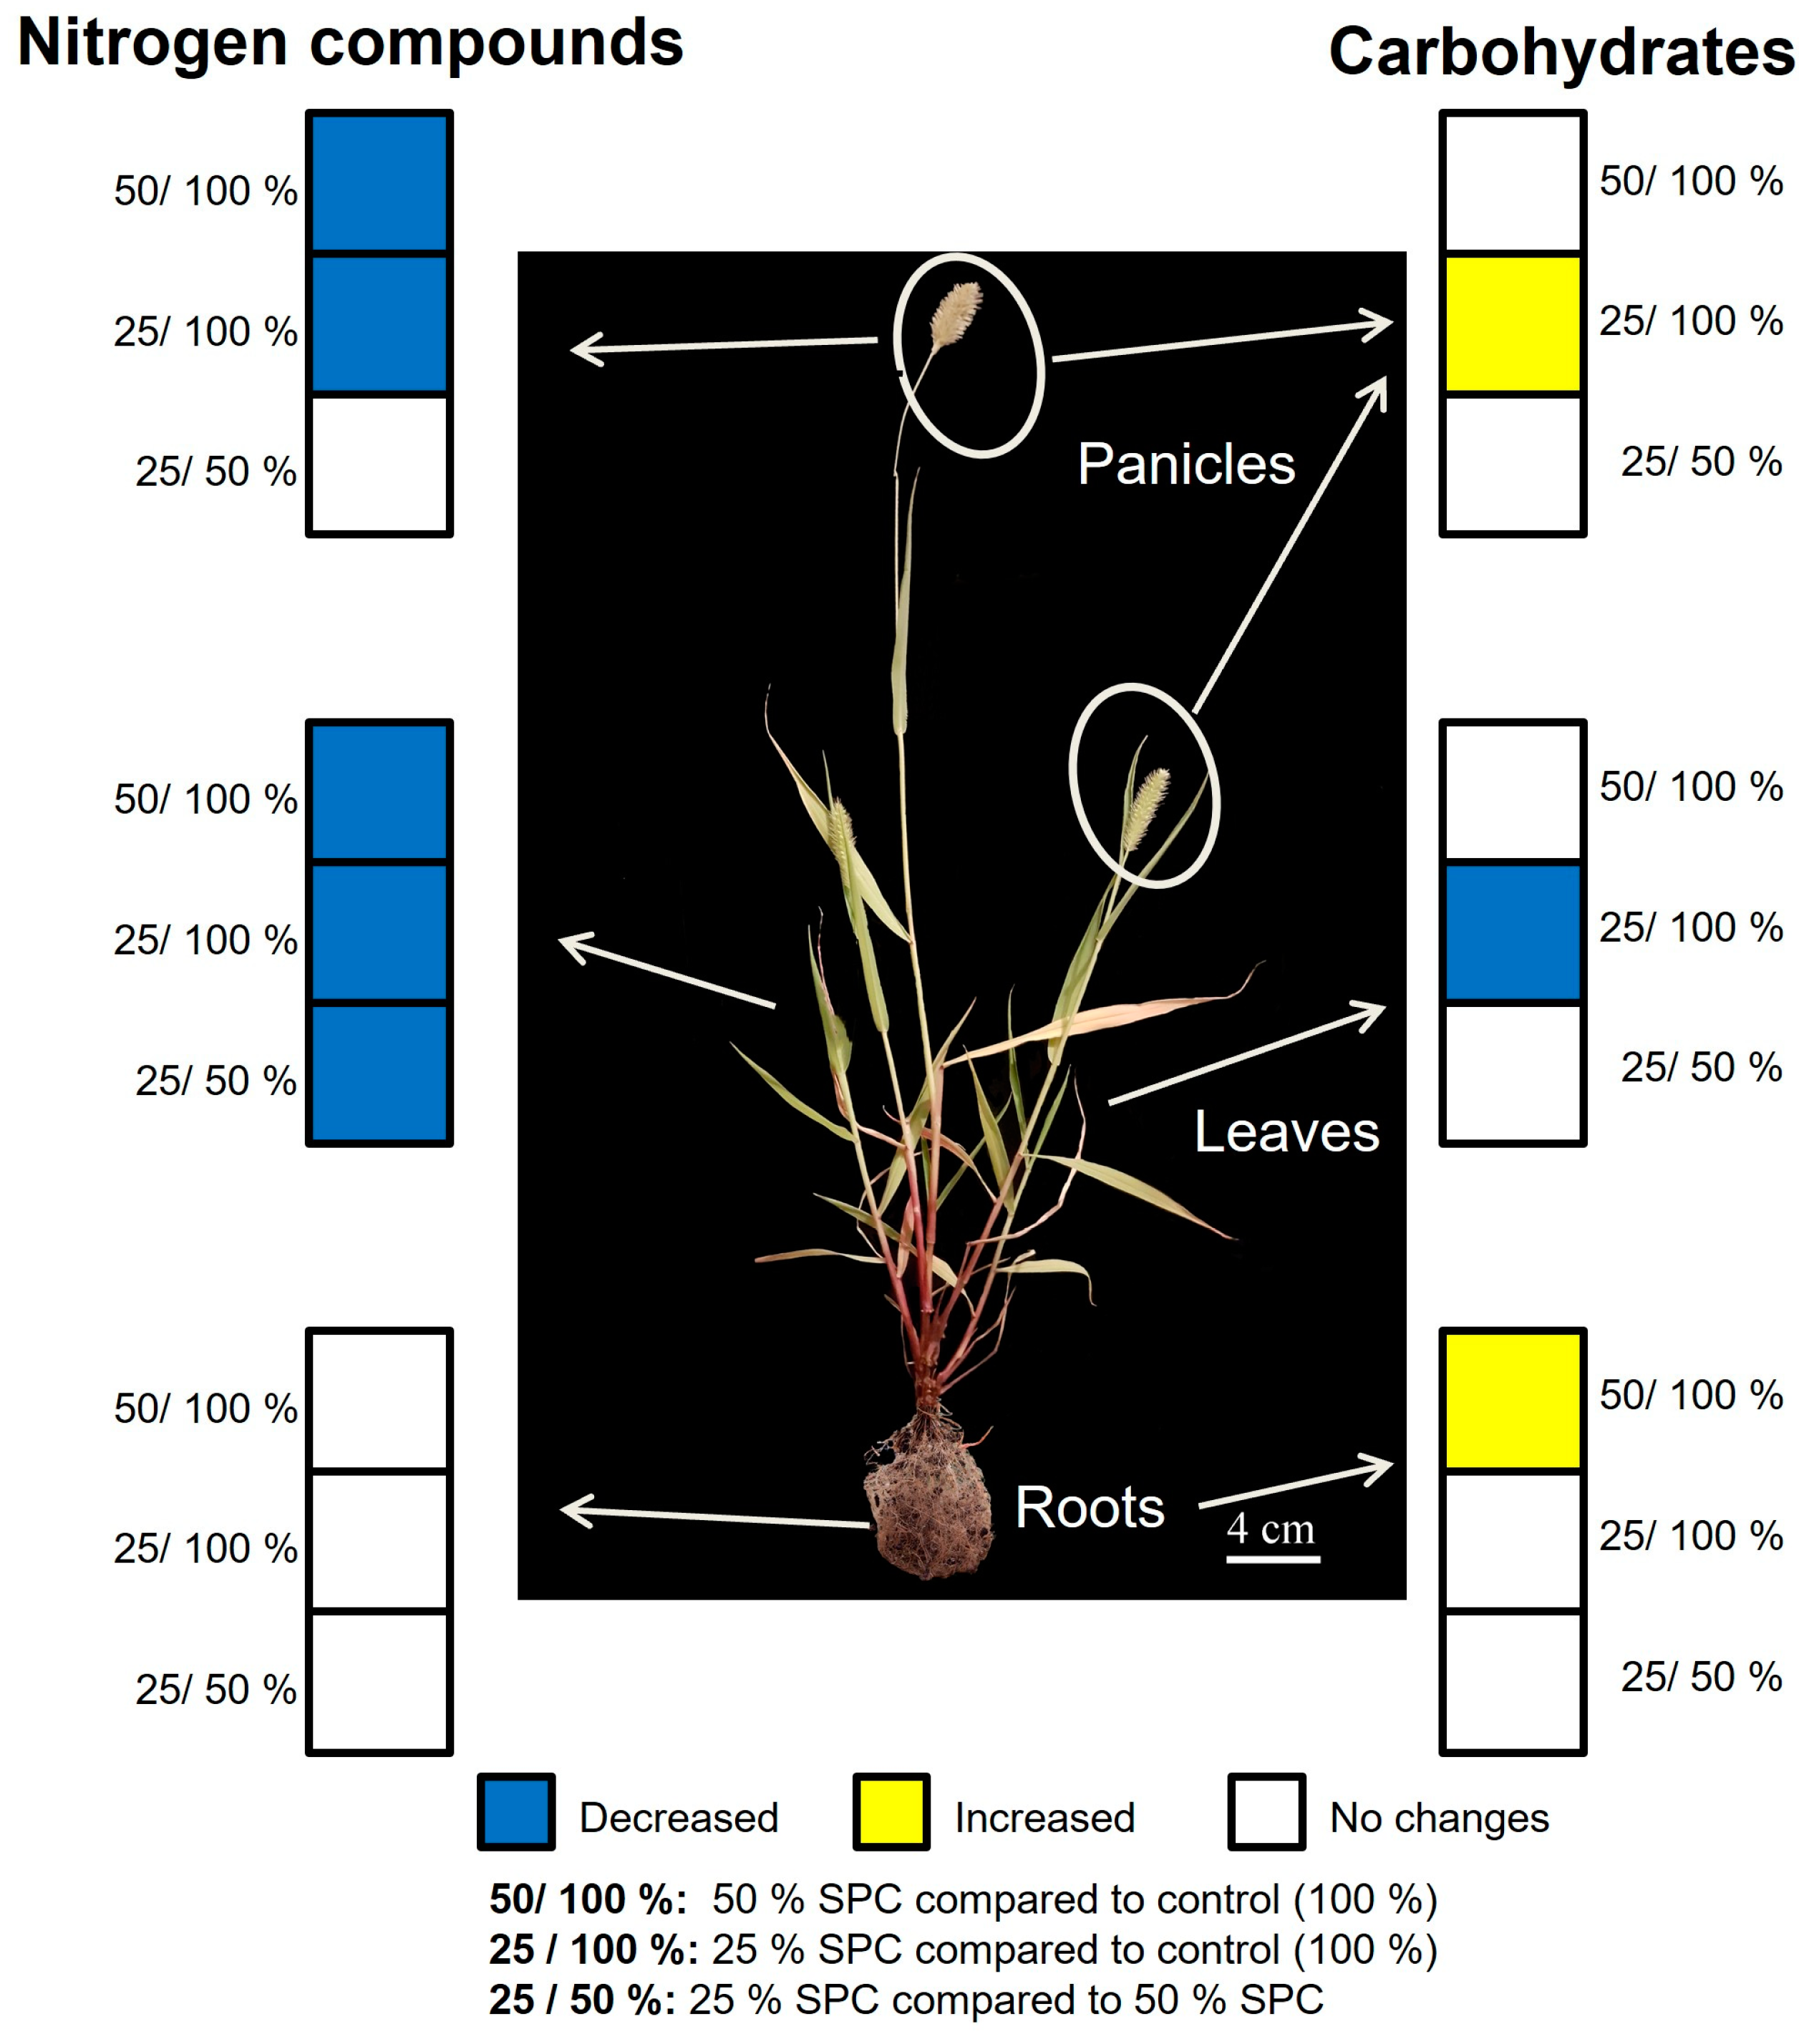
3.5. Carbohydrate and Nitrogen Compound Responses to Drought

The availability of carbon and nitrogen regulates many aspects of plant metabolism and development [73]. A known consequence of drought is the alteration in carbohydrate and nitrogen compound production, and this can differ for each plant organ [74,75].
To assess alterations in carbon and nitrogen balance induced by water deprivation in S. viridis organs, the sum of the content of all carbohydrate and nitrogen compounds detected and quantified by GC-MS was considered. Lower accumulation of nitrogen compounds was observed in aboveground tissues (Figure 7, left) in response to water deprivation, while an increase in carbohydrates was detected, especially in panicles and roots (Figure 7, right). However, an overall decrease in carbohydrate levels was observed in leaves of plants submitted to the 25% SPC condition (Figure 7, right). Similarly to our results, Saha et al. [22] observed a decrease in protein content in aerial parts of S. viridis submitted to water restriction.
Except for the content of nitrogen compounds in leaves, in general, carbon and nitrogen metabolite accumulation for the two water-shortage treatments (25% and 50% SPC) did not differ much; however, both were different from the control (100% SPC). S. viridis grown at 50% SPC changed carbon and nitrogen metabolite accumulation. This was in agreement with the stomatal behavior, where at 50% and 25% SPC, stomatal conductance was halved (Table 1).
In agreement with our results for panicles and roots, an increase in sugar content in response to drought has been observed for different wheat genotypes [9]. Carbohydrates play an important role in plant growth and development and can help in evading stress by acting as osmotic regulators, especially in roots [43]. Considering the panicles, increased sugar content under severe water shortage is likely to be a stress-surpassing mechanism [45], allowing the plant to reach reproduction. Evaluating the content of sugars, the increase in total carbohydrate content in response to the water limitation in panicles of S. viridis (Figure 7) was especially due to the increase in sucrose, raffinose and melibiose levels (Figure 2 and Figure 3), while in roots, it can be explained by sucrose, raffinose and mannitol (Figure 2), where mannitol is a well-known osmoprotectant [10]. The decrease in almost all carbohydrates (ribitol, cellobitol, ribulose, fucose, glucose-6-P, galactinol and melibiose—Figure 2) observed in this study explains the lower accumulation of these compounds in leaves submitted to the most severe water limitation (Figure 7).
Taking all these results together, we can hypothesize that the increase in carbohydrates content in response to water deprivation in roots and panicles might be related to the role of these compounds in sink organs [76]. Sucrose is the most important nonstructural carbohydrate that serves as a C reserve in C4 annual grasses, such as maize, sorghum, Sudan grass, millet and S. viridis, being specially accumulated in lower stem and roots [77,78]. In addition, in roots, sucrose may enhance water uptake, even while the soil water potential is decreasing [79]. In panicles, the presence of sucrose might insure the reproduction and the filling of the future grains, particularly under water limitation. Indeed, the accumulation of carbohydrates is particularly important for grain filling in several cultivars [77].
Nitrogen metabolism comprises compounds that can be assembled as peptide precursors as well as carbon sources [48]. As such, some amino acids can be used as “energy molecules” throughout glycolysis, the TCA cycle and/or amino acid metabolism pathways [48,80]. The overall decrease in the nitrogen compounds is explained by the lower content of almost all BCAAs in response to the water shortage (Figure 6), indicating that these molecules may be used as carbon sources [64]. A decrease in amino acid accumulation due to drought has already been observed in other plant species [79,81].

4. Conclusions

Even though water shortage is one of the major problems limiting plant yield worldwide, metabolic and molecular knowledge associated with plant responses is mainly centered on C3 eudicots, not the most accurate model for several crop grass species. To the best of our knowledge, this is the first investigation of the differential metabolic responses of vegetative and reproductive organs of S. viridis, a C4 model plant, to water limitation. The sPLS-DA analysis showed that only four metabolites were shared by all plant organs, with an increase in sucrose levels in response to water limitation. Twelve bioindicators emerged as candidates, including galactinol and gluconate (vegetative parts), alanine (aerial parts), proline, sucrose, adenine and cis-aconitate. The water limitation decreased the content of nitrogen compounds in aboveground tissues and increased carbohydrates, especially sink organs. In conclusion, our study improves the understanding of the primary metabolic responses of C4 grasses to water limitation and shows the diversity of metabolites that potentially contribute to drought tolerance in vegetative and reproductive parts of S. viridis. Identifying metabolites and metabolic pathways in C4 crop plants that increase drought tolerance is a crucial step in future gene editing to improve drought resistance. Bioindicators for water limitation might facilitate drought monitoring and plant development. Further and deeper studies of these metabolic routes and their regulation hold the promise of developing drought-tolerant crops for semiarid and arid climates.

Supplementary Materials

The following supporting information can be downloaded at https://www.mdpi.com/article/10.3390/agriculture13030660/s1. Figure S1: Representative plants of each treatment; Figure S2: Discriminant analysis of metabolites in well-watered S. viridis panicles, leaves and roots; Figure S3: Fivefold cross-validation of sPLS-DA analysis of panicles, leaves and roots with five components and 10 variables/component; Figure S4: Important features (metabolites) for PC1 and PC2 of S. viridis panicles, leaves and roots; Table S1: Content of all metabolites (61) identified for panicles (P), leaves (L), and roots (R) of S. viridis plants submitted to three different water treatments: 100% (control), 50% and 25% of soil pot capacity (SPC)—Excel sheet; Table S2: Metabolites with absolute loading score >0.40 for the five components of panicles, leaves and roots on sPLS-DA analysis; Table S3: Important features (metabolites) of PC1 and PC2 of S. viridis panicles, leaves and roots corresponding to the Venn diagram shown in Figure 3.

Author Contributions

F.A.d.F.G.: data analysis, manuscript preparation; L.B.d.S.N.: data analysis, manuscript preparation, experimental execution; M.P.C.: experimental execution; A.M.: review and editing, English review; M.A.-F.: conceptualization, review and editing; C.C.: GC-MS investigation and data curation; F.R.: conceptualization, supervision, manuscript preparation. All authors have read and agreed to the published version of the manuscript.

Funding

This research was partially funded by CAPES: one PNPD postdoctoral grant and two DS postgraduation grants.

Institutional Review Board Statement

Not applicable.

Data Availability Statement

The data presented in this study are available on request from the corresponding author.

Acknowledgments

We would like to acknowledge Gustavo Cardoso Dias and Priscila Pogian for their contribution in carrying out the experiment, and Nícia Junqueira for the photo preparation for Figure 4 and Figure 7. We are also grateful to LabMET/CNPEM, especially Juliana Aparecida Aricetti and Lucia Daniela Wolf, for carrying out the GC-MS analysis.

Conflicts of Interest

The authors declare no conflict of interest.

References

  1. Obata, T.; Fernie, A.R. The Use of Metabolomics to Dissect Plant Responses to Abiotic Stresses. Cell. Mol. Life Sci. 2012, 69, 3225–3243. [Google Scholar] [CrossRef] [Green Version]
  2. Gargallo-Garriga, A.; Sardans, J.; Pérez-Trujillo, M.; Rivas-Ubach, A.; Oravec, M.; Vecerova, K.; Urban, O.; Jentsch, A.; Kreyling, J.; Beierkuhnlein, C.; et al. Opposite Metabolic Responses of Shoots and Roots to Drought. Sci. Rep. 2014, 4, 6829. [Google Scholar] [CrossRef] [Green Version]
  3. Dresselhaus, T.; Hückelhoven, R. Biotic and Abiotic Stress Responses in Crop Plants. Agronomy 2018, 8, 267. [Google Scholar] [CrossRef] [Green Version]
  4. Suzuki, N.; Mittler, R. Reactive Oxygen Species and Temperature Stresses: A Delicate Balance between Signaling and Destruction. Physiol. Plant. 2006, 126, 45–51. [Google Scholar] [CrossRef]
  5. Fàbregas, N.; Fernie, A.R. The Metabolic Response to Drought. J. Exp. Bot. 2019, 70, 1077–1085. [Google Scholar] [CrossRef] [Green Version]
  6. Llanes, A.; Andrade, A.; Alemano, S.; Luna, V. Metabolomic Approach to Understand Plant Adaptations to Water and Salt Stress. In Plant Metabolites and Regulation Under Environmental Stress; Elsevier: Amsterdam, The Netherlands, 2018; pp. 133–144. ISBN 978-0-12-812689-9. [Google Scholar]
  7. Shulaev, V.; Cortes, D.; Miller, G.; Mittler, R. Metabolomics for Plant Stress Response. Physiol. Plant. 2008, 132, 199–208. [Google Scholar] [CrossRef]
  8. Wu, D.; Cai, S.; Chen, M.; Ye, L.; Chen, Z.; Zhang, H.; Dai, F.; Wu, F.; Zhang, G. Tissue Metabolic Responses to Salt Stress in Wild and Cultivated Barley. PLoS ONE 2013, 8, e55431. [Google Scholar] [CrossRef]
  9. Kang, Z.; Babar, M.A.; Khan, N.; Guo, J.; Khan, J.; Islam, S.; Shrestha, S.; Shahi, D. Comparative Metabolomic Profiling in the Roots and Leaves in Contrasting Genotypes Reveals Complex Mechanisms Involved in Post-Anthesis Drought Tolerance in Wheat. PLoS ONE 2019, 14, e0213502. [Google Scholar] [CrossRef]
  10. Sardans, J.; Gargallo-Garriga, A.; Urban, O.; Klem, K.; Walker, T.W.N.; Holub, P.; Janssens, I.A.; Peñuelas, J. Ecometabolomics for a Better Understanding of Plant Responses and Acclimation to Abiotic Factors Linked to Global Change. Metabolites 2020, 10, 239. [Google Scholar] [CrossRef]
  11. Steinfath, M.; Strehmel, N.; Peters, R.; Schauer, N.; Groth, D.; Hummel, J.; Steup, M.; Selbig, J.; Kopka, J.; Geigenberger, P.; et al. Discovering Plant Metabolic Biomarkers for Phenotype Prediction Using an Untargeted Approach: Discovering Plant Metabolic Biomarkers. Plant Biotechnol. J. 2010, 8, 900–911. [Google Scholar] [CrossRef]
  12. Doust, A.; Diao, X. (Eds.) Plant Genetics and Genomics: Crops and Models. In Genetics and Genomics of Setaria; Springer International Publishing: Cham, Switzerland, 2017; Volume 19, ISBN 978-3-319-45103-9. [Google Scholar]
  13. Petti, C.; Shearer, A.; Tateno, M.; Ruwaya, M.; Nokes, S.; Brutnell, T.; DeBolt, S. Comparative Feedstock Analysis in Setaria Viridis L. as a Model for C4 Bioenergy Grasses and Panicoid Crop Species. Front. Plant Sci. 2013, 4, 181. [Google Scholar] [CrossRef] [Green Version]
  14. Saha, P.; Blumwald, E. Spike-Dip Transformation of Setaria Viridis. Plant J. 2016, 86, 89–101. [Google Scholar] [CrossRef] [PubMed] [Green Version]
  15. Giavalisco, P.; Li, Y.; Matthes, A.; Eckhardt, A.; Hubberten, H.-M.; Hesse, H.; Segu, S.; Hummel, J.; Köhl, K.; Willmitzer, L. Elemental Formula Annotation of Polar and Lipophilic Metabolites Using 13C, 15N and 34S Isotope Labelling, in Combination with High-Resolution Mass Spectrometry. Plant J. 2011, 68, 364–376. [Google Scholar] [CrossRef] [PubMed]
  16. Roessner, U.; Luedemann, A.; Brust, D.; Fiehn, O.; Linke, T.; Willmitzer, L.; Fernie, A.R. Metabolic Profiling Allows Comprehensive Phenotyping of Genetically or Environmentally Modified Plant Systems. Plant Cell 2001, 13, 11–29. [Google Scholar] [CrossRef] [PubMed] [Green Version]
  17. Weckwerth, W.; Wenzel, K.; Fiehn, O. Process for the Integrated Extraction, Identification and Quantification of Metabolites, Proteins and RNA to Reveal Their Co-Regulation in Biochemical Networks. Proteomics 2004, 4, 78–83. [Google Scholar] [CrossRef]
  18. Cuadros-Inostroza, Á.; Caldana, C.; Redestig, H.; Kusano, M.; Lisec, J.; Peña-Cortés, H.; Willmitzer, L.; Hannah, M.A. TargetSearch—A Bioconductor Package for the Efficient Preprocessing of GC-MS Metabolite Profiling Data. BMC Bioinform. 2009, 10, 428. [Google Scholar] [CrossRef] [Green Version]
  19. Xia, J.; Wishart, D.S. Using MetaboAnalyst 3.0 for Comprehensive Metabolomics Data Analysis. Curr. Protoc. Bioinform. 2016, 55, 14.10.1–14.10.91. [Google Scholar] [CrossRef]
  20. Flexas, J.; Barbour, M.M.; Brendel, O.; Cabrera, H.M.; Carriquí, M.; Díaz-Espejo, A.; Douthe, C.; Dreyer, E.; Ferrio, J.P.; Gago, J.; et al. Mesophyll Diffusion Conductance to CO2: An Unappreciated Central Player in Photosynthesis. Plant Sci. 2012, 193–194, 70–84. [Google Scholar] [CrossRef] [PubMed]
  21. Time, A.; Garrido, M.; Acevedo, E. Water Relations and Growth Response to Drought Stress of Prosopis Tamarugo Phil. A Review. J. Soil Sci. Plant Nutr. 2018, 18, 329–343. [Google Scholar] [CrossRef]
  22. Saha, P.; Sade, N.; Arzani, A.; Rubio Wilhelmi, M.d.M.; Coe, K.M.; Li, B.; Blumwald, E. Effects of Abiotic Stress on Physiological Plasticity and Water Use of Setaria Viridis (L.). Plant Sci. 2016, 251, 128–138. [Google Scholar] [CrossRef]
  23. Worley, B.; Powers, R. Multivariate Analysis in Metabolomics. Curr. Metabolomics 2012, 1, 92–107. [Google Scholar] [CrossRef]
  24. Lee, L.C.; Liong, C.-Y.; Jemain, A.A. Partial Least Squares-Discriminant Analysis (PLS-DA) for Classification of High-Dimensional (HD) Data: A Review of Contemporary Practice Strategies and Knowledge Gaps. Analyst 2018, 143, 3526–3539. [Google Scholar] [CrossRef] [PubMed]
  25. Guo, X.; Xin, Z.; Yang, T.; Ma, X.; Zhang, Y.; Wang, Z.; Ren, Y.; Lin, T. Metabolomics Response for Drought Stress Tolerance in Chinese Wheat Genotypes (Triticum Aestivum). Plants 2020, 9, 520. [Google Scholar] [CrossRef] [PubMed] [Green Version]
  26. You, J.; Zhang, Y.; Liu, A.; Li, D.; Wang, X.; Dossa, K.; Zhou, R.; Yu, J.; Zhang, Y.; Wang, L.; et al. Transcriptomic and Metabolomic Profiling of Drought-Tolerant and Susceptible Sesame Genotypes in Response to Drought Stress. BMC Plant Biol. 2019, 19, 267. [Google Scholar] [CrossRef] [Green Version]
  27. Liquet, B.; Cao, K.-A.L.; Hocini, H.; Thiébaut, R. A Novel Approach for Biomarker Selection and the Integration of Repeated Measures Experiments from Two Assays. BMC Bioinform. 2012, 13, 325. [Google Scholar] [CrossRef] [Green Version]
  28. Ruiz-Perez, D.; Guan, H.; Madhivanan, P.; Mathee, K.; Narasimhan, G. So You Think You Can PLS-DA? BMC Bioinform. 2020, 21, 2. [Google Scholar] [CrossRef]
  29. Lea, P.J.; Sodek, L.; Parry, M.A.J.; Shewry, P.R.; Halford, N.G. Asparagine in Plants. Ann. Appl. Biol. 2007, 150, 1–26. [Google Scholar] [CrossRef]
  30. Tegeder, M.; Masclaux-Daubresse, C. Source and Sink Mechanisms of Nitrogen Transport and Use. New Phytol. 2018, 217, 35–53. [Google Scholar] [CrossRef] [Green Version]
  31. Merchant, A.; Richter, A.A. Polyols as Biomarkers and Bioindicators for 21st Century Plant Breeding. Funct. Plant Biol. 2011, 38, 934. [Google Scholar] [CrossRef] [Green Version]
  32. Seki, M.; Umezawa, T.; Urano, K.; Shinozaki, K. Regulatory Metabolic Networks in Drought Stress Responses. Curr. Opin. Plant Biol. 2007, 10, 296–302. [Google Scholar] [CrossRef]
  33. Li, Z.; Yu, J.; Peng, Y.; Huang, B. Metabolic Pathways Regulated by Abscisic Acid, Salicylic Acid and γ-Aminobutyric Acid in Association with Improved Drought Tolerance in Creeping Bentgrass (Agrostis Stolonifera). Physiol. Plant. 2017, 159, 42–58. [Google Scholar] [CrossRef] [PubMed]
  34. Ma, J.F.; Ryan, P.R.; Delhaize, E. Aluminium Tolerance in Plants and the Complexing Role of Organic Acids. Trends Plant Sci. 2001, 6, 273–278. [Google Scholar] [CrossRef] [PubMed]
  35. Dodd, I.C. Root-To-Shoot Signalling: Assessing The Roles of ‘Up’ In the Up and Down World of Long-Distance Signalling In Planta. Plant Soil 2005, 274, 251–270. [Google Scholar] [CrossRef]
  36. Lee, H.-J.; Ha, J.-H.; Park, C.-M. Underground Roots Monitor Aboveground Environment by Sensing Stem-Piped Light. Commun. Integr. Biol. 2016, 9, e1261769. [Google Scholar] [CrossRef]
  37. Bowne, J.B.; Erwin, T.A.; Juttner, J.; Schnurbusch, T.; Langridge, P.; Bacic, A.; Roessner, U. Drought Responses of Leaf Tissues from Wheat Cultivars of Differing Drought Tolerance at the Metabolite Level. Mol. Plant 2012, 5, 418–429. [Google Scholar] [CrossRef] [Green Version]
  38. Ullah, N.; Yüce, M.; Neslihan Öztürk Gökçe, Z.; Budak, H. Comparative Metabolite Profiling of Drought Stress in Roots and Leaves of Seven Triticeae Species. BMC Genom. 2017, 18, 969. [Google Scholar] [CrossRef] [PubMed]
  39. Martin, A.P.; Palmer, W.M.; Brown, C.; Abel, C.; Lunn, J.E.; Furbank, R.T.; Grof, C.P.L. A Developing Setaria Viridis Internode: An Experimental System for the Study of Biomass Generation in a C4 Model Species. Biotechnol. Biofuels 2016, 9, 45. [Google Scholar] [CrossRef] [PubMed] [Green Version]
  40. Koch, K. Sucrose Metabolism: Regulatory Mechanisms and Pivotal Roles in Sugar Sensing and Plant Development. Curr. Opin. Plant Biol. 2004, 7, 235–246. [Google Scholar] [CrossRef]
  41. Guo, L.-X.; Shi, C.-Y.; Liu, X.; Ning, D.-Y.; Jing, L.-F.; Yang, H.; Liu, Y.-Z. Citrate Accumulation-Related Gene Expression and/or Enzyme Activity Analysis Combined With Metabolomics Provide a Novel Insight for an Orange Mutant. Sci. Rep. 2016, 6, 29343. [Google Scholar] [CrossRef] [Green Version]
  42. Marček, T.; Hamow, K.Á.; Végh, B.; Janda, T.; Darko, E. Metabolic Response to Drought in Six Winter Wheat Genotypes. PLoS ONE 2019, 14, e0212411. [Google Scholar] [CrossRef] [Green Version]
  43. Nataraja, K.N.; Parvathi, M.S. Tolerance to Drought Stress in Plants: Unravelling the Signaling Networks. In Drought Stress Tolerance in Plants, Vol 2; Hossain, M.A., Wani, S.H., Bhattacharjee, S., Burritt, D.J., Tran, L.-S.P., Eds.; Springer International Publishing: Cham, Switzerland, 2016; pp. 71–90. ISBN 978-3-319-32421-0. [Google Scholar]
  44. Lemoine, R.; Camera, S.L.; Atanassova, R.; Dédaldéchamp, F.; Allario, T.; Pourtau, N.; Bonnemain, J.-L.; Laloi, M.; Coutos-Thévenot, P.; Maurousset, L.; et al. Source-to-Sink Transport of Sugar and Regulation by Environmental Factors. Front. Plant Sci. 2013, 4, 272. [Google Scholar] [CrossRef] [Green Version]
  45. Ghate, T.; Barvkar, V.; Deshpande, S.; Bhargava, S. Role of ABA Signaling in Regulation of Stem Sugar Metabolism and Transport under Post- Flowering Drought Stress in Sweet Sorghum. Plant Mol. Biol. Report. 2019, 37, 303–313. [Google Scholar] [CrossRef]
  46. Slewinski, T.L. Non-Structural Carbohydrate Partitioning in Grass Stems: A Target to Increase Yield Stability, Stress Tolerance, and Biofuel Production. J. Exp. Bot. 2012, 63, 4647–4670. [Google Scholar] [CrossRef] [PubMed] [Green Version]
  47. Cho, L.-H.; Pasriga, R.; Yoon, J.; Jeon, J.-S.; An, G. Roles of Sugars in Controlling Flowering Time. J. Plant Biol. 2018, 61, 121–130. [Google Scholar] [CrossRef]
  48. Das, A.; Rushton, P.; Rohila, J. Metabolomic Profiling of Soybeans (Glycine Max L.) Reveals the Importance of Sugar and Nitrogen Metabolism under Drought and Heat Stress. Plants 2017, 6, 21. [Google Scholar] [CrossRef] [PubMed] [Green Version]
  49. Parida, A.K.; Panda, A.; Rangani, J. Metabolomics-Guided Elucidation of Abiotic Stress Tolerance Mechanisms in Plants. In Plant Metabolites and Regulation Under Environmental Stress; Elsevier: Amsterdam, The Netherlands, 2018; pp. 89–131. ISBN 978-0-12-812689-9. [Google Scholar]
  50. Varshney, R.K.; Pandey, M.K.; Chitikineni, A. (Eds.) Advances in Biochemical Engineering/Biotechnology. In Plant Genetics and Molecular Biology; Springer International Publishing: Cham, Switzerland, 2018; Volume 164, ISBN 978-3-319-91312-4. [Google Scholar]
  51. Singh, O.V.; Kumar, R. Biotechnological Production of Gluconic Acid: Future Implications. Appl. Microbiol. Biotechnol. 2007, 75, 713–722. [Google Scholar] [CrossRef] [PubMed]
  52. Shetty, K. Role of Proline-Linked Pentose Phosphate Pathway in Biosynthesis of Plant Phenolics for Functional Food and Environmental Applications: A Review. Process Biochem. 2004, 39, 789–804. [Google Scholar] [CrossRef]
  53. Silva, S.F.; Miranda, M.T.; Cunha, C.P.; Domingues, A.P., Jr.; Aricetti, J.A.; Caldana, C.; Machado, E.C.; Ribeiro, R.V. Metabolic Profiling of Drought Tolerance: Revealing How Citrus Rootstocks Modulate Plant Metabolism under Varying Water Availability. Environ. Exp. Bot. 2023, 206, 105169. [Google Scholar] [CrossRef]
  54. Diab, H.; Limami, A. Reconfiguration of N Metabolism upon Hypoxia Stress and Recovery: Roles of Alanine Aminotransferase (AlaAT) and Glutamate Dehydrogenase (GDH). Plants 2016, 5, 25. [Google Scholar] [CrossRef] [Green Version]
  55. Wang, X.; Cai, X.; Xu, C.; Wang, Q.; Dai, S. Drought-Responsive Mechanisms in Plant Leaves Revealed by Proteomics. Int. J. Mol. Sci. 2016, 17, 1706. [Google Scholar] [CrossRef] [Green Version]
  56. Miyashita, Y.; Dolferus, R.; Ismond, K.P.; Good, A.G. Alanine Aminotransferase Catalyses the Breakdown of Alanine after Hypoxia in Arabidopsis Thaliana: AlaAT in Arabidopsis. Plant J. 2007, 49, 1108–1121. [Google Scholar] [CrossRef] [PubMed]
  57. Taji, T.; Ohsumi, C.; Iuchi, S.; Seki, M.; Kasuga, M.; Kobayashi, M.; Yamaguchi-Shinozaki, K.; Shinozaki, K. Important Roles of Drought- and Cold-Inducible Genes for Galactinol Synthase in Stress Tolerance in Arabidopsis Thaliana. Plant J. 2002, 29, 417–426. [Google Scholar] [CrossRef] [PubMed]
  58. Selvaraj, M.G.; Ishizaki, T.; Valencia, M.; Ogawa, S.; Dedicova, B.; Ogata, T.; Yoshiwara, K.; Maruyama, K.; Kusano, M.; Saito, K.; et al. Overexpression of an Arabidopsis Thaliana Galactinol Synthase Gene Improves Drought Tolerance in Transgenic Rice and Increased Grain Yield in the Field. Plant Biotechnol. J. 2017, 15, 1465–1477. [Google Scholar] [CrossRef] [PubMed] [Green Version]
  59. Kaur, G.; Asthir, B. Proline: A Key Player in Plant Abiotic Stress Tolerance. Biol. Plant. 2015, 59, 609–619. [Google Scholar] [CrossRef]
  60. Chmielewska, K.; Rodziewicz, P.; Swarcewicz, B.; Sawikowska, A.; Krajewski, P.; Marczak, Ł.; Ciesiołka, D.; Kuczyńska, A.; Mikołajczak, K.; Ogrodowicz, P.; et al. Analysis of Drought-Induced Proteomic and Metabolomic Changes in Barley (Hordeum Vulgare L.) Leaves and Roots Unravels Some Aspects of Biochemical Mechanisms Involved in Drought Tolerance. Front. Plant Sci. 2016, 7, 1108. [Google Scholar] [CrossRef]
  61. Delauney, A.J.; Verma, D.P.S. Proline Biosynthesis and Osmoregulation in Plants. Plant J. 1993, 4, 215–223. [Google Scholar] [CrossRef]
  62. Urano, K.; Maruyama, K.; Ogata, Y.; Morishita, Y.; Takeda, M.; Sakurai, N.; Suzuki, H.; Saito, K.; Shibata, D.; Kobayashi, M.; et al. Characterization of the ABA-Regulated Global Responses to Dehydration in Arabidopsis by Metabolomics. Plant J. 2009, 57, 1065–1078. [Google Scholar] [CrossRef]
  63. Hossain, M.A.; Wani, S.H.; Bhattacharjee, S.; Burritt, D.J.; Tran, L.-S.P. (Eds.) Drought Stress Tolerance in Plants, Vol 1; Springer International Publishing: Cham, Switzerland, 2016; ISBN 978-3-319-28897-0. [Google Scholar]
  64. Pires, M.V.; Pereira Júnior, A.A.; Medeiros, D.B.; Daloso, D.M.; Pham, P.A.; Barros, K.A.; Engqvist, M.K.M.; Florian, A.; Krahnert, I.; Maurino, V.G.; et al. The Influence of Alternative Pathways of Respiration That Utilize Branched-Chain Amino Acids Following Water Shortage in Arabidopsis: Influence of the ETF/ETFQO Pathway under Water Stress. Plant Cell Environ. 2016, 39, 1304–1319. [Google Scholar] [CrossRef] [Green Version]
  65. Huang, T.; Jander, G. Abscisic Acid-Regulated Protein Degradation Causes Osmotic Stress-Induced Accumulation of Branched-Chain Amino Acids in Arabidopsis Thaliana. Planta 2017, 246, 737–747. [Google Scholar] [CrossRef]
  66. Virlouvet, L.; Jacquemot, M.-P.; Gerentes, D.; Corti, H.; Bouton, S.; Gilard, F.; Valot, B.; Trouverie, J.; Tcherkez, G.; Falque, M.; et al. The ZmASR1 Protein Influences Branched-Chain Amino Acid Biosynthesis and Maintains Kernel Yield in Maize under Water-Limited Conditions. Plant Physiol. 2011, 157, 917–936. [Google Scholar] [CrossRef] [Green Version]
  67. Malatrasi, M.; Corradi, M.; Svensson, J.T.; Close, T.J.; Gulli, M.; Marmiroli, N. A Branched-Chain Amino Acid Aminotransferase Gene Isolated from Hordeum Vulgare Is Differentially Regulated by Drought Stress. Theor. Appl. Genet. 2006, 113, 965–976. [Google Scholar] [CrossRef] [PubMed]
  68. Araújo, W.L.; Ishizaki, K.; Nunes-Nesi, A.; Larson, T.R.; Tohge, T.; Krahnert, I.; Witt, S.; Obata, T.; Schauer, N.; Graham, I.A.; et al. Identification of the 2-Hydroxyglutarate and Isovaleryl-CoA Dehydrogenases as Alternative Electron Donors Linking Lysine Catabolism to the Electron Transport Chain of Arabidopsis Mitochondria. Plant Cell 2010, 22, 1549–1563. [Google Scholar] [CrossRef] [PubMed] [Green Version]
  69. Sweetlove, L.J.; Beard, K.F.M.; Nunes-Nesi, A.; Fernie, A.R.; Ratcliffe, R.G. Not Just a Circle: Flux Modes in the Plant TCA Cycle. Trends Plant Sci. 2010, 15, 462–470. [Google Scholar] [CrossRef] [PubMed]
  70. Fait, A.; Fromm, H.; Walter, D.; Galili, G.; Fernie, A.R. Highway or Byway: The Metabolic Role of the GABA Shunt in Plants. Trends Plant Sci. 2008, 13, 14–19. [Google Scholar] [CrossRef] [PubMed]
  71. Bown, A.W.; Shelp, B.J. The Metabolism and Functions of [Gamma]-Aminobutyric Acid. Plant Physiol. 1997, 115, 1–5. [Google Scholar] [CrossRef] [Green Version]
  72. Kinnersley, A.M.; Turano, F.J. Gamma Aminobutyric Acid (GABA) and Plant Responses to Stress. Crit. Rev. Plant Sci. 2000, 19, 479–509. [Google Scholar] [CrossRef]
  73. Coruzzi, G.M.; Zhou, L. Carbon and Nitrogen Sensing and Signaling in Plants: Emerging ‘Matrix Effects’. Curr. Opin. Plant Biol. 2001, 4, 247–253. [Google Scholar] [CrossRef]
  74. Pinheiro, C.; António, C.; Ortuño, M.F.; Dobrev, P.I.; Hartung, W.; Thomas-Oates, J.; Ricardo, C.P.; Vanková, R.; Chaves, M.M.; Wilson, J.C. Initial Water Deficit Effects on Lupinus Albus Photosynthetic Performance, Carbon Metabolism, and Hormonal Balance: Metabolic Reorganization Prior to Early Stress Responses. J. Exp. Bot. 2011, 62, 4965–4974. [Google Scholar] [CrossRef]
  75. De Miguel, M.; Guevara, M.Á.; Sánchez-Gómez, D.; de María, N.; Díaz, L.M.; Mancha, J.A.; Fernández de Simón, B.; Cadahía, E.; Desai, N.; Aranda, I.; et al. Organ-Specific Metabolic Responses to Drought in Pinus Pinaster Ait. Plant Physiol. Biochem. 2016, 102, 17–26. [Google Scholar] [CrossRef]
  76. Loka, D.; Harper, J.; Humphreys, M.; Gasior, D.; Wootton-Beard, P.; Gwynn-Jones, D.; Scullion, J.; Doonan, J.; Kingston-Smith, A.; Dodd, R.; et al. Impacts of Abiotic Stresses on the Physiology and Metabolism of Cool-Season Grasses: A Review. Food Energy Secur. 2019, 8, e00152. [Google Scholar] [CrossRef] [Green Version]
  77. Shi, H.; Wang, B.; Yang, P.; Li, Y.; Miao, F. Differences in Sugar Accumulation and Mobilization between Sequential and Non-Sequential Senescence Wheat Cultivars under Natural and Drought Conditions. PLoS ONE 2016, 11, e0166155. [Google Scholar] [CrossRef] [PubMed] [Green Version]
  78. Volenec, J.J.; Nelson, C.J. Carbon Metabolism in Forage Plants. In Forages; John Wiley & Sons, Ltd.: London, UK, 2020; pp. 65–84. ISBN 978-1-119-43666-9. [Google Scholar]
  79. Perlikowski, D.; Augustyniak, A.; Masajada, K.; Skirycz, A.; Soja, A.M.; Michaelis, Ä.; Wolter, G.; Kosmala, A. Structural and Metabolic Alterations in Root Systems under Limited Water Conditions in Forage Grasses of Lolium-Festuca Complex. Plant Sci. 2019, 283, 211–223. [Google Scholar] [CrossRef] [PubMed]
  80. Galili, G. The Aspartate-Family Pathway of Plants: Linking Production of Essential Amino Acids with Energy and Stress Regulation. Plant Signal. Behav. 2011, 6, 192–195. [Google Scholar] [CrossRef] [PubMed] [Green Version]
  81. Liu, J.; Kang, R.; Liu, Y.; Wu, K.-X.; Yan, X.; Song, Y.; Pan, L.-B.; Tang, Z.-H. Differential Metabolite Accumulation in Different Tissues of Gleditsia Sinensis under Water Stress and Rehydration Conditions. Forests 2020, 11, 542. [Google Scholar] [CrossRef]
Figure 1. sPLS-DA overview plot showing the five components (a) and 2D score plots of PC1 and PC2 (b) for S. viridis panicles, leaves and roots submitted to three water treatments (100%—control, 50% and 25% SPC). In (a), X and Y axes vary from −2 to 2 at regular intervals. In (b), the area around the points represents the 95% confidence interval.
Agriculture 13 00660 g001
Figure 2. Content of PC1 and PC2 metabolites (36) in the panicles, leaves and roots of S. viridis plants submitted to three different water treatments: 100% (control), 50% and 25% of soil pot capacity (SPC). The relative concentration of each metabolite is the average of five biological replicates, including NA samples (no detectable values). Corresponding standard deviation values are shown in Supplemental Table S1.
Agriculture 13 00660 g002
Figure 3. Comparison of water-deprivation-responsive metabolites identified in panicles (P), leaves (L) and roots (R) of S. viridis plants. For each plant organ, the metabolites of the components PC1 and PC2 were combined and compared, for a total of 36 metabolites. ANOVA significance for (a) panicle-specific, (b) leaf-specific and (c) root-specific metabolites. Different letters indicate significant differences (p < 0.05) between the water treatments in the same plant organ. ns = not significant.
Agriculture 13 00660 g003
Figure 4. Water-limitation-responsive metabolites shared by S. viridis panicles, leaves and roots. These metabolites correspond to the common area of Venn diagram shown in Figure 3. (a) Results of ANOVA analysis. Different letters indicate significant differences (p < 0.05) between the water treatments in the same plant organ. Asterisks indicate the significant effects in each plant organ (** p ≤ 0.01; *** p ≤ 0.001); ns = not significant. (b) Proposed model of pathways connecting the shared metabolites. Along the X axis, the numbers 100, 50, 25 refer to the water treatments.
Agriculture 13 00660 g004
Figure 5. Potential bioindicators (loading score >0.40) of water limitation in S. viridis. Different letters indicate significant differences (p < 0.05) between the water treatments in the same plant organ. Along the X axis, the numbers 100, 50, 25 refer to the water treatments. Asterisks indicate significant effects: * p ≤ 0.05; ** p ≤ 0.01; *** p ≤ 0.001; ns = not significant.
Agriculture 13 00660 g005
Figure 6. Metabolic changes in TCA cycle and amino acid pathways induced by water treatments in S. viridis organs. For each metabolite, a colored table is shown, with rows representing the plant organs (P—panicles; L—leaves; R—roots) and columns representing pairwise treatment comparison (from left to right: 25/100, 50/100, 25/50). Blue indicates significant level decrease, yellow indicates significant level increase and white means no significance in the comparison. Statistical significance was determined by ANOVA followed by Tukey’s test (p < 0.05).
Agriculture 13 00660 g006
Figure 7. Nitrogen compound (left) and carbohydrate (right) production in response to water restriction (50% and 25% of soil pot capacity—SPC) observed in each organ (roots, leaves or panicles) of S. viridis. The content of the compounds represents the sum of the quantity of all the different compounds belonging to each class detected and quantified by GC-MS. The colors represent the increase (yellow), decrease (blue) or lack of changes (white) in the total content of these compounds comparing the different water treatments, as specified, and according to the ANOVA analysis (p ≤ 0.05, n = 5).
Agriculture 13 00660 g007
Table 1. Plant dry weight and stomatal conductance of S. viridis plants grown at 100% (control), 50%, and 25% of soil pot capacity (SPC).
ParametersWater Treatments
100% (Control)50% SPC25% SPC
Plant dry weight (g)0.033 ± 0.006 a0.016 ± 0.007 b0.018 ± 0.016 b
Stomatal conductance (mmol m−2 s−1)1.36 ± 0.31 a0.052 ± 0.016 b0.067 ± 0.014 b
Results in means ± standard deviation (n = 5). Same letters indicate no statistical differences between the values, according to Tukey’s post hoc test.
Disclaimer/Publisher’s Note: The statements, opinions and data contained in all publications are solely those of the individual author(s) and contributor(s) and not of MDPI and/or the editor(s). MDPI and/or the editor(s) disclaim responsibility for any injury to people or property resulting from any ideas, methods, instructions or products referred to in the content.

