Article

Use of Computational Fluid Dynamics to Study Ammonia Concentrations at Pedestrian Height in Smart Broiler Chamber Clusters

1
School of Applied Meteorology, Nanjing University of Information Science and Technology, Nanjing 210044, China
2
College of Artificial Intelligence, Nanjing Agricultural University, Nanjing 210031, China
3
Keqiao Meteorological Bureau, Shaoxing 312030, China
*
Author to whom correspondence should be addressed.
Agriculture 2023, 13(3), 656; https://doi.org/10.3390/agriculture13030656
Submission received: 13 February 2023 / Revised: 8 March 2023 / Accepted: 9 March 2023 / Published: 11 March 2023
(This article belongs to the Section Digital Agriculture)

Abstract

:
NH3 emissions are an environmental issue that is of wide concern in livestock production. In intensive livestock farming, it is necessary to study outdoor ammonia concentrations under various conditions to maximize the protection of livestock caretakers’ health in and around the facilities. In this study, the ammonia concentrations outside smart broiler chambers in 60 scenarios, with conditions including 4 broiler chamber densities, 3 wind directions, and 5 outlet emission intensities, were simulated based on computational fluid dynamics (CFD) technology. The results show that (1) outdoor ammonia tends to accumulate near the outlet when the wind direction angle is small, while it has a wider range of influence when the angle is vertical; (2) building a smart broiler chamber cluster for intensive livestock farming is environmentally friendly; and (3) keeping the ammonia outlet perpendicular to the local dominant wind direction can effectively prevent high concentrations of ammonia around the chambers. In practical applications, the conclusions of this study can be used to arrange the layout and direction of smart broiler chamber clusters.

1. Introduction

NH3 emission, as an environmental problem, has attracted people’s attention in recent years because it endangers animal and human health, as well as causing pollution [1]. Ammonia is a chemical compound with a pungent odor and can cause negative health effects in humans if they are exposed to excessive short-term or low long-term concentrations [2,3,4]. Ammonia also reacts with other air pollutants to produce PM2.5 (particulate matter with diameters that are generally 2.5 μm or smaller), which can cause chronic obstructive pulmonary disease (COPD), lung cancer, and other long-term diseases [3,5,6]. When the ammonia content in the air reaches 5 ppm, eye discomfort may occur due to irritation. At about 30 ppm, the irritation is more obvious and appears in the upper respiratory tract [2,7]. The 2018 Code of Practice for the Chemical Agents Regulations, based on European standards, states that the occupational exposure limit value for ammonia should be no more than 20 ppm (14 mg/m3) over an 8 h interval and no more than 50 ppm (36 mg/m3) over a 15 min interval [8]. Additionally, the ammonia concentration standard in the United States is no more than 25 ppm (18 mg/m3) over an 8 h interval [9]. In China, the maximum allowable concentration of ammonia in workshop air is 39.53 ppm (30 mg/m3) [10]. Ammonia in broiler chambers is produced during the decomposition of nitrogen in broiler manure. The experimental results obtained by our research group from 2019 to 2020 show that the concentration of hydrogen sulfide and methane produced in the process of broiler cultivation is very low (<0.1 ppm), while the concentration of ammonia is relatively high. Ammonia concentration can be more than 40 ppm in the broiler chamber under low ventilation conditions [11]. Research shows that agricultural ammonia emissions account for more than 81% of total global emissions [12,13]. Livestock caretakers work near and in broiler chambers, and excessive ammonia in the working environment will have adverse effects on their health. Hence, in the practice of intensive livestock farming, we should not only pay attention to the harm that ammonia can inflict on livestock, but also be aware of the ammonia discharged from livestock houses to the external environment.
A smart broiler chamber has a well-designed ventilation system to accelerate the outward discharge of interior pollutants. The chamber is equipped with two negative pressure fans, which operate at optimal frequencies according to the indoor air temperature detected by the sensor [14]. Compared with common residential ventilation, the ventilation system of a smart broiler chamber has higher efficiency [15]. However, recent studies have shown that although modern ventilation systems can rapidly reduce the ammonia content in enclosed production spaces, they will increase its emission to the external environment [16]. In intensive livestock farming, it is necessary to study the impact of emission intensity, layout spacing, and the placement direction of smart broiler chambers on outdoor ambient ammonia concentration.
Computational fluid dynamics (CFD) is a method that uses numerical calculation methods to directly solve flow control equations and discover the laws of various flow phenomena. In recent years, CFD technology has been widely used to simulate the indoor and outdoor environment of livestock and poultry houses, including simulations of ammonia. In 2009, Sapounas et al. [17] used CFD to simulate the impact of forced pit ventilation on ammonia emissions from a naturally ventilated cowshed. In 2011, Osorio et al. [18] developed and validated a model using CFD to determine NH3 emissions from non-insulated broiler houses with natural ventilation and found that the CFD model can be used to predict NH3 emissions from poultry facilities. In 2016, Osorio et al. [19] used the verified CFD model to predict NH3 broiler installation with natural ventilation and found that CFD simulation can be used to predict NH3 emission inventories. In 2020, Tabase et al. [20] developed a steady-state CFD model to predict the indoor airflow and NH3 distribution in a pig compartment equipped with an underfloor air distribution (UFAD) system. In 2021, Cheng et al. [21] used CFD to study the effect of inlet position and a flap on airflow and temperature in a laying hen house. Wang et al. [22] built and validated a CFD model to evaluate different ventilation strategies in a typical tunnel-ventilated layer house in autumn in order to study the effects of exhaust fans on ventilation performance. In 2022, Babadi et al. [23] used three-dimensional CFD to simulate a laying hen house equipped with a tunnel ventilation system and studied the distribution of five factors including velocity, temperature, concentration of gaseous CO2 and NH3 pollutants, and humidity. Using the CFD method, Yang et al. [24] compared the indoor air flow, temperature, NH3 concentration, and air age distribution in a newly proposed double-duct ventilation laying hen building with a traditional tunnel ventilation system. For a smart broiler chamber, in 2022, Zou et al. [11] used CFD to simulate the process of ammonia production and identify the characteristics of ammonia concentration and modified the structure of the broiler chamber. The above research shows that CFD simulations of ammonia concentration inside and outside livestock and poultry houses are efficient and reliable.
In this paper, the ammonia concentration in a smart broiler chamber cluster in 60 scenarios, with conditions including 4 broiler chamber densities, 3 wind directions, and 5 outlet emission intensities were simulated based on CFD technology. The mole fraction around broiler chambers at pedestrian height (1.5 m above the ground) in each scenario was mapped, and the spatial distribution of ammonia was analyzed. We aimed to quantitatively determine the ammonia in the air around smart broiler chambers using the above experiments to scientifically protect the health of livestock caretakers in and around facilities when using smart broiler chambers for intensive livestock farming.

2. Experiments and Methods

2.1. Research Objects

The smart broiler chambers used in this study are located on Jinniuhu Street, Liuhe District, Nanjing, Jiangsu Province. The length and width of each broiler chamber were 2.9 m and 1.9 m. To cope with rain, the top of each broiler chamber was tilted at an angle, with a height of 1.77 m on one side and 2.2 m on the other. The walls around the broiler chambers were made of 55 mm thick color steel polystyrene sandwich panels, which have the ability to provide thermal insulation. Each broiler chamber had an inlet, an outlet, and internal circulation. The main function of the inlet was to naturally ventilate and regulate the indoor temperature and humidity, while that of the outlet was to discharge pollutants. A negative pressure fan on the outlets operated at optimal frequencies according to the air temperature. For more information about management processes, see [14]. Internal circulation makes the environment in a broiler chamber more uniform. A total of 45 yellow-feathered broilers were raised inside each broiler chamber (8.17 broilers per m2 on average). The structure of the broiler chamber is shown in Figure 1. Broilers were not used in this study.

2.2. Experimental Scheme
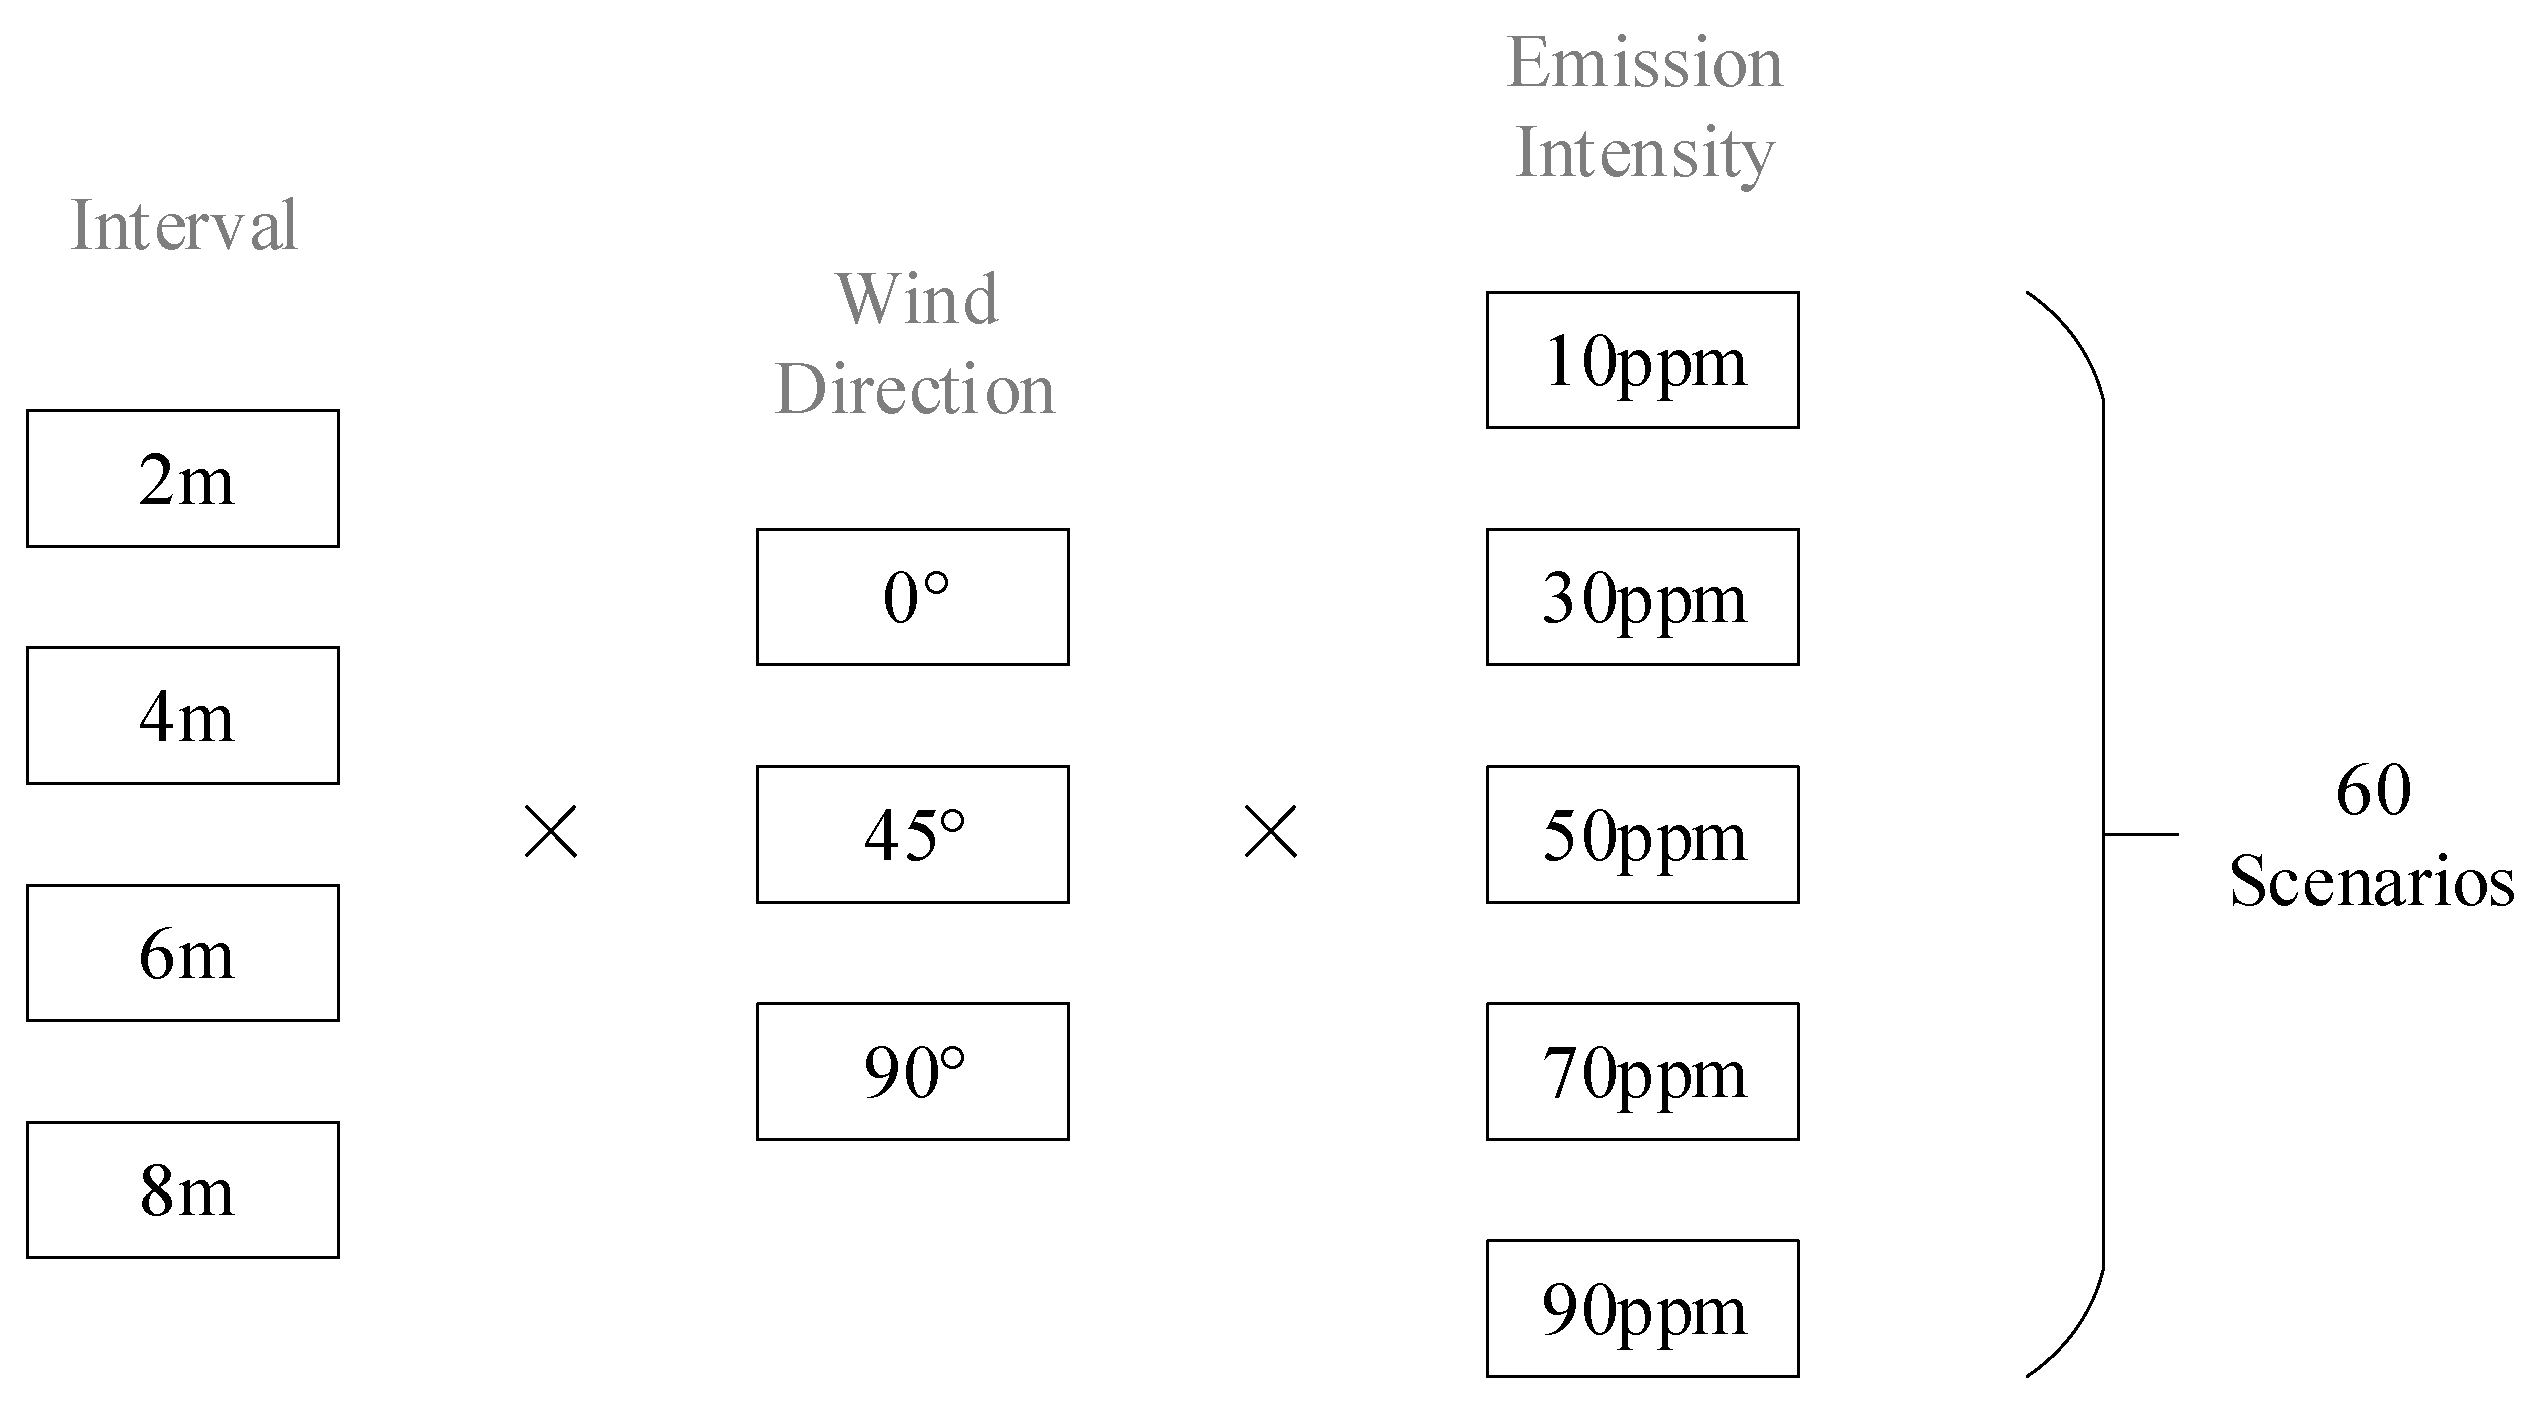
2.2.1. Scenarios

A total of 16 smart broiler chambers, arranged in 4 rows and 4 columns were assumed to represent intensive livestock farming. Intervals of 4 levels were set between broiler chambers, at 2 m, 4 m, 6 m, and 8 m. For the outside wind environment, three wind directions were set, which were horizontally angled at 0°, 45°, and 90° from the broiler chamber airflow outlet direction. That is, the wind directions were as follows: parallel to the normal at the outlet (0°), 45° counter-clockwise rotation from the normal at the exit (45°), and 90° counter-clockwise rotation from the normal at the exit (90°). The incoming wind speed was set at 3.6 m/s, which is a common wind speed in the middle and lower reaches of the Yangtze River. According to our team’s previous research results [11], the mole fractions of ammonia at the broiler chamber ventilation outlet were assumed to be 10 ppm, 30 ppm, 50 ppm, 70 ppm, and 90 ppm, where 10 ppm approximates the daily low ammonia concentration, 30 ppm and 50 ppm approximate medium and high concentrations, and 70 ppm and 90 ppm approximate extremely hazardous conditions. The scheme of scenarios is shown in Figure 2.

2.2.2. Random Sampling Points

For statistical analysis of the simulation data, 50 random sampling points were set between broiler chambers for each scenario (Figure 3). The sampling points were automatically generated by the create random points tool in the ArcGIS software (version 10.2.0.3348). The sampling points were randomly horizontally distributed inside the open space beside the broiler chambers, and there were no significant directional or zonal differences. The sampling points were all set at 1.5 m above the ground, which is a commonly used value to represent pedestrian height, especially in Asian studies [25,26,27,28].

2.3. CFD Simulation

2.3.1. Control Equations

The three basic equations in computational fluid dynamics include the continuity Equation (1), the momentum Equation (2), and the energy Equation (3) [29].
The continuity equation is also called the mass conservation equation:
ρ t + ( ρ u i ) x i = S m ,
where  ρ  is the fluid density,  t  is the time,  u i  is the velocity vector, and  S m  is the mass of the sparse phase added to the continuous phase.
The momentum equation is as follows:
( ρ u i ) t + ( ρ u i u j ) x j = p x i + τ i j x i + ρ g i + F i ,
where  p  is the pressure on the fluid microelement, and  g i  and  F i  represent the gravitational and other external volumetric forces acting on the microelement in the  i  direction, respectively.  τ i j  is the viscous stress tensor acting on the surface of the microelement due to the viscosity of the molecule.
The energy equation is as follows:
( ρ T ) t + d i v ( ρ u T ) = d i v ( k c p g r a d T ) + S T ,
where  T  is the temperature,  c p  is the specific heat capacity,  k  is the heat transfer coefficient of the fluid,  ρ  is density,  t  is time,  u  is the velocity vector, and  S T  is a viscous dissipation term which characterizes the internal energy converted from mechanical energy by the viscous of the fluid.

2.3.2. Mesh

The fluid space outside the 4 × 4 broiler chamber cluster was taken as the research area. We expanded the space to 15 m at the front, back, left, right, and top of the research area to allow for fluid development, thereby forming the computational domain. The unstructured mesh was selected to divide the fluid domain. The mesh unit was a combination of tetrahedral and pyramidal. Such a mesh provided high approximation of the complex boundaries and also facilitated refinement near the air inlets and outlets of the chambers. The maximum mesh size of each part of the geometry model was set as shown in Table 1. A large velocity gradient was expected near the ground, so prism meshes were set here as the boundary layer meshes. The initial height of the prism meshes here was 0.2 m, and the height ratio was 1.2, totaling 5 layers.
Geometric modeling and meshing of the computational domain were performed in ICEM CFD (ANSYS Inc., Pittsburgh, PA, USA, version 15.0). The total numbers for the model grid were 3,307,661 for the scenario with a 2 m interval; 3,467,953 for the scenario with a 4 m interval; 3,788,779 for the scenario with a 6 m interval; and 4,073,311 for the scenario with an 8 m interval. The grid check quality of all 4 scenarios was above 0.2, which met the requirements of the calculation. Figure 4 shows the mesh in scenarios with different intervals between broiler chambers.

2.3.3. Boundary Conditions

The boundary conditions of each zone are shown in Table 2. Where ammonia inside the chambers is discharged through the outlets to the computational domain, the boundary condition is represented by the mass flow inlet. Applying the species transport model, the mixture discharged from the outlets of the chambers is a mixture of air and ammonia. The physical properties of air are as follows: the specific heat is 1006.43 j/(kg·k), and the molecular weight is 28.966 kg/mol. The specific heat of ammonia varies with temperature in the form of a piecewise polynomial, while its molecular weight is 17.03061 kg/mol. The mass flow rate of the mass flow inlet is 0.247 kg/s. When the included angle between the wind direction and the ammonia discharge direction is 0°, the left boundary of the calculation domain is the velocity inlet, and the right boundary is the pressure outlet. When the included angle is 45°, the left and front boundaries of the calculation domain are velocity inlets, and the right and rear boundaries are pressure outlets. When the included angle is 90°, the front boundary of the calculation domain is the velocity inlet, and the rear boundary is the pressure outlet. The top of the fluid domain is symmetrical. On this plane, there is neither mass exchange nor heat exchange, and the gradient of a physical quantity in the direction perpendicular to it is 0.

2.3.4. Solver Parameters and Settings

ANSYS Fluent software (ANSYS Inc., Pittsburgh, PA, USA, version 15.0.0) was used for the solution, and the numerical algorithm was a finite volume method. The solution was 3-dimensional, steady, and pressure-based. The double-precision parallel solver was applied. In solution, the gravitational acceleration was set to −9.8 m/s2 in the Z direction. The energy equation was enabled when solving, while the radiation model was not. The temperature in the simulation was set to 300 K, which is close to the normal temperature in spring and autumn. The 2-equation k-ε model was selected for turbulence simulation, as it has been widely used in studies of air environment and pollution. Meanwhile, a standard wall function was applied. The pressure–velocity coupling scheme used was the SIMPLE algorithm. Iterations were judged to have converged when the continuous residuals stabilized below 10−3 and the computational results did not change in more than 50 iterations.

2.4. Power Law Wind Profile Model

A Fluent UDF was written to produce a power law wind profile model to approximate the law of fluid domain inflow wind speed as a function of altitude [30], which is as follows:
v ¯ ( z ) / v ¯ 0 = ( z / z 0 ) α ,
where  z 0  is the standard reference height (which is taken as 10 m in cities with a roughness height of approximately 100 m),  v ¯ 0  is the average wind speed at the standard reference height,  z  represents any height,  v ¯ ( z )  represents the average wind speed at any height, and  α  is the ground roughness index, where the rougher the terrain, the stronger the effect of the surface on the airflow and the greater the  α ; here  α   = 0.3 [31].

2.5. Statistics

Statistical analysis of the data in this article was carried out using R Studio (version: RStudio 2021.09.1+372 “Ghost Orchid” Release). The statistical analysis operations included data frame reorganization, calculation of the statistics (minimum, first quartile, median, third quartile, and maximum), boxplot drawing, hit-map drawing, etc.

3. Results

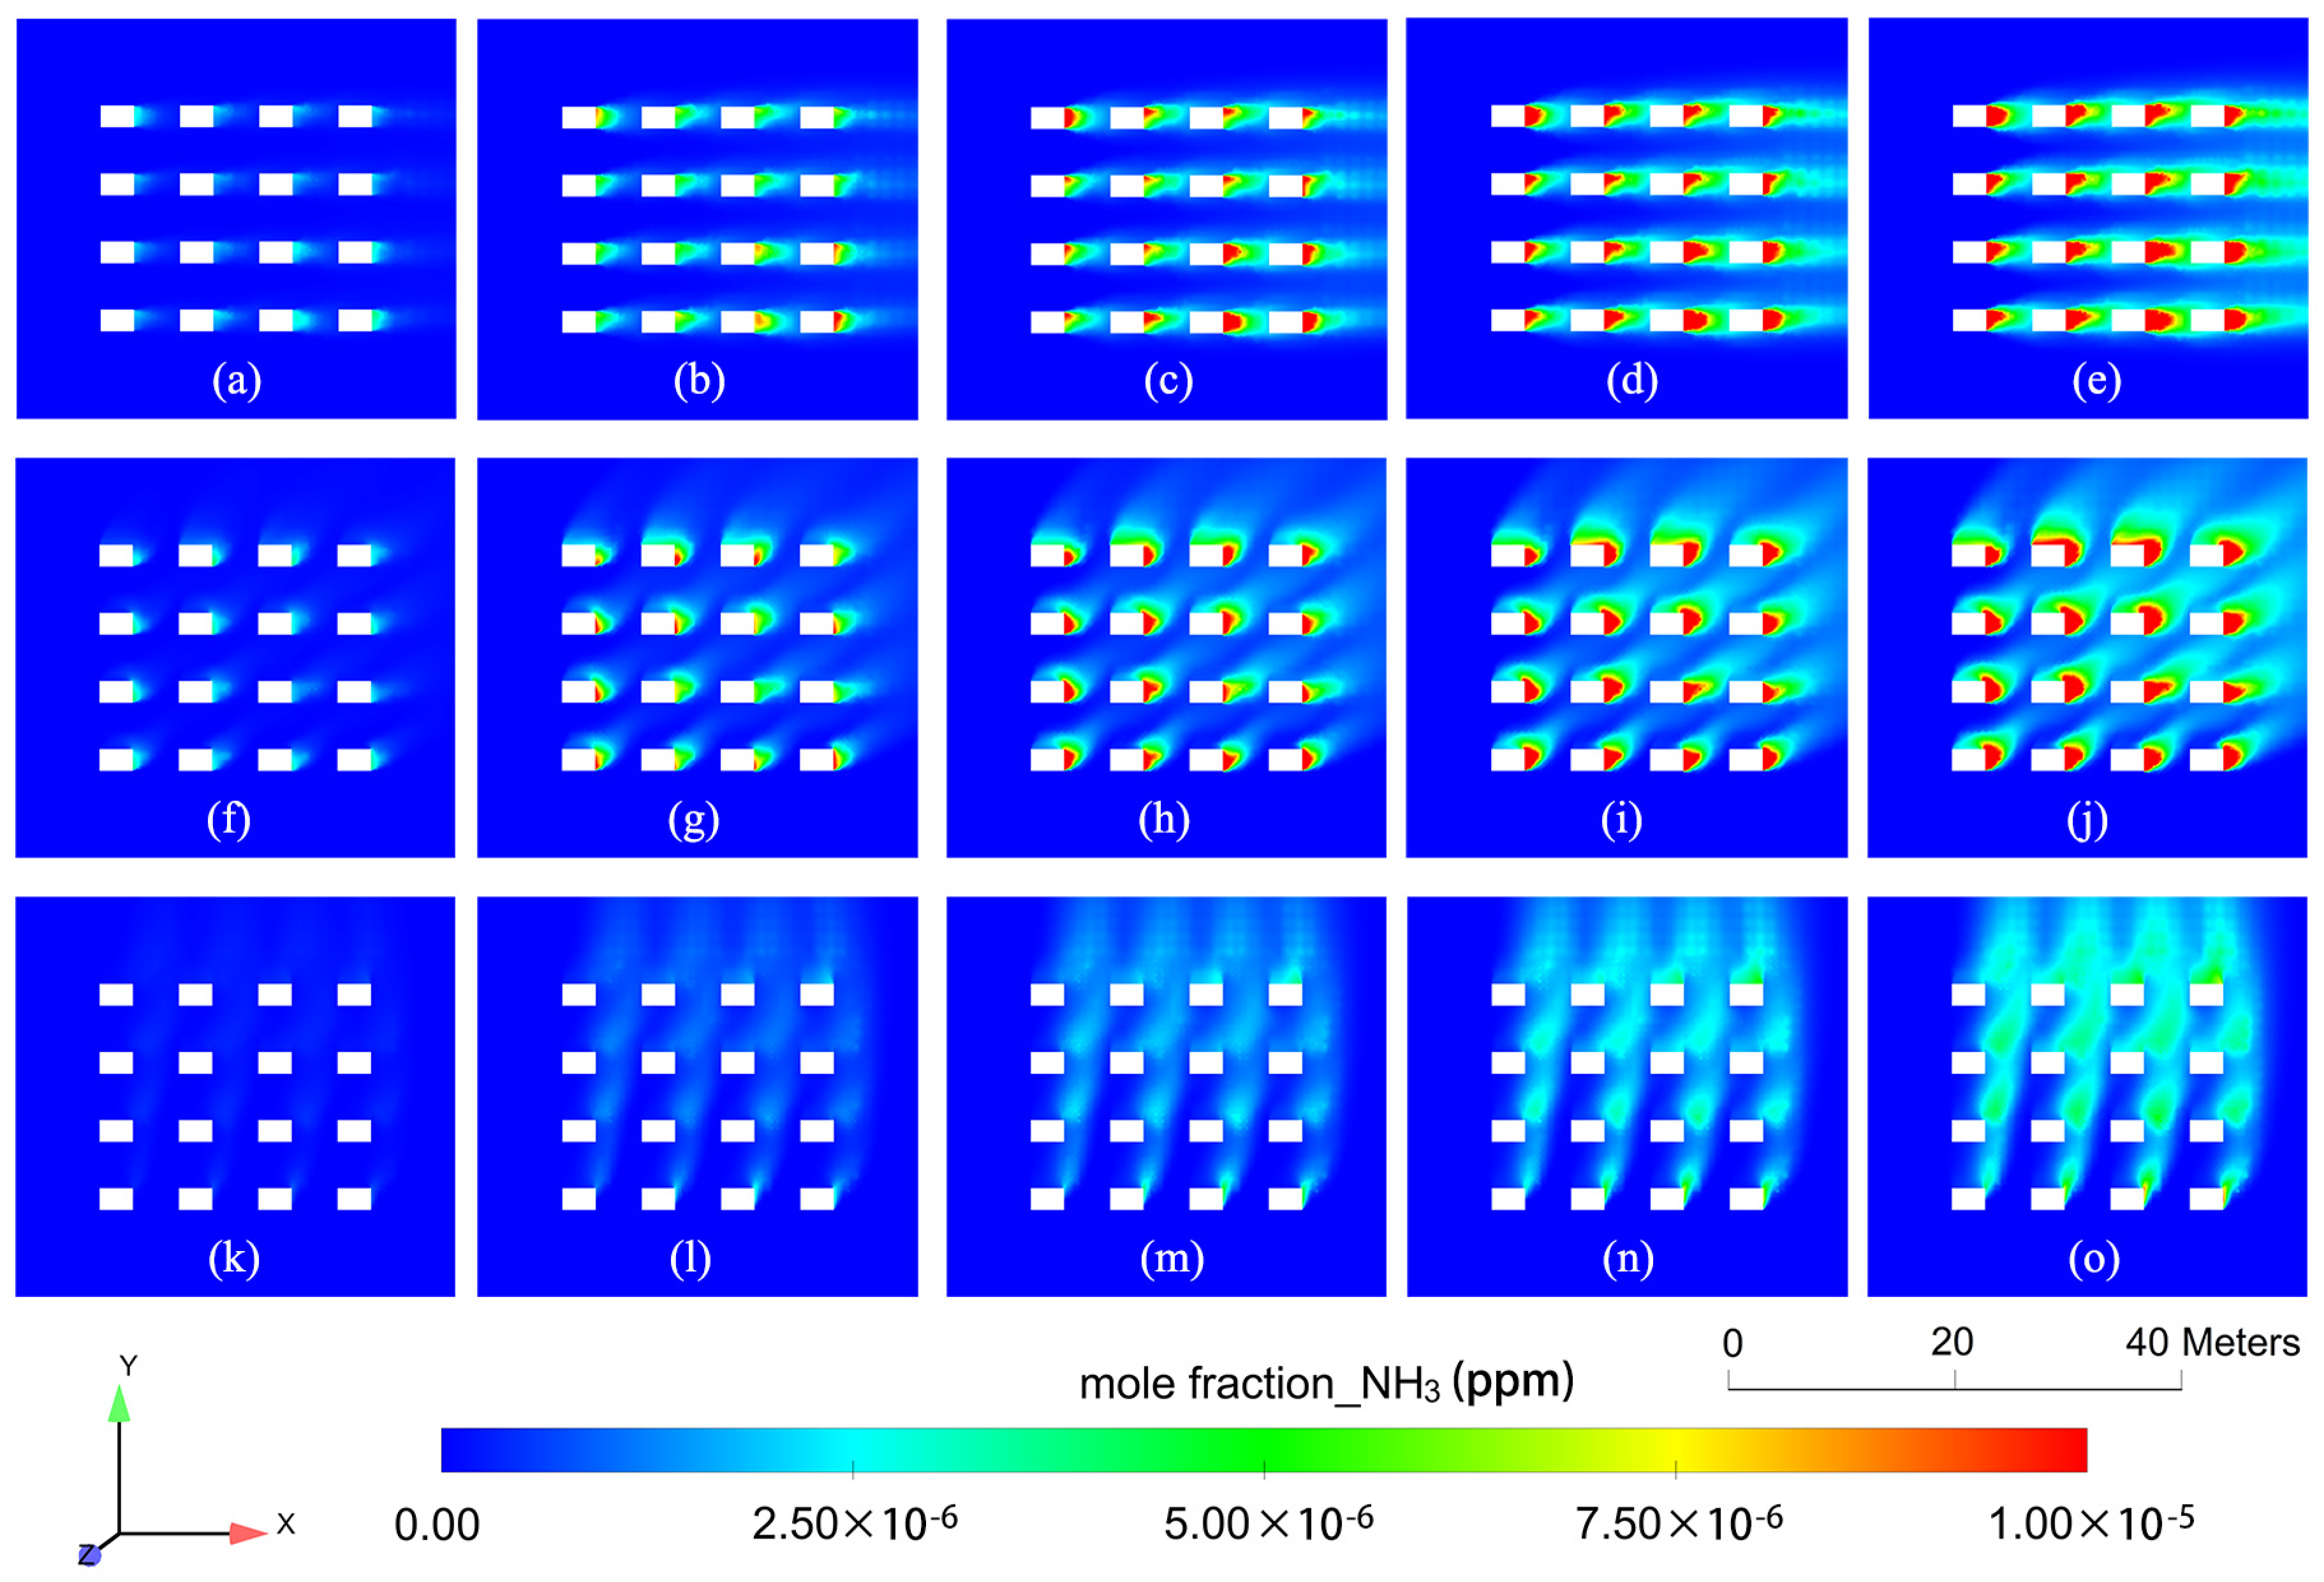
3.1. Ammonia Mole Fraction Distribution 1.5 m above the Ground

When the interval between the broiler chambers is 2 m, there are 15 scenarios with different wind directions and emission intensities (Figure 5). When the wind direction angle is 0°, the area of high ammonia concentration is mainly on the right side of the chambers, i.e., the outlet side. When the mole fraction of ammonia at the outlets is 10 ppm, the ammonia outside the chambers does not exceed 3 ppm, and the influence range is limited near the outlets. As emission intensity increases, the external ammonia concentration gradually increases to 10 ppm, and the influence range also gradually increases. When the emission intensity is 90 ppm, the ammonia concentration exceeds 10 ppm in most areas within a distance of 1 m from the outlets, and the concentration is around 5 ppm in a large area on the right side of the chamber cluster. When the wind direction angle is 45°, the high-concentration areas appear on the right and at the back of the chambers. With increasing emission intensity, the concentration of ammonia increases from less than 2.5 ppm to more than 10 ppm, and the impact range also increases. The impact range is limited to the vicinity of the outlets when the outlet concentration is 10 ppm, whereas it reaches most of the space between the chambers when the outlet concentration is 90 ppm. When the wind direction angle is 90°, high-ammonia-concentration areas are more likely to occur behind the chambers and in corridors between the chambers. When the emission intensity is 10 ppm, the outdoor ammonia concentration is below 2.5 ppm. In the 90 ppm emission intensity scenario, the area with outdoor ammonia exceeding 5 ppm is mainly at the rear of the broiler chamber cluster. To summarize the above scenarios, the concentration of outdoor ammonia increases with increasing emission intensity. When the angle between the emission direction and wind direction is relatively small, outdoor ammonia tends to accumulate near the outlet, and when the angle is vertical, outdoor ammonia has a wider range of influence.
The ammonia mole fractions of scenarios with different wind directions and emission intensities when the interval is 4 m are shown in Figure 6. When the wind direction angle is 0°, the areas of high ammonia concentration are mainly on the outlet side of the chambers. At an emission intensity of 90 ppm, ammonia concentrations exceed 5 ppm in most of the area to the right of each chamber. When the wind direction angle is 45°, the high-concentration areas are to the right rear of each broiler chamber. The ammonia concentration in the front left of the broiler chamber is relatively low due to the increased interval between the chambers. When the emission intensity is 10 ppm, the outdoor ammonia concentration does not exceed 5 ppm. When the wind direction angle is 90°, the high-concentration zones appear on the right side of the broiler chambers and diffuse upwards. With this wind direction, when the emission concentration ranges from 10 ppm to 90 ppm, the outdoor ammonia concentration does not exceed 10 ppm and rarely exceeds 5 ppm. Although the range of influence of ammonia is relatively large, when the emission intensity is lower than 50 ppm, the outdoor ammonia mole fraction does not exceed 5 ppm. In summary, when the interval is 4 m, the concentration of outdoor ammonia increases with increasing emission intensity. When the wind direction angle is 0° or 45°, ammonia tends to accumulate near the broiler chambers, whereas ammonia tends to diffuse when the wind direction angle is vertical, and the concentration values in the diffuse region are lower.
Figure 7 shows the ammonia mole fraction in scenarios with different wind directions and emission intensities when the interval between the broiler chambers is 6 m. When the wind direction angle is 0°, the areas of high ammonia concentration are mainly on the outlet side (right side) of the chambers. At an emission intensity of 30 ppm, the ammonia concentration near the outlets exceeds 10 ppm. When the wind direction angle is 45° and the emission intensity is 10 ppm, the outdoor ammonia concentration is less than 5 ppm. At emission intensities above 30 ppm, the concentration near the outlet exceeds 10 ppm. When the wind direction angle is 90°, the high-concentration zones appear on the right side of the broiler chambers and diffuse upwards. The outside ammonia concentrations are no higher than 5 ppm in scenarios where emission intensities do not exceed 50 ppm. In summary, in the scenarios with 6 m intervals between broiler chambers and wind direction angles of 0° and 45°, the characteristics of the concentration field are similar to those with 4 m intervals between broiler chambers. However, at intervals of 6 m, low-concentration areas between chambers are more numerous because of the larger spacing. In the scenarios with a wind direction angle of 90°, not only does the low-concentration area account for a higher proportion of areas, but the highest concentration value is also lower than that in the scenario with intervals of 2 m and 4 m.
Figure 8 shows the ammonia mole fraction of scenarios with different wind directions and emission intensities when the interval between the broiler chambers is 8 m. When the wind direction angle is 0°, the areas of high ammonia concentration are mainly on the right side of the chambers and appear as strips. When the wind direction angle is 45° and the emission intensity exceeds 30 ppm, the ammonia concentrations are greater than 10 ppm near the outlets, and tailing-like areas of decreasing concentration are formed to the right rear of the broiler chambers. When the wind direction angle is 90°, the high-concentration zones appear on the right side of the broiler chambers and diffuse upwards, which is similar to what occurs in scenarios with 6 m intervals between chambers. The outdoor ammonia concentration does not exceed 5 ppm when the emission intensity remains below 50 ppm; otherwise, the concentration is above 5 ppm, but not over 10 ppm, in the upper right area of each chamber. In summary, in the scenarios with 8 m intervals between broiler chambers, the characteristics of the concentration field are similar to those of scenarios with 6 m intervals between broiler chambers, with the exception of the greater proportion of low-concentration zones caused by larger intervals.

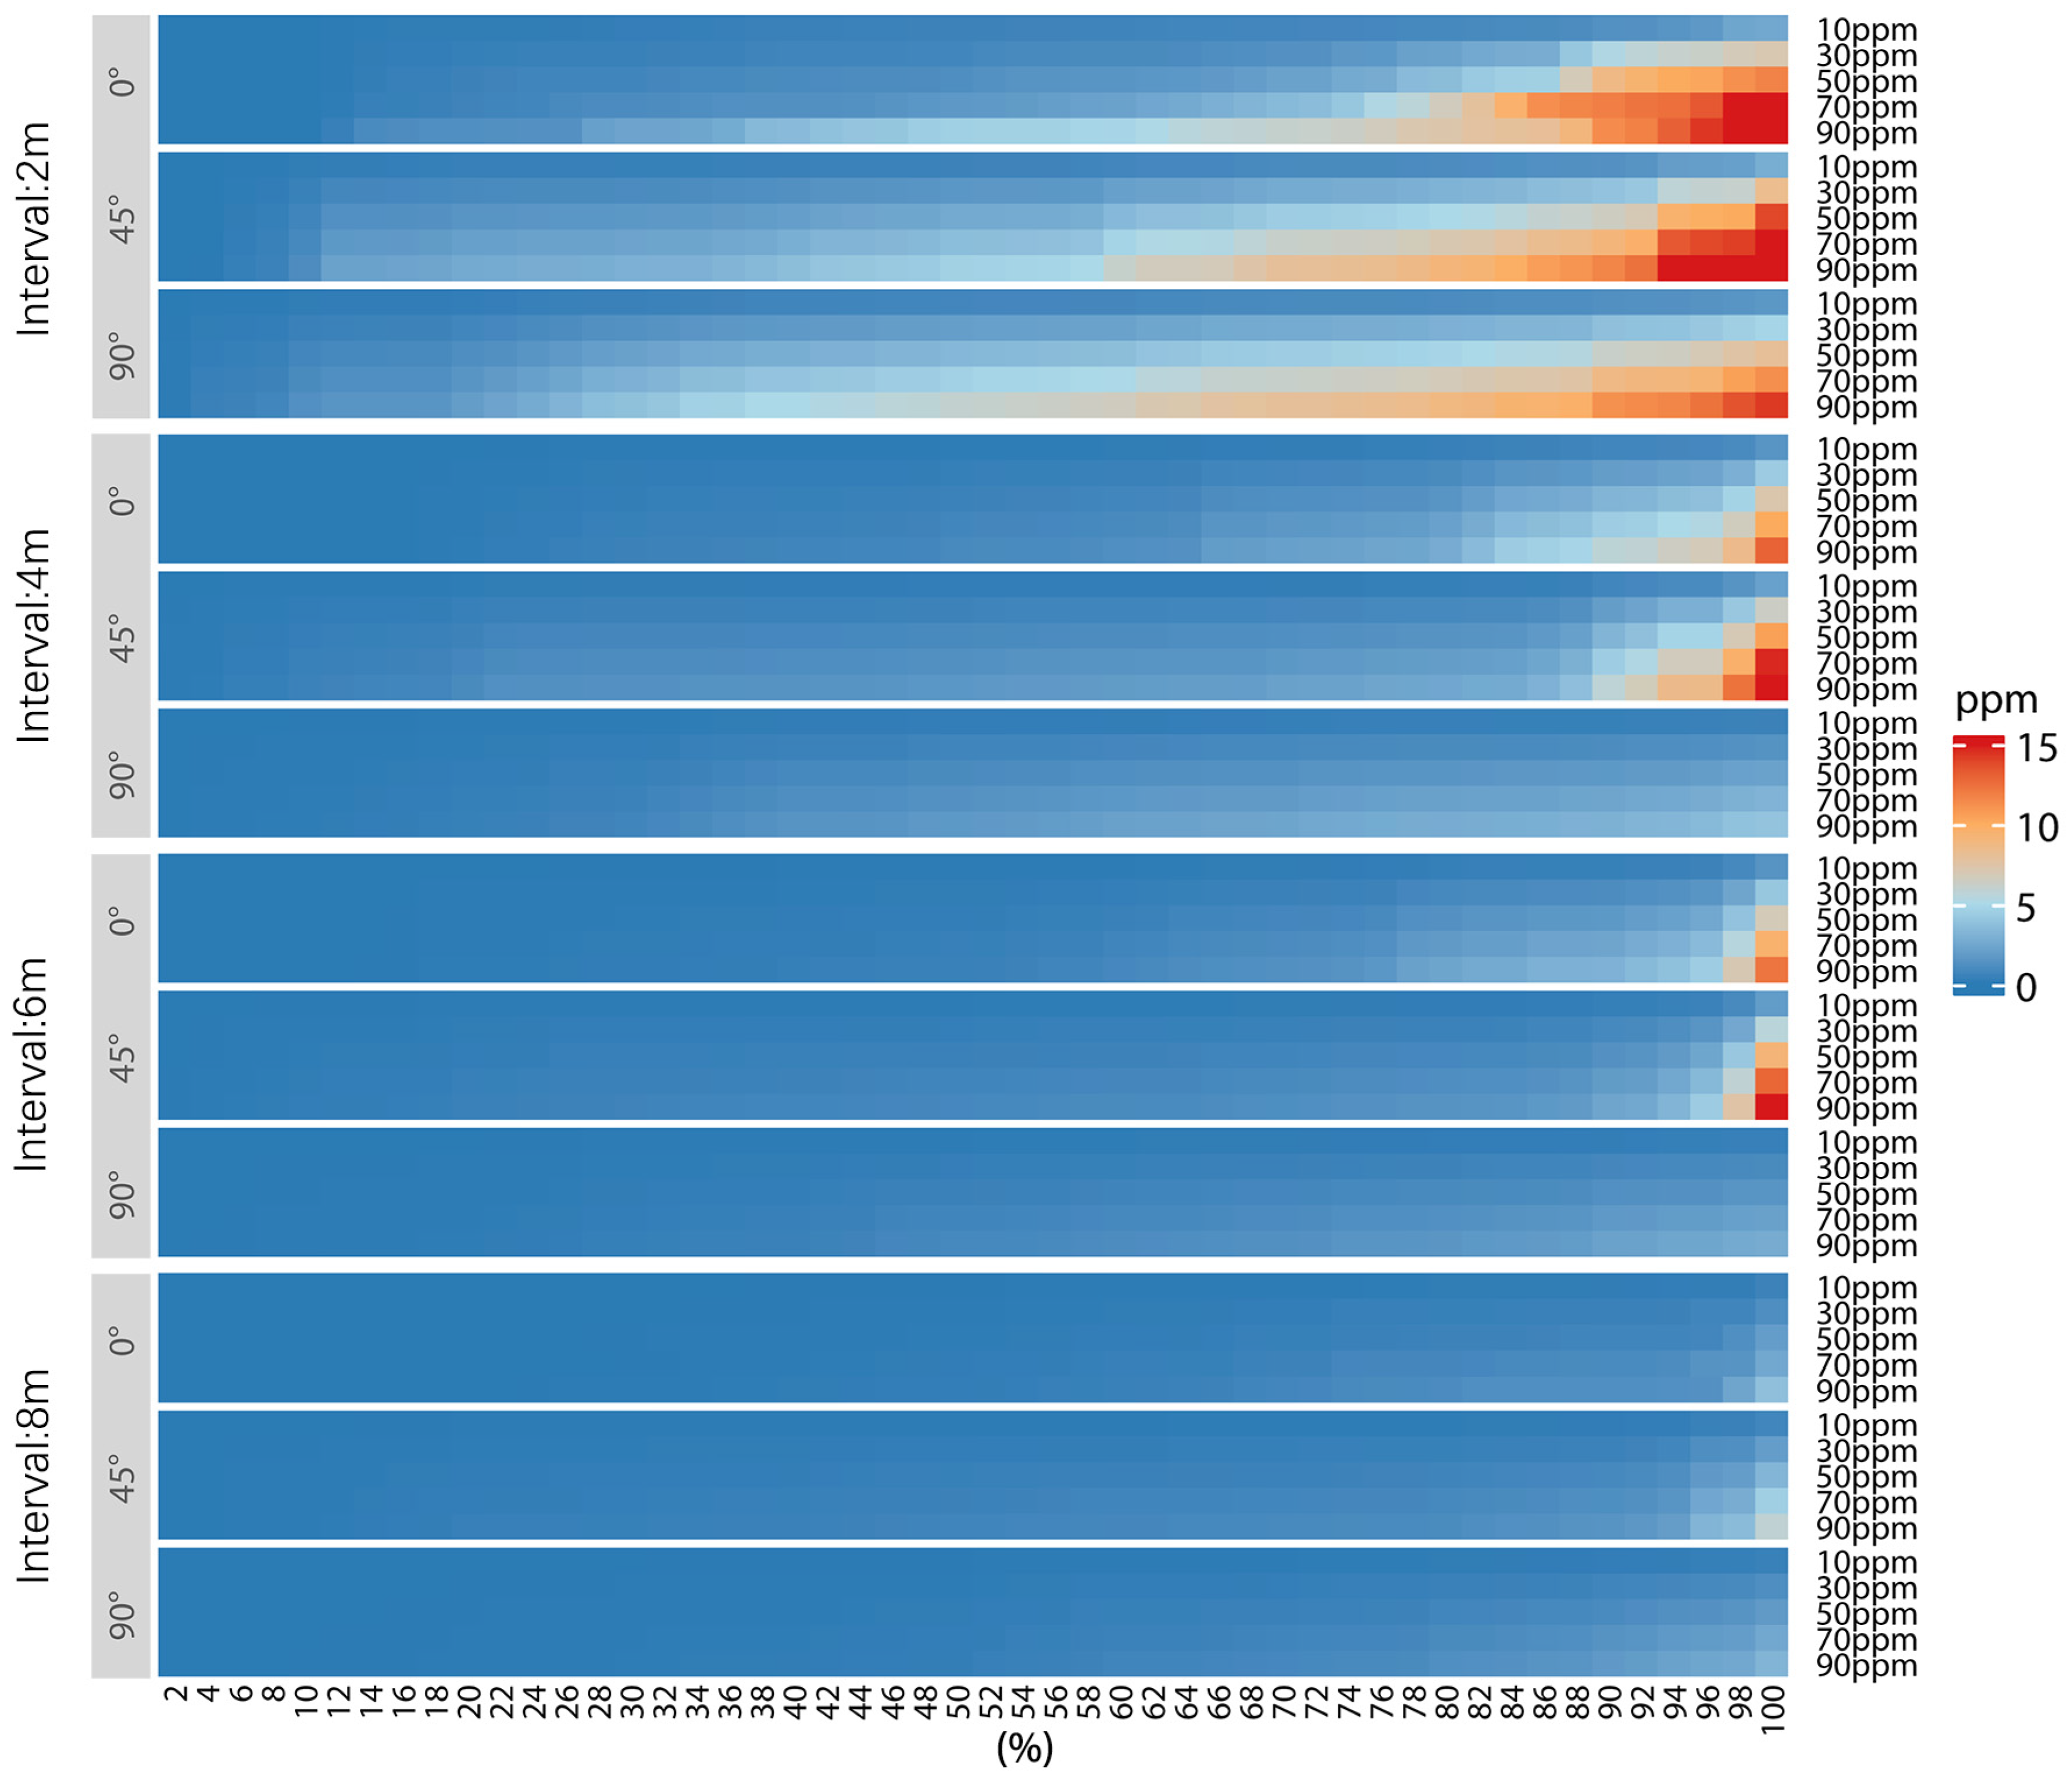
3.2. Random Sampling of Ammonia Concentration at 1.5 m above the Ground

The mole fractions at random sampling points were counted and grouped according to the intervals between broiler chambers. Five statistics (minimum, first quartile, median, third quartile, and maximum) were used to show the random sampling statistics for each scenario (Figure 9). It can be seen from the figure that the maximum concentrations of ammonia at an angle of 90° between the wind direction and the discharge direction are always less than those at angles of 0° and 45° in the same group of sampling points, regardless of the intervals between the broiler chambers and the emission intensity. All else being equal, the maximum concentrations at a wind direction angle of 45° are higher than for the other two wind directions. The maximum concentration of the sample is 25.06 ppm, which occurs with intervals of 2 m, a wind direction angle of 45°, and an emission intensity of 90 ppm. This is also the only scenario where the concentration is greater than 25 ppm. The median of the sample decreases with increasing intervals between broiler chambers when the other conditions are the same. In the scenarios with 2 m and 4 m intervals, the medians increase as the wind direction angle becomes vertical. When the interval increases to 6 m and 8 m, the concentration median is lower at a wind direction angle of 90° than at a wind direction angle of 45°. The median ammonia concentration in the sample tends to increase with increasing emission intensity, but the magnitude of the increase in mole fraction values decreases with increasing intervals between broiler chambers. The median values are no more than 5 ppm in any scenario, with the exception of a median of 6.00 ppm in the scenario with intervals of 2 m, a wind direction angle of 45°, and an emission intensity of 90 ppm.
Figure 10 shows the ammonia concentrations at the sampling points in percentile order to illustrate the overall numerical distribution of concentrations for each scenario. There are 6 scenarios with concentrations greater than 15 ppm: 4 with intervals of 2 m, 1 with intervals of 4 m, and 1 with intervals of 6 m. There are 16 scenarios where the concentration is more than 10 ppm: 8 with 2 m intervals, 5 with 4 m intervals, and 3 with 6 m intervals. There are 26 scenarios with a concentration greater than 5 ppm: 11 with intervals of 2 m, 7 with intervals of 4 m, 7 with intervals of 6 m, and 1 with intervals of 8 m. Among them, the highest proportion (62%) of sampling points with concentrations greater than 5 ppm occurs in the scenario with 2 m intervals, a 90° wind angle, and a 90 ppm emission intensity. In five scenarios, the sampling points with concentrations exceeding 5 ppm exceed 40%. Taken together, the proportion of high-concentration areas in scenarios with 2 m intervals between broiler chambers is obviously larger than in the other 3 interval scenarios. When the intervals are 4 m and 6 m, there are small proportions of high-concentration areas when the wind direction angles are 0° and 45°. When the interval is 8 m, there are few areas where the concentration is high enough to affect people.
Taking the experimental results together, we found the following. Regarding spatial distribution, when the angle between the direction of emissions and of the wind is relatively small, outdoor ammonia tends to accumulate near the outlet; meanwhile, when the angle is vertical, outdoor ammonia has a wider range of influence. When the interval between the chambers is 2 m, the contaminated areas surrounding the chambers are connected. The spatial distributions of the concentration fields are similar when the intervals between the broiler chambers are 4 m, 6 m, and 8 m. The larger the interval, the larger the proportion of low-concentration areas. When the wind direction angle is 90°, the proportion of high-concentration areas is smaller than for other wind directions. Scenarios with intervals of 2 m have a larger proportion of high-concentration areas than those with other intervals. Additionally, when the interval is 8 m, there are few areas where the concentration is high enough to affect people.

4. Discussion

In this paper, to obtain a more comprehensive understanding of ammonia concentrations in broiler chambers from a small to an extremely large scale, five levels of emission intensity were set. It is known from relevant studies that ammonia concentration can often be maintained at below 20 ppm in smart broiler chambers and below 10 ppm after the installation of improved ventilation systems [11]. Our simulation results indicate that when the emission intensity is below 30 ppm, the ammonia concentration at 1.5 m above the ground will not exceed the occupational exposure limit of ammonia, whether the standard is European, American, or Chinese [8,9,10]. Meanwhile, the proportion of outdoor concentrations over 5 ppm is also very small at emission intensities below 30 ppm, which means that the human body is less likely to experience discomfort due to irritation. Therefore, combined with measured ammonia concentrations, we recommend that the frequency of the negative pressure fan should be above 15 Hz [11]. This indicates that the working environment around smart broiler chambers is relatively suitable and that smart broiler chambers are environmentally friendly. It is highly feasible to construct smart broiler chamber clusters for intensive livestock farming.
In practical application, it is necessary to consider the local topography, site area, and surface cover when setting up a smart broiler chamber cluster for intensive livestock farming. To avoid odor diffusion and harm, the speed and direction of the wind, rainfall, temperature, etc., should be assessed before constructing a farm [32]. When conditions are limited, it is better to keep the interval between broiler chambers above 4 m and the direction of the ammonia outlet perpendicular to the local dominant wind direction to maximize the protection of livestock workers’ health.
It should be mentioned that although the damage caused to the human body by high levels of ammonia mostly manifests as acute damage, studies have shown that long-term exposure to low concentrations of ammonia, despite meeting safety standards, may also lead to respiratory damage and some systemic inflammation. For example, Brautbar et al. [33] believe that long-term exposure to odorous ammonia can lead to the impairment of lung function and increase the risk of long-term interstitial lung disease. Rahman et al. [34] have shown that prolonged exposure to ammonia concentrations that meet production safety standards can also lead to chronic airway inflammation, ultimately reducing lung function. Therefore, although ammonia concentrations in most areas near smart broiler chambers are well below the occupational exposure limits, they are not harmless to health. It is necessary to take appropriate measures to ensure further protection. Adjusting the feed structure of broilers is a well-established method [35,36,37], and other methods include spraying with water, improving litter composition and quantity, etc. [38].
This paper mainly discusses the safety of livestock and agricultural workers near smart broiler chambers, and further consideration should be given to the secondary environmental hazards caused by ammonia emission to the outside world. Therefore, in subsequent studies, we will try to simulate the PM2.5 generated by the reaction of ammonia with other pollutants.

5. Conclusions

This study innovatively modeled the ammonia concentrations outside smart broiler chambers using hierarchical and multi-scene quantitative analysis. The environmentally friendly nature of smart broiler chambers was further confirmed. This study could act as a guide for actual production. In practical applications, the conclusions of this study can be used to arrange the layout and direction of smart broiler chamber clusters.
Our research shows the following: (1) When the wind direction angle is small, outdoor ammonia tends to accumulate near the outlet, while when the angle is vertical, outdoor ammonia has a wider influence range. The outdoor ammonia concentration increases with increasing emission intensity and decreases with increasing intervals between chambers. (2) Under daily ammonia concentration conditions in smart broiler chambers, outdoor pedestrian-height ammonia concentrations do not exceed occupational exposure limits, and the human body is less likely to feel discomfort due to ammonia irritation. It is highly feasible to construct smart broiler chamber clusters for intensive livestock farming. (3) When the wind direction angle is 90°, the proportion of high-concentration areas is smaller than for other wind directions. Therefore, it is better to keep the ammonia outlet perpendicular to the local dominant wind direction to maximize the protection of livestock workers’ health.

Author Contributions

Conceptualization, M.L. and X.Q.; methodology, M.L. and X.Z.; validation, B.F. and M.L.; formal analysis, M.L.; investigation, M.L. and B.F.; resources, X.Z.; visualization, M.L.; writing—original draft preparation, M.L.; writing—review and editing, X.Z. and X.Q. All authors have read and agreed to the published version of the manuscript.

Funding

This research was funded by the National Key Research and Development Program of China (grant number 2019YFB2102003) and the National Natural Science Foundation of China (grant numbers 41805049 and 42075118).

Institutional Review Board Statement

Not applicable.

Data Availability Statement

The data presented in this study are available on request from the corresponding author. The data are not publicly available due to the privacy policy of the authors’ institution.

Acknowledgments

The authors thank Yao Li for his help with the data analysis.

Conflicts of Interest

The authors declare no conflict of interest. The funders had no role in the design of the study; in the collection, analyses, or interpretation of the data; in the writing of the manuscript; or in the decision to publish the results.

References

  1. Shi, Q.; Wang, W.; Chen, M.; Zhang, H.; Xu, S. Ammonia induces Treg/Th1 imbalance with triggered NF-κB pathway leading to chicken respiratory inflammation response. Sci. Total Environ. 2019, 659, 354–362. [Google Scholar] [CrossRef]
  2. Sundblad, B.-M.; Larsson, B.-M.; Acevedo, F.; Ernstgård, L.; Johanson, G.; Larsson, K.; Palmberg, L. Acute respiratory effects of exposure to ammonia on healthy subjects. Scand. J. Work. Environ. Health 2004, 30, 313–321. [Google Scholar] [CrossRef] [PubMed] [Green Version]
  3. Wyer, K.E.; Kelleghan, D.B.; Blanes-Vidal, V.; Schauberger, G.; Curran, T.P. Ammonia emissions from agriculture and their contribution to fine particulate matter: A review of implications for human health. J. Environ. Manag. 2022, 323, 116285. [Google Scholar] [CrossRef] [PubMed]
  4. Ryer-Powder, J.E. Health effects of ammonia. Plant Oper. Prog. 1991, 10, 228–232. [Google Scholar] [CrossRef]
  5. Stokstad, E. Ammonia Pollution From Farming May Exact Hefty Health Costs. Science 2014, 343, 238. [Google Scholar] [CrossRef] [PubMed]
  6. Spencer, J.; Van Heyst, B. A review of particulate matter emissions and impacts on human health: A focus on Canadian agricultural and rural emission sources. Can. Biosyst. Eng. Le Génie Des Biosystèmes Au Can. 2018, 60, 6–9. [Google Scholar] [CrossRef] [Green Version]
  7. National Research Council (US) Committee on Acute Exposure Guideline Levels. Ammonia Acute Exposure Guideline Levels. Available online: https://www.ncbi.nlm.nih.gov/books/NBK207883/ (accessed on 10 December 2022).
  8. Health and Safety Authority. Health and Safety Authority Draft 2018 Code of Practice for the Chemical Agents Regulations. Available online: https://chemistry.tcd.ie/assets/pdf/Safety/Chemical_Agents_COP_2018.pdf (accessed on 20 December 2022).
  9. CDC. NIOSH Pocket Guide to Chemical Hazards-Ammonia. Available online: https://www.cdc.gov/niosh/npg/npgd0028.html (accessed on 15 December 2022).
  10. Ministry of Health of the People’s Republic of China. Hygienic Standards for the Design of Industrial Enterprises (TJ36-79); People’s Medical Publishing House Co., Ltd.: Beijing, China, 1979.
  11. Zou, X.; Wang, S.; Qian, Y.; Gong, F.; Zhang, S.; Hu, J.; Liu, W.; Song, Y.; Zhang, S.; Meng, J.; et al. Study of Ammonia Concentration Characteristics and Optimization in Broiler Chamber during Winter Based on Computational Fluid Dynamics. Agriculture 2022, 12, 182. [Google Scholar] [CrossRef]
  12. Behera, S.N.; Sharma, M.; Aneja, V.P.; Balasubramanian, R. Ammonia in the atmosphere: A review on emission sources, atmospheric chemistry and deposition on terrestrial bodies. Environ. Sci. Pollut. Res. 2013, 20, 8092–8131. [Google Scholar] [CrossRef]
  13. Sutton, M.A.; Erisman, J.W.; Dentener, F.; Möller, D. Ammonia in the environment: From ancient times to the present. Environ. Pollut. 2008, 156, 583–604. [Google Scholar] [CrossRef]
  14. Yao, H.; Sun, Q.; Zou, X.; Wang, S.; Zhang, S.; Zhang, S.; Zhang, S. Research of yellow-feather chicken breeding model based on small chicken chamber. INMATEH-Agric. Eng. 2018, 56, 91–100. [Google Scholar]
  15. Zhang, S.; Ding, A.; Zou, X.; Feng, B.; Qiu, X.; Wang, S.; Zhang, S.; Qian, Y.; Yao, H.; Wei, Y. Simulation Analysis of a Ventilation System in a Smart Broiler Chamber Based on Computational Fluid Dynamics. Atmosphere 2019, 10, 315. [Google Scholar] [CrossRef] [Green Version]
  16. Naseem, S.; King, A.J. Ammonia production in poultry houses can affect health of humans, birds, and the environment—Techniques for its reduction during poultry production. Environ. Sci. Pollut. Res. 2018, 25, 15269–15293. [Google Scholar] [CrossRef]
  17. Sapounas, A.; Campen, J.; Smits, M.; Van Dooren, H. Simulating the effect of forced pit ventilation on ammonia emission from a naturally ventilated cow house with CFD. In Proceedings of the 4th European Conference on Precision Livestock Farming, Wageningen, The Netherlands, 6–8 July 2009; pp. 81–89. [Google Scholar]
  18. Alexander Osorio, J.; Sullivan Rocha, K.; De Fatima Ferreira Tinôco, I.; S Gates, R.; Lucia Zapata, O.; Barreto Mendes, L.; Alves Damasceno, F. Use of CFD Modeling for Determination of Ammonia Emission in Non-Insulated Poultry Houses with Natural Ventilation; American Society of Agricultural and Biological Engineers: St. Joseph, MI, USA, 2011. [Google Scholar]
  19. Osorio Saraz, J.A.; Ferreira Tinôco, I.d.F.; Olivera Rocha, K.S.; Barreto Mendes, L.; Norton, T. A CFD based approach for determination of ammonia concentration profile and flux from poultry houses with natural ventilation. Rev. Fac. Nac. De Agron. 2016, 69, 7825–7834. [Google Scholar] [CrossRef]
  20. Tabase, R.K.; Van Linden, V.; Bagci, O.; De Paepe, M.; Aarnink, A.J.A.; Demeyer, P. CFD simulation of airflows and ammonia emissions in a pig compartment with underfloor air distribution system: Model validation at different ventilation rates. Comput. Electron. Agric. 2020, 171, 105297. [Google Scholar] [CrossRef]
  21. Cheng, Q.; Feng, H.; Meng, H.; Zhou, H. CFD study of the effect of inlet position and flap on the airflow and temperature in a laying hen house in summer. Biosyst. Eng. 2021, 203, 109–123. [Google Scholar] [CrossRef]
  22. Wang, X.; Li, J.; Wu, J.; Yi, Q.; Wang, X.; Wang, K. Numerical Simulation of the Placement of Exhaust Fans in a Tunnel-Ventilated Layer House During the Fall. Trans. ASABE 2021, 64, 1955–1966. [Google Scholar] [CrossRef]
  23. Babadi, K.A.; Khorasanizadeh, H.; Aghaei, A. CFD modeling of air flow, humidity, CO2 and NH3 distributions in a caged laying hen house with tunnel ventilation system. Comput. Electron. Agric. 2022, 193, 106677. [Google Scholar] [CrossRef]
  24. Yang, Z.; Tu, Y.; Ma, H.; Yang, X.; Liang, C. Numerical simulation of a novel double-duct ventilation system in poultry buildings under the winter condition. Build. Environ. 2022, 207, 108557. [Google Scholar] [CrossRef]
  25. Lin, C.; Wang, Y.; Ooka, R.; Flageul, C.; Kim, Y.; Kikumoto, H.; Wang, Z.; Sartelet, K. Modeling of street-scale pollutant dispersion by coupled simulation of chemical reaction, aerosol dynamics, and CFD. Atmos. Chem. Phys. 2023, 23, 1421–1436. [Google Scholar] [CrossRef]
  26. Sun, C.; Zhang, F.; Zhao, P.; Zhao, X.; Huang, Y.; Lu, X. Automated Simulation Framework for Urban Wind Environments Based on Aerial Point Clouds and Deep Learning. Remote Sens. 2021, 13, 2383. [Google Scholar] [CrossRef]
  27. Li, J.; Zheng, B.; Ouyang, X.; Chen, X.; Bedra, K.B. Does shrub benefit the thermal comfort at pedestrian height in Singapore? Sustain. Cities Soc. 2021, 75, 103333. [Google Scholar] [CrossRef]
  28. Yang, J.; Shi, B.; Xia, G.; Xue, Q.; Cao, S.-J. Impacts of Urban Form on Thermal Environment Near the Surface Region at Pedestrian Height: A Case Study Based on High-Density Built-Up Areas of Nanjing City in China. Sustainability 2020, 12, 1737. [Google Scholar] [CrossRef] [Green Version]
  29. Versteeg, H.K.; Malalasekera, W. An Introduction to Computational Fluid Dynamics: The Finite Volume Method; Pearson Education: London, UK, 2007. [Google Scholar]
  30. Davenport, A.G. Rationale for Determining Design Wind Velocities; National Research Council of Canada Ottawa (Ontario) Div of Building Research: Ottawa, ON, Canada, 1960.
  31. GB50009-2012; Load Code for the Design of Building Structures; China Association for Engineering Construction Standardization (CECS). China Architecture & Building Press: Beijing, China, 2012.
  32. Konkol, D.; Popiela, E.; Skrzypczak, D.; Izydorczyk, G.; Mikula, K.; Moustakas, K.; Opaliński, S.; Korczyński, M.; Witek-Krowiak, A.; Chojnacka, K. Recent innovations in various methods of harmful gases conversion and its mechanism in poultry farms. Environ. Res. 2022, 214, 113825. [Google Scholar] [CrossRef] [PubMed]
  33. Brautbar, N.; Wu, M.P.; Richter, E.D. Chronic Ammonia Inhalation and Interstitial Pulmonary Fibrosis: A Case Report and Review of the Literature. Arch. Environ. Health Int. J. 2003, 58, 592–596. [Google Scholar] [CrossRef]
  34. Rahman, M.D.H.; Bråtveit, M.; Moen, B.E. Exposure to Ammonia and Acute Respiratory Effects in a Urea Fertilizer Factory. Int. J. Occup. Environ. Health 2007, 13, 153–159. [Google Scholar] [CrossRef] [PubMed]
  35. Such, N.; Mezőlaki, Á.; Rawash, M.A.; Tewelde, K.G.; Pál, L.; Wágner, L.; Schermann, K.; Poór, J.; Dublecz, K. Diet Composition and Using Probiotics or Symbiotics Can Modify the Urinary and Faecal Nitrogen Ratio of Broiler Chicken&rsquo;s Excreta and Also the Dynamics of In Vitro Ammonia Emission. Animals 2023, 13, 332. [Google Scholar]
  36. Tang, C.; Kong, W.; Wang, H.; Liu, H.; Shi, L.; Uyanga, V.A.; Zhao, J.; Wang, X.; Lin, H.; Jiao, H. Effects of fulvic acids on gut barrier, microbial composition, fecal ammonia emission, and growth performance in broiler chickens. J. Appl. Poult. Res. 2023, 32, 100322. [Google Scholar] [CrossRef]
  37. Fenske, K.; Lemme, A.; Rother, E.; Westendarp, H. Scaling Up the Effects of Low Nitrogen in Commercial Broiler Farms. Agriculture 2023, 13, 33. [Google Scholar] [CrossRef]
  38. Brink, M. Source-Oriented Strategies to Mitigate Ammonia Emission from Broiler Production; Ghent University: Merelbeke, Belgium, 2022. [Google Scholar]
Figure 1. Structure of smart broiler chamber: (a) interior appearance; (b) 3D model.
Agriculture 13 00656 g001
Figure 2. Schematic diagram of scenarios.
Agriculture 13 00656 g002
Figure 3. Location of random sampling points: scenarios with (a) 2 m; (b) 4 m; (c) 6 m; and (d) 8 m intervals between broiler chambers.
Agriculture 13 00656 g003
Figure 4. Mesh: scenarios with (a) 2 m; (b) 4 m; (c) 6 m; and (d) 8 m intervals between broiler chambers.
Agriculture 13 00656 g004
Figure 5. Ammonia mole fraction at 1.5 m above the ground in scenarios with 2 m intervals, in which the wind direction and outlet emission intensity are: (a) 0° and 10 ppm; (b) 0° and 30 ppm; (c) 0° and 50 ppm; (d) 0° and 70 ppm; (e) 0° and 90 ppm; (f) 45° and 10 ppm; (g) 45° and 30 ppm; (h) 45° and 50 ppm; (i) 45° and 70 ppm; (j) 45° and 90 ppm; (k) 90° and 10 ppm; (l) 90° and 30 ppm; (m) 90° and 50 ppm; (n) 90° and 70 ppm; (o) 90° and 90 ppm.
Agriculture 13 00656 g005
Figure 6. Ammonia mole fraction at 1.5 m above the ground in scenarios with 4 m intervals, in which the wind direction and outlet emission intensity are: (a) 0° and 10 ppm; (b) 0° and 30 ppm; (c) 0° and 50 ppm; (d) 0° and 70 ppm; (e) 0° and 90 ppm; (f) 45° and 10 ppm; (g) 45° and 30 ppm; (h) 45° and 50 ppm; (i) 45° and 70 ppm; (j) 45° and 90 ppm; (k) 90° and 10 ppm; (l) 90° and 30 ppm; (m) 90° and 50 ppm; (n) 90° and 70 ppm; (o) 90° and 90 ppm.
Agriculture 13 00656 g006
Figure 7. Ammonia mole fraction at 1.5 m above the ground in scenarios with 6 m intervals, in which the wind direction and outlet emission intensity are: (a) 0° and 10 ppm; (b) 0° and 30 ppm; (c) 0° and 50 ppm; (d) 0° and 70 ppm; (e) 0° and 90 ppm; (f) 45° and 10 ppm; (g) 45° and 30 ppm; (h) 45° and 50 ppm; (i) 45° and 70 ppm; (j) 45° and 90 ppm; (k) 90° and 10 ppm; (l) 90° and 30 ppm; (m) 90° and 50 ppm; (n) 90° and 70 ppm; (o) 90° and 90 ppm.
Agriculture 13 00656 g007
Figure 8. Ammonia mole fraction at 1.5 m above the ground in scenarios with 8 m intervals, in which the wind direction and outlet emission intensity are: (a) 0° and 10 ppm; (b) 0° and 30 ppm; (c) 0° and 50 ppm; (d) 0° and 70 ppm; (e) 0° and 90 ppm; (f) 45° and 10 ppm; (g) 45° and 30 ppm; (h) 45° and 50 ppm; (i) 45° and 70 ppm; (j) 45° and 90 ppm; (k) 90° and 10 ppm; (l) 90° and 30 ppm; (m) 90° and 50 ppm; (n) 90° and 70 ppm; (o) 90° and 90 ppm.
Agriculture 13 00656 g008
Figure 9. Box plot of ammonia mole fraction at random sampling points: scenarios with (a) 2 m; (b) 4 m; (c) 6 m; and (d) 8 m intervals between broiler chambers.
Agriculture 13 00656 g009
Figure 10. Percentage map of ammonia concentration at sampling points.
Agriculture 13 00656 g010
Table 1. Mesh parameters of each part of the model.
ZoneMaximum Mesh Size
Chamber outlets0.02 m
Chamber inlets0.02 m
Wall of the broiler chambers0.1 m
Ground 0.5 m
Vertical sides of the fluid domain2 m
Top of the fluid domain2 m
Interior of the fluid domain2 m
Table 2. Boundary conditions of each zone.
ZoneType
Chamber outletsMass flow inlet
Chamber inletsPressure outlet
Wall of the broiler chambersWall
GroundWall
Inflow boundaries of the fluid domainVelocity inlet
Outflow boundaries of the fluid domainPressure outlet
Top of the fluid domainSymmetry
Disclaimer/Publisher’s Note: The statements, opinions and data contained in all publications are solely those of the individual author(s) and contributor(s) and not of MDPI and/or the editor(s). MDPI and/or the editor(s) disclaim responsibility for any injury to people or property resulting from any ideas, methods, instructions or products referred to in the content.

