Article

Risk Assessment of Rice Damage Due to Heavy Rain in Taiwan

1
Department of Agronomy, National Chung Hsing University, Taichung 40227, Taiwan
2
Smart Sustainable New Agriculture Research Center (SMARTer), Taichung 40227, Taiwan
*
Author to whom correspondence should be addressed.
Agriculture 2023, 13(3), 630; https://doi.org/10.3390/agriculture13030630
Submission received: 20 January 2023 / Revised: 17 February 2023 / Accepted: 2 March 2023 / Published: 6 March 2023
(This article belongs to the Special Issue Advances in Agrometeorology and Climatology)

Abstract

:
Rice (Oryza sativa L.) is a crucial staple crop globally but is damaged under extreme precipitation. Risk assessment for heavy rain (HR) damage events is essential for developing strategies for adapting to climate change. In this study, weather and rice damage data were used to assess the risk of HR damage events in Taiwan. These events were classified into nontyphoon-caused HR (NTCHR) and typhoon-caused HR (TCHR) events. The temporal, spatial, and weather characteristics of HR damage events were selected as risk factors for rice HR damage. Logistic regression was used to evaluate the effects of the selected risk factors on the occurrence and severity of HR damage events. The odds of an NTCHR damage event were 4.33 and 4.17 times higher in the reproductive and ripening stages, respectively, than during the vegetative stage. Moreover, each 1 mm increase in the maximum daily precipitation increased the odds of an NTCHR and TCHR damage event by 2% and 3%, respectively. In this study, the documentary data of damage events present a potential for assessment of weather damage event risk. Moreover, the risk of rice HR damage events in Taiwan is affected by not only weather but also temporal and spatial factors.

1. Introduction

Approximately 770 million people globally suffered from hunger in 2020 [1]. To feed the global population, crop production must be increased. However, despite improvements in agricultural technology, crop production is still limited by several factors, such as rainfall. According to the World Meteorological Organization, heavy rain (HR) is defined as rainfall of at least 50 mm over 24 h. HR has a negative effect on the yield of many crops [2,3,4]. In some regions, climate change has caused a 2–4% increase in the occurrence of HR; thus, climate change is exacerbating the aforementioned problem [5]. The risk of HR events for crop production should be better understood, and corresponding strategies to ensure food security should be developed.
Crops are affected by HR in various ways, such as lodging, which reduces the yield of wheat, barley, oats, maize, and rice by 31–80%, 4–65%, 37–40%, 5–20%, and 5–84%, respectively [6]. In addition, rainfall during ripening induces preharvest sprouting, which affects crop production [7]. Incessant rainfall during flowering increases the frequency of unfilled grains, which causes a reduction in yield [8]. Studies have reported that the effect of HR on crops varies between growth stages. Therefore, the time of HR occurrence during crop growth is a key factor for evaluating the risk caused by HR to crops.
The primary phenomenon associated with climate change is the increase in global temperature; however, extreme precipitation is another consequence of climate change [9,10]. Extreme rainfall is high-frequency or high-intensity precipitation. The frequency of extreme precipitation has increased by 6% per decade since 1901 in India [11], and the intensity of extreme precipitation has increased by 8.75 mm per decade in 1971 at Petaling Jaya, Malaysia [12]. Increases in extreme precipitation frequency and intensity are expected to enhance crop damage.
To minimize the crop damage caused by extreme weather, risk management strategies must be implemented. The assessment of extreme weather risk is a key component of climate change risk management. Some studies have projected changes in the climate and have evaluated the potential effects of these changes on crop production. One study on Indonesian rice production reported that a reduction in precipitation of 10–25% during the later period of the dry season would require the implementation of drought adaptation strategies [13]. By contrast, the climate is expected to remain favorable for wheat production in the United Kingdom [14]. Certain studies have used process-based crop models to evaluate the effect of extreme weather on crops [15,16,17]. One study used a crop model to simulate sunflower yields and reported that yield reductions may occur in some regions if the climate continues to change [18]. However, a crop model for maize yield failed to capture losses due to excessive rainfall [19]. Therefore, methods of evaluating the effect of rainfall on crop yields must be improved. Most relevant studies have focused on the relationship between interannual weather and crop yields; however, studies have seldom examined which weather characteristics cause crop damage. The characteristics of extreme rainfall events were studied in [20] to identify which rice-growing regions were at high risk of flooding in southern China. Another study used historical flood event data to evaluate the flood risk to rice crops [21].
Rice (Oryza sativa L.) is one of the most crucial food crops globally and is consumed as a staple by over half the world’s population [22]. To feed the growing population and ensure food security, rice must be guaranteed to have a high and stable yield. Climate and weather conditions strongly affect rice growth. The relationship between weather and rice production has been studied [23,24]; however, most relevant studies have focused on the effect of temperature on rice production. Because rice can be cultivated in paddies, relatively few studies have investigated the relationship between precipitation and rice production [25], and most of these have focused on the effect of flooding on rice production [21,26,27]. However, one study observed that rainfall had a negative effect on rice production [28]. Another study indicated that a higher number of precipitation days was correlated with worse rice yields [4]. Thus, rice production is also affected by precipitation that does not cause flooding.
Extreme rainfall has also been increasing in Taiwan [29]. The climate of Taiwan differs in its northern, central, southern, and eastern regions, and rice is the main crop cultivated in Taiwan. Therefore, evaluating the risk of rice damage due to HR is critical for effectively planning Taiwanese rice cultivation. In the present study, damaging weather event data and meteorological data were used to assess the risk of HR to rice in Taiwan. The temporal, spatial, and weather characteristics of HR events were selected as the risk factors for rice damage due to HR. These risk factors were used to evaluate which scenarios have the highest risk for damaging HR events, and the results of this study can be used as a reference when developing climate change adaptation strategies.

2. Materials and Methods

2.1. Study Site

The island of Taiwan is located in the northwestern Pacific Ocean between 120°–122° N and 22°–25° E. Taiwan can be approximately divided into four geographical areas (central, eastern, northern, and southern) (Figure 1), the division of geographical areas based on the similarity of climate between counties. Northern and central Taiwan have a subtropical climate, whereas southern Taiwan has a tropical climate. The central mountains also cause climate variations. Most rainfall in Taiwan occurs during the wet seasons, which comprises the mei-yu (monsoon, mid-May to June) and typhoon (July to September) seasons. Winter is typically dry; however, northern and eastern Taiwan have a northeastern monsoon season. Rice is cultivated in two crop seasons each year under substantially different climate conditions. In the first crop season, the temperature increases and daylight decreases. The growth environment conditions in the second crop season are opposite to those in the first one [30]. In general, the first crop season is between January and June, and the second crop season is from July to December. Because of climate variations in the four regions of Taiwan, each region has a different rice growth season.

2.2. Meteorological Data Collection and Weather Characteristics

Meteorological data from 2003 to 2021 were collected from the website of the Central Weather Bureau (accessed on 15 June 2022. https://e-service.cwb.gov.tw/; https://agr.cwb.gov.tw/). Daily meteorological data, namely average temperature (°C), maximum temperature (°C), minimum temperature (°C), relative humidity (%), average wind speed (m s−1), average wind direction (°), total precipitation (mm), total radiation (MJ m−2), total sunshine hours (h), and evaporation (mm), were collected from the manned and automatic weather stations, automatic rain gauge stations, and agricultural weather stations of the Central Weather Bureau of Taiwan. The collected automatic rain gauge station data comprised only the daily total precipitation. The total number of stations varied each year during the study period. Stations at an altitude >500 m were excluded because the study goal was to understand the rice cultivation environment. To ensure data quality, outliers were removed. Moreover, all the data for a month were excluded if the month had 10 or more days of missing data. Only daily total precipitation, daily average wind speed, and daily average relative humidity were extracted from the meteorological data set. The weather characteristics during an event period or specific growth stages, including total precipitation (tPREC), maximum daily precipitation (maxDPREC), average daily precipitation (meanDPREC), residual average daily precipitation (rmeanDPREC), number of wet days (WDS), maximum daily average wind speed (maxDWS), and mean daily average relative humidity (meanDRH), were calculated for further analysis (Table 1).

2.3. Definition of HR Damage and Control Events

County-level information on crop damage caused by disasters was recorded in the Report on Crop Loss Disasters of Taiwan released by Taiwan Council of Agriculture (accessed on 15 June 2022. https://agrstat.coa.gov.tw/sdweb/public/official/OfficialInformation.aspx) [31]. This report contains the event time, event type, crop type, total area of damaged fields (ha), percent damage per field (%), actual total damage area (ha), and estimated yield loss (t). The event types are low temperature, HR, drought, foehn, typhoon (tropical storm), high winds, and tornado. The total area of damage fields is the total field area affected by the event, and the damage percent per field is the average percentage of the field area in which crops were destroyed during the event. The actual total damage area is the total area of the destroyed crops. The estimated yield loss was calculated according to the actual total damage area and the average yield of each district. The event time was reported as year and month; however, more detailed data (such as late June) or a specific date were recorded for some events.
Rice damage data for each county for the HR and typhoon event types from 2003 to 2021 were extracted from the aforementioned report. These events were defined as HR damage events. Furthermore, the HR damage events were classified into nontyphoon-caused HR (NTCHR) and typhoon-caused HR (TCHR) events. The event times of TCHR and partial NTCHR damage events were manually refined using disaster information from the National Science and Technology Center for Disaster Reduction (accessed on 15 June 2022. https://ncdr.nat.gov.tw/). The event damage was classified as level 1 if the damage percentage per field was <20% and level 2 otherwise. Events affecting only specific fields (total damaged field area of <10 ha) were excluded. If a period (month and day) had an HR damage event in one or more years, the same period from residual years without HR damage was selected as a control event. However, control events were excluded if the precipitation during the event period was less than 0.1 mm. The damage level of a control event was defined as 0. The events were further classified according to which of the two crop seasons and three rice growth stages (vegetative, reproductive, and ripening) that they occurred during (temporal characteristics). Moreover, event locations were classified as northern, central, eastern, or southern (spatial characteristics).

2.4. Statistical Analysis

Chi-square tests was used to evaluate the association between the events and the categorical variables (crop season, growth stage, and geographical location). Continuous variables were tested using the Kruskal–Wallis test to assess the differences in these variables between the control, NTCHR, and TCHR groups. Difference in damage percentage between the NTCHR and TCHR events was evaluated using the Wilcoxon test. Three logistic regression models were used to calculate the odds ratios (OR) and corresponding 95% confidence intervals (CI) to evaluate the effects of the selected risk factors on the occurrences of HR, NTCHR, and TCHR events. In addition, three multinomial logistic regression models were constructed to evaluate the risk factors for event severity. The variables included in the logistic regression models were geographical location, crop season, growth stage, maxDPREC, rmeanDPREC, WDS, maxDWS, and meanDRH. Because tPREC and meanDPREC can be calculated using maxDPREC, rmeanDPREC, and WDS, the variables tPREC and meanDPREC were not included in the logistic regression models. Reduced logistic regression models for NTCHR and TCHR damage events were used to simulate the probability of event occurrence. The reduced models only contained risk factors that were significant in the previous logistic regression model. The statistical analysis was conducted using the SAS 9.4 statistical package (SAS Institute, Cary, NC, USA).

3. Results

3.1. Precipitation Characteristics of Different Geographical Locations in Taiwan

The numbers of daily precipitation and monthly wet days were averaged from 2003 to 2021 to describe the precipitation characteristics of the different geographical locations in Taiwan. The daily precipitation was smoothed as a 10-day moving average. The main wet season was June to September for most areas (Figure 2a). Because of monsoons and typhoons, central and southern Taiwan had a distinct wet season with high precipitation intensity. Daily precipitation was more constant in northern Taiwan than in the aforementioned two areas. The overall pattern of daily precipitation in eastern Taiwan area was similar to that in northern Taiwan; however, the daily precipitation during October–December was higher in eastern Taiwan than in norther Taiwan. In winter, eastern and northern Taiwan had high daily precipitation due to the northeast monsoon season.
Eastern Taiwan is the wettest region in Taiwan, and the number of monthly wet days in this region was high throughout the year (Figure 2b). By contrast, central Taiwan had few monthly wet days in most months—less than 10 days from October to February. Northern Taiwan had approximately 15–20 days monthly wet days. The monthly wet days distribution of southern Taiwan was similar to that of central Taiwan but with more wet days. The distinct wet season of central and southern Taiwan is indicated by the number of monthly wet days in these areas during different times.
For the yearly precipitation in each geographical location, the yearly precipitation fluctuated year by year and did not appear a specific trend during the study period (Figure 2c). Eastern Taiwan had relatively high yearly precipitation in most of the years. On the contrary, the lowest yearly precipitation occurred in central Taiwan in most of the years.

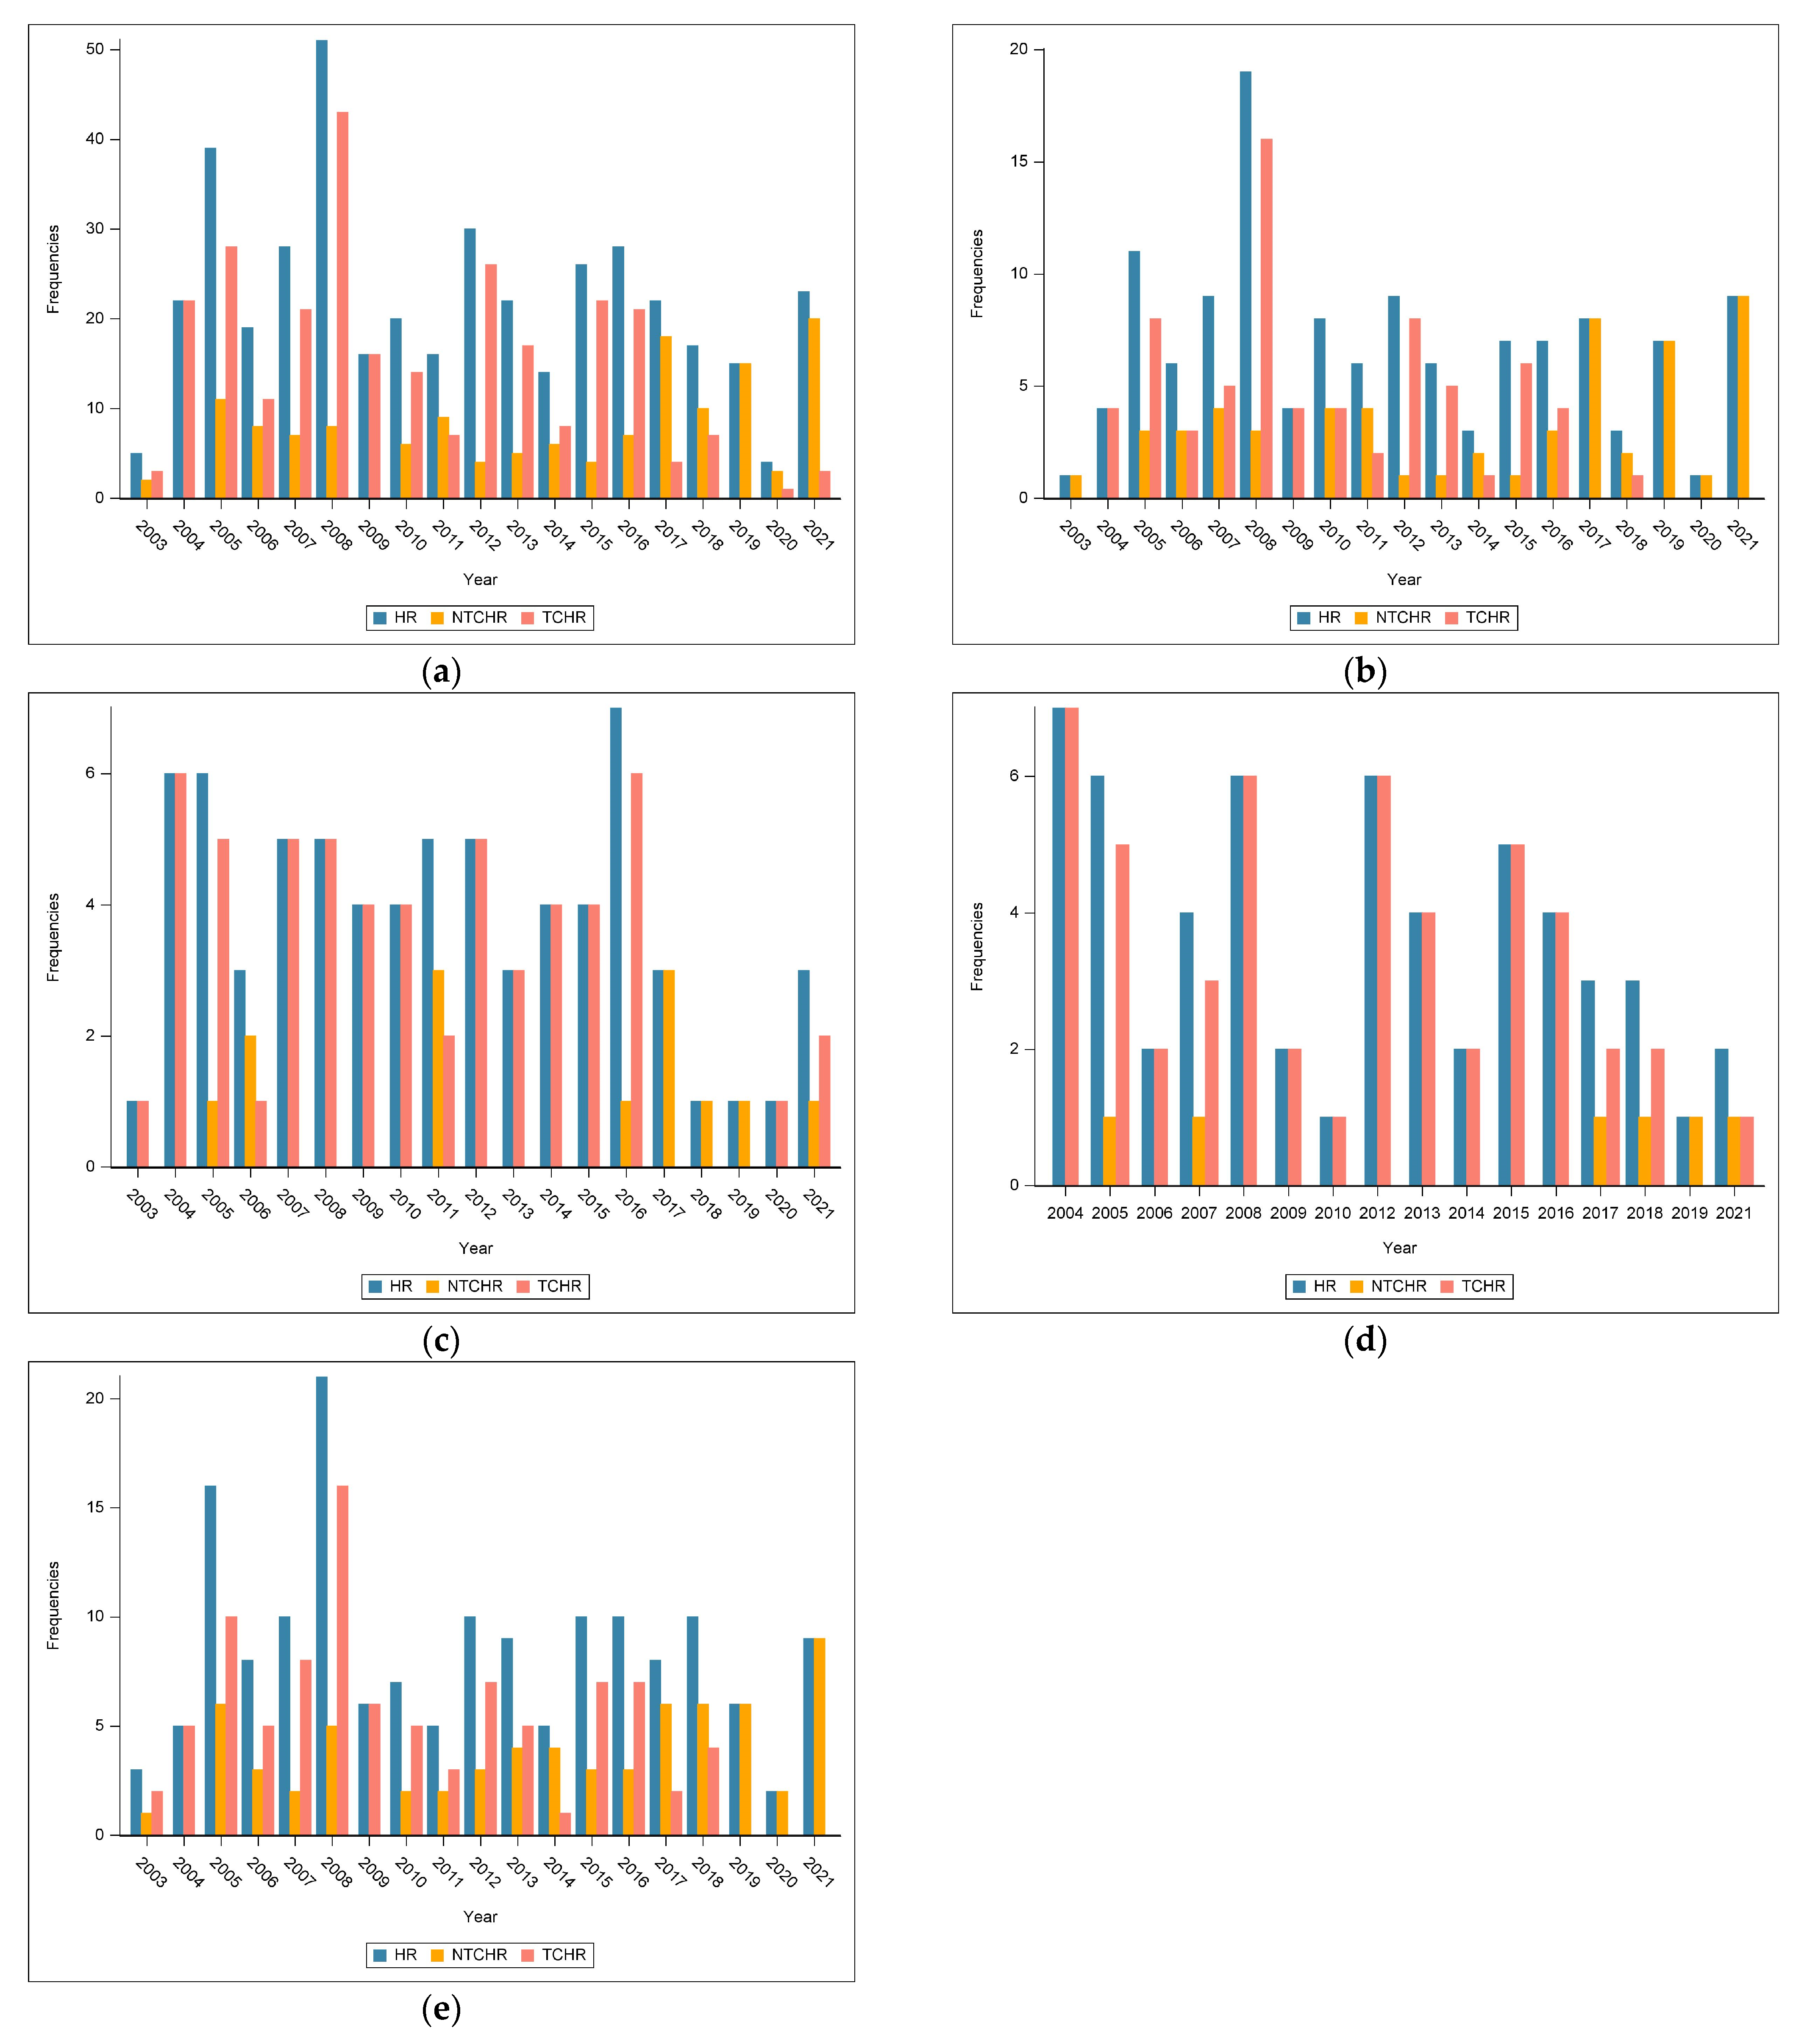
3.2. Frequency of Events during 2003–2021

A total of 417 HR damage events were included in this study. The frequencies of the HR damage events fluctuated during the study period (Figure 3a). In most years, NTCHR and TCHR damage events had substantially different frequencies, and no clear increasing or decreasing trend in the frequency of these events was observed from 2003 to 2021. However, the TCHR damage events were relatively infrequent during 2017–2021. The precipitation patterns of central and southern Taiwan were similar; thus, the pattern of HR damage events during the study period was similar for these two areas (Figure 3b,e). Most of the HR damage events, including all the NTCHR damage events in 2019, 2020, and 2021, occurred in central and southern Taiwan. NTCHR damage events were rare in eastern and northern Taiwan because the precipitation intensity during the monsoon season was lower in these areas than in central and southern Taiwan (Figure 3c,d). The HR damage events in these regions were primarily TCHR damage events. However, the frequency of NTCHR damage events in eastern and northern Taiwan has increased from 2017. Despite the frequencies of HR damage events not appearing to have a specific trend, positive correlations between the frequencies of HR damage events and yearly precipitation in each geographical location were found. The correlation coefficients of each region were 0.72 (p value < 0.001), 0.67 (p value = 0.002), 0.70 (p value < 0.001), and 0.74 (p value < 0.001), respectively.
No clear trend in the frequency of the HR damage events was observed from 2003 to 2021 (Figure 4a); the frequencies of both types of HR damage events fluctuated during this period. However, the frequencies of level 1 and level 2 NTCHR damage events have increased in recent years (Figure 4b,c). Nevertheless, the frequencies of the TCHR damage events exhibited no clear trend during the study period (Figure 4c). In contrast to the NTCHR damage events, the TCHR damage events were relatively rare over 2017 to 2021 years.

3.3. Temporal, Spatial, and Weather Characteristics of Events

The relationships between the occurrence and characteristics of the HR damage events were investigated. The total numbers of control, NTCHR, and TCHR damage events were 5315, 143, and 274, respectively (Table 2). On the control events, 41.07% occurred during crop season 1 and 58.93% occurred during crop season 2. The chi-square test indicated a significant association between the occurrence of different types of HR damage events and crop season (p < 0.001). Because of the monsoon and typhoon seasons in Taiwan, 83.92% of the NTCHR damage events occurred during crop season 1 and 69.34% of the TCHR damage events occurred during crop season 2. Most of the NTCHR damage events occurred during the rice ripening stage, and a further 20.28% of these events occurred during the reproductive stage. The TCHR damage events were less strongly associated with a particular growth stage than were the NTCHR damage events; 43.8%, 21.53%, and 34.67% of the TCHR damage events occurred during the vegetative, reproductive, and ripening stages, respectively. Over 85% of the NTCHR damage events occurred in central and southern Taiwan. By contrast, TCHR damage events were relatively evenly distributed between the four regions. The association between the occurrence of various HR damage event types and geographical location was significant (p < 0.001). The aforementioned results indicate that the type of HR damage event is related to temporal and spatial factors.
All weather characteristics were significantly different between the control and HR damage events (Table 3). As expected, the mean values of the weather characteristics were significantly lower for the control events than for the HR damage events. The NTCHR damage events usually had a longer event period than did the TCHR events; thus, the NTCHR damage events typically had higher mean tPREC and WDS values than did the TCHR damage events. Because of the high WDS value of the NTCHR events, their tPREC value was higher than that of the TCHR damage events. The mean maxDPREC, meanDPREC, and rmeanDPREC values of the TCHR damage events were 161.1, 68.49, and 31.67 mm, respectively. The corresponding values of the TCHR damage events were higher than those of the NTCHR damage events, which indicated that the precipitation intensity of the TCHR damage events was higher than that of the NTCHR damage events. Moreover, the mean maxDWS value of the TCHR damage events was almost double that of the NTCHR damage events; this result is unsurprising given the characteristics of typhoons. As expected, the meanDRH value was higher (approximately 85%) for the HR damage events than for the control events (<80%). Both HR damage event types had notably different weather characteristics than did the control events. The TCHR caused relatively higher impact on the rice yield. The average yield losses caused by NTCHR and TCHR damage events were 1109.59 and 2326.63 tons, respectively.

3.4. Risk Factors for Various HR Event Causes

Logistic regression was conducted to quantify the effects of the selected risk factors on HR damage events. Crop season, growth stage, maxDPREC, rmeanDPREC, WDS, maxDWS, and meanDRH were significant risk factors for HR damage events (Table 4). Most of these risk factors (except for crop season) had a positive OR. Because the second crop season was mainly affected by the TCHR damage events, it had a lower risk of HR damage events than did the first crop season (OR = 0.52; 95% CI = 0.32–0.87). The high-precipitation period in Taiwan is during the reproductive and ripening stages of the first crop season. The ORs for HR damage events of these stages were 2.12 and 2.1 times those of the vegetative stage, respectively. Central, eastern, and southern Taiwan did not have significantly higher HR damage event odds than did northern Taiwan. For every 1 mm increase in maxDPREC, the HR event odds increased by a factor of 1.02. The OR of rmeanDPREC was 1.04 with a 95% CI of 1.02–1.05, which indicated that the HR damage events were affected by not only the most intense rainfall but also the overall rainfall intensity of other wet days. Moreover, the odds of HR events increased by 3% for each additional wet day. Because of the TCHR damage event, the risk of HR damage events increased by 2.4 times if maxDWS increased by 1 m s−1. An increase of 1% in meanDRH caused a 10% increase in the odds of HR damage events.

3.5. Risk Factors for HR Damage Event Severity

Because of the differences in the weather characteristics of NTCHR and TCHR damage events, the ORs of these damage events were calculated (Table 4), and several differences were identified in the significant risk factors of NTCHR and TCHR damage events. For the NTCHR damage events, crop season was a nonsignificant risk factor (OR = 0.91; 95% CI = 0.37–2.28). Compared with northern Taiwan, the odds for the occurrence of an NTCHR damage event in central and southern Taiwan were 4.37 and 3.99 times higher, respectively, because of the relatively intense precipitation during the monsoon season in these areas. As expected, the NTCHR damage events were unaffected by wind. The OR of maxDWS for the NTCHR damage events was 1, with the 95% CI being 0.79–1.28. The growth stage was also a nonsignificant risk factor for the TCHR damage events; that is, typhoons were harmful during all growth stages. Because a typhoon event usually has a short duration, WDS did not have a significant effect on the odds of a TCHR damage event. However, wind damaged rice during typhoons, and each increase of 1 m s−1 in maxDWS caused a 3.67-fold increase in the odds of a TCHR damage event. In summary, although the NTCHR and TCHR damage events shared many risk factors, some differences between these events were observed.
The average damage percentages per field for the NTCHR and TCHR damage events were 17.94% and 22.2%, respectively (Table 3). All weather characteristics had a significant effect on the odds of level 1 HR damage events (Table 5). The odds of level 2 HR damage events during the reproductive and ripening stages were 2.73 and 2.76 times higher than that during the vegetative stage. Therefore, the HR damage events occurring during the reproductive and ripening stages were likely to be more severe than those occurring during the vegetative stage. Notably, a higher number of precipitation days was not associated with more severe damage to rice. WDS had a nonsignificant effect on the odds of level 2 HR damage events.
All temporal and spatial characteristics had a nonsignificant effect on the occurrence of level 2 NTCHR damage events (Table 5), which were mainly affected by weather characteristics. More intense rainfall was associated with a higher field damage percentage. The risk factors for level 1 and level 2 TCHR damage events were similar (Table 5). The odds of level 1 and level 2 TCHR damage events increased by 3.53 and 3.88 times, respectively, for each 1 m s–1 increase in maxDWS and by 3% for each 1 mm increase in maxDPREC. Because of the short duration of typhoon events, WDS had a nonsignificant effect on the odds of both levels of TCHR damage events. Compared with the vegetative stage, the reproductive stage had 2.37-times higher odds for level 2 TCHR damage events. Thus, the TCHR damage events occurring during the reproductive stage caused more severe damage to rice than did those occurring during the other two stages. Most of the weather characteristics had a significant effect on both levels of HR, NTCHR, and TCHR damage events.

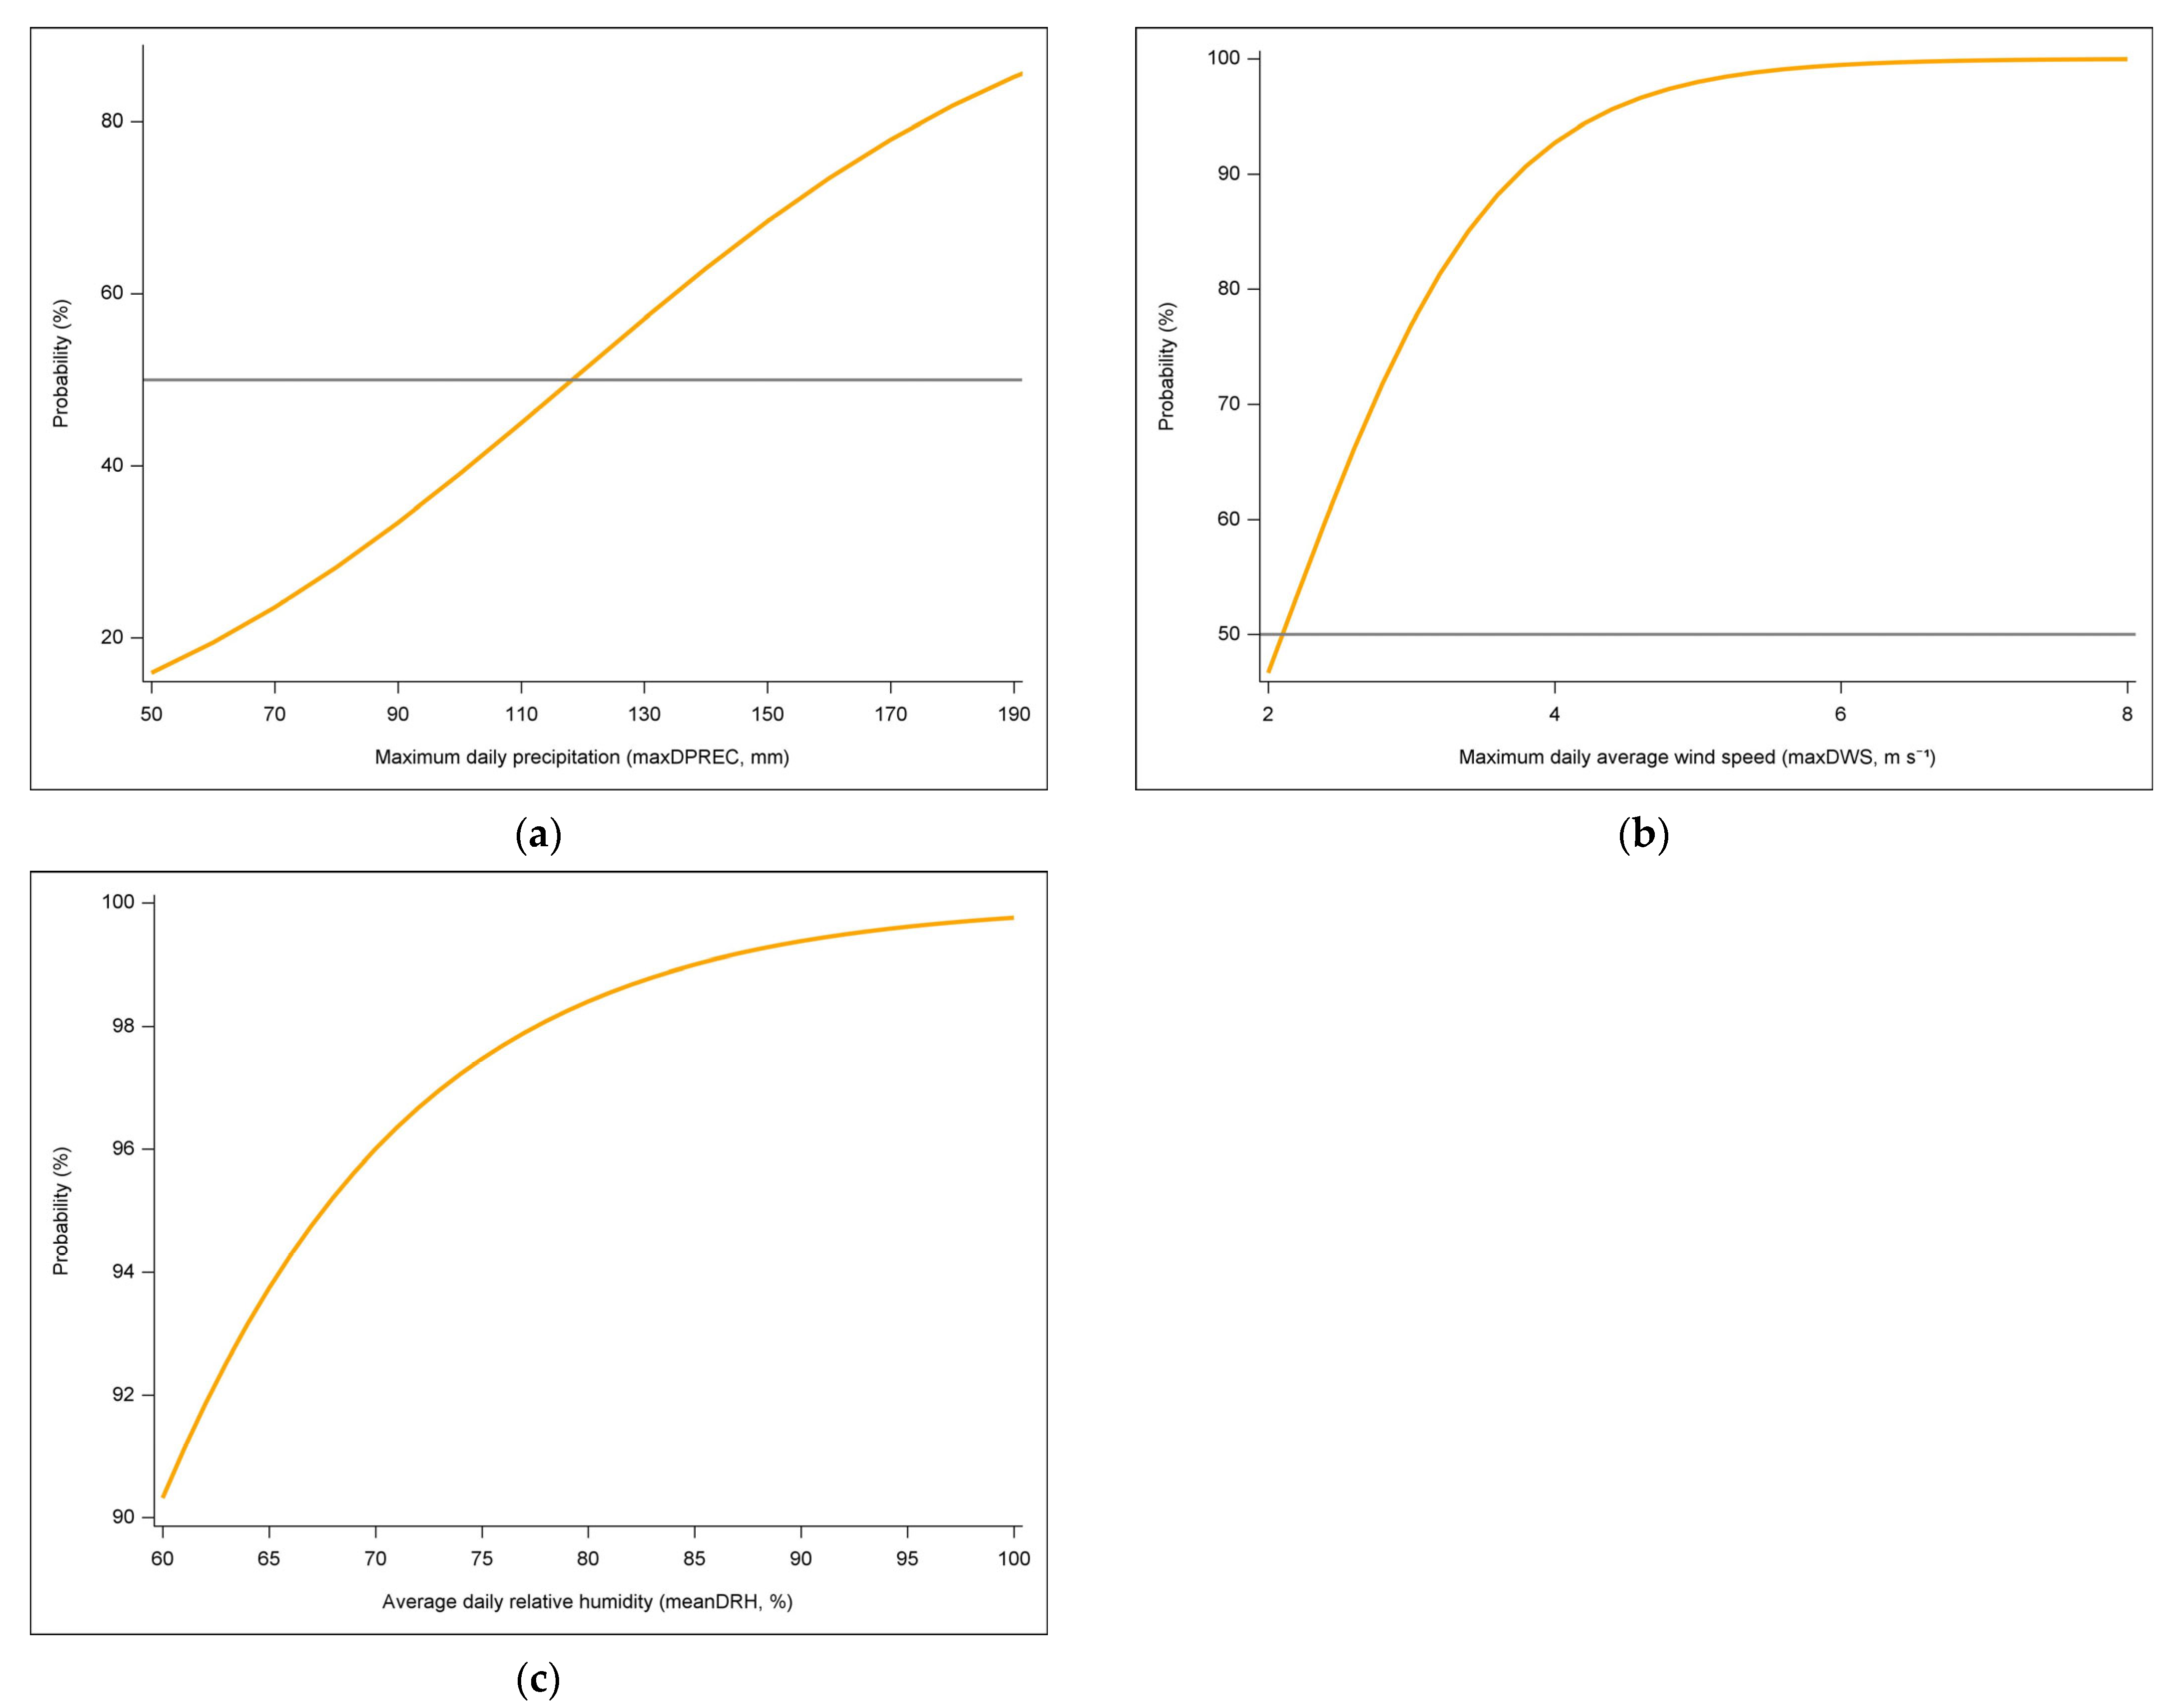
3.6. Simulation of the Effects of the Weather Characteristics on NTCHR and TCHR Damage Events

On the basis of the logistic regression results, a reduced model was produced to simulate the effects of the weather characteristics on NTCHR and TCHR damage events. Central Taiwan and the reproductive stage were associated with the highest NTCHR damage risk; therefore, central Taiwan and the reproductive stage were selected as the location of the NTCHR damage event and the growth stage, respectively, in the simulation. Similarly, the TCHR damage event simulation was conducted for the first crop season in central Taiwan. One weather characteristic was varied in each simulation, and the other weather characteristics were set to the corresponding mean value.
The probability of an NTCHR damage event occurring increased approximately linearly as maxDPREC, WD, and meanDRH increased (Figure 5). The occurrence probability of an NTCHR damage event exceeded 50% if maxDPREC was higher than 80 mm (Figure 5a) or WDS was higher than 7 (Figure 5b). Moreover, this probability exceeded 60% if meanDRH was approximately 85% (Figure 5c). Thus, the NTCHR damage event simulation results indicate that the critical values of maxDPREC, WDS, and meanDRH are likely 80 mm, 7 days, and 79%, respectively.
The occurrence probability of a TCHR damage event increased linearly as maxDPREC increased (Figure 6a) and exceeded 50% when maxDPREC was approximately 120 mm. If maxDWS was 4 m s–1 or meanDRH was 60%–100%, the occurrence probability of a TCHR event was higher than 90% (Figure 6b,c). The mean maxDPREC value of a TCHR damage event was 161.1 mm; thus, TCHR damage events were more likely to occur if the maxDWS and meanDRH were lower. If the mean values of the weather characteristics were used in the simulation, the occurrence probability of a TCHR damage event was approximately 75%. A steep increase in the occurrence probability of a TCHR event was observed when maxDWS increased from 2 to 4 m s–1, which indicated that each increase of 1 m s−1 in maxDWS had a relatively strong influence on the risk of a TCHR event. According to the simulation results, the maxDPREC value of 120 mm was a critical point for the occurrence of a TCHR damage event in the investigated scenarios.

4. Discussion

Studies have reported that rainfall has various effects on rice production [4,28,32,33,34]. The predicted rice yield declined by 5.71% and 15.26% if rainfall increased by 5% and 15%, respectively, in a study from Pakistan [32]. Another study from Pakistan reported that rainfall during the ripening stage has a negative effect on rice production [28]. The precipitation amount was correlated with the logarithm of the damaged area of rice due to flooding [33]. This result indicated that the rice damage will be increased by high precipitation. In India, extreme rainfall during the monsoon season was positively correlated with the rice productivity variation [34]. Therefore, the rice production will be more unstable under the environment of increasing extreme precipitation. In rain-fed rice cultivation, positive and negative correlations between rice yield and consecutive wet days were observed at different locations in Hainan island, China [4]. In the present study, the maxDPREC, rmeanDPREC, and WDS values of HR damage events were used to evaluate the effect of rainfall on rice. Increases in maxDPREC and rmeanDPREC were associated with the odds of paddy rice damage, which indicates that increasing precipitation is likely to reduce rice yield. This finding is consistent with those of previous studies [28,32,33]. Moreover, an increase in WDS increased the likelihood of an NTCHR damage event.
A study conducted using artificial wind demonstrated that rice culms begin to break at a wind speed of approximately 7 m s−1 [35]. The culm breaking due to the strong wind resulted in the lodging of the rice plant, which considerably reduced yield [36]. To avoid rice lodging due to typhoons, scientists from Japan began a breeding program to identify a lodging-resistant rice variety [37]. In the present study, maxDWS was demonstrated to have a significant effect on TCHR damage events. The wind speed was averaged over days and events; thus, the average maxDWS value obtained in this study (5.55 m s–1) was lower than 7 m s–1. Furthermore, typhoons are associated with strong wind and rain; thus, rice plants are also affected by rain during a typhoon.
Preharvest sprouting often occurs in high-temperature and humid weather at rice maturity [38]. The japonica varieties of rice cultivated in Japan, Korea, and California have been threatened by preharvest sprouting due to unexpected weather events, such as tropical storms [39]. Prolonged rain and high humidity cause seed germination before harvest, which results in substantial losses [40,41]. The present study revealed that meanDRH is a risk factor for NTCHR and TCHR damage events, which is consistent with the results of previous studies [42,43].
Rainfall negatively affects rice yield differently in different growth stages. In [44], the results obtained with a flood damage function revealed that flooding during the vegetative growth stage causes a rice yield loss of 40%. The weight of rainwater and the impact of raindrops can cause rice plant lodging, which reduces rice yield [35,45]. Because of its center of gravity, the rice crop is most vulnerable to lodging in the grain filling stage [46]. In [47], during the flowering of rice grains, a 100 mm h–1 rainfall treatment caused a 55.7%–182.3% increase in unfilled grains. In addition, 25.7% of the grain drop and 77.3% of the unfilled grain damage were caused by wind speeds of 9.7–11.1 m s–1 during flowering [47]. Rainfall causes preharvest sprouting, which affects rice during the ripening stage [40,41]. In the present study, the growth stage had a significant effect on HR damage events. This result was due to not only precipitation patterns in Taiwan but also the sensitivity of rice to HR damage in each growth stage. Because irrigation and drainage systems are widespread in Taiwanese paddies, flooding damage is rare in Taiwan. Therefore, the risk of an HR damage event was relatively low during the vegetative stage. The results for the rainy season and typhoons reveal that lodging is common in the first crop season in Taiwan [48]. Therefore, the first crop season had a higher risk of an HR damage event than did the second crop season.
As high-precipitation days increase in frequency, crop damage events are expected to increase commensurately. Increases in extreme precipitation have been observed globally in recent years. Many studies have calculated various extreme precipitation indices to evaluate extreme precipitation trends during a period [12,49]. In Malaysia, one study area exhibited an increase in the frequency of daily rainfall that exceeded the mean 95th and 99th percentiles during the study period [12]. In west Africa, the ratio of extreme rainfall events had high spatial and temporal variation during 2000–2010 and an increasing trend in extreme rainfall event ratios was observed from 2006 to 2010 [50]. The frequency of extreme rain events increased significantly in India [51]; however, the frequency of moderate rain events decreased in central India. Because of the spatial variation of precipitation behavior, significant trends in the extreme precipitation indices were observed at only a few weather stations in Nebraska, USA [49]. Annual heavy precipitation days had a significantly positive trend in high elevation climatic zones. This result was caused by the mountain’s natural season dynamic melting. In China, the frequency and proportion of extreme precipitation significantly increased by 2.0–4.7% and 2.3–2.9% per decade from 1961 to 2012, respectively [52]. Although these results indicate that the increasing trend in extreme precipitation is global, spatiotemporal variations also exist. Unsurprisingly, extreme rain is also becoming more common in Taiwan [29]. As in India, heavy precipitation has increased and light precipitation has decreased in Taiwan [53]. Therefore, we assumed that HR damage events for rice will become more common in Taiwan in the future. However, the frequency of extreme precipitation events varies between locations, seasons, and precipitation type in Taiwan [29,54]; thus, HR damage events did not increase in Taiwan overall during the study period of this research. Extreme precipitation caused by typhoons tended to increase during July–September. Although extreme precipitation increased because of an overall increase in typhoon frequency, typhoon frequency is variable on a decadal timescale. An increase in typhoons causing extreme precipitation during 2003–2009 corresponds to the increasing frequency of TCHR damage events during 2003–2008 in our study. Variations in typhoon frequency in the Western North Pacific are largely driven by the El Niño–Southern Oscillation [55,56,57]. Moreover, a significantly lower frequency of typhoons causing extreme precipitation than in normal years was observed during La Niña and its precursor years [54]. This result can explain the relatively few TCHR damage events over the years 2017 to 2021 in Taiwan. La Niña occurred during 2017–2018 and 2020–2022. The relatively high frequency of NTCHR damage events in northern and eastern Taiwan after 2017 might be related to the trend of increasing extreme rainfall during winter. An HR event must occur during the rice crop season; otherwise, HR does not damage the rice plant. Therefore, not all extreme rainfall events cause rice damage. However, moderate or light rainfall that continues for many days during a specific growth stage may cause rice damage. This situation might result in inconsistencies in the relationship between extreme rainfall and HR damage events.
The severity of crop damage caused by rainfall was expected to be amplified if precipitation intensity increased. In some studies, an increasing intensity of extreme rainfall was observed [12,49,58]. In Nebraska, USA, a predominantly positive trend for annual total precipitation from days exceeding the 95th and 99th percentiles of daily precipitation was detected [49]. Indices of the average intensity of rainfall events greater than or equal to the 95th and 99th percentiles also increased in Malaysia [12]. Increasing average precipitation intensity (simple daily intensity index) and annual total precipitation of rainfall days exceeding the 95th percentile were observed in a study of China [58]. The total precipitation of the wettest 5 days during monsoon season increased by 46.6 and 27.5 mm per decade in two agroecological zones in India [34]. The global mean number of record-breaking rainfall events has increased over last three decades [59]. In Taiwan, an increase in extreme precipitation intensity of 17.02 mm per day was detected after 2003; however, this increase varied among regions [60]. The intensity in central and southern Taiwan had greater increases (of 26.35 and 28.57 mm per day, respectively) compared with other regions in Taiwan. The extreme precipitation indices of maximum 1-day precipitation, maximum 5-day precipitation, and simple precipitation intensity index have increased significantly by 18.34 mm, 19.28 mm, and 0.52 mm day–1, respectively, in Taiwan over the past 30 years [61]. The 50-year trend of these indices varies among regions; the trend in the maximum 5-day precipitation quantity was significant in southern Taiwan. The maximum 1-day precipitation and simple precipitation intensity index of the mountain slope areas of central and southern Taiwan increased significantly. One study predicted that short-duration extreme precipitation will become more intense in northern, southern, and eastern Taiwan [62]. NTCHR intensity during spring in Taiwan has also increased significantly [29]. Moreover, the intensity of TCHR during the typhoon season has increased. However, the overall increase in extreme precipitation intensity varies between regions, times, and rainfall type. Therefore, no trend was observed in the frequency or severity of HR damage events in the study period of this research. However, some trends were observed for various types of HR damage events. Both levels of NTCHR damage events were more common during 2017–2021 than during previous periods. Although a study reported that TCHR intensity during the typhoon season has increased, the typhoon season (July to September) coincides with the vegetative growth stage of rice during the second crop season, when the rice plant is relatively insensitive to extreme rainfall. Consequently, no trend in either level of TCHR damage was observed during the study period. Moreover, any trends are difficult to observe in the short period of this study; previous studies investigating precipitation trends have tended to use 30-year durations. Therefore, we require additional information or different methods for further investigating the relationship between extreme precipitation and HR damage events in a future study.

5. Conclusions

Few studies have investigated the effects of changing rainfall due to climate change on rice production. Most relevant studies have used weather and crop yield data to evaluate the effect of weather factors on crop production. In the present study, weather damage data and weather station data were used to assess the risk of HR damage events for rice production in Taiwan. The identified risk factors were not only weather factors but also regional and temporal factors. Central and southern Taiwan, which are regions with clearly delineated wet and dry seasons, had a higher risk of NTCHR damage events than did the other regions in Taiwan. Moreover, the risk of NTCHR damage events is higher during the reproductive and ripening stages of rice growth than during the vegetative stage. The variables maxDPREC, rmeanDPREC, and meanDRH are the main weather risk factors associated with the occurrence and severity of HR damage events. The rice self-sufficiency ratio of Taiwan exceeded 100% in 2021; thus, HR damage could be reduced by reducing the rice cropping areas in high-risk regions or during high-risk periods. According to our results, the scale of rice cultivation in the first crop season can be reduced in high-risk locations, such as central and southern Taiwan. Moreover, the development of a lodging-resistant rice variety can reduce HR damage.

Author Contributions

Conceptualization, Y.-C.S.; methodology, Y.-C.S.; software, Y.-C.S.; validation, B.-J.K.; formal analysis, Y.-C.S.; investigation, Y.-C.S. and B.-J.K.; data curation, Y.-C.S.; writing—original draft preparation, Y.-C.S.; writing—review and editing, B.-J.K.; visualization, Y.-C.S.; supervision, B.-J.K.; funding acquisition, B.-J.K. All authors have read and agreed to the published version of the manuscript.

Funding

This research was supported (in part) by NSTC 111-2634-F-005-001-project Smart Sustainable New Agriculture Research Center (SMARTer).

Institutional Review Board Statement

Not applicable.

Informed Consent Statement

Not applicable.

Data Availability Statement

The original data used for this study was download from the website of Council of Agriculture, Executive Yuan, Taiwan, R.O.C. (accessed on 15 June 2022. https://agrstat.coa.gov.tw/sdweb/public/official/OfficialInformation.aspx) and Central Weather Bureau (accessed on 15 June 2022. https://e-service.cwb.gov.tw/; https://agr.cwb.gov.tw/).

Conflicts of Interest

The authors declare no conflict of interest.

References

  1. FAO. World Food and Agriculture—Statistical Yearbook 2021; FAO: Rome, Italy, 2021. [Google Scholar]
  2. Rosenzweig, C.; Tubiello, F.N.; Goldberg, R.; Mills, E.; Bloomfield, J. Increased crop damage in the US from excess precipitation under climate change. Glob. Environ. Chang. 2002, 12, 197–202. [Google Scholar] [CrossRef] [Green Version]
  3. Christina, M.; Jones, M.R.; Versini, A.; Mézino, M.; LeMézo, L.; Auzoux, S.; Soulié, J.C.; Poser, C.; Gérardeaux, E. Impact of climate variability and extreme rainfall events on sugarcane yield gap in a tropical Island. Field Crops Res. 2021, 274, 108326. [Google Scholar] [CrossRef]
  4. Li, M.F.; Luo, W.; Li, H.; Liu, E.; Li, Y. Daily extreme precipitation indices and their impacts on rice yield—A case study over the tropical island in China. Theor. Appl. Climatol. 2018, 132, 503–513. [Google Scholar] [CrossRef]
  5. Dore, M.H.I. Climate change and changes in global precipitation patterns: What do we know? Environ. Int. 2005, 31, 1167–1181. [Google Scholar] [CrossRef]
  6. Shah, A.N.; Tanveer, M.; Rehman, A.U.; Anjum, S.A.; Iqbal, J.; Ahmad, R. Lodging stress in cereal—Effects and management: An overview. Environ. Sci. Pollut. Res. 2017, 24, 5222–5237. [Google Scholar] [CrossRef]
  7. Baek, J.-S.; Chung, N.-J. Influence of rainfall during the ripening stage on pre-harvest sprouting, seed quality, and longevity of rice (Oryza sativa L.). Korean J. Crop Sci. 2014, 59, 406–412. [Google Scholar] [CrossRef]
  8. Talathi, M.S.; Patil, B.P.; Chavan, S.A.; Khadse, R.R.; Zagade, M.V. Rainfall characteristics, and crop planning with reference to rice in Konkan. J. Agrometeorol. 2008, 10, 101–103. [Google Scholar] [CrossRef]
  9. IPCC. Managing the Risks from Climate Extremes and Disasters to Advance Climate Change Adaptation: Special Report of the Intergovernmental Panel on Climate Change; Field, C.B., Barros, V., Stocker, T.F., Qin, D., Dokken, D.J., Ebi, K.L., Mastrandrea, M.D., Mach, K.J., Plattner, G.-K., Allen, S.K., et al., Eds.; Cambridge University Press: Cambridge, UK, 2012; Volume 9781107025, ISBN 9781139177245. [Google Scholar]
  10. Alexander, L.V.; Zhang, X.; Peterson, T.C.; Caesar, J.; Gleason, B.; Klein Tank, A.M.G.; Haylock, M.; Collins, D.; Trewin, B.; Rahimzadeh, F.; et al. Global observed changes in daily climate extremes of temperature and precipitation. J. Geophys. Res. Atmos. 2006, 111, D05109. [Google Scholar] [CrossRef] [Green Version]
  11. Rajeevan, M.; Bhate, J.; Jaswal, A.K. Analysis of variability and trends of extreme rainfall events over India using 104 years of gridded daily rainfall data. Geophys. Res. Lett. 2008, 35, L18707. [Google Scholar] [CrossRef]
  12. Wan Zin, W.Z.; Jamaludin, S.; Deni, S.M.; Jemain, A.A. Recent changes in extreme rainfall events in Peninsular Malaysia: 1971–2005. Theor. Appl. Climatol. 2010, 99, 303–314. [Google Scholar] [CrossRef]
  13. Naylor, R.L.; Battisti, D.S.; Vimont, D.J.; Falcon, W.P.; Burke, M.B. Assessing risks of climate variability and climate change for Indonesian rice agriculture. Proc. Natl. Acad. Sci. USA 2007, 104, 7752–7757. [Google Scholar] [CrossRef] [PubMed] [Green Version]
  14. Harkness, C.; Semenov, M.A.; Areal, F.; Senapati, N.; Trnka, M.; Balek, J.; Bishop, J. Adverse weather conditions for UK wheat production under climate change. Agric. For. Meteorol. 2020, 282–283, 107862. [Google Scholar] [CrossRef] [PubMed]
  15. Kogo, B.K.; Kumar, L.; Koech, R.; Langat, P. Modelling impacts of climate change on maize (Zea mays L.) growth and productivity: A review of models, outputs and limitations. J. Geosci. Environ. Prot. 2019, 7, 76–95. [Google Scholar] [CrossRef] [Green Version]
  16. Ahmad, S.; Abbas, G.; Fatima, Z.; Khan, R.J.; Anjum, M.A.; Ahmed, M.; Khan, M.A.; Porter, C.H.; Hoogenboom, G. Quantification of the impacts of climate warming and crop management on canola phenology in Punjab, Pakistan. J. Agron. Crop Sci. 2017, 203, 442–452. [Google Scholar] [CrossRef]
  17. Han, Z.; Zhang, B.; Hoogenboom, G.; Li, X.; He, C. Climate change impacts and adaptation strategies on rainfed and irrigated maize in the agro-pastoral ecotone of Northwestern China. Clim. Res. 2021, 83, 75–90. [Google Scholar] [CrossRef]
  18. Moriondo, M.; Giannakopoulos, C.; Bindi, M. Climate change impact assessment: The role of climate extremes in crop yield simulation. Clim. Chang. 2011, 104, 679–701. [Google Scholar] [CrossRef]
  19. Li, Y.; Guan, K.; Schnitkey, G.D.; DeLucia, E.; Peng, B. Excessive rainfall leads to maize yield loss of a comparable magnitude to extreme drought in the United States. Glob. Chang. Biol. 2019, 25, 2325–2337. [Google Scholar] [CrossRef] [Green Version]
  20. Wu, L.; Hu, F.; Pan, S. Characteristics of extreme rainfall in South China during the late rice growth period. Agron. J. 2020, 112, 5105–5114. [Google Scholar] [CrossRef]
  21. Yang, J.; Huo, Z.; Wu, L.; Wang, T.; Zhang, G. Indicator-based evaluation of spatiotemporal characteristics of rice flood in Southwest China. Agric. Ecosyst. Environ. 2016, 230, 221–230. [Google Scholar] [CrossRef]
  22. Bandumula, N. Rice production in Asia: Key to global food security. Proc. Natl. Acad. Sci. India Sect. B-Biol. Sci. 2018, 88, 1323–1328. [Google Scholar] [CrossRef]
  23. Welch, J.R.; Vincent, J.R.; Auffhammer, M.; Moya, P.F.; Dobermann, A.; Dawe, D. Rice yields in tropical/subtropical Asia exhibit large but opposing sensitivities to minimum and maximum temperatures. Proc. Natl. Acad. Sci. USA 2010, 107, 14562–14567. [Google Scholar] [CrossRef] [PubMed] [Green Version]
  24. Yang, J.; Huo, Z.; Li, X.; Wang, P.; Wu, D. Hot weather event-based characteristics of double-early rice heat risk: A study of Jiangxi province, South China. Ecol. Indic. 2020, 113, 106148. [Google Scholar] [CrossRef]
  25. Rötter, R.P.; Appiah, M.; Fichtler, E.; Kersebaum, K.C.; Trnka, M.; Hoffmann, M.P. Linking modelling and experimentation to better capture crop impacts of agroclimatic extremes—A review. Field Crops Res. 2018, 221, 142–156. [Google Scholar] [CrossRef]
  26. Anandan, A.; Kumar Pradhan, S.; Kumar Das, S.; Behera, L.; Sangeetha, G. Differential responses of rice genotypes and physiological mechanism under prolonged deepwater flooding. Field Crops Res. 2015, 172, 153–163. [Google Scholar] [CrossRef]
  27. Kato, Y.; Collard, B.C.Y.; Septiningsih, E.M.; Ismail, A.M. Physiological analyses of traits associated with tolerance of long-term partial submergence in rice. AoB Plants 2014, 6, plu058. [Google Scholar] [CrossRef]
  28. Abbas, S.; Mayo, Z.A. Impact of temperature and rainfall on rice production in Punjab, Pakistan. Environ. Dev. Sustain. 2021, 23, 1706–1728. [Google Scholar] [CrossRef]
  29. Henny, L.; Thorncroft, C.D.; Hsu, H.H.; Bosart, L.F. Extreme rainfall in Taiwan: Seasonal statistics and trends. J. Clim. 2021, 34, 4711–4731. [Google Scholar] [CrossRef]
  30. Kuo, B.-J.; Hong, M.-C.; Thseng, F.-S. The relationship between the amylographic characteristics and eating quality of japonica rice in Taiwan. Plant Prod. Sci. 2001, 4, 112–117. [Google Scholar] [CrossRef]
  31. Lai, L.W. The relationship between extreme weather events and crop losses in central Taiwan. Theor. Appl. Climatol. 2018, 134, 107–119. [Google Scholar] [CrossRef]
  32. Mahmood, N.; Ahmad, B.; Hassan, S.; Bakhsh, K. Impact of temperature and precipitation on rice productivity in rice-wheat cropping system of Punjab province. J. Anim. Plant Sci. 2012, 22, 993–997. [Google Scholar]
  33. Pratiwi, E.P.A.; Hartono, A.O.; Wijdan, H.Z.; Nurrochmad, F.; Setyawan, C. Precipitation and flood impact on rice paddies: Statistics in Central Java, Indonesia. IOP Conf. Ser. Earth Environ. Sci. 2020, 612, 012040. [Google Scholar] [CrossRef]
  34. Subash, N.; Singh, S.S.; Priya, N. Extreme rainfall indices and its impact on rice productivity-A case study over sub-humid climatic environment. Agric. Water Manag. 2011, 98, 1373–1387. [Google Scholar] [CrossRef]
  35. Hitaka, N. Studies on the lodging of rice plant. J. Agric. Meteorol. 1966, 22, 59–64. [Google Scholar] [CrossRef]
  36. Dulbari, D.; Santosa, E.; Sulistyono, E.; Koesmaryono, Y. Adaptation of wetland rice to extreme weather. J. Trop. Crop Sci. 2017, 4, 70–77. [Google Scholar] [CrossRef]
  37. Ishimaru, K.; Togawa, E.; Ookawa, T.; Kashiwagi, T.; Madoka, Y.; Hirotsu, N. New target for rice lodging resistance and its effect in a typhoon. Planta 2008, 227, 601–609. [Google Scholar] [CrossRef] [PubMed]
  38. Hori, K.; Sugimoto, K.; Nonoue, Y.; Ono, N.; Matsubara, K.; Yamanouchi, U.; Abe, A.; Takeuchi, Y.; Yano, M. Detection of quantitative trait loci controlling pre-harvest sprouting resistance by using backcrossed populations of japonica rice cultivars. Theor. Appl. Genet. 2010, 120, 1547–1557. [Google Scholar] [CrossRef] [PubMed] [Green Version]
  39. Lee, J.; Chebotarov, D.; Mcnally, K.L.; Pede, V.; Setiyono, T.D.; Raquid, R.; Hyun, W.; Jeung, J.; Kohli, A.; Mo, Y. Novel sources of pre-harvest sprouting resistance for japonica rice improvement. Plants 2021, 10, 1709. [Google Scholar] [CrossRef]
  40. Lee, H.S.; Choi, M.G.; Hwang, W.H.; Jeong, J.H.; Yang, S.Y.; Lee, C.G. Occurrence of rice preharvest sprouting varies greatly depending on past weather conditions during grain filling. Field Crops Res. 2021, 264, 108087. [Google Scholar] [CrossRef]
  41. Dong, Y.; Tsuzuki, E.; Kamiunten, H.; Terao, H.; Lin, D.; Matsuo, M.; Zheng, Y. Identification of quantitative trait loci associated with pre-harvest sprouting resistance in rice (Oryza sativa L.). Field Crops Res. 2003, 81, 133–139. [Google Scholar] [CrossRef]
  42. King, R.W. Manipulation of grain dormancy in wheat. J. Exp. Bot. 1993, 44, 1059–1066. [Google Scholar] [CrossRef]
  43. Liu, D.; Zeng, M.; Wu, Y.; Du, Y.; Liu, J.; Luo, S.; Zeng, Y. Comparative transcriptomic analysis provides insights into the molecular basis underlying pre-harvest sprouting in rice. BMC Genom. 2022, 23, 771. [Google Scholar] [CrossRef] [PubMed]
  44. Shrestha, B.B.; Kawasaki, A.; Zin, W.W. Development of flood damage functions for agricultural crops and their applicability in regions of Asia. J. Hydrol. Reg. Stud. 2021, 36, 100872. [Google Scholar] [CrossRef]
  45. Setter, T.L.; Laureles, E.V.; Mazaredo, A.M. Lodging reduces yield of rice by self-shading and reductions in canopy photosynthesis. Field Crops Res. 1997, 49, 95–106. [Google Scholar] [CrossRef]
  46. Berry, P.M.; Griffin, J.M.; Sylvester-Bradley, R.; Scott, R.K.; Spink, J.H.; Baker, C.J.; Clare, R.W. Controlling plant form through husbandry to minimise lodging in wheat. Field Crops Res. 2000, 67, 59–81. [Google Scholar] [CrossRef]
  47. Agusta, H.; Santosa, E.; Dulbari; Guntoro, D.; Zaman, S. Continuous heavy rainfall and wind velocity during flowering affect rice production. Agrivita 2022, 44, 290–302. [Google Scholar] [CrossRef]
  48. Wu, D.H.; Chen, C.T.; Yang, M.D.; Wu, Y.C.; Lin, C.Y.; Lai, M.H.; Yang, C.Y. Controlling the lodging risk of rice based on a plant height dynamic model. Bot. Stud. 2022, 63, 25. [Google Scholar] [CrossRef]
  49. dosSantos, C.A.C.; Neale, C.M.U.; Mekonnen, M.M.; Gonçalves, I.Z.; deOliveira, G.; Ruiz-Alvarez, O.; Safa, B.; Rowe, C.M. Trends of extreme air temperature and precipitation and their impact on corn and soybean yields in Nebraska, USA. Theor. Appl. Climatol. 2022, 147, 1379–1399. [Google Scholar] [CrossRef]
  50. Zahiri, E.P.; Bamba, I.; Famien, A.M.; Koffi, A.; Ochou, A. Mesoscale extreme rainfall events in West Africa: The cases of Niamey (Niger) and the Upper Ouémé Valley (Benin). Weather Clim. Extrem. 2016, 13, 15–34. [Google Scholar] [CrossRef] [Green Version]
  51. Goswami, B.N.; Venugopal, V.; Sengupta, D.; Madhusoodanan, M.S.; Xavier, P.K. Increasing trend of extreme rain events over India in a warming environment. Science 2006, 314, 1442–1445. [Google Scholar] [CrossRef] [Green Version]
  52. Jian, Y.; Fu, J.; Li, B.; Zhou, F. Increased extreme hourly precipitation over China’s rice paddies from 1961 to 2012. Sci. Rep. 2020, 10, 10609. [Google Scholar] [CrossRef]
  53. Shiu, C.J.; Liu, S.C.; Chen, J.P. Diurnally asymmetric trends of temperature, humidity, and precipitation in Taiwan. J. Clim. 2009, 22, 5635–5649. [Google Scholar] [CrossRef] [Green Version]
  54. Wu, Y.; Wang, S.S.; Yu, Y.; Kung, C.; Wang, A.; Los, S.A.; Huang, W. Climatology and change of extreme precipitation events in Taiwan based on weather types. Int. J. Climatol. 2019, 39, 5351–5366. [Google Scholar] [CrossRef] [Green Version]
  55. Chen, T.C.; Wang, S.Y.; Yen, M.C. Interannual variation of the tropical cyclone activity over the western North Pacific. J. Clim. 2006, 19, 5709–5720. [Google Scholar] [CrossRef]
  56. Jiang, H.; Zipser, E.J. Contribution of tropical cyclones to the global precipitation from eight seasons of TRMM Data: Regional, seasonal, and interannual variations. J. Clim. 2010, 23, 1526–1543. [Google Scholar] [CrossRef]
  57. Du, Y.; Yang, L.; Xie, S.P. Tropical Indian Ocean influence on Northwest Pacific tropical cyclones in summer following strong El Niño. J. Clim. 2011, 24, 315–322. [Google Scholar] [CrossRef]
  58. Tian, J.; Liu, J.; Wang, J.; Li, C.; Nie, H.; Yu, F. Trend analysis of temperature and precipitation extremes in major grain producing area of China. Int. J. Climatol. 2017, 37, 672–687. [Google Scholar] [CrossRef]
  59. Lehmann, J.; Coumou, D.; Frieler, K. Increased record-breaking precipitation events under global warming. Clim. Chang. 2015, 132, 517–518. [Google Scholar] [CrossRef] [Green Version]
  60. Tung, Y.S.; Chen, C.T.; Min, S.K.; Lin, L.Y. Evaluating extreme rainfall changes over Taiwan using a standardized index. Terr. Atmos. Ocean. Sci. 2016, 27, 705–715. [Google Scholar] [CrossRef] [Green Version]
  61. Tung, Y.S.; Wang, C.Y.; Weng, S.P.; Yang, C.D. Extreme index trends of daily gridded rainfall dataset (1960–2017) in Taiwan. Terr. Atmos. Ocean. Sci. 2022, 33, 8. [Google Scholar] [CrossRef]
  62. Chen, P.Y.; Tung, C.P.; Tsao, J.H.; Chen, C.J. Assessing future rainfall intensity–duration–frequency characteristics across Taiwan using the k-nearest neighbor method. Water 2021, 13, 1521. [Google Scholar] [CrossRef]
Figure 1. Four geographical regions of Taiwan island.
Agriculture 13 00630 g001
Figure 2. The 19-year average of (a) daily precipitation, (b) monthly wet days, and (c) yearly precipitation for various geographical areas of Taiwan.
Agriculture 13 00630 g002
Figure 3. Frequencies of heavy rain (HR), nontyphoon-caused HR (NTCHR), and typhoon-caused HR (TCHR) damage events during 2003–2021 for (a) all of Taiwan, (b) central Taiwan, (c) eastern Taiwan, (d) northern Taiwan, and (e) southern Taiwan.
Agriculture 13 00630 g003
Figure 4. Event occurrence by severity during 2003–2021 for (a) HR, (b) NTCHR, and (c) TCHR damage events.
Agriculture 13 00630 g004
Figure 5. Effects of (a) maximum daily precipitation (maxDPREC), (b) number of wet days (WDS), (c) and mean daily average relative humidity (meanDRH) on the occurrence probability of an NTCHR event. The gray line indicates 50% probability.
Agriculture 13 00630 g005
Figure 6. Effects of (a) maxDPREC, (b) maximum average daily wind speed, and (c) meanDRH on the occurrence probability of an TCHR damage event. The gray line indicates a probability of 50%.
Agriculture 13 00630 g006
Table 1. List of weather event characteristics.
Weather CharacteristicsIDDescriptionUnit
Total precipitationtPRECTotal precipitation during the event period.Mm
Maximum daily precipitationmaxDPRECMaximum daily precipitation during the event period.Mm day−1
Average daily precipitationmeanDPRECAverage daily precipitation on wet days during the event.Mm day−1
Residual average daily precipitationrmeanDPRECAverage daily precipitation on wet days excluding the day of maximum daily precipitation during the event period.Mm day−1
Wet daysWDSNumber of days with a precipitation level of ≥0.1 mm during the event period.Days
Maximum daily average wind speedmaxDWSMaximum daily average wind speed during the event period.M s−1 day−1
Mean daily average relative humiditymeanDRHMean daily average relative humidity during the event period.% day−1
Table 2. Damage event frequencies grouped by crop season, growth stage, and geographical location.
Categorical VariablesControl
(N = 5315)
NTCHR
(N = 143)
TCHR
(N = 274)
p Value
n%n%n%
Crop season <0.001
1st218341.0712083.928430.66
2nd313258.932316.0819069.34
Growth stage <0.001
Vegetative stage193736.44128.3912043.8
Reproductive stage117322.072920.285921.53
Ripening stage220541.4910271.339534.67
Geographical location <0.001
Central136625.75739.867125.91
Eastern113121.28139.095821.17
Northern85015.9964.25218.98
Southern196837.036746.859333.94
N: total number of events; n: number of events in each group.
Table 3. Means and standard deviations (SD) of the weather characteristics and damage percentage for the different types of events.
Numeric VariablesControlNTCHRTCHRp Value
MeanSDMeanSDMeanSD
tPREC34.161.75355237.2256.2181.6<0.001
maxDPREC17.9427.57124.867.15161.1106<0.001
meanDPREC7.0310.3538.2934.6368.4948.15<0.001
rmeanDPREC3.366.3523.7119.4131.6729.12<0.001
WDS4.364.614.199.753.861.48<0.001
maxDWS2.230.972.881.055.552.5<0.001
meanDRH79.535.7485.766.0585.245.57<0.001
Damage percent0017.9411.4422.213.33<0.001
Yield loss001109.593904.632326.635958.980.004
: p value of the Wilcoxon test between the NTCHR and TCHR damage events.
Table 4. Odds ratios (ORs) and corresponding 95% confidence intervals (CIs) of the temporal, spatial, and weather characteristics associated with the HR, NTCHR, and TCHR damage events.
VariablesOdds Ratios (95% CIs)
HR EventsNTCHRTCHR
Crop season
1st1 (Reference)1 (Reference)1 (Reference)
2nd0.52 (0.32–0.87) *0.91 (0.37–2.28)0.34 (0.12–0.95) *
Growth stage
Vegetative stage1 (Reference)1 (Reference)1 (Reference)
Reproductive stage2.12 (1.21–3.69) **4.33 (1.14–16.5) *1.63 (0.77–3.45)
Ripening stage2.1 (1.16–3.82) *4.17 (1.23–14.17) *1.88 (0.64–5.57)
Geographical location
Northern1 (Reference)1 (Reference)1 (Reference)
Central1.25 (0.75–2.08)4.37 (1.47–12.95) **0.69 (0.33–1.44)
Eastern0.9 (0.5–1.61)1.09 (0.29–4.09)0.91 (0.43–1.92)
Southern0.71 (0.43–1.17)3.99 (1.34–11.85) *0.39 (0.18–0.82) *
maxDPREC1.02 (1.02–1.03) ***1.02 (1.01–1.02) ***1.03 (1.02–1.03) ***
rmeanDPREC1.04 (1.02–1.05) ***1.07 (1.04–1.1) ***1.03 (1.01–1.05) **
WDS1.03 (1.01–1.06) **1.1 (1.07–1.14) ***0.86 (0.72–1.03)
maxDWS2.4 (2.13–2.71) ***1 (0.79–1.28)3.67 (3.06–4.41) ***
meanDRH1.1 (1.07–1.13) ***1.09 (1.04–1.15) ***1.1 (1.06–1.15) ***
* p < 0.05; ** p < 0.01; *** p < 0.001 for the chi-square test of parameters in the logistic regression model.
Table 5. ORs and corresponding 95% CIs of the temporal, spatial, and weather characteristics associated with the severity of the HR, NTCHR, and TCHR damage events.
VariablesOdds Ratios (95% CIs)
HR EventsNTCHRTCHR
1 vs. 02 vs. 01 vs. 02 vs. 01 vs. 02 vs. 0
Crop season
1st1 (Reference)1 (Reference)1 (Reference)1 (Reference)1 (Reference)1 (Reference)
2nd0.42 (0.23–0.76) **0.73 (0.37–1.43)1.04 (0.36–3.03)0.71 (0.17–2.97)0.31 (0.1–0.98) *0.4 (0.11–1.38)
Growth stage
Vegetative stage1 (Reference)1 (Reference)1 (Reference)1 (Reference)1 (Reference)1 (Reference)
Reproductive stage1.76 (0.94–3.27)2.73 (1.38–5.39) **9.8 (1.93–49.75) **0.86 (0.12–6.29)1.19 (0.52–2.73)2.37 (1.02–5.52) *
Ripening stage1.75 (0.89–3.43)2.76 (1.28–5.94) **8.41 (1.89–37.53) **1.08 (0.18–6.51)1.69 (0.51–5.67)2.21 (0.6–8.15)
Geographical location
Northern1 (Reference)1 (Reference)1 (Reference)1 (Reference)1 (Reference)1 (Reference)
Central1.72 (0.95–3.09)0.74 (0.38–1.41)20 (2.5–160.23) **0.78 (0.2–3.06)0.79 (0.36–1.78)0.57 (0.24–1.34)
Eastern1.04 (0.53–2.06)0.74 (0.36–1.51)2.08 (0.2–21.96)1.06 (0.21–5.34)1.05 (0.46–2.44)0.75 (0.31–1.8)
Southern0.98 (0.55–1.76)0.44 (0.24–0.82) **17.59 (2.18–141.66) **0.94 (0.25–3.51)0.49 (0.21–1.12)0.28 (0.12–0.66) **
maxDPREC1.02 (1.02–1.03) ***1.02 (1.02–1.03) ***1.01 (1.01–1.02) ***1.02 (1.01–1.03) ***1.03 (1.02–1.03) ***1.03 (1.02–1.03) ***
rmeanDPREC1.03 (1.02–1.05) ***1.04 (1.03–1.06) ***1.07 (1.04–1.1) ***1.07 (1.04–1.11) ***1.02 (1–1.04) *1.03 (1.01–1.05) ***
WDS1.04 (1.01–1.06) **1.03 (1–1.06)1.12 (1.08–1.16) ***1.08 (1.02–1.13) **0.88 (0.73–1.07)0.84 (0.68–1.03)
maxDWS2.28 (2.01–2.59) ***2.61 (2.28–3) ***0.9 (0.68–1.19)1.28 (0.9–1.83)3.53 (2.92–4.27) ***3.88 (3.19–4.71) ***
meanDRH1.11 (1.07–1.14) ***1.09 (1.05–1.13) ***1.09 (1.03–1.15) **1.1 (1.01–1.2) *1.11 (1.06–1.17) ***1.09 (1.04–1.15) ***
* p < 0.05; ** p < 0.01; *** p < 0.001 in the chi-square test on parameters in the logistic regression model.
Disclaimer/Publisher’s Note: The statements, opinions and data contained in all publications are solely those of the individual author(s) and contributor(s) and not of MDPI and/or the editor(s). MDPI and/or the editor(s) disclaim responsibility for any injury to people or property resulting from any ideas, methods, instructions or products referred to in the content.

