
Effect of FASN, SCD, and GH Genes on Carcass Fatness and Fatty Acid Composition of Intramuscular Lipids in F1 Holstein × Beef Breeds


Abstract
1. Introduction
2. Materials and Methods
2.1. Description of the Biological Sample
2.2. Extraction of Total Lipids in Muscle and Analysis of Fatty Acid
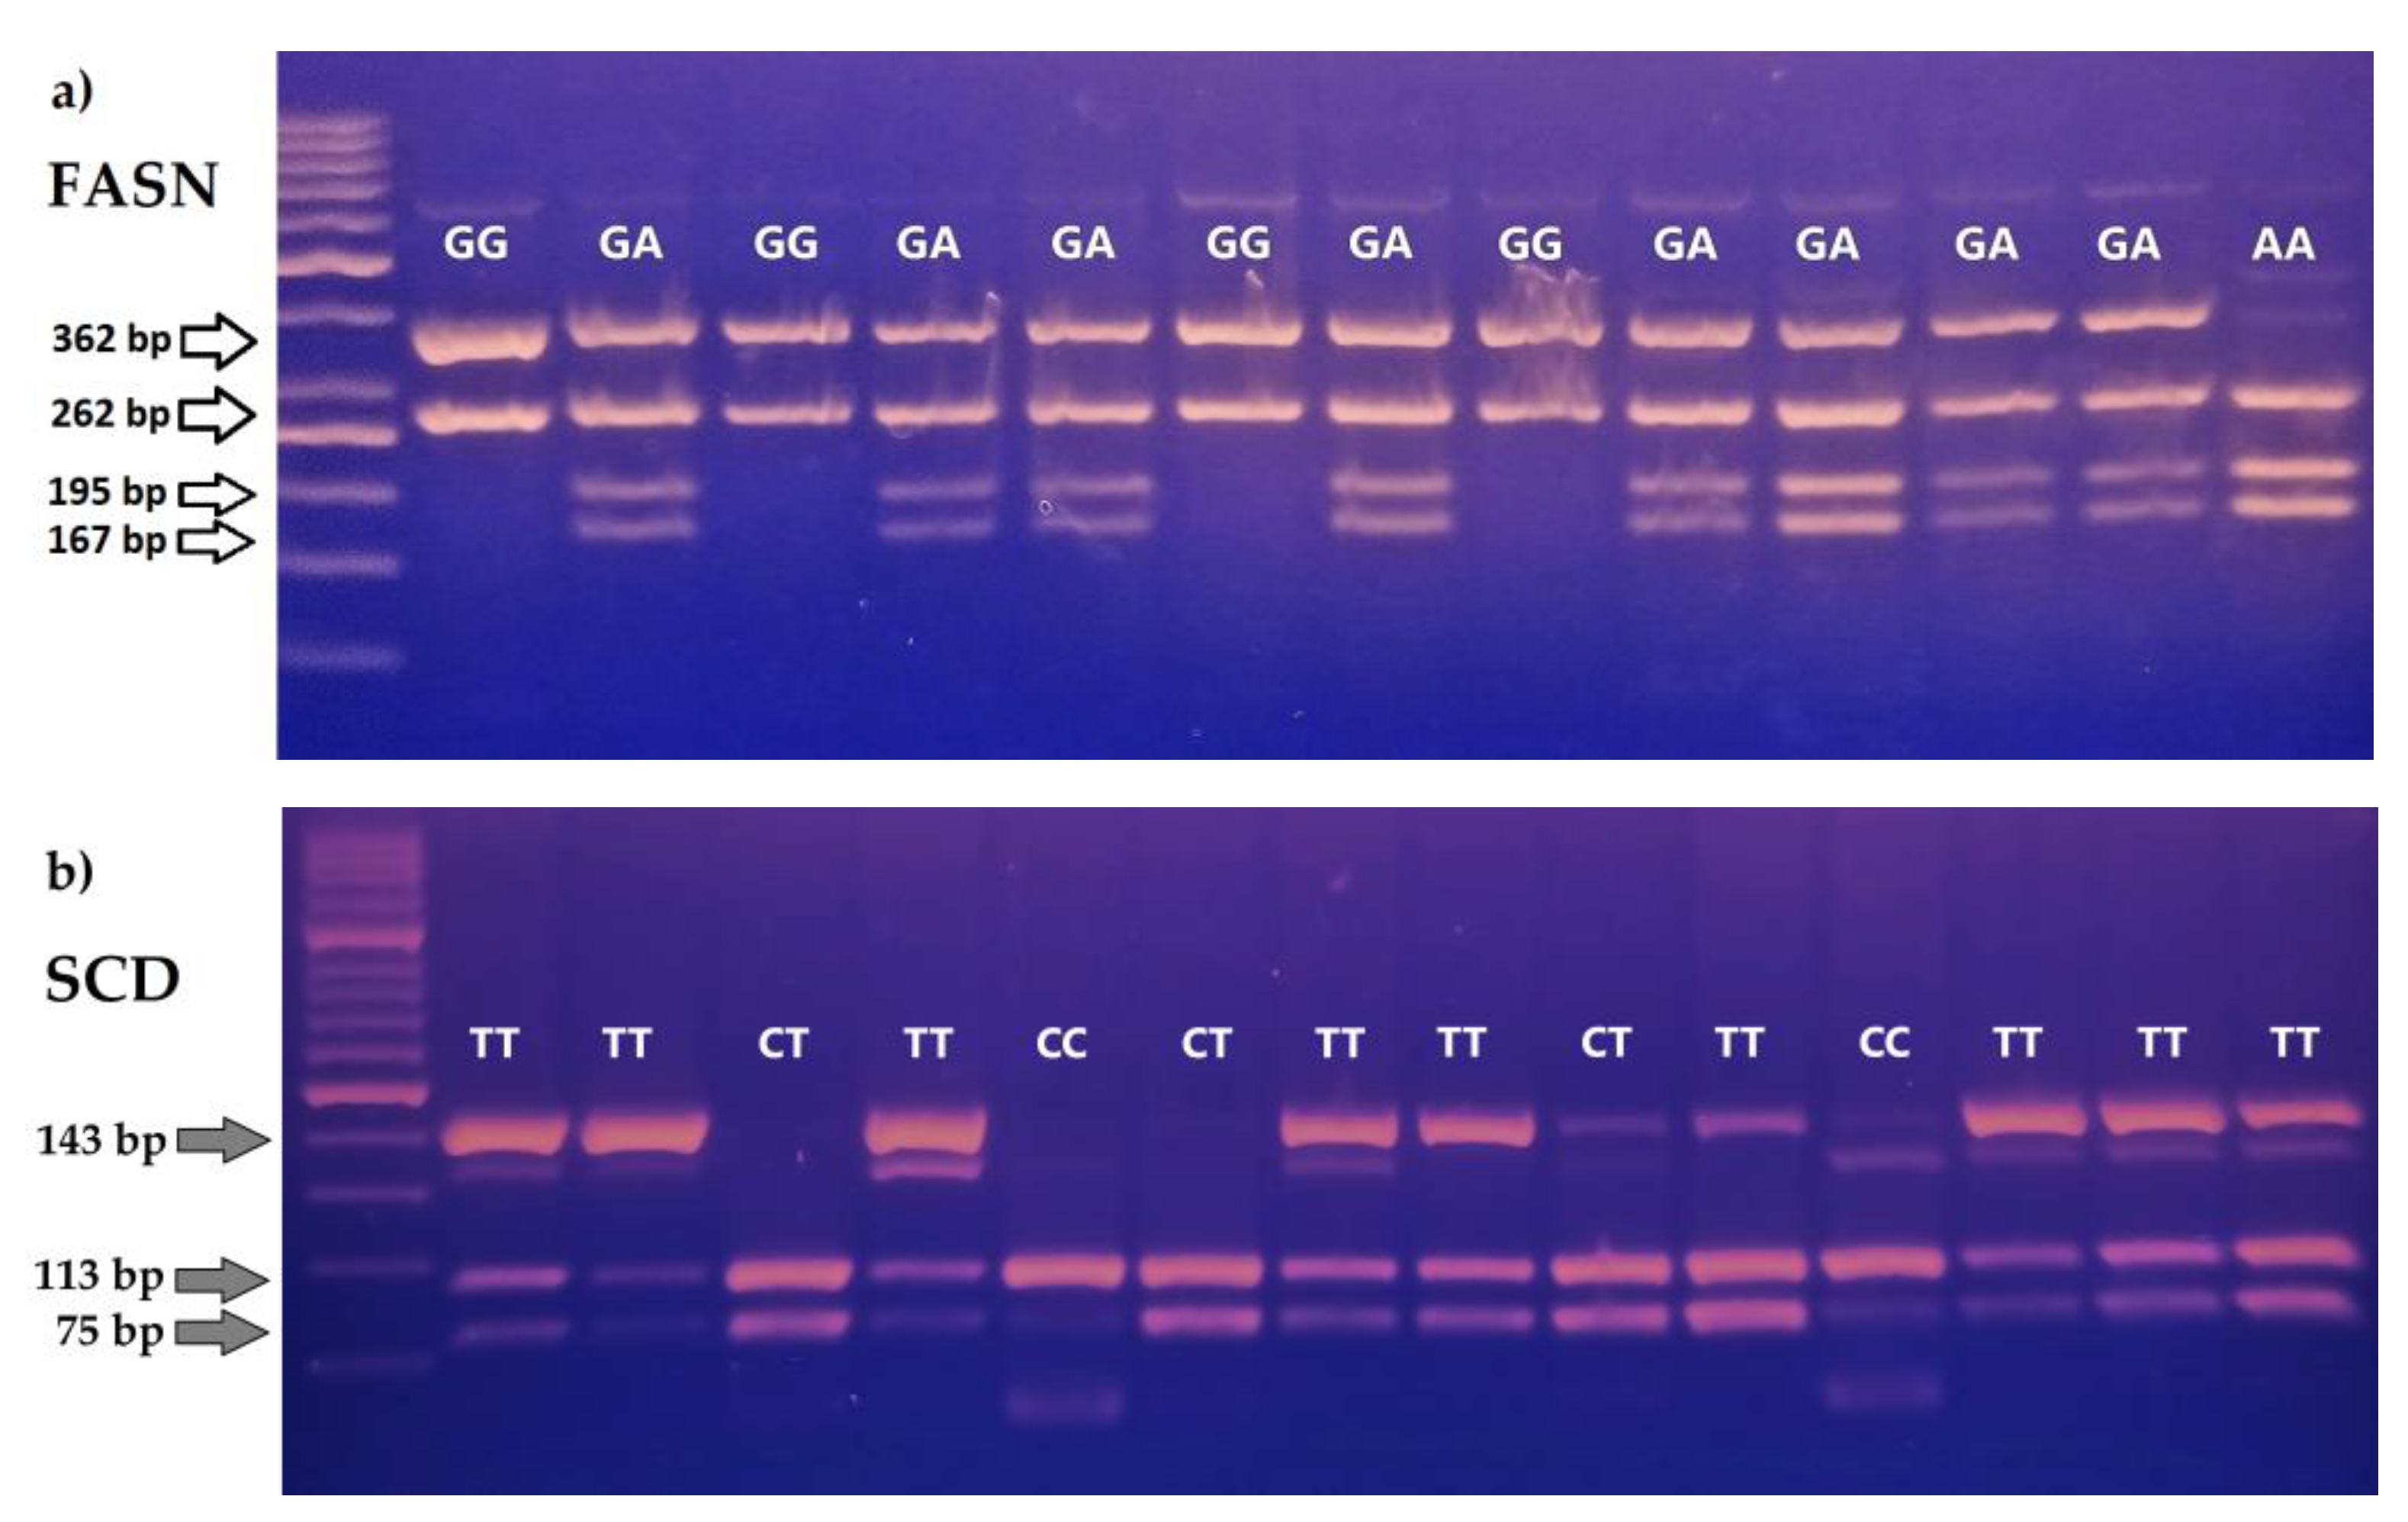
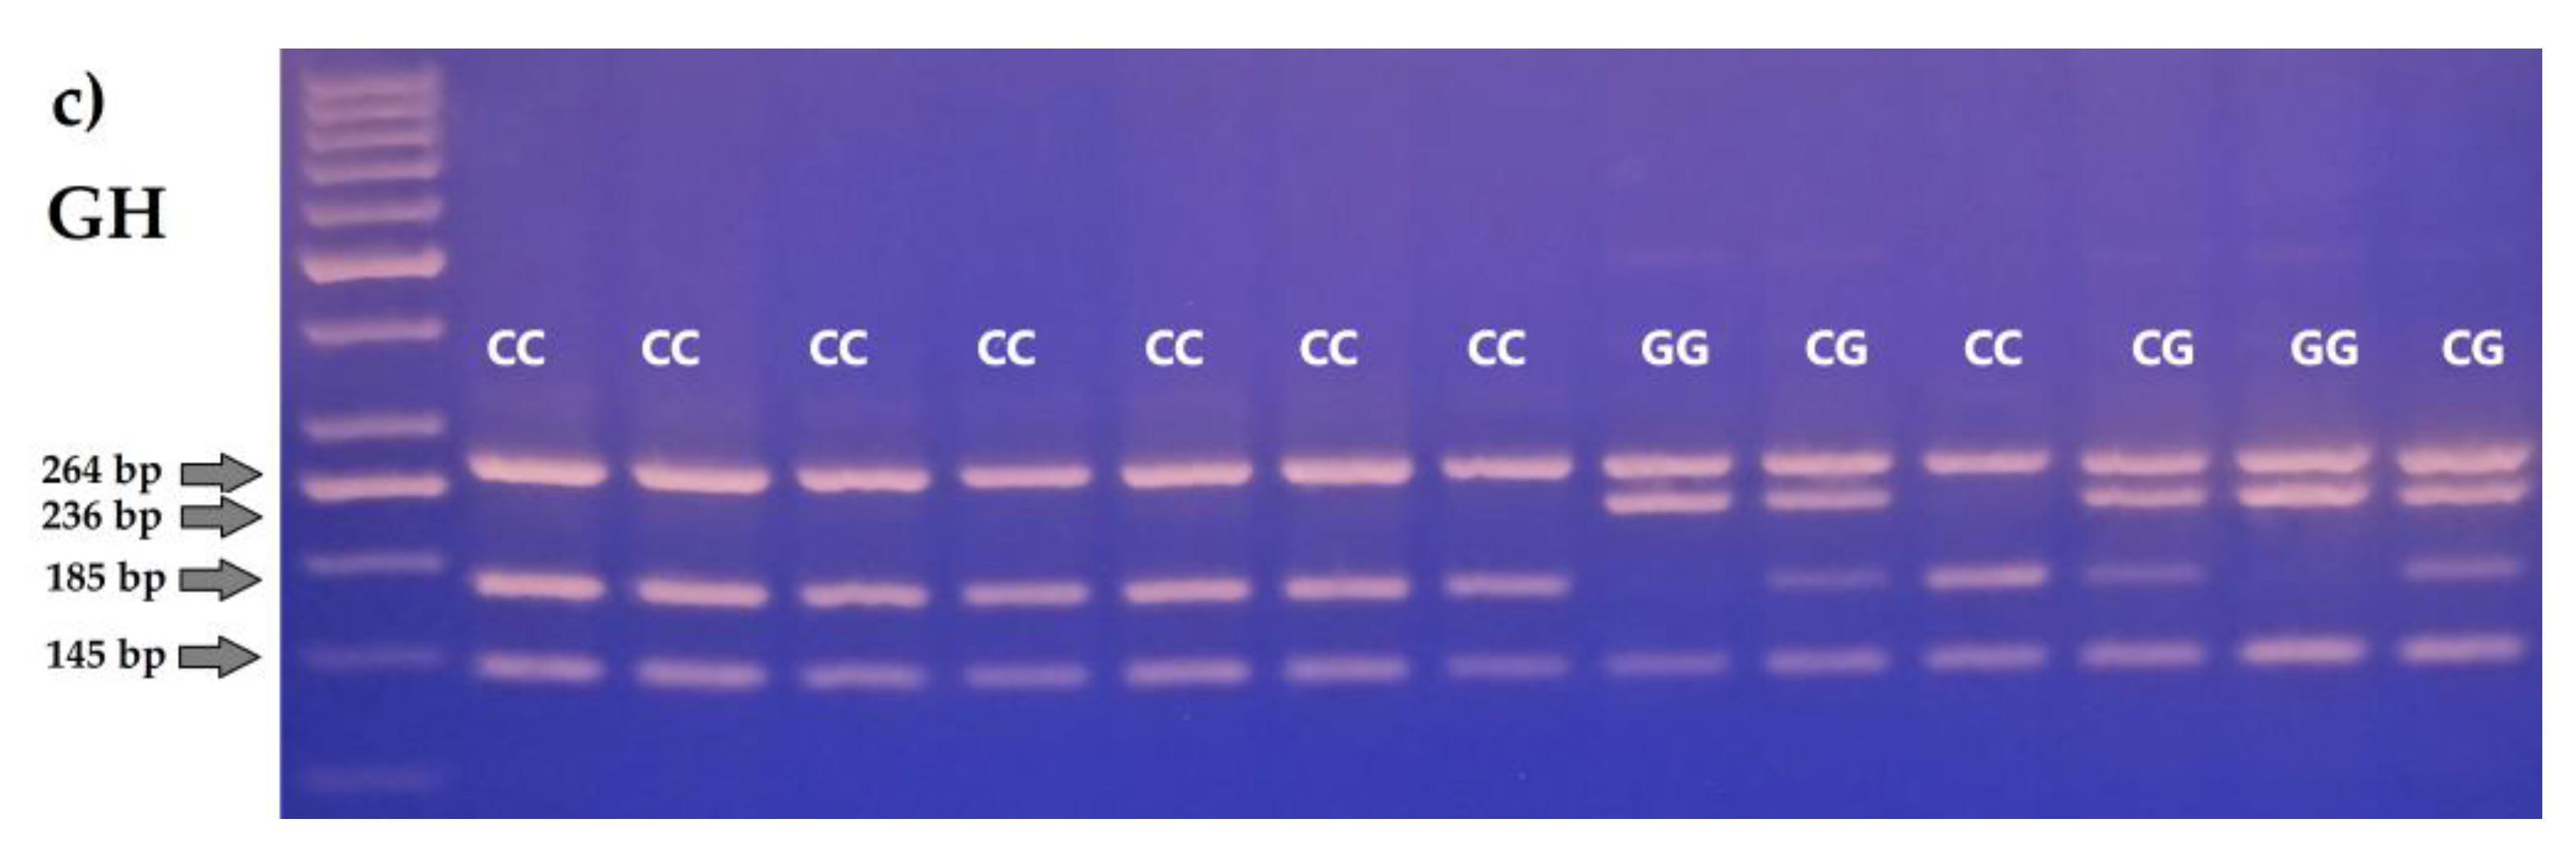
2.3. Analysis of the FASN, SCD i GH Polymophisms
2.4. Statistical Analysis
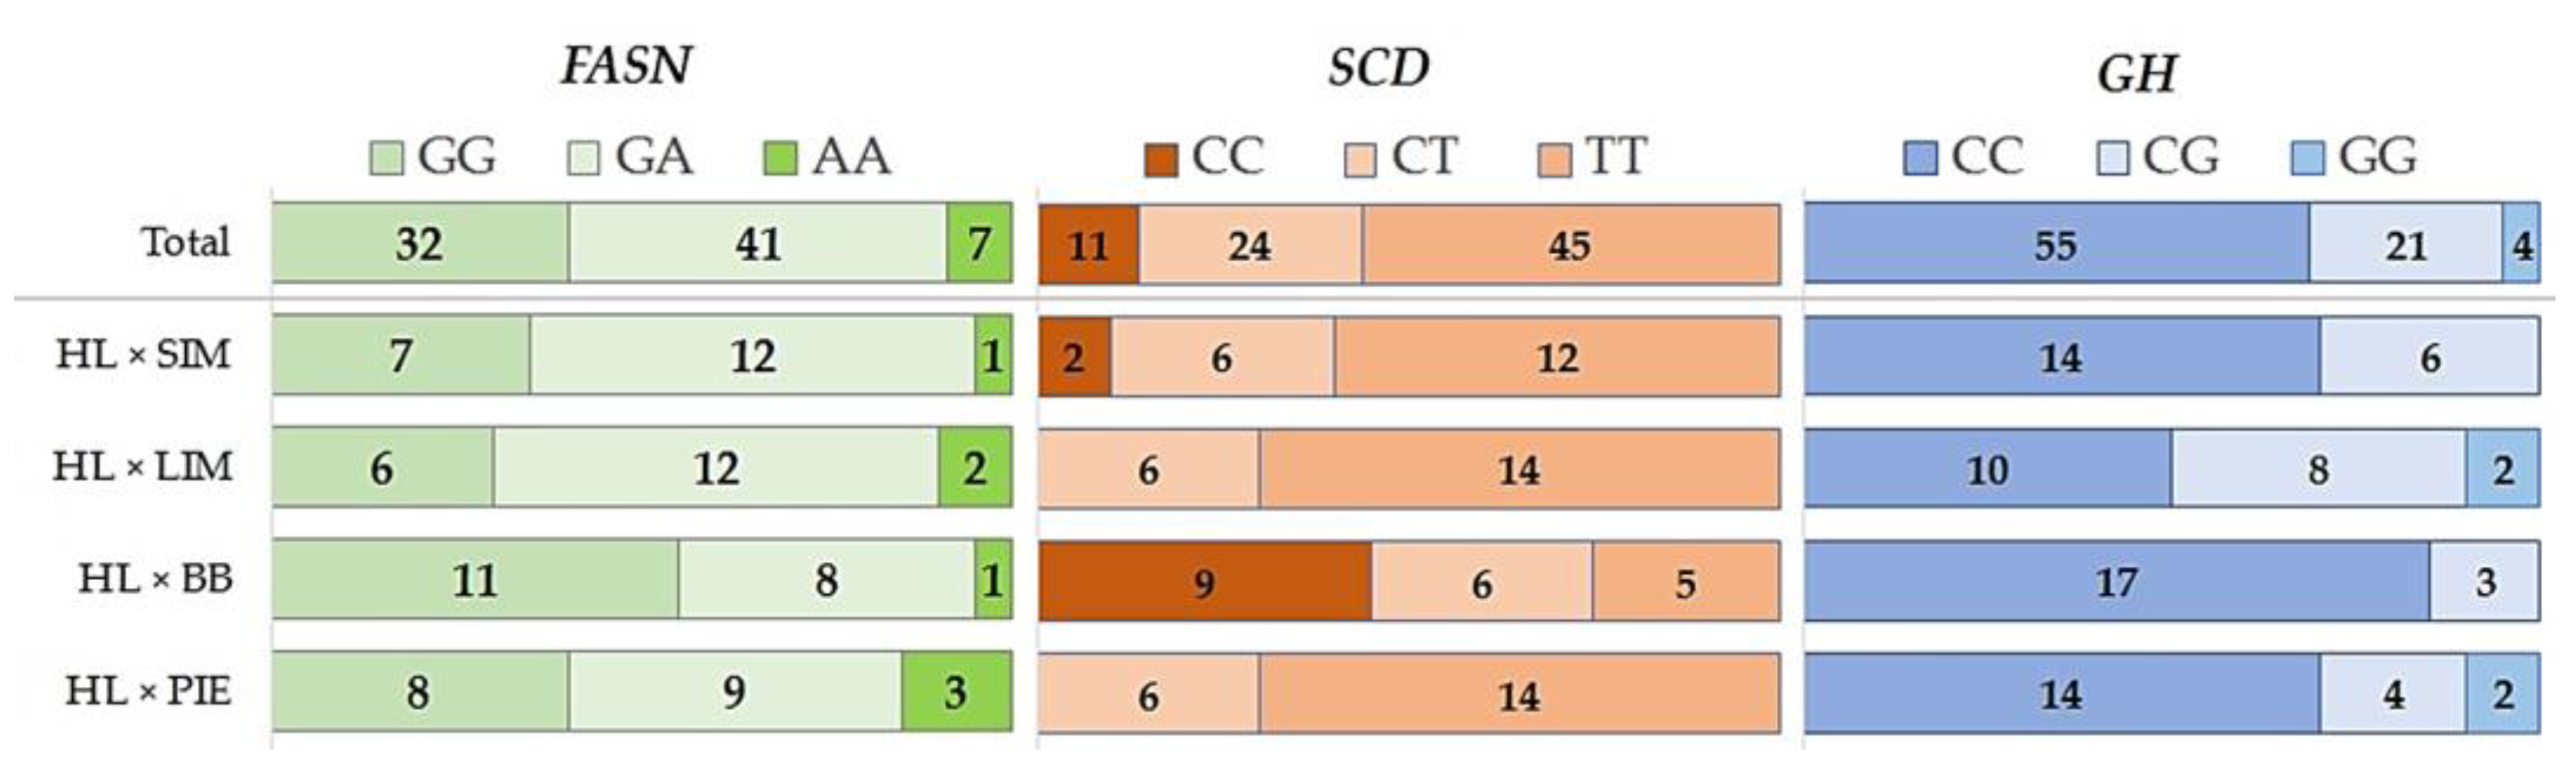
3. Results
4. Discussion
5. Conclusions
Author Contributions
Funding
Institutional Review Board Statement
Informed Consent Statement
Data Availability Statement
Conflicts of Interest
References
- FAO. World Food and Agriculture—Statistical Yearbook 2021. Rome. Available online: https://www.fao.org/home/en (accessed on 5 December 2022).
- OECD. Meat Consumption (Indicator). Available online: https://www.oecd.org/ (accessed on 5 December 2022).
- Wood, J.D.; Enser, M.; Richardson, R.I.; Whittington, F.M. Fatty Acids in Meat and Meat Products. In Fatty Acids in Foods and Their Health Implications, 3rd ed.; Chow, C.K., Ed.; Taylor & Francis Group, LLC: Boca Raton, NY, USA, 2007; pp. 87–107. [Google Scholar]
- Lee, S.H.; Park, E.W.; Cho, Y.M. Identification of differentially expressed genes related to intramuscular fat development in the early and late fattening stages of Hanwoo steers. J. Biochem. Mol. Biol. 2007, 40, 757–764. [Google Scholar] [CrossRef]
- Kris-Eiherton, P.M.; Fleming, J.A. Emerging nutrition science on fatty acids and cardiovascular disease: Nutritionists’ perspectives. Adv. Nutr. 2015, 6, 326–337. [Google Scholar] [CrossRef]
- Katan, M.B.; Zoock, P.M.; Mensink, R.P. Effects of fats and fatty acids on blood lipids in humans: An overview. Am. J. Clin. Nutr. 1994, 60, 1017–1022. [Google Scholar] [CrossRef] [PubMed]
- Pensel, N. The future of red meat in human diets. Prof. Anim. Sci. 1998, 14, 133–140. [Google Scholar] [CrossRef]
- Ip, C.; Scimeca, J.A.; Thompson, H. Effect of timing and duration of dietary conjugated linoleic acid on mammary cancer prevention. Nutr. Cancer. 1995, 24, 241–247. [Google Scholar] [CrossRef]
- Alcicek, A.; Önenc, A.; Güngör, M. Carcass and meat quality of Friesian, Piemontese x Friesian and Limousin x Friesian young bulls under intensive beef production system in Turkey. J. Anim. Feed Sci. 2003, 12, 249–260. [Google Scholar] [CrossRef]
- Keane, M.G.; Drennan, M.J. A comparison of Friesian, Aberdeen Angus x and Belgian Blue x Friesian steers finished at pasture or indoors. Livest. Sci. 2008, 115, 268–278. [Google Scholar] [CrossRef]
- Keane, M.G. Beef Cross Breeding of Dairy and Beef Cows. Occasional Series 8, Grange Beef Research Centre, 2011. Available online: https://core.ac.uk/download/pdf/84886318.pdf (accessed on 10 February 2023).
- Nogalski, Z.; Wronski, M.; Wielgosz-Groth, Z.; Purwin, C.; Sobczuk-Szul, M.; Mochol, M.; Pogorzelska, P. The effect of carcass conformation class (EUROP system) on the slaughter quality of young, crossbred beef bulls and Holstein-Friesians. Ann. Anim. Sci. 2013, 13, 121–131. [Google Scholar] [CrossRef]
- Fusaro, I.; Cavallini, D.; Giammarco, M.; Manetta, A.C.; Martuscelli, M.; Mammi, L.M.E.; Lanzoni, L.; Formigoni, A.; Vignola, G. Oxidative status of Marchigiana beef enriched in n-3 fatty acids and vitamin E, treated with a blend of Oregano and Rosemary essential oils. Front. Vet. Sci. 2021, 8, 662079. [Google Scholar] [CrossRef]
- Scollan, N.D.; Dhanoa, M.S.; Choi, N.J.; Maeng, W.J.; Enser, M.; Wood, J.D. Biohydrogenation and digestion of long chain fatty acids in steers fed on different sources of lipid. J. Agric. Sci. 2001, 136, 345–355. [Google Scholar] [CrossRef]
- Fusaro, I.; Cavallini, D.; Giammarco, M.; Serio, A.; Mammi, L.M.E.; De Matos Vettori, J.; Lanzoni, L.; Formigoni, A.; Vignola, G. Effect of diet and essential oils on the fatty acid composition, oxidative stability and microbiological profile of Marchigiana burgers. Antioxidants 2022, 11, 827. [Google Scholar] [CrossRef]
- Pećina, M.; Ivanković, A. Candidate genes and fatty acids in beef meat, a review. Ital. J. Anim. Sci. 2021, 20, 1716–1729. [Google Scholar] [CrossRef]
- Roy, R.; Zaragoza, P.; Rodellar, C.; Gautier, M.; Eggen, A. Radiation hybrid and genetic linkage mapping of two genes related to fat metabolism in cattle: Fatty acid synthase (FASN) and glycerol-3-phosphate acyltranserase mitochondrial (GPAM). Anim. Biotechnol. 2005, 16, 1–9. [Google Scholar] [CrossRef] [PubMed]
- Zhang, S.; Knight, T.J.; Reecy, J.M.; Beitz, D.C. DNA polymorphisms in bovine fatty acid synthase are associated with beef fatty acid composition. Anim. Genet. 2008, 39, 62–70. [Google Scholar] [CrossRef]
- Morris, C.A.; Cullen, N.G.; Glass, B.C.; Hyndman, D.L.; Manley, T.R.; Hickey, S.M.; McEwan, J.C.; Pitchford, W.S.; Bottema, C.D.K.; Lee, M.A.H. Fatty acid synthase effects on bovine adipose fat and milk fat. Mamm. Genome 2007, 18, 64–74. [Google Scholar] [CrossRef]
- Abe, T.; Saburi, J.; Hasebe, H.; Nakagawa, T.; Misumi, S.; Nade, T.; Nakajima, H.; Shoji, N.; Kobayashi, M.; Kobayashi, E. Novel mutations of FASN gene and their effect on fatty acid composition in Japanese black beef. Biochem. Genet. 2009, 47, 397–411. [Google Scholar] [CrossRef]
- Matsuhashi, T.; Maruyama, S.; Uemoto, Y.; Kobayashi, N.; Mannen, H.; Abe, T.; Sakaguchi, S.; Kobayashi, E. Effects of FASN, SCD, SREBP1 and GH gene polymorphisms on fatty acid composition and carcass traits in Japanese Black cattle. J. Anim. Sci. 2011, 89, 12–22. [Google Scholar] [CrossRef] [PubMed]
- Li, C.; Aldai, N.; Vinsky, M.; Dugan, M.E.R.; McAllister, T.A. Association analyses of single nucleotide polymorphisms in bovine stearoyl.CoA desaturase and fatty acid synthase genes with fatty acid composition in commercial cross breed beef steers. Anim. Genet. 2012, 43, 93–97. [Google Scholar] [CrossRef]
- Jeong, J.; Kwon, E.G.; Im, S.K.; Seo, K.S.; Baik, M. Expression of fat deposition and fat removal genes is associated with intermuscular fat content in longissimus dorsi muscle of Korean cattle steers. J. Anim. Sci. 2012, 90, 2044–2053. [Google Scholar] [CrossRef]
- Kaplanová, K.; Dufek, A.; Dračková, E.; Simeonovová, J.; Šubert, J.; Vrtková, I.; Dvořák, J. The association of CAPN1, CAST, SCD, and FASN polymorphism with beef quality traits in commercial crossbreed cattle in the Czech Republic. Czech J. Anim. Sci. 2013, 58, 489–496. [Google Scholar] [CrossRef]
- Bartoň, L.; Bureš, D.; Kott, T.; Řehák, D. Associations of polymorphisms in bovine DGAT1, FABP4, FASN, and PPARGC1A genes with intramuscular fat content and the fatty acid composition of muscle and subcutaneous fat in Fleckvieh bulls. Meat Sci. 2016, 114, 18–23. [Google Scholar] [CrossRef]
- Taniguchi, M.; Utsugi, T.; Oyama, K.; Mannen, H.; Kobayashi, M.; Tanabe, Y.; Ogino, A.; Tsuji, S. Genotype of stearoyl-CoA desaturase is associated with fatty acid composition in Japanese Black cattle. Mamm. Genome 2004, 15, 142–148. [Google Scholar] [CrossRef] [PubMed]
- Mannen, H. Identification, and utilization of genes associated with beef qualities. Anim. Sci. J. 2011, 82, 1–7. [Google Scholar] [CrossRef] [PubMed]
- Ntambi, J.M. Stearoyl-CoA Desaturase Genes in Lipid Metabolism, 3rd ed.; Springer: New York, NY, USA, 2013. [Google Scholar]
- Wang, Z.; Zhu, B.; Niu, H.; Zhang, W.; Xu, L.; Xu, L.; Chen, Y.; Zhang, L.; Gao, X.; Gao, H.; et al. Genome wide association study identifies SNPs associated with fatty acid composition in Chinese Wagyu cattle. J. Anim. Sci. Biotechnol. 2019, 10, 27. [Google Scholar] [CrossRef] [PubMed]
- Kay, J.K.; Mackle, T.R.; Auldist, M.J.; Thomson, N.A.; Bauman, D.E. Endogenous synthesis of cis-9, trans-11 conjugated linoleic acid in dairy cows fed fresh pasture. J. Dairy Sci. 2004, 87, 369–378. [Google Scholar] [CrossRef] [PubMed]
- Hoashi, S.; Hinenoya, T.; Tanaka, A.; Ohsaki, H.; Sasazaki, S.; Taniguchi, M.; Oyama, K.; Mukai, F.; Mannen, H. Association between fatty acid compositions and genotypes of FABP4 and LXR-alpha in Japanese Black cattle. BMC Genet. 2008, 9, 3–9. [Google Scholar] [CrossRef]
- Oprzadek, J.; Flisikowski, K.; Zwierzchowski, L.; Juszczuk-Kubiak, E.; Rosochacki, S.; Dymnicki, E. Associations between polymorphism of some candidate genes and growth rates, feed intake and uzilisation, slaughter indicators and meat quality in cattle. Arch. Tierz. 2005, 48, 81–87. [Google Scholar]
- Chikuni, K.; Nagatsuma, T.; Tabata, T.; Monma, M.; Saito, M.; Ozawa, S.; Ozutsumi, K. Genetic variants of the growth hormone gene in Japanese cattle. Anim. Sci. Technol. 1994, 65, 340–346. [Google Scholar] [CrossRef]
- Chikuni, K.R.; Tanabe, S.; Muroya, Y.; Fukumoto, S.; Ozawa, S. A simple method for genotyping the bovine growth hormone gene. Anim. Genet. 1997, 28, 230–232. [Google Scholar] [CrossRef]
- Ardiyanti, A.; Oki, Y.; Suda, Y.; Suzuki, K.; Chikuni, K.; Obara, Y.; Katoh, K. Effects of GH gene polymorphism and sex on carcass traits and fatty acid compositions in Japanese Black cattle. Anim. Sci. J. 2009, 80, 62–69. [Google Scholar] [CrossRef]
- Maharani, D.; Jung, Y.; Jung, W.Y.; Jo, C.; Ryoo, S.H.; Lee, S.H.; Yeon, S.H.; Lee, J.H. Association of five candidate genes with fatty acid composition in Korean cattle. Mol. Bio. Rep. 2012, 39, 6113–6121. [Google Scholar] [CrossRef]
- Folch, J.; Lees, M.; Sloane Stanley, G.H. A simple method for the isolation and purification of total lipids from animal tissues. J. Biol. Chem. 1957, 226, 497–509. [Google Scholar] [CrossRef]
- Yeon, S.H.; Lee, S.H.; Choi, B.H.; Lee, H.J.; Jang, G.W.; Lee, K.T.; Kim, K.H.; Lee, J.H.; Chung, H.Y. Genetic variation of FASN is associated with fatty acid composition of Hanwoo. Meat Sci. 2013, 94, 133–138. [Google Scholar] [CrossRef]
- Oh, D.; Lee, Y.; La, B.; Yeo, J.; Chung, E.; Kim, Y.; Lee, C. Fatty acid composition of beef is associated with exonic nucleotide variants of the gene encoding FASN. Mol. Biol. Rep. 2012, 39, 4083–4090. [Google Scholar] [CrossRef]
- Papaleo Mazzucco, J.; Goszczynski, D.E.; Ripoli, M.V.; Melucci, L.M.; Pardo, A.M.; Colatto, E.; Rogberg-Muñoz, A.; Mezzadra, C.A.; Depetris, G.J.; Giovambattista, G.; et al. Growth, carcass, and meat quality traits in beef from Angus, Hereford and crossbreed grazing steers, and their association with SNPs in genes related to fat deposition metabolism. Meat Sci. 2016, 114, 121–129. [Google Scholar] [CrossRef]
- Cancino-Baier, D.; Muñoz, E.; Quiñones, J.; Beltrán, J.; Fuentes, F.; Farías, J.; Lorenzo, J.; Diaz, R.; Inostroza, K.; Ferraz, J.; et al. Non-Synonymous Single Nucleotide Polymorphism in FASN Gene Alters FASN Enzyme Activity in Subcutaneous and Intramuscular Adipose Tissue in Holstein Friesian Steers. Ann. Anim. Sci. 2021, 21, 109–124. [Google Scholar] [CrossRef]
- Kaneda, M.; Lin, B.Z.; Sasazaki, S.; Oyama, K.; Mannen, H. Allele frequencies of gene polymorphisms related to economic traits in Bos taurus and Bos indicus cattle breeds. Anim. Sci. J. 2011, 82, 717–721. [Google Scholar] [CrossRef] [PubMed]
- Bhuiyan, M.S.A.; Yu, S.L.; Jeon, J.T.; Yoon, D.; Cho, Y.M.; Park, E.W.; Kim, E.W.; Kim, K.S.; Lee, J.H. DNA polymorphisms in SREBF1 and FASN genes affect fatty acid composition in Korean cattle (Hanwoo). Asian-Australas. J. Anim. Sci. 2009, 22, 765–773. [Google Scholar] [CrossRef]
- Narukami, T.; Sasazaki, S.; Oyama, K.; Nogi, T.; Taniguchi, M.; Mannen, H. Effect of DNA polymorphisms related to fatty acid composition in adipose tissue of Holstein cattle. Anim. Sci. J. 2011, 82, 406–411. [Google Scholar] [CrossRef]
- Uemoto, Y.; Abe, T.; Tameoka, N.; Hasebe, H.; Inoue, K.; Nakajima, H.; Shoji, N.; Kobayashi, M.; Kobayashi, E. Whole-genome association study for fatty acid composition of oleic acid in Japanese Black cattle. Anim. Genet. 2011, 42, 141–148. [Google Scholar] [CrossRef] [PubMed]
- Schennink, A.; Bovenhuis, H.; Leon-Kloosterziel, K.M.; Van Arendonk, J.A.; Visker, M.H. Effect of polymorphisms in the FASN, OLR1, PPARGC1A, PRL and STAT5A genes on bovine milk-fat composition. Anim. Genet. 2009, 40, 909–916. [Google Scholar] [CrossRef] [PubMed]
- Ohsaki, H.; Tanaka, A.; Hoashi, S.; Sasazaki, S.; Oyama, K.; Taniguchi, M.; Mukai, F.; Mannen, H. Effect of SCD and SREBP genotypes genotypes on fatty acid composition in adipose tissue of Japanese Black cattle herds. Anim. Sci. J. 2009, 80, 225–232. [Google Scholar] [CrossRef] [PubMed]
- Baeza, M.C.; Corva, P.M.; Soria, L.A.; Pavan, E.; Rincon, G.; Medrano, J.F. Genetic variants in a lipid regulatory pathway as potential tools for improving the nutritional quality of grass-fed beef. Anim. Genet. 2013, 44, 121–129. [Google Scholar] [CrossRef] [PubMed]
- Bartoň, L.; Bureš, D.; Kott, T.; Řehák, D. Effect of sex and age on bovine muscle and adipose fatty acid composition and stearoyl-CoA desaturase mRNA expression. Meat Sci. 2011, 89, 444–450. [Google Scholar] [CrossRef]
- Karolyi, D.; Dikić, M.; Salajpal, K.; Jurić, I. Fatty acid composition of muscle and adipose tissue of beef cattle. Ital. J. Anim. Sci. 2009, 8, 264–266. [Google Scholar] [CrossRef]


| Crossbreeds | FASN | SCD | GH | |||
|---|---|---|---|---|---|---|
| G/A | Ho/He | C/T | Ho/He | C/G | Ho/He | |
| HL × SIM | 0.65/0.35 | 0.60/0.46 | 0.25/0.75 | 0.30/0.37 | 0.85/0.15 | 0.30/0.25 |
| HL × LIM | 0.60/0.40 | 0.60/0.48 | 0.15/0.85 | 0.30/0.26 | 0.70/0.30 | 0.40/0.42 |
| HL × BB | 0.75/0.25 | 0.40/0.38 | 0.60/0.40 | 0.30/0.48 | 0.93/0.07 | 0.15/0.14 |
| HL × PIE | 0.63/0.38 | 0.45/0.47 | 0.15/0.85 | 0.30/0.26 | 0.80/0.20 | 0.20/0.32 |
| Total | 0.66/0.34 | 0.51/0.45 | 0.28/0.72 | 0.30/0.41 | 0.82/0.18 | 0.26.0.30 |
| Characteristic | Crossbreeds | p Value | Sex | p Value | ||||
|---|---|---|---|---|---|---|---|---|
| HL × SIM | HL × BB | HL × PIE | HL × LIM | Bulls | Heifers | |||
| Slaughter weight, kg | 572.1 ± 9.16 a | 530.6 ± 8.81 b | 517.8 ± 8.77 b,c | 500.2 ± 8.94 c | <0.001 | 569.8 ± 7.75 | 478.1 ± 11.15 | <0.001 |
| Carcass weight, kg | 324.2 ± 4.55 a | 306.4 ± 4.59 a,c | 310.6 ± 4.57 b,c | 291.7 ± 4.79 d | 0.001 | 343.2 ± 4.38 | 273.3 ± 6.30 | <0.001 |
| EUROP conform a | 3.33 ± 0.11 a | 3.74 ± 0.11 b | 3.72 ± 0.11 b | 3.55 ± 0.12 a,b | 0.045 | 3.85 ± 0.11 | 3.44 ± 0.15 | 0.089 |
| EUROP fat grade b | 3.09 ± 0.10 a | 2.76 ± 0.11 a,c | 2.54 ± 0.11 b | 2.79 ± 0.11 b,c | 0.013 | 2.53 ± 0.08 | 3.25 ± 0.12 | <0.001 |
| Subcut. fat tissue c | 2.57 ± 0.27 | 2.78 ± 0.28 | 2.89 ± 0.28 | 2.69 ± 0.29 | 0.901 | 2.47 ± 0.19 | 3.34 ± 0.28 | 0.043 |
| Fat + conn. tissue d | 18.25 ± 0.59 a | 16.23 ± 0.59 b | 11.81 ± 0.59 c | 18.37 ± 0.62 a | <0.001 | 11.61 ± 0.51 | 21.23 ± 0.73 | <0.001 |
| Fat in MLD e | 3.09 ± 0.22 a | 2.52 ± 0.22 a,b | 2.03 ± 0.23 b | 2.62 ± 0.23 a,b | 0.089 | 1.74 ± 0.20 | 3.17 ± 0.29 | 0.002 |
| C14:0 | 2.57 ± 0.12 a | 2.69 ± 0.12 a | 2.13 ± 0.12 b | 2.87 ± 0.13 a | 0.002 | 2.27 ± 0.11 | 2.83 ± 0.13 | 0.011 |
| C16:0 | 23.99 ± 0.37 a | 24.61 ± 0.37 a | 21.65 ± 0.37 b | 24.14 ± 0.39 a | <0.001 | 22.03 ± 0.35 | 25.09 ± 0.39 | <0.001 |
| C16:1 | 3.86 ± 0.14 a | 3.88 ± 0.14 a,c | 3.52 ± 0.14 a | 4.28 ± 0.15 b,c | 0.023 | 3.43 ± 0.12 | 4.28 ± 0.13 | <0.001 |
| C18:0 | 13.58 ± 0.41 | 13.41 ± 0.42 | 13.43 ± 0.41 | 12.48 ± 0.43 | 0.368 | 14.71 ± 0.39 | 11.72 ± 0.43 | <0.001 |
| C18:1 | 40.16 ± 0.68 a | 37.91 ± 0.68 a | 35.24 ± 0.68 b | 39.00 ± 0.71 a | 0.003 | 34.74 ± 0.65 | 41.31 ± 0.72 | <0.001 |
| C18:2 n-6 | 6.27 ± 0.62 a | 6.85 ± 0.62 a | 11.39 ± 0.62 b | 6.80 ± 0.65 a | <0.001 | 10.85 ± 0.59 | 4.98 ± 0.65 | <0.001 |
| C18:2 c9.t11 | 0.24 ± 0.01 | 0.23 ± 0.01 | 0.22 ± 0.01 | 0.23 ± 0.02 | 0.835 | 0.23 ± 0.01 | 0.23 ± 0.02 | 0.967 |
| C20:4 n-6 | 2.07 ± 0.25 a | 2.57 ± 0.25 a | 3.87 ± 0.25 b | 2.38 ± 0.26 a | 0.001 | 3.37 ± 0.24 | 2.17 ± 0.26 | 0.008 |
| C22:4 n-6 | 0.39 ± 0.04 a | 0.49 ± 0.04 a,c | 0.58 ± 0.04 b,c | 0.40 ± 0.04 a | 0.017 | 0.51 ± 0.04 | 0.43 ± 0.04 | 0.210 |
| C22:5 n-3 | 0.17 ± 0.02 a | 0.23 ± 0.02 a | 0.33 ± 0.02 b | 0.21 ± 0.02 a | 0.002 | 0.29 ± 0.02 | 0.20 ± 0.02 | 0.024 |
| SFA | 44.12 ± 0.60 a | 45.30 ± 0.63 a | 41.98 ± 0.59 b | 43.75 ± 0.63 a | 0.017 | 43.88 ± 0.55 | 43.48 ± 0.61 | 0.692 |
| MUFA | 45.71 ± 0.76 a | 43.23 ± 0.81 a | 40.18 ± 0.76 b | 45.22 ± 0.79 a | 0.003 | 39.56 ± 0.75 | 47.52 ± 0.83 | <0.001 |
| PUFA | 10.17 ± 0.98 a | 11.47 ± 1.04 a | 17.84 ± 0.97 b | 11.03 ± 1.02 a | <0.001 | 16.51 ± 0.93 | 8.95 ± 1.03 | <0.001 |
| n-3 PUFA | 0.52 ± 0.05 a | 0.61 ± 0.05 a | 0.85 ± 0.05 b | 0.57 ± 0.05 a | 0.001 | 0.75 ± 0.04 | 0.52 ± 0.05 | 0.006 |
| n-6 PUFA | 9.39 ± 0.86 a | 10.62 ± 0.99 a | 16.75 ± 0.93 b | 10.22 ± 0.98 a | <0.001 | 15.52 ± 0.90 | 8.20 ± 0.99 | <0.001 |
| n-6/n-3 PUFA | 17.79 ± 0.44 a | 17.43 ± 0.47 a,c | 19.27 ± 0.44 b,c | 17.69 ± 0.46 a | 0.095 | 20.73 ± 0.40 | 15.77 ± 0.44 | <0.001 |
| MUFA/SFA | 1.05 ± 0.02 a,b | 0.96 ± 0.02 a | 0.96 ± 0.02 a,b | 1.04 ± 0.02 b | 0.075 | 0.90 ± 0.02 | 1.10 ± 0.02 | <0.001 |
| PUFA/SFA | 0.23 ± 0.02 a | 0.25 ± 0.02 a | 0.43 ± 0.02 b | 0.25 ± 0.03 a | <0.001 | 0.39 ± 0.02 | 0.21 ± 0.02 | <0.001 |
| PUFA/MUFA | 0.23 ± 0.03 a | 0.28 ± 0.03 a | 0.49 ± 0.03 b | 0.25 ± 0.03 a | <0.001 | 0.44 ± 0.03 | 0.20 ± 0.03 | <0.001 |
| Carcass Fatness and Fatty Acids | FASN Genotypes | p-Value | ||||||
|---|---|---|---|---|---|---|---|---|
| AA | GA | GG | p-Value | GG vs. GA/AA | GG/GA vs. AA | GG/AA vs. GA | GG vs. AA | |
| EUROP conform a | 3.58 ± 0.172 a,b | 3.72 ± 0.079 a | 3.45 ± 0.089 b | 0.081 | 0.026 | 0.874 | 0.036 | 0.547 |
| EUROP fat grade b | 2.58 ± 0.166 | 2.80 ± 0.076 | 2.82 ± 0.085 | 0.434 | 0.768 | 0.220 | 0.716 | 0.335 |
| Subcut. fat tissue c | 2.01 ± 0.431 | 3.02 ± 0.197 | 2.63 ± 0.221 | 0.121 | 0.391 | 0.147 | 0.074 | 0.225 |
| Fat + conn. tissue d | 15.79 ± 0.93 | 15.72 ± 0.42 | 16.35 ± 0.48 | 0.603 | 0.235 | 0.774 | 0.488 | 0.705 |
| Fat in MLD e | 2.51 ± 0.138 | 2.64 ± 0.217 | 2.42 ± 0.446 | 0.832 | 0.397 | 0.538 | 0.726 | 0.563 |
| C12:0 | 0.06 ± 0.003 | 0.06 ± 0.003 | 0.06 ± 0.003 | 0.737 | 0.874 | 0.599 | 0.453 | 0.538 |
| C14:0 | 2.35 ± 0.189 | 2.62 ± 0.086 | 2.54 ± 0.097 | 0.433 | 0.768 | 0.323 | 0.385 | 0.381 |
| C14:1 n-5 | 0.55 ± 0.079 | 0.60 ± 0.036 | 0.61 ± 0.040 | 0.749 | 0.582 | 0.546 | 0.821 | 0.387 |
| C15:0 | 0.33 ± 0.028 | 0.37 ± 0.013 | 0.37 ± 0.014 | 0.563 | 0.993 | 0.367 | 0.898 | 0.392 |
| C16:0 | 23.63 ± 0.30 a | 23.82 ± 0.26 b | 22.23 ± 0.57 b | 0.054 | 0.782 | 0.021 | 0.241 | 0.043 |
| C16:1 | 4.03 ± 0.217 | 3.84 ± 0.099 | 3.85 ± 0.111 | 0.728 | 0.990 | 0.413 | 0.964 | 0.513 |
| C17:0 | 0.88 ± 0.063 | 0.92 ± 0.029 | 0.92 ± 0.032 | 0.814 | 0.904 | 0.549 | 0.875 | 0.613 |
| C17:1 n-7 | 0.83 ± 0.060 | 0.78 ± 0.027 | 0.80 ± 0.031 | 0.665 | 0.726 | 0.456 | 0.454 | 0.677 |
| C18:0 | 12.98 ± 0.64 | 13.46 ± 0.30 | 13.06 ± 0.33 | 0.616 | 0.439 | 0.681 | 0.513 | 0.870 |
| C18:1 | 38.02 ± 1.06 | 38.07 ± 0.48 | 37.79 ± 0.55 | 0.927 | 0.897 | 0.878 | 0.659 | 0.853 |
| C18:2 n-6 | 9.02 ± 0.970 | 7.62 ± 0.443 | 8.03 ± 0.499 | 0.417 | 0.989 | 0.269 | 0.347 | 0.378 |
| C18:2 c9.t11 | 0.21 ± 0.023 | 0.23 ± 0.011 | 0.24 ± 0.012 | 0.666 | 0.722 | 0.276 | 0.958 | 0.445 |
| C18:3 n-6 | 0.05 ± 0.008 | 0.05 ± 0.004 | 0.06 ± 0.004 | 0.173 | 0.055 | 0.836 | 0.095 | 0.499 |
| C18:3 n-3 | 0.21 ± 0.017 | 0.19 ± 0.008 | 0.20 ± 0.009 | 0.535 | 0.704 | 0.485 | 0.298 | 0.662 |
| C18:4 n-3 | 0.03 ± 0.007 | 0.03 ± 0.003 | 0.03 ± 0.003 | 0.901 | 0.912 | 0.587 | 0.989 | 0.615 |
| C19:0 | 0.05 ± 0.004 | 0.06 ± 0.002 | 0.06 ± 0.002 | 0.237 | 0.711 | 0.055 | 0.578 | 0.072 |
| C19:1 n-9 | 0.06 ± 0.006 a | 0.04 ± 0.002 b | 0.05 ± 0.003 a | 0.013 | 0.111 | 0.016 | 0.010 | 0.228 |
| C20:0 | 0.07 ± 0.005 | 0.07 ± 0.002 | 0.07 ± 0.002 | 0.731 | 0.377 | 0.883 | 0.771 | 0.534 |
| C20:1 n-9 | 0.13 ± 0.010 | 0.13 ± 0.005 | 0.12 ± 0.005 | 0.388 | 0.252 | 0.890 | 0.362 | 0.269 |
| C20:2 n-6 | 0.10 ± 0.010 | 0.10 ± 0.005 | 0.10 ± 0.005 | 0.814 | 0.735 | 0.949 | 0.354 | 0.862 |
| C20:3 n-6 | 0.57 ± 0.078 | 0.52 ± 0.036 | 0.57 ± 0.040 | 0.523 | 0.348 | 0.684 | 0.292 | 0.910 |
| C20:4 n-6 | 3.09 ± 0.391 | 2.64 ± 0.178 | 2.81 ± 0.201 | 0.546 | 0.788 | 0.360 | 0.395 | 0.545 |
| C20:5 n-3 | 0.08 ± 0.010 | 0.06 ± 0.004 | 0.07 ± 0.005 | 0.345 | 0.797 | 0.225 | 0.322 | 0.394 |
| C22:2 n-6 | 0.02 ± 0.008 | 0.02 ± 0.003 | 0.03 ± 0.003 | 0.339 | 0.265 | 0.202 | 0.465 | 0.126 |
| C22:3 n-3 | 0.10 ± 0.014 | 0.08 ± 0.006 | 0.09 ± 0.007 | 0.227 | 0.277 | 0.271 | 0.120 | 0.522 |
| C22:4 n-6 | 0.48 ± 0.063 | 0.43 ± 0.029 | 0.51 ± 0.032 | 0.249 | 0.122 | 0.702 | 0.121 | 0.777 |
| C22:5 n-3 | 0.27 ± 0.036 | 0.23 ± 0.016 | 0.24 ± 0.018 | 0.586 | 0.889 | 0.391 | 0.515 | 0.521 |
| C22:6 n-3 | 0.02 ± 0.006 | 0.03 ± 0.003 | 0.03 ± 0.003 | 0.316 | 0.151 | 0.441 | 0.488 | 0.247 |
| C24:1 n-9 | 0.05 ± 0.007 a | 0.03 ± 0.003 b | 0.04 ± 0.004 a,b | 0.029 | 0.564 | 0.012 | 0.038 | 0.121 |
| SFA | 42.07 ± 0.93 a | 44.22 ± 0.44 b | 43.66 ± 0.48 a,b | 0.114 | 0.763 | 0.066 | 0.234 | 0.059 |
| MUFA | 43.72 ± 1.19 | 43.45 ± 0.56 | 43.34 ± 0.61 | 0.959 | 0.933 | 0.994 | 0.714 | 0.777 |
| PUFA | 14.21 ± 1.52 | 12.33 ± 0.72 | 12.99 ± 0.78 | 0.518 | 0.814 | 0.326 | 0.315 | 0.490 |
| n-3 PUFA | 0.70 ± 0.072 | 0.62 ± 0.034 | 0.66 ± 0.037 | 0.269 | 0.557 | 0.395 | 0.255 | 0.609 |
| n-6 PUFA | 13.29 ± 1.46 | 11.47 ± 0.69 | 12.09 ± 0.75 | 0.513 | 0.835 | 0.318 | 0.324 | 0.481 |
| n-6/n-3 PUFA | 18.43 ± 0.68 | 18.00 ± 0.32 | 18.01 ± 0.35 | 0.856 | 0.322 | 0.732 | 0.875 | 0.678 |
| MUFA/SFA | 1.04 ± 0.034 | 0.99 ± 0.015 | 1.00 ± 0.017 | 0.396 | 0.889 | 0.337 | 0.657 | 0.189 |
| PUFA/SFA | 0.34 ± 0.039 | 0.28 ± 0.018 | 0.30 ± 0.020 | 0.398 | 0.939 | 0.267 | 0.370 | 0.366 |
| PUFA/MUFA | 0.35 ± 0.046 | 0.31 ± 0.021 | 0.32 ± 0.024 | 0.663 | 0.913 | 0.504 | 0.468 | 0.656 |
| Carcass Fatness and Fatty Acids | SCD Genotypes | p Value | ||||||
|---|---|---|---|---|---|---|---|---|
| CC | CT | TT | p Value | TT vs. CT/CC | TT/TC vs. CC | TT/CC vs. CT | TT vs. CC | |
| EUROP conform a | 3.75 ± 0.152 a | 3.72 ± 0.100 a | 3.48 ± 0.075 b | 0.095 | 0.040 | 0.265 | 0.129 | 0.132 |
| EUROP fat grade b | 2.79 ± 0.145 | 2.69 ± 0.096 | 2.84 ± 0.072 | 0.454 | 0.525 | 0.840 | 0.231 | 0.802 |
| Subcut. fat tissue c | 2.86 ± 0.379 | 2.65 ± 0.249 | 2.77 ± 0.188 | 0.885 | 0.647 | 0.874 | 0.844 | 0.866 |
| Fat + conn. tissue d | 15.32 ± 0.82 a | 13.56 ± 0.54 a | 17.69 ± 0.41 b | 0.001 | 0.001 | 0.387 | 0.001 | 0.028 |
| Fat in MLD e | 2.20 ± 0.306 a,b | 2.18 ± 0.202 b | 2.85 ± 0.153 a | 0.021 | 0.006 | 0.224 | 0.042 | 0.077 |
| C12:0 | 0.07 ± 0.003 | 0.06 ± 0.003 | 0.06 ± 0.005 | 0.253 | 0.108 | 0.744 | 0.142 | 0.366 |
| C14:0 | 2.58 ± 0.166 a,b | 2.36 ± 0.109 a | 2.55 ± 0.083 b | 0.105 | 0.059 | 0.768 | 0.038 | 0.667 |
| C14:1 n-5 | 0.48 ± 0.069 a | 0.54 ± 0.045 a | 0.66 ± 0.034 b | 0.034 | 0.023 | 0.058 | 0.092 | 0.035 |
| C15:0 | 0.37 ± 0.025 | 0.37 ± 0.016 | 0.36 ± 0.012 | 0.717 | 0.509 | 0.493 | 0.638 | 0.553 |
| C16:0 | 24.44 ± 0.51 a | 22.62 ± 0.33 b | 23.91 ± 0.25 a | 0.004 | 0.029 | 0.047 | 0.002 | 0.321 |
| C16:1 | 3.59 ± 0.191 a | 3.48 ± 0.125 a | 4.18 ± 0.095 b | 0.001 | 0.001 | 0.096 | 0.001 | 0.006 |
| C17:0 | 0.95 ± 0.055 | 0.94 ± 0.036 | 0.89 ± 0.027 | 0.500 | 0.314 | 0.363 | 0.411 | 0.419 |
| C17:1 n-7 | 0.72 ± 0.053 | 0.76 ± 0.035 | 0.83 ± 0.026 | 0.083 | 0.035 | 0.157 | 0.170 | 0.089 |
| C18:0 | 14.29 ± 0.57 a | 13.90 ± 0.37 a | 12.56 ± 0.28 b | 0.005 | 0.002 | 0.050 | 0.015 | 0.015 |
| C18:1 | 37.78 ± 0.93 a,b | 36.70 ± 0.61 a | 38.79 ± 0.46 b | 0.035 | 0.021 | 0.840 | 0.016 | 0.210 |
| C18:2 n-6 | 7.10 ± 0.852 a | 9.28 ± 0.561 b | 7.32 ± 0.423 a | 0.020 | 0.028 | 0.270 | 0.008 | 0.765 |
| C18:2 c9.t11 | 0.24 ± 0.021 | 0.22 ± 0.014 | 0.24 ± 0.010 | 0.549 | 0.575 | 0.514 | 0.362 | 0.718 |
| C18:3 n-6 | 0.04 ± 0.007 | 0.05 ± 0.005 | 0.05 ± 0.003 | 0.503 | 0.689 | 0.319 | 0.392 | 0.377 |
| C18:3 n-3 | 0.17 ± 0.015 a | 0.22 ± 0.010 b | 0.18 ± 0.007 a | 0.007 | 0.035 | 0.136 | 0.002 | 0.377 |
| C18:4 n-3 | 0.02 ± 0.008 | 0.03 ± 0.004 | 0.03 ± 0.002 | 0.574 | 0.690 | 0.428 | 0.645 | 0.422 |
| C19:0 | 0.06 ± 0.004 | 0.06 ± 0.002 | 0.06 ± 0.002 | 0.982 | 0.947 | 0.974 | 0.759 | 0.851 |
| C19:1 n-9 | 0.05 ± 0.007 a,b | 0.04 ± 0.003 a | 0.05 ± 0.002 b | 0.067 | 0.018 | 0.657 | 0.020 | 0.370 |
| C20:0 | 0.08 ± 0.004 a | 0.08 ± 0.003 a | 0.07 ± 0.002 b | 0.002 | 0.001 | 0.029 | 0.002 | 0.002 |
| C20:1 n-9 | 0.12 ± 0.009 | 0.12 ± 0.006 | 0.13 ± 0.004 | 0.301 | 0.500 | 0.156 | 0.416 | 0.096 |
| C20:2 n-6 | 0.10 ± 0.009 a,b | 0.11 ± 0.006 a | 0.09 ± 0.004 b | 0.005 | 0.002 | 0.914 | 0.002 | 0.355 |
| C20:3 n-6 | 0.49 ± 0.068 | 0.61 ± 0.045 | 0.52 ± 0.034 | 0.223 | 0.310 | 0.345 | 0.118 | 0.664 |
| C20:4 n-6 | 2.41 ± 0.343 a,b | 3.17 ± 0.226 a | 2.59 ± 0.170 b | 0.086 | 0.158 | 0.273 | 0.043 | 0.628 |
| C20:5 n-3 | 0.06 ± 0.009 a,b | 0.08 ± 0.006 a | 0.06 ± 0.004 b | 0.061 | 0.090 | 0.477 | 0.027 | 0.988 |
| C22:2 n-6 | 0.02 ± 0.006 | 0.03 ± 0.004 | 0.02 ± 0.003 | 0.508 | 0.320 | 0.917 | 0.253 | 0.848 |
| C22:3 n-3 | 0.07 ± 0.012 | 0.10 ± 0.008 | 0.09 ± 0.006 | 0.302 | 0.931 | 0.143 | 0.283 | 0.355 |
| C22:4 n-6 | 0.44 ± 0.055 | 0.51 ± 0.036 | 0.45 ± 0.027 | 0.408 | 0.541 | 0.465 | 0.251 | 0.778 |
| C22:5 n-3 | 0.22 ± 0.031 | 0.27 ± 0.021 | 0.23 ± 0.016 | 0.158 | 0.243 | 0.404 | 0.081 | 0.746 |
| C22:6 n-3 | 0.02 ± 0.006 | 0.03 ± 0.004 | 0.03 ± 0.003 | 0.180 | 0.738 | 0.125 | 0.122 | 0.415 |
| C24:1 n-9 | 0.05 ± 0.008 | 0.04 ± 0.004 | 0.04 ± 0.003 | 0.276 | 0.466 | 0.160 | 0.902 | 0.076 |
| SFA | 45.79 ± 0.82 a | 43.30 ± 0.57 b | 43.46 ± 0.41 b | 0.029 | 0.277 | 0.005 | 0.929 | 0.019 |
| MUFA | 42.82 ± 1.04 a,b | 41.02 ± 0.72 a | 45.04 ± 0.71 b | 0.006 | 0.003 | 0.481 | 0.004 | 0.049 |
| PUFA | 11.39 ± 1.34 a | 15.68 ± 0.93 b | 11.50 ± 0.66 a | 0.035 | 0.058 | 0.264 | 0.015 | 0.697 |
| n-3 PUFA | 0.59 ± 0.031 a | 0.78 ± 0.044 b | 0.55 ± 0.063 a | 0.047 | 0.202 | 0.163 | 0.026 | 0.414 |
| n-6 PUFA | 10.66 ± 0.63 a | 14.68 ± 0.89 b | 10.58 ± 1.28 a | 0.035 | 0.055 | 0.271 | 0.015 | 0.713 |
| n-6/n-3 PUFA | 18.87 ± 0.60 a,b | 18.66 ± 0.42 a | 17.58 ± 0.30 b | 0.043 | 0.008 | 0.198 | 0.072 | 0.039 |
| MUFA/SFA | 0.94 ± 0.030 a | 0.96 ± 0.019 a | 1.04 ± 0.015 b | 0.002 | 0.002 | 0.021 | 0.013 | 0.004 |
| PUFA/SFA | 0.25 ± 0.034 a | 0.34 ± 0.023 b | 0.28 ± 0.017 a | 0.036 | 0.090 | 0.149 | 0.019 | 0.463 |
| PUFA/MUFA | 0.28 ± 0.041 a | 0.39 ± 0.027 b | 0.29 ± 0.020 a | 0.011 | 0.020 | 0.240 | 0.005 | 0.784 |
| Carcass Fatness and Fatty Acids | GH Genotypes | p-Value | ||||||
|---|---|---|---|---|---|---|---|---|
| CC | CG | GG | p-Value | CC vs. CG/GG | GG vs. CG/CC | CG vs. CC/GG | CC vs. GG | |
| EUROP conform a | 3.53 ± 0.068 | 3.68 ± 0.107 | 3.75 ± 0.220 | 0.360 | 0.219 | 0.511 | 0.221 | 0.358 |
| EUROP fat grade b | 2.67 ± 0.065 a | 3.08 ± 0.103 b | 2.50 ± 0.212 a | 0.004 | 0.015 | 0.219 | 0.003 | 0.449 |
| Subcut. fat tissue c | 2.58 ± 0.170 | 3.18 ± 0.268 | 2.30 ± 0.551 | 0.136 | 0.206 | 0.498 | 0.076 | 0.628 |
| Fat + conn. tissue d | 15.75 ± 0.36 | 16.51 ± 0.58 | 15.79 ± 1.19 | 0.544 | 0.124 | 0.978 | 0.616 | 0.959 |
| Fat in MLD e | 2.50 ± 0.138 | 2.64 ± 0.217 | 2.42 ± 0.446 | 0.832 | 0.510 | 0.874 | 0.809 | 0.862 |
| C12:0 | 0.06 ± 0.007 | 0.06 ± 0.004 | 0.06 ± 0.002 | 0.774 | 0.959 | 0.462 | 0.887 | 0.525 |
| C14:0 | 2.51 ± 0.075 | 2.71 ± 0.118 | 2.35 ± 0.242 | 0.247 | 0.219 | 0.390 | 0.263 | 0.536 |
| C14:1 n-5 | 0.57 ± 0.031 | 0.64 ± 0.049 | 0.68 ± 0.101 | 0.341 | 0.099 | 0.397 | 0.459 | 0.245 |
| C15:0 | 0.36 ± 0.011 | 0.38 ± 0.018 | 0.35 ± 0.036 | 0.522 | 0.397 | 0.680 | 0.403 | 0.810 |
| C16:0 | 23.33 ± 0.27 a | 24.34 ± 0.36 b | 22.24 ± 0.74 b | 0.019 | 0.082 | 0.103 | 0.043 | 0.180 |
| C16:1 | 3.83 ± 0.085 | 3.91 ± 0.135 | 4.02 ± 0.277 | 0.731 | 0.269 | 0.602 | 0.972 | 0.508 |
| C17:0 | 0.91 ± 0.025 | 0.94 ± 0.039 | 0.87 ± 0.080 | 0.722 | 0.808 | 0.561 | 0.712 | 0.619 |
| C17:1 n-7 | 0.79 ± 0.024 | 0.79 ± 0.037 | 0.85 ± 0.077 | 0.716 | 0.605 | 0.410 | 0.591 | 0.382 |
| C18:0 | 13.37 ± 0.25 | 13.28 ± 0.40 | 12.17 ± 0.82 | 0.392 | 0.350 | 0.181 | 0.868 | 0.202 |
| C18:1 | 37.64 ± 0.42 | 38.59 ± 0.66 | 37.96 ± 1.36 | 0.485 | 0.270 | 0.942 | 0.566 | 0.838 |
| C18:2 n-6 | 8.26 ± 0.382 | 6.95 ± 0.603 | 9.35 ± 1.241 | 0.114 | 0.176 | 0.310 | 0.220 | 0.441 |
| C18:2 c9.t11 | 0.23 ± 0.009 | 0.25 ± 0.015 | 0.21 ± 0.030 | 0.417 | 0.373 | 0.602 | 0.217 | 0.732 |
| C18:3 n-6 | 0.05 ± 0.003 | 0.05 ± 0.005 | 0.04 ± 0.010 | 0.353 | 0.201 | 0.425 | 0.361 | 0.376 |
| C18:3 n-3 | 0.20 ± 0.007 | 0.18 ± 0.010 | 0.21 ± 0.021 | 0.278 | 0.236 | 0.451 | 0.372 | 0.602 |
| C18:4 n-3 | 0.03 ± 0.003 | 0.03 ± 0.004 | 0.03 ± 0.006 | 0.454 | 0.266 | 0.940 | 0.232 | 0.741 |
| C19:0 | 0.06 ± 0.002 | 0.06 ± 0.002 | 0.06 ± 0.005 | 0.268 | 0.349 | 0.549 | 0.218 | 0.664 |
| C19:1 n-9 | 0.05 ± 0.002 | 0.05 ± 0.003 | 0.05 ± 0.007 | 0.614 | 0.844 | 0.460 | 0.302 | 0.577 |
| C20:0 | 0.07 ± 0.002 | 0.07 ± 0.003 | 0.06 ± 0.006 | 0.343 | 0.605 | 0.158 | 0.538 | 0.222 |
| C20:1 n-9 | 0.12 ± 0.004 a | 0.14 ± 0.006 b | 0.15 ± 0.013 b | 0.010 | 0.007 | 0.055 | 0.076 | 0.038 |
| C20:2 n-6 | 0.10 ± 0.004 | 0.10 ± 0.006 | 0.11 ± 0.013 | 0.770 | 0.995 | 0.513 | 0.781 | 0.488 |
| C20:3 n-6 | 0.57 ± 0.031 | 0.49 ± 0.048 | 0.56 ± 0.100 | 0.321 | 0.214 | 0.894 | 0.346 | 0.924 |
| C20:4 n-6 | 2.88 ± 0.154 | 2.38 ± 0.243 | 3.29 ± 0.500 | 0.142 | 0.252 | 0.355 | 0.239 | 0.472 |
| C20:5 n-3 | 0.07 ± 0.004 a | 0.06 ± 0.006 b | 0.08 ± 0.012 a,b | 0.063 | 0.122 | 0.363 | 0.127 | 0.500 |
| C22:2 n-6 | 0.02 ± 0.003 | 0.03 ± 0.004 | 0.03 ± 0.008 | 0.424 | 0.995 | 0.540 | 0.355 | 0.197 |
| C22:3 n-3 | 0.09 ± 0.005 | 0.08 ± 0.009 | 0.10 ± 0.018 | 0.328 | 0.475 | 0.478 | 0.368 | 0.602 |
| C22:4 n-6 | 0.48 ± 0.025 | 0.42 ± 0.039 | 0.54 ± 0.080 | 0.320 | 0.520 | 0.402 | 0.364 | 0.528 |
| C22:5 n-3 | 0.25 ± 0.014 | 0.21 ± 0.022 | 0.29 ± 0.046 | 0.135 | 0.281 | 0.343 | 0.239 | 0.449 |
| C22:6 n-3 | 0.03 ± 0.003 | 0.02 ± 0.005 | 0.03 ± 0.008 | 0.493 | 0.504 | 0.649 | 0.466 | 0.755 |
| C24:1 n-9 | 0.04 ± 0.003 | 0.03 ± 0.005 | 0.04 ± 0.009 | 0.297 | 0.301 | 0.658 | 0.191 | 0.733 |
| SFA | 43.64 ± 0.38 a,b | 44.55 ± 0.58 a | 41.26 ± 1.19 b | 0.049 | 0.692 | 0.033 | 0.161 | 0.060 |
| MUFA | 43.02 ± 0.48 | 44.17 ± 0.74 | 43.85 ± 1.51 | 0.413 | 0.196 | 0.778 | 0.605 | 0.673 |
| PUFA | 13.35 ± 0.61 | 11.28 ± 0.95 | 14.89 ± 1.94 | 0.130 | 0.206 | 0.339 | 0.236 | 0.465 |
| n-3 PUFA | 0.67 ± 0.029 | 0.57 ± 0.045 | 0.75 ± 0.092 | 0.124 | 0.273 | 0.315 | 0.236 | 0.417 |
| n-6 PUFA | 12.45 ± 0.59 | 10.44 ± 0.91 | 13.91 ± 1.87 | 0.129 | 0.200 | 0.341 | 0.232 | 0.470 |
| n-6/n-3 PUFA | 18.31 ± 0.28 | 17.76 ± 0.43 | 17.83 ± 0.88 | 0.539 | 0.197 | 0.605 | 0.803 | 0.578 |
| MUFA/SFA | 0.99 ± 0.013 | 1.00 ± 0.021 | 1.06 ± 0.043 | 0.260 | 0.348 | 0.096 | 0.822 | 0.105 |
| PUFA/SFA | 0.31 ± 0.015 a,b | 0.25 ± 0.024 a | 0.37 ± 0.050 b | 0.065 | 0.201 | 0.215 | 0.177 | 0.302 |
| PUFA/MUFA | 0.37 ± 0.018 | 0.28 ± 0.029 | 0.37 ± 0.059 | 0.140 | 0.149 | 0.532 | 0.338 | 0.668 |
Disclaimer/Publisher’s Note: The statements, opinions and data contained in all publications are solely those of the individual author(s) and contributor(s) and not of MDPI and/or the editor(s). MDPI and/or the editor(s) disclaim responsibility for any injury to people or property resulting from any ideas, methods, instructions or products referred to in the content. |
© 2023 by the authors. Licensee MDPI, Basel, Switzerland. This article is an open access article distributed under the terms and conditions of the Creative Commons Attribution (CC BY) license (https://creativecommons.org/licenses/by/4.0/).
Share and Cite
Pećina, M.; Konjačić, M.; Ugarković, N.K.; Ivanković, A. Effect of FASN, SCD, and GH Genes on Carcass Fatness and Fatty Acid Composition of Intramuscular Lipids in F1 Holstein × Beef Breeds. Agriculture 2023, 13, 571. https://doi.org/10.3390/agriculture13030571
Pećina M, Konjačić M, Ugarković NK, Ivanković A. Effect of FASN, SCD, and GH Genes on Carcass Fatness and Fatty Acid Composition of Intramuscular Lipids in F1 Holstein × Beef Breeds. Agriculture. 2023; 13(3):571. https://doi.org/10.3390/agriculture13030571
Chicago/Turabian StylePećina, Mateja, Miljenko Konjačić, Nikolina Kelava Ugarković, and Ante Ivanković. 2023. "Effect of FASN, SCD, and GH Genes on Carcass Fatness and Fatty Acid Composition of Intramuscular Lipids in F1 Holstein × Beef Breeds" Agriculture 13, no. 3: 571. https://doi.org/10.3390/agriculture13030571
APA StylePećina, M., Konjačić, M., Ugarković, N. K., & Ivanković, A. (2023). Effect of FASN, SCD, and GH Genes on Carcass Fatness and Fatty Acid Composition of Intramuscular Lipids in F1 Holstein × Beef Breeds. Agriculture, 13(3), 571. https://doi.org/10.3390/agriculture13030571