Article

Research on UAV Remote Sensing Method of Mold Detection Suitable for Pericarp of Citri Reticulatae ‘Chachi’ Warehouses

1
College of Engineering, South China Agricultural University, Guangzhou 510642, China
2
Maoming Branch, Guangdong Laboratory for Lingnan Modern Agriculture, Maoming 525000, China
3
School of Artificial Intelligence and Computer Science, Jiangnan University, Wuxi 214122, China
4
Jiangmen Palace International Food Inc., Jiangmen 529100, China
*
Authors to whom correspondence should be addressed.
Agriculture 2023, 13(3), 528; https://doi.org/10.3390/agriculture13030528
Submission received: 25 January 2023 / Revised: 15 February 2023 / Accepted: 20 February 2023 / Published: 22 February 2023
(This article belongs to the Special Issue Application of UAVs in Precision Agriculture)

Abstract

:
Once the Pericarp of Citri Reticulata ‘Chachi’ (PCRC) develops mildew while in storage, the rapid spread of the flora after the occurrence of mold can cause huge losses. As such, inspecting whether the PCRC is moldy is important. In this paper, we propose an alternative inspection method, namely that of utilizing a small UAV with a camera to inspect the PCRC mildew in the top stacks under consideration. Specifically, we first address the light problem in the collected images with different lights via a multi-spectral method, and find that 625–740 nm of lighting has a significant effect on mildew. Second, we utilize the ultrared 1.4R-G method to extract the features of mildew with Otus binarization. We can see that the mold-free area is less than 95% in an image categorized as having mildew. The proposed mildew inspection method achieved 93.3% accuracy. Our method could send the inspection information to a control system, achieving rapid closed-loop automatic control and reducing the mildew-related loss.

1. Introduction

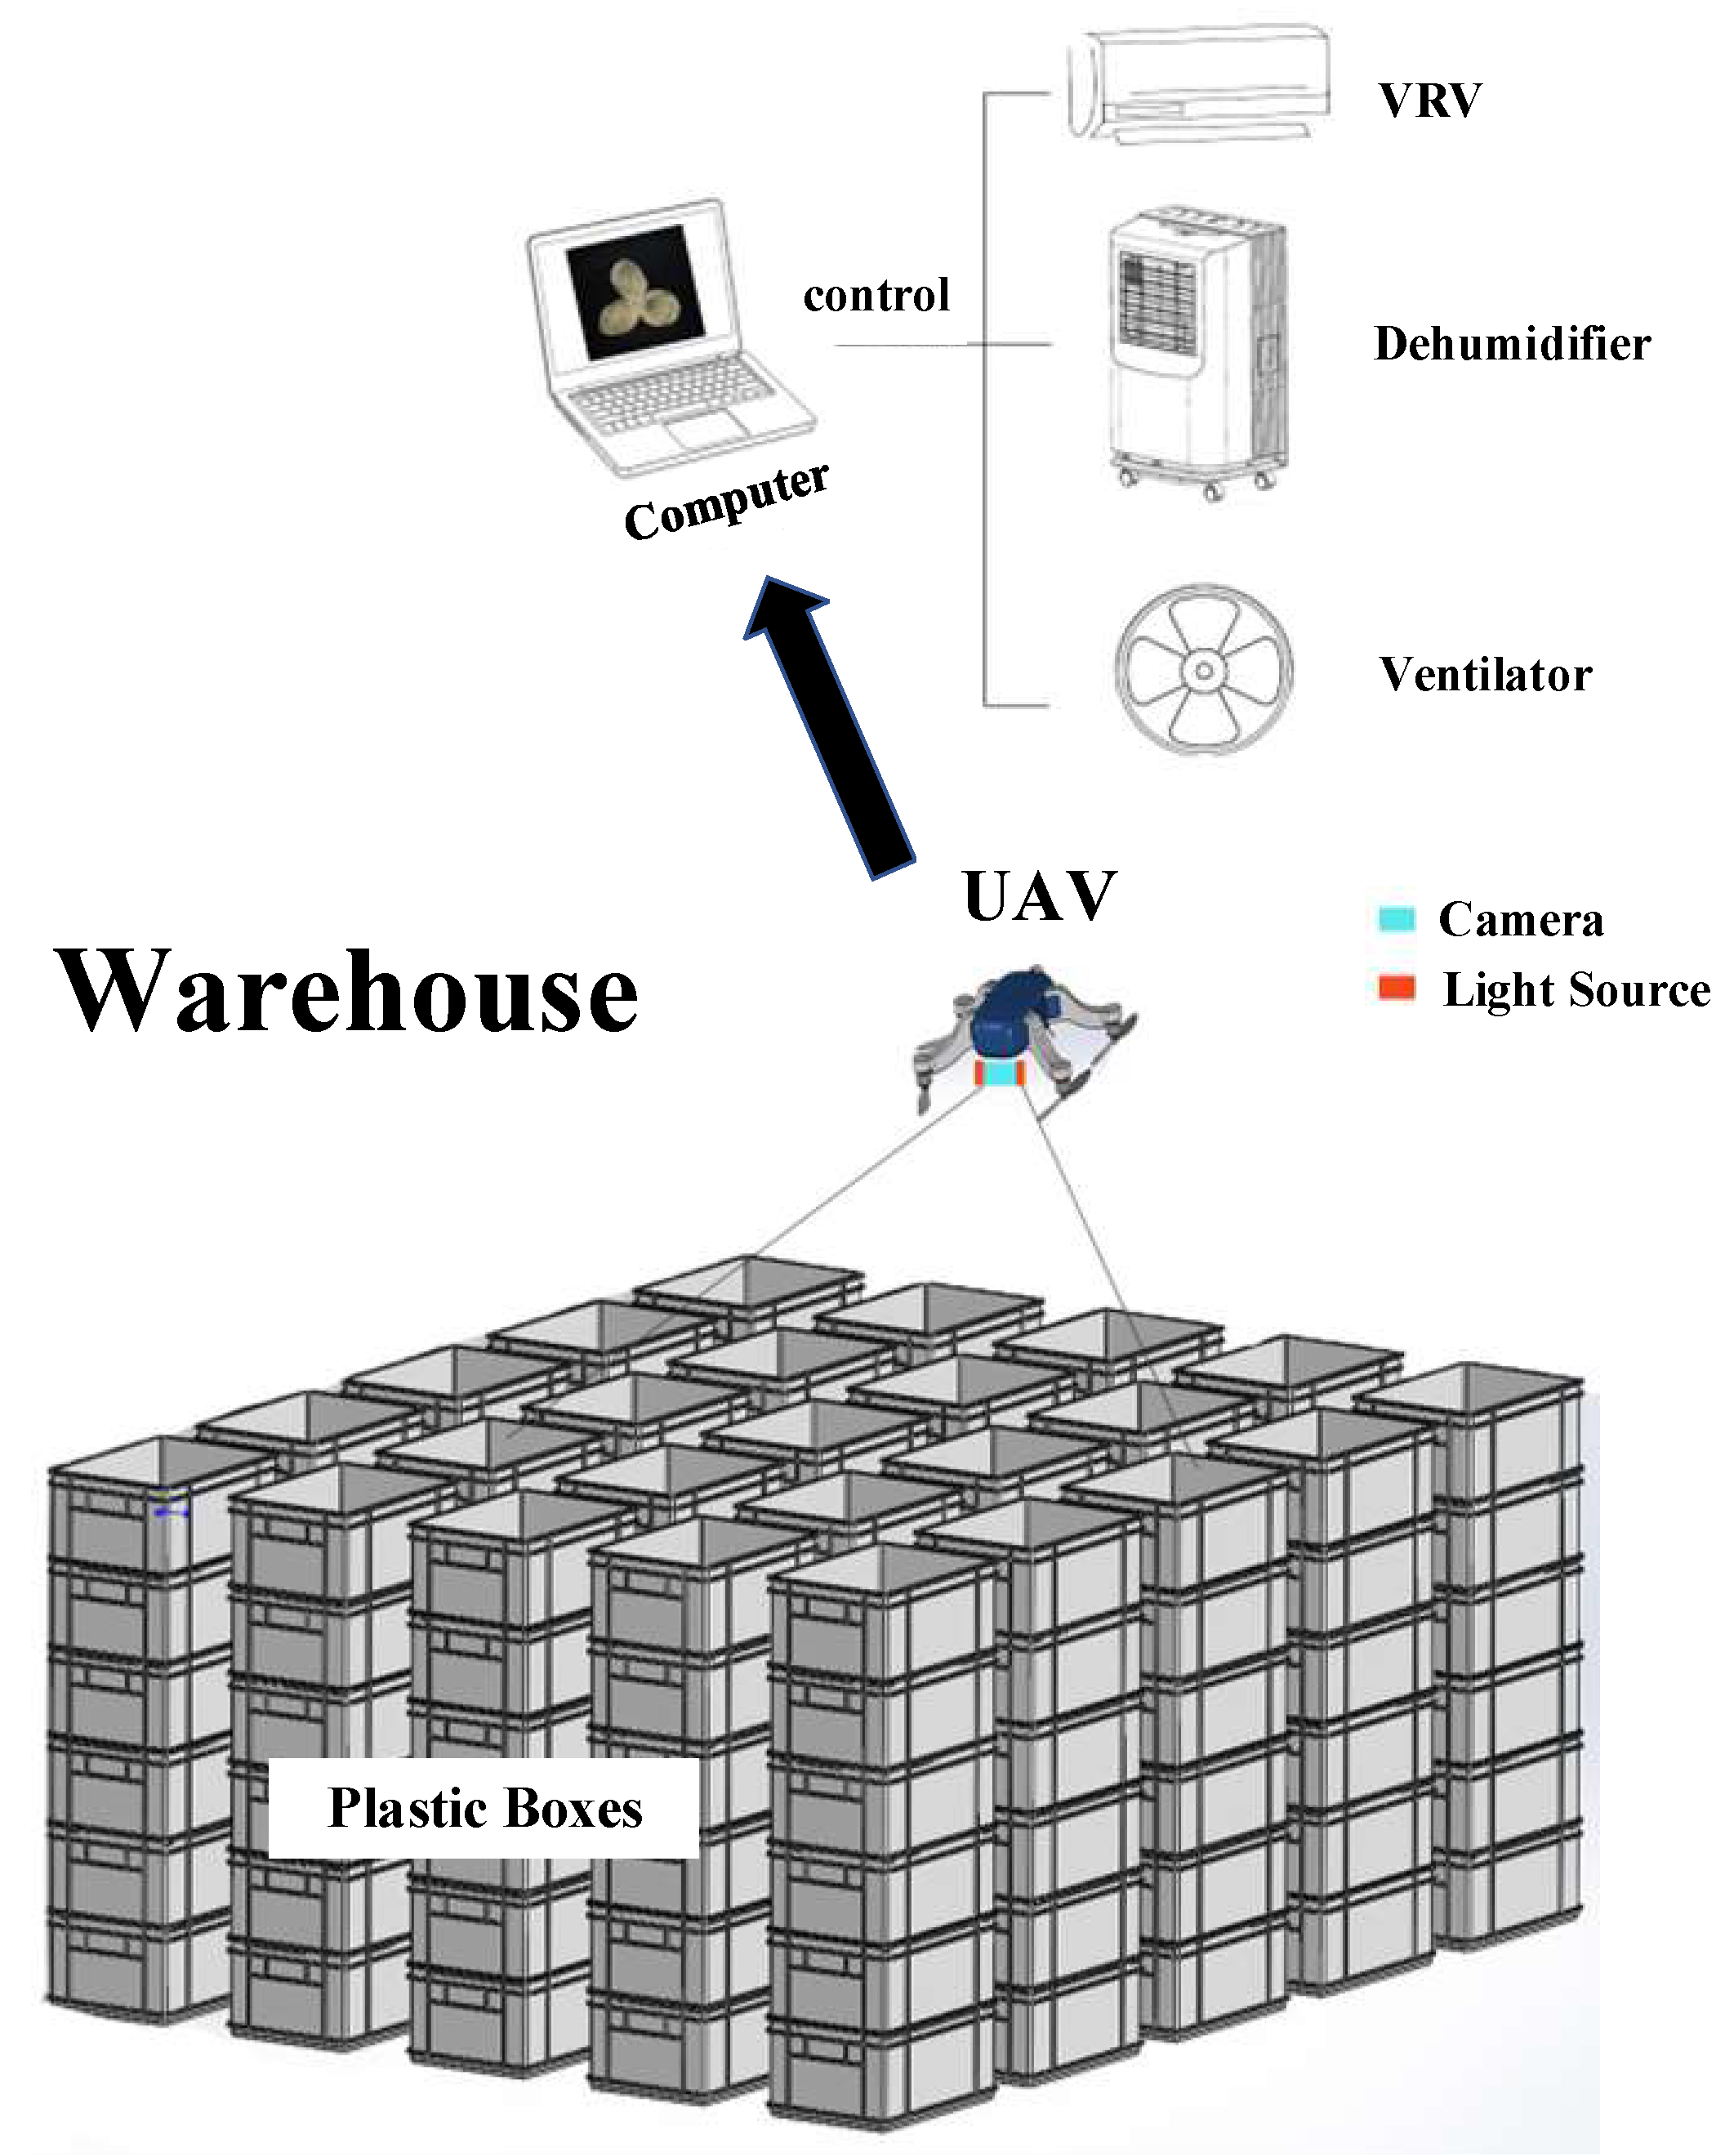
The Pericarp of Citri Reticulatae ‘Chachi’ (PCRC), as a type of homology in medicine and food, is prepared using the aging, dry and mature cultivated varieties of the pericarp of Citri reticulata Blanco [1]. It contains hesperidin, which helps prevent liver diseases, and has anti-cancer, anti-oxidant and anti-inflammatory properties [2,3,4,5]. Flavonoids, which have anti-tumor effects, and volatile oils, which can resist respiratory system as well as other diseases [6], will change in complex ways as the storage years increase [7,8,9]. Some studies have confirmed that the storage characteristics of PCRC should be long-term aging with an annual increase in the storage volume. Once PCRC is impregnated by mold, its active ingredients become significantly reduced and the volatile components will significantly change [10], which creates a higher demand for the controllability of mildew risk in the warehouse. Currently, because the price of PCRC is positively correlated with the storage time, its manufacturers usually have large-scale warehouses. PCRC stacks plastic frames upwards and downwards in a large warehouse, with the top of the plastic frame open and the four sides of the grid sealed (Figure 1). The general stacking height is high to save warehouse space. Conventional manual inspections can only be observed from the side because the side walls of the plastic frame are in the line of sight, making it difficult to effectively retrieve mold information. While the multi-layer stacking structure of the frames is loose, manual inspection operations such as climbing to the top of the observation present increased safety risks with only relatively low efficiency. Traditional inspection methods have limitations and high costs, while the automation devices of the warehouse environment cannot form closed-loop control with people [11]. Therefore, in this study, we propose an observation method that employs an auto-guided unmanned aerial vehicle (UAV) equipped with a camera to inspect the mildew from the top of the plastic frames to perform the noncontact mold inspection of PCRC in the different locations of large warehouses. When the internal air is airless in a large warehouse with a long-term static state, the temperature and humidity at the top of the warehouse space are higher than in the other locations, so the PCRC there is more susceptible to mildew. It is highly practical and feasible to use the flight capability of UAVs to inspect mildew from above the plastic frames.
UAV inspection is an advanced intelligent inspection method. Compared to the traditional manual inspection method, using remote sensing technology with industrial cameras and customized light sources by UAV has the advantages of simple operation, portability, and high efficiency [12,13,14]. Using UAV remote sensing platforms in agricultural monitoring has become a trend in agricultural research [15,16,17]. For example, Walmart has established a research and development team to design commercial drones for inventory inspections and cargo transportation, as well as to monitor out-of-stock conditions and logistics delivery [18]. The Age Steel Company in Dubai, UAE, achieved product tracking in a yard using drones by combining a quadrotor drone platform with radio frequency identification and machine vision, avoiding high-temperature manual work and improving the efficiency [19]. Xiao Bin proposed a UAV with a vision for cargo defect inspection systems, which solves the problem of missing cargo and surface defect identification through the flexible control of UAVs with image-processing methods [20]. Wang Jie proposed that UAVs have the advantage of dexterity and convenience, allowing them to fly freely in warehouses to collect cargo and bookshelf aisle images. Autonomous drone navigation cargo image matching can be achieved using image-processing algorithms, resulting in a complete cargo inventory [21]. The technical solution proposed in this study can be realized using current UAV technology.
Noncontact quality inspection research results and applications in non-destructive rapid inspection, such as for seeds, fruits, and other agricultural products, are gradually increasing [22,23,24]. The current machine vision method, which is based on morphology, color, texture, and other distinguishing image information extraction and recognition methods, provides a theoretical basis for this study. Taking photos of agricultural products with a camera, custom-segmenting them in a computer, and then identifying the region of interest using binary images constitute a reliable method with simple operation and high result accuracy. For example, Bu Xiangyu used color moments and a color co-occurrence matrix to obtain the region of interest features from rapeseed leaves infected with disease spots. This improves the recognition accuracy of rapeseed diseases when combined with the Dempster Shafer evidence theory to fuse feature decisions [25]. Blasco et al. successfully segmented the citrus peel disease spot region using three steps, namely seed selection, employing an iterative method of area growth, and then splitting and merging [26]. Diao Zhihua et al. proposed a recognition method based on improved excess red features, which extracts disease-like areas and binarizes them before using an area thresholding method to segment out pest mite spots in disease-like spots [27]. Zhang Nannan et al. proposed using the HSV model to quickly identify moldy corn particles and mold grades, thereby improving the images of colored corn [28]. As such, the threshold of the V component is used to distinguish normal from moldy, and the H and V component thresholds are used to distinguish mild mold from severe mold.
In summary, among the previous studies of rapid mildew detection, whilst some were based on traditional biochemical experiments but with long cycles and poor real-time performances, others focused on rapid target detection by UAV, which is susceptible to external influence during the collection process, and thus its adaptive light source needs to be strengthened. Although some related algorithms have been used and are effective in the rapid detection of agricultural products, few applications have been seen for the identification of the moldy characteristics of PCRC. Therefore, current research into the detection of moldy PCRC is relatively rare, and more exploration is needed.
In this study, we propose a UAV method using PCRC as the research object, with a camera to inspect the mildew in the warehouse, which can quickly identify the occurrence of PCRC mold. UAV has the advantages of high efficiency, high accuracy, and good safety. The ability to monitor the PCRC mold in real-time, which lays an important foundation for the subsequent realization of unmanned mold monitoring, is particularly useful for good practical application value in the large warehouses of PCRC.

2. Materials and Methods

2.1. Storage Environment and UAV Inspection Methods of PCRC

In this study, we propose the use of UAV as a mobile platform that observes downwards from above at the top of the plastic frame, whilst the camera obtains real-time pictures of PCRC at multiple locations in the warehouse; then, the computer processes the obtained image information to determine whether the PCRC is moldy. If the mold has been detected, the computer will send the signal to start the automatic equipment such as an air conditioner, humidity adjustment system, and air exchange system, which will operate to stop the mold in a timely manner and decrease the growth rate of the mold. Meanwhile, warning information will be sent to the warehouse manager, prompting the manager to make timely remedial measures. The rapid, closed-loop, and automatic control of PCRC warehouse monitoring is more timely, accurate, and effective. The work plan is shown in Figure 2. The important meaning of this closed-loop system is that UAV with a camera can replace traditional manual detection by sampling and judging the mold.
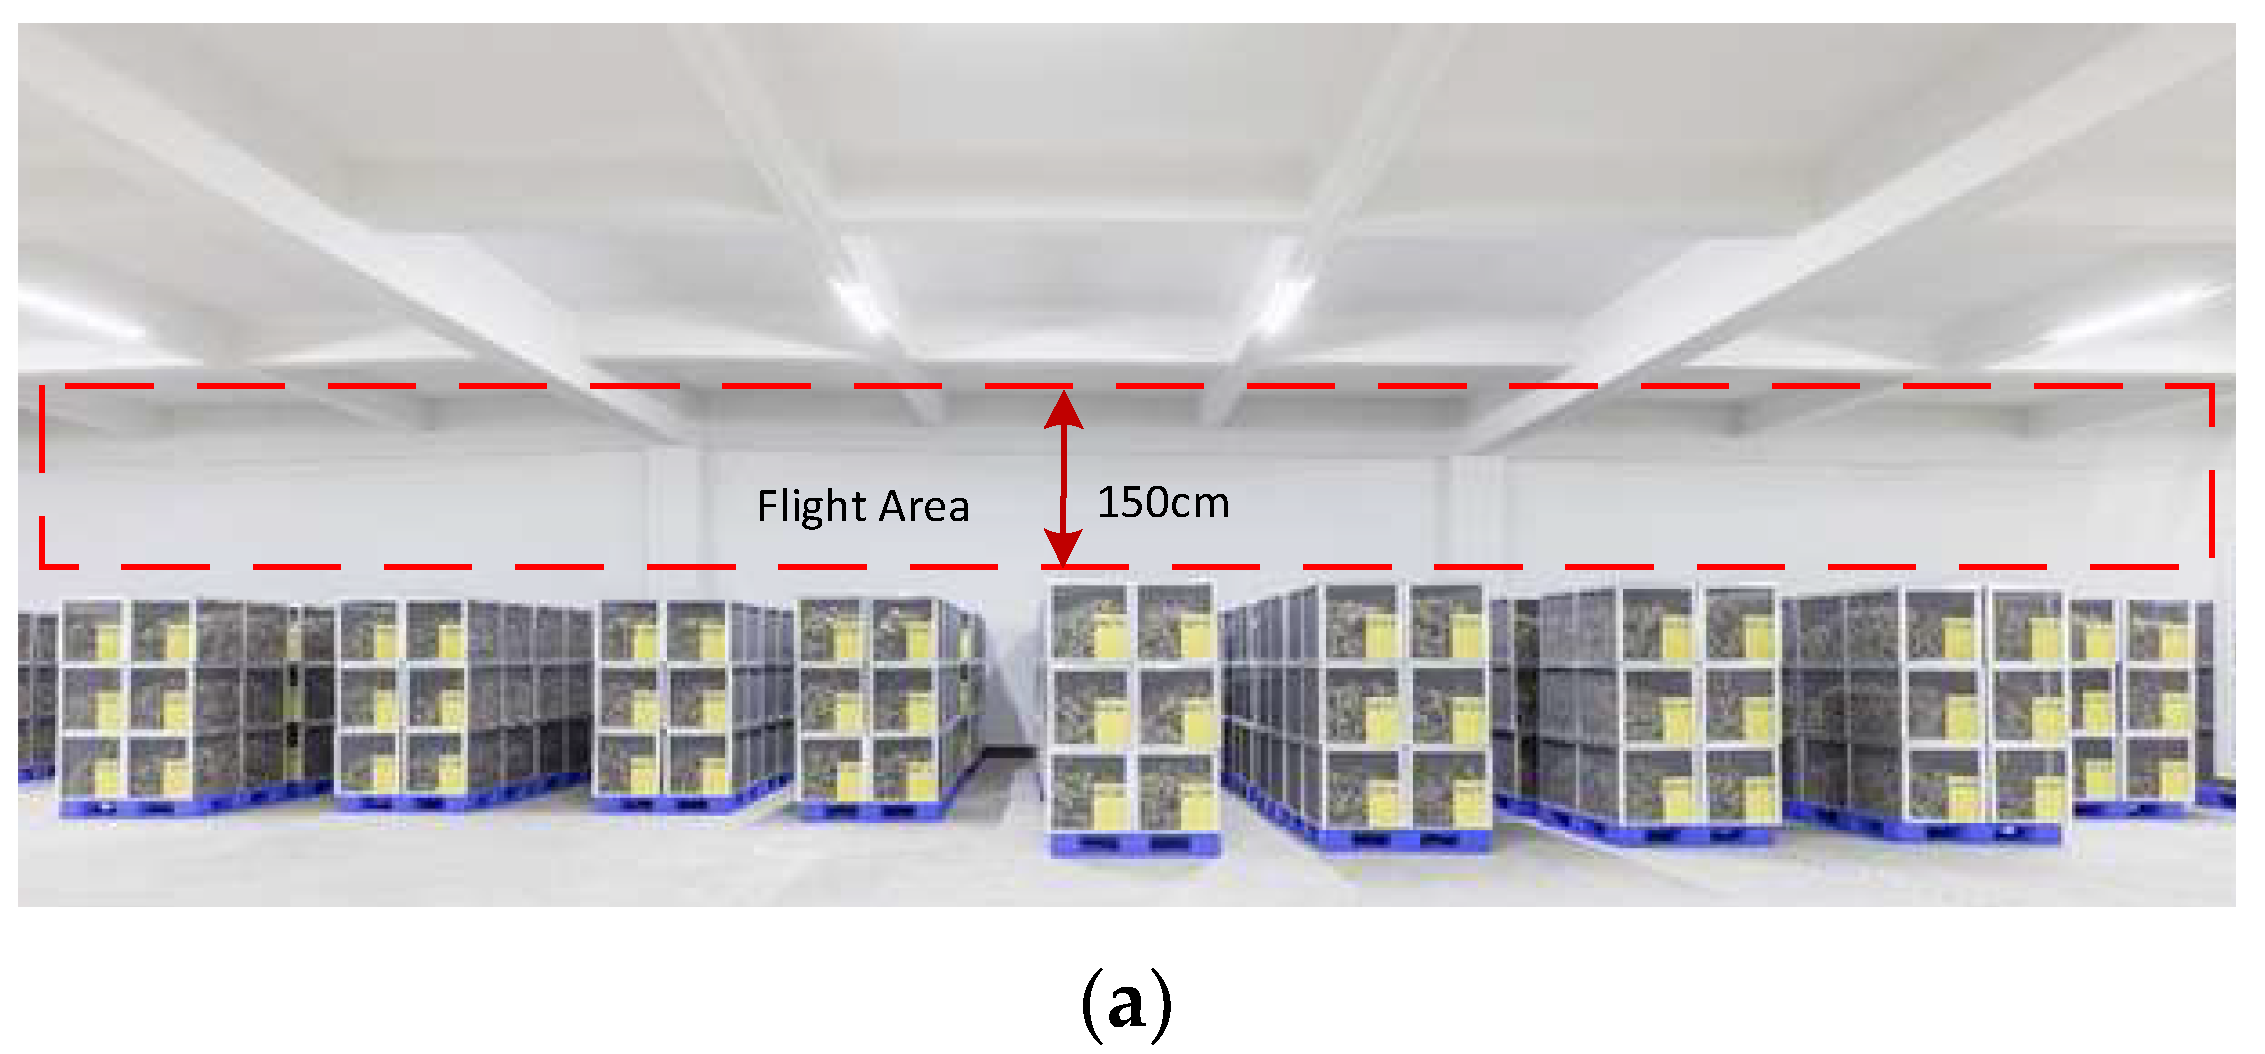
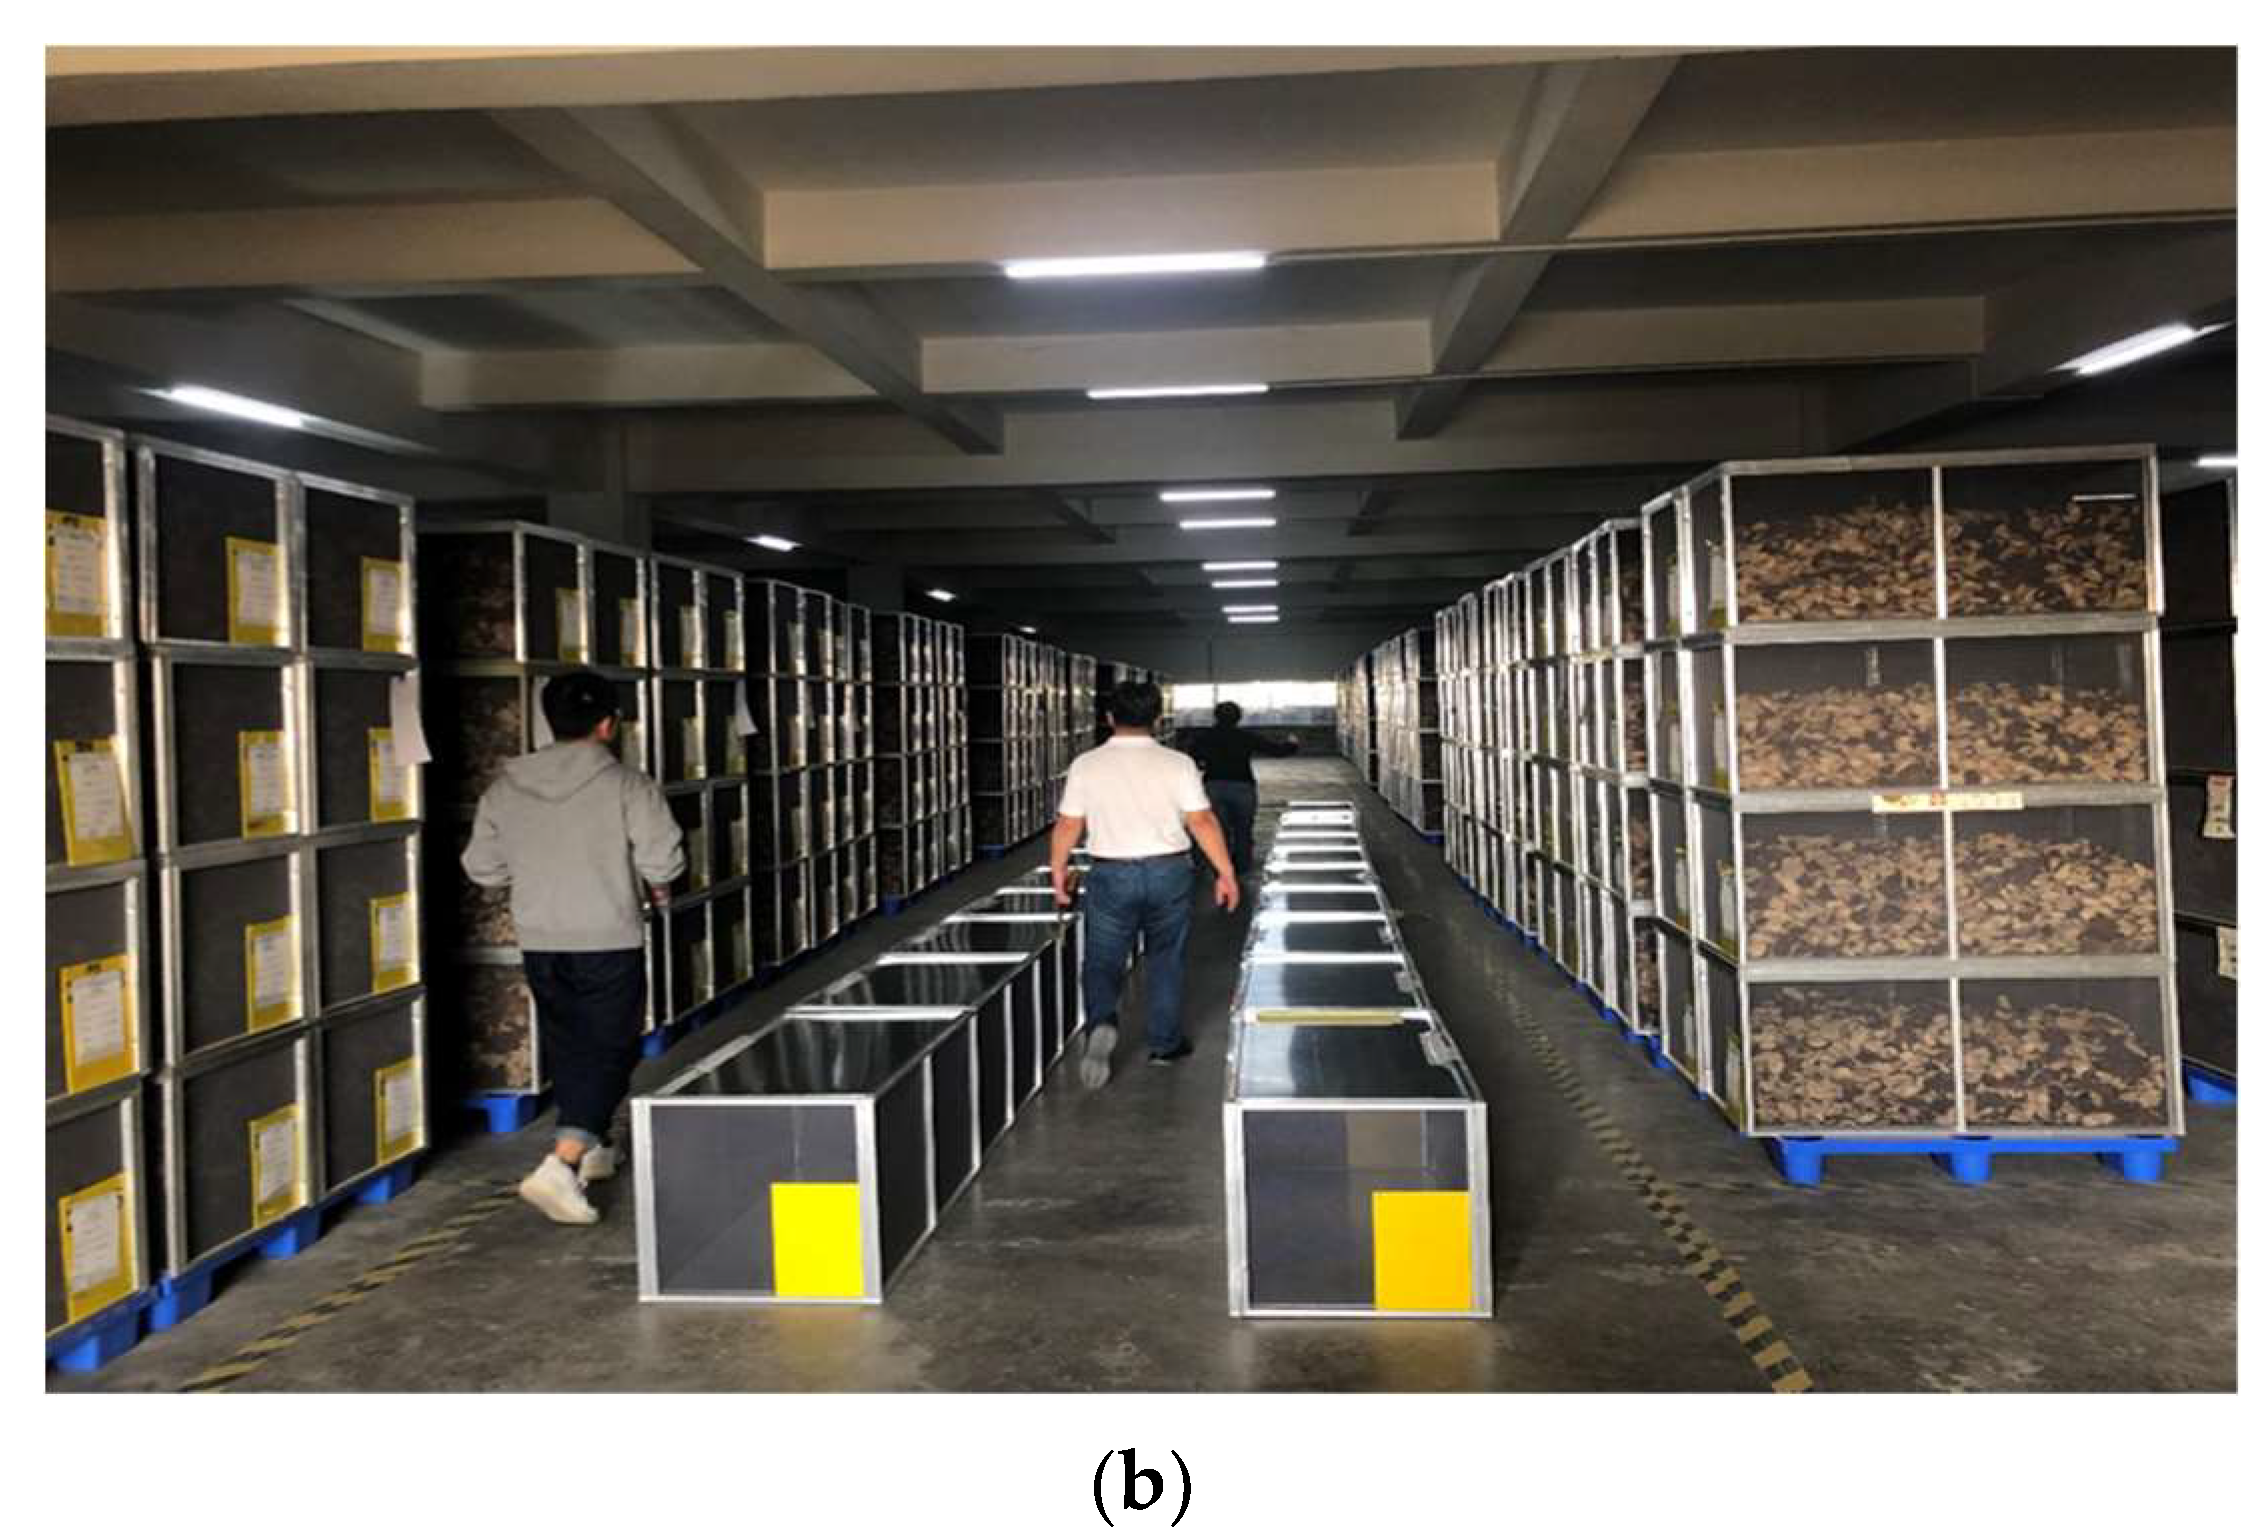
The distance between the top of the plastic frame stack and the roof of the warehouse is 150 cm, as shown in Figure 3a, which is suitable for small UAV flights. The light source is insufficient and the overall environment of the warehouse is dark, which is also influenced by the day-to-day variation in external natural light, as shown in Figure 3b. Therefore, in this study, we added an onboard light source system, which can help obtain a clearer image with stable quality, as well as increase the recognition rate of the moldy characteristics of PCRC, by considering the influence of the light source when the UAV with a camera acquires an image.
To develop a machine vision method to identify the mildew of PCRC in this study, we planned to manually induce the mildew of a sample of PCRC and designed an experimental device to then automatically and continuously acquire images of the mildew of this sample, to ultimately verify the effectiveness of the machine vision method in identifying the mildew.

2.2. Experimental Design of Spectral Characteristic Analysis of PCRC

The spectral reflection curve will change dynamically with the change in the properties of PCRC, so the spectral reflection curve of PCRC can be used to show the degree of mold. In this study, we selected 17 pieces of PCRC with “DaHong” maturity in 2020 from Xinhui District, Jiangmen, Guangdong Province. Because PCRC has the characteristic of three petals and, based on the area and shape of the spectral collection instrument window, each piece of PCRC was again divided into three independent collection areas, yielding 51 sets of samples. The PCRC samples are shown in Figure 4, with the red circular area corresponding to the window of the spectral acquisition instrument. The PCRC samples in the red circular area were classified as non-moldy in area I, lightly moldy in area II, and moderately moldy in area III, based on their actual degree of mold.
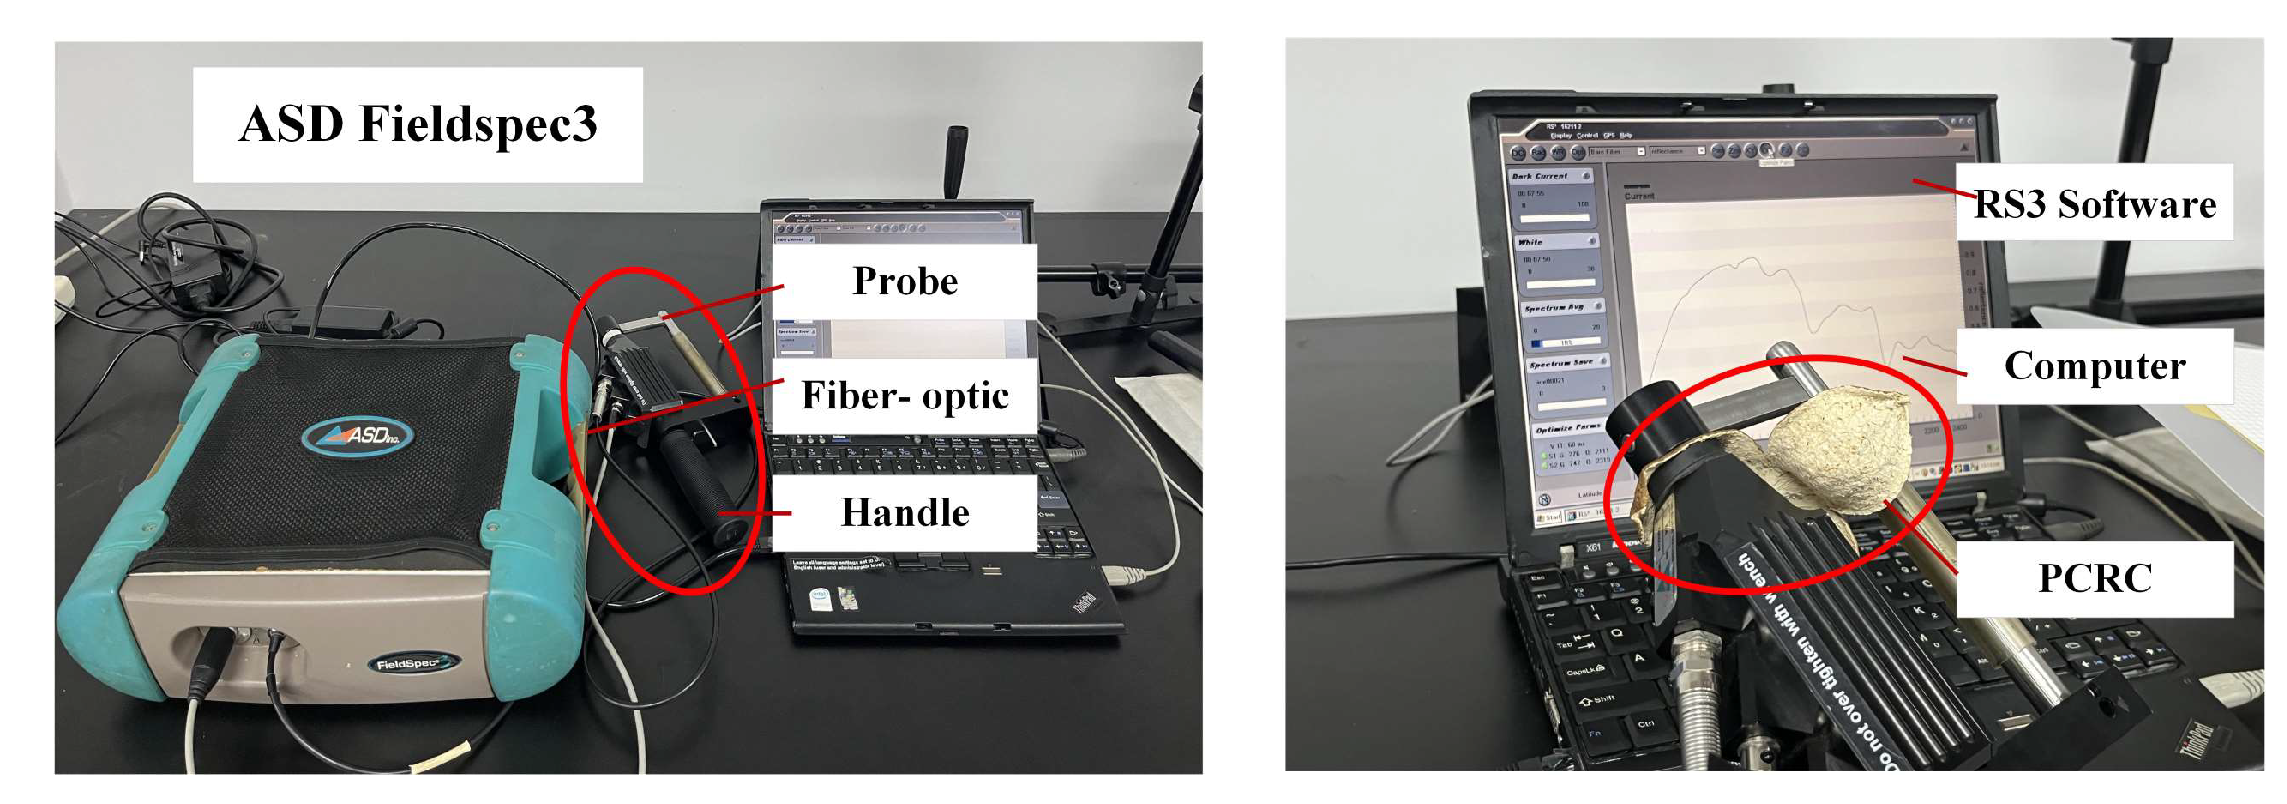
As shown in Figure 5, the ASD Fieldspec3 photogrammetric spectrometer (in the spectral range of 350–2500 nm) was used in this experiment to measure the spectral data of PCRC with different levels of moldiness. This instrument can measure and observe the reflectance spectrum curve in real time, as it has the benefits of a high signal-to-noise ratio, high reliability, and high repeatability. Each group of samples was collected three times to ensure stability, perform the data analysis of raw spectra, and screen out the sensitive feature bands with regard to the degree of mildew.

2.3. Analysis Method of Image Acquisition and Identification of Mildew in PCRC Samples

Mildew is a common natural phenomenon, but it grows slowly and requires a certain level of humidity and temperature. After several experimental tests, in the first stage, the mold from the inner side of PCRC appeared as white fluff which require a microscope to identify; as it was not serious, we did not conduct much research at this point. In the second stage, it took the shape of gray-green irregular spots, a stage which we took seriously. Finally, it evolved into black patches, at which time the mold was very serious and the loss would be relatively large. Therefore, this paper focused on the second stage, The moldy spots in the PCRC image are green, while the non-moldy PCRC is non-green. Thus, their color characteristics can be used to identify them. Using UAV to carry vision systems to achieve large-scale and rapid detection in large warehouses is a complex and workload-intensive systematic task. This paper focuses on extracting mold features from the obtained images of PCRC. Therefore, in order to improve the controllability of PCRC mildew samples and limit the interference of other environmental variables, a special environmental test box for PCRC mildew, which is a closed experimental box with a black interior and a controlled temperature of 25 °C, as well as an interior humidity of approximately 85%, was designed in this study. The camera and computer were connected through a USB 2.0 interface to obtain pictures (Figure 6).
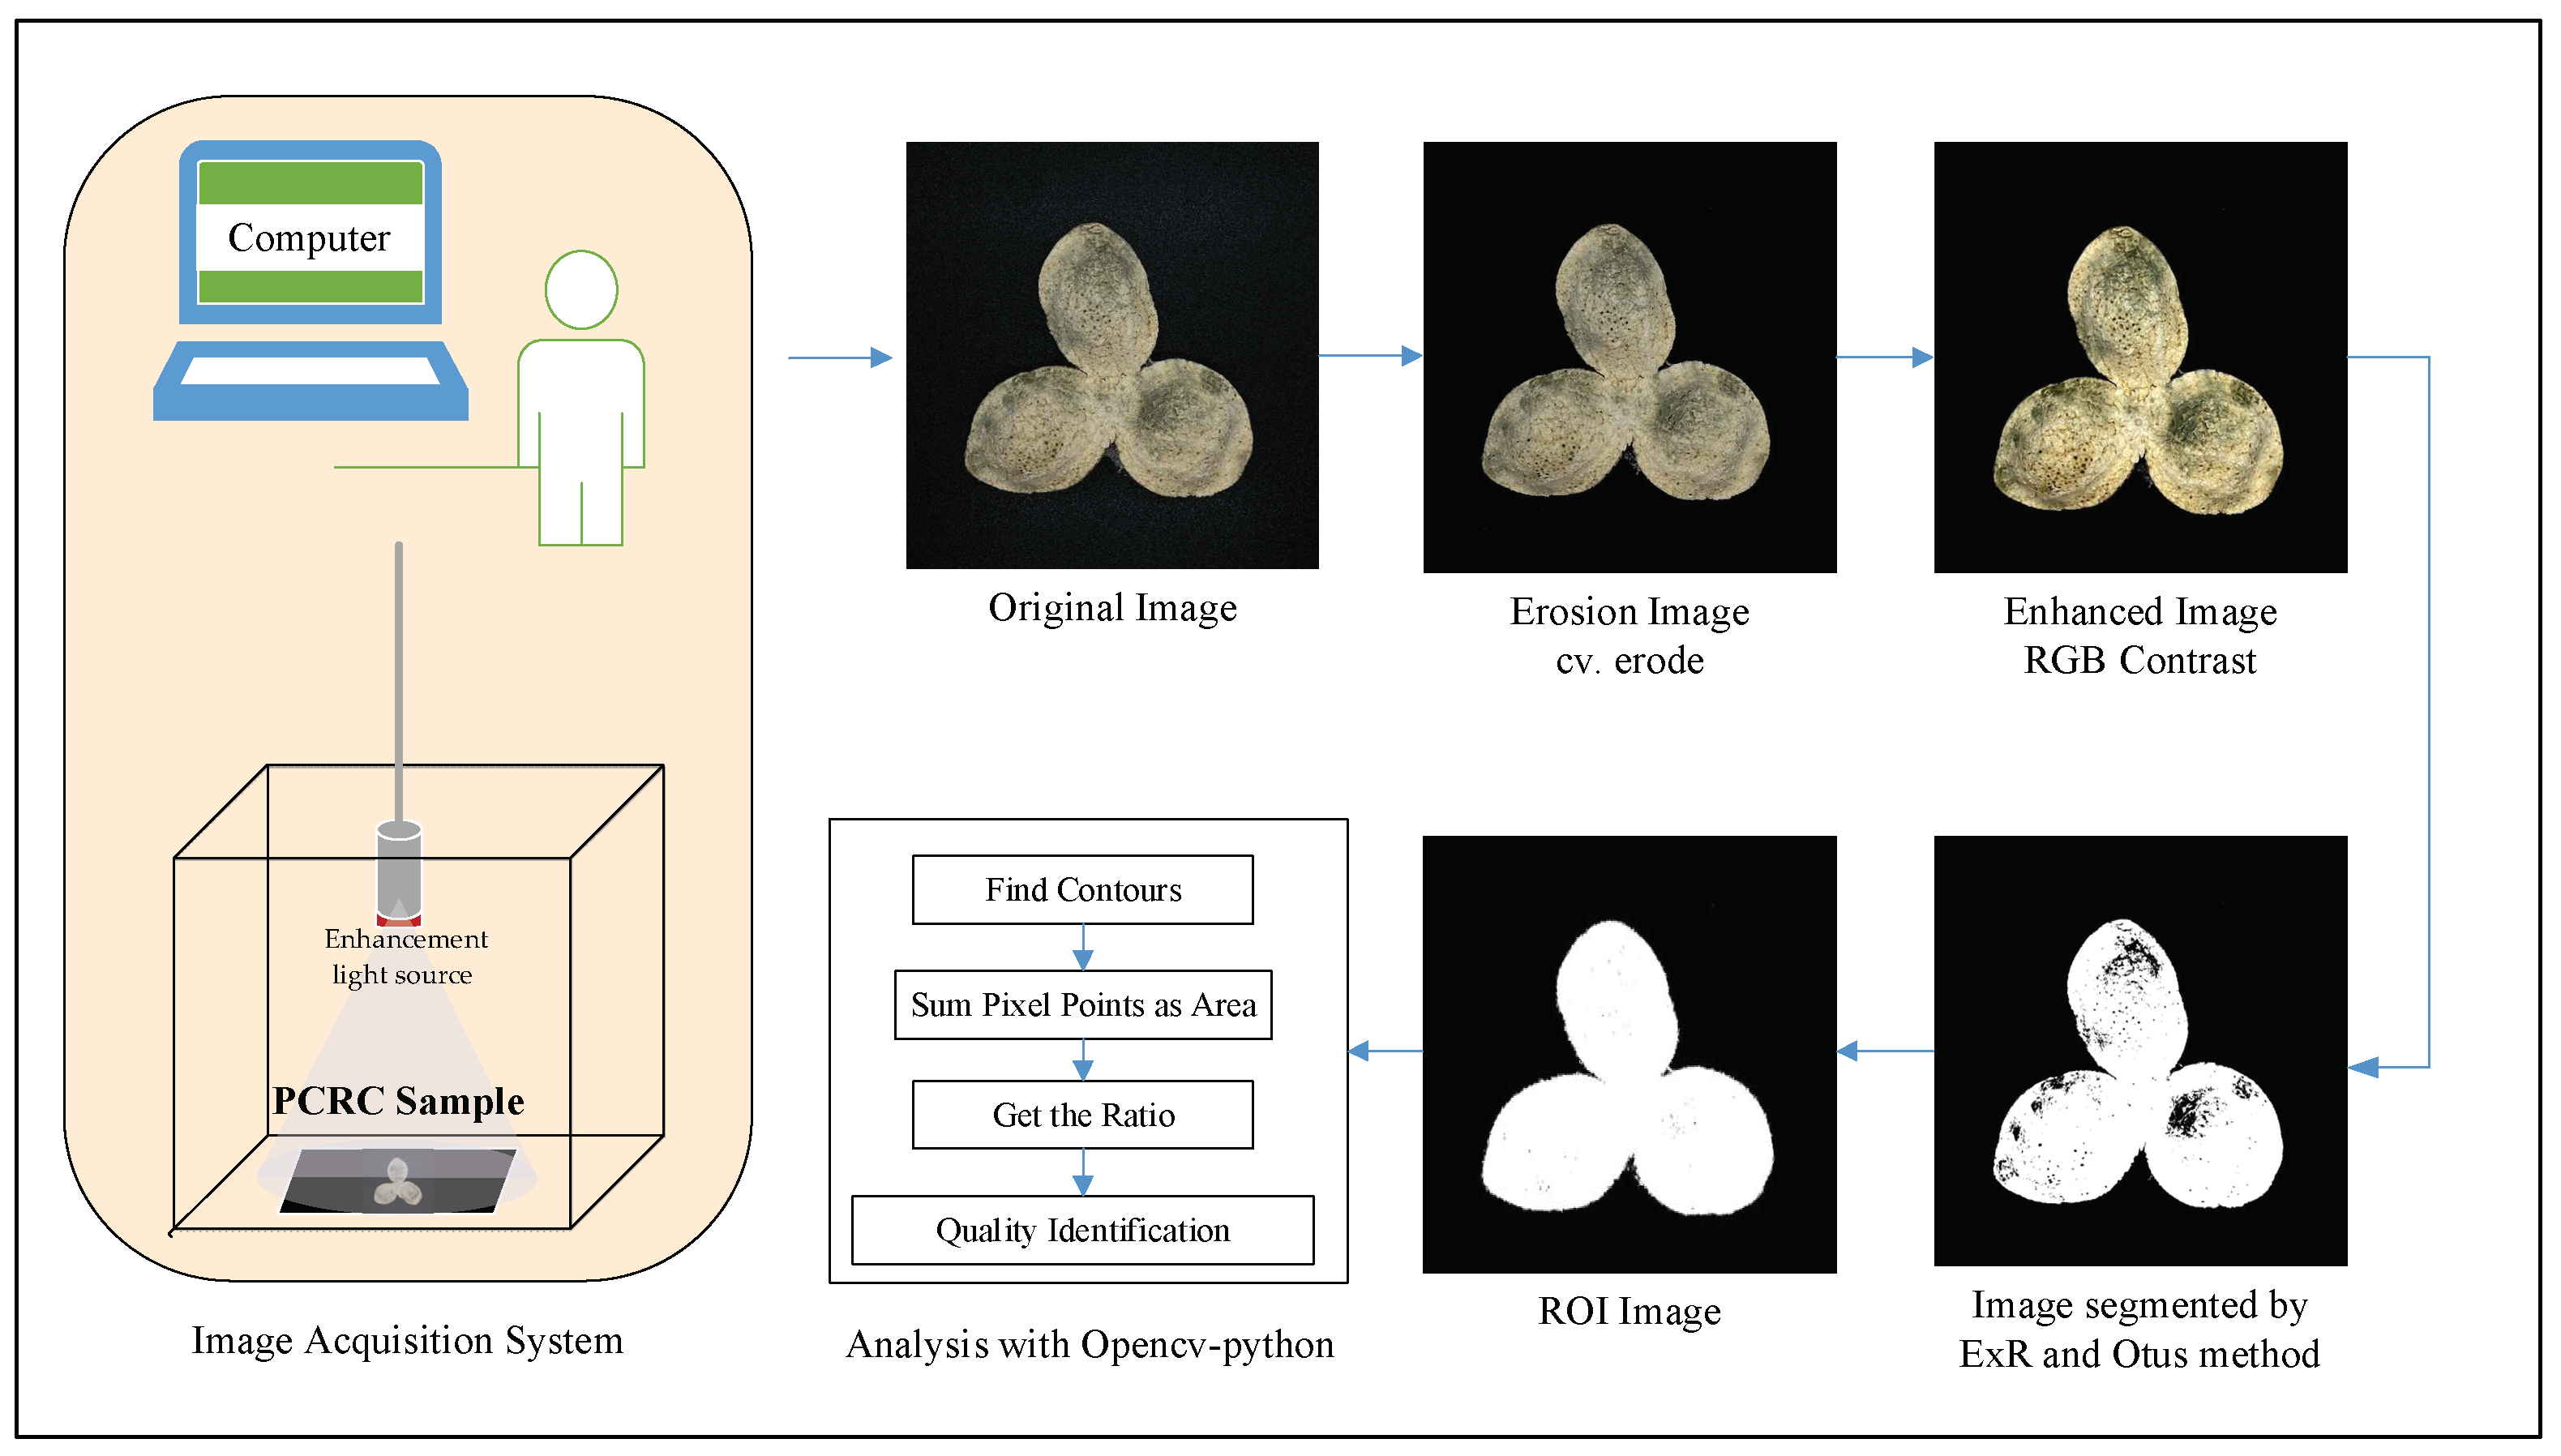
In this paper, we propose an experimental pipeline (Figure 7) to complete the differentiation of moldy PCRC and non-moldy PCRC based on the excess red feature, binarization processing, and area threshold method.

3. Results and Discussion

3.1. Characteristic Waveband Analysis and Enhanced Light Source Design for Mildew Spectra of PCRC

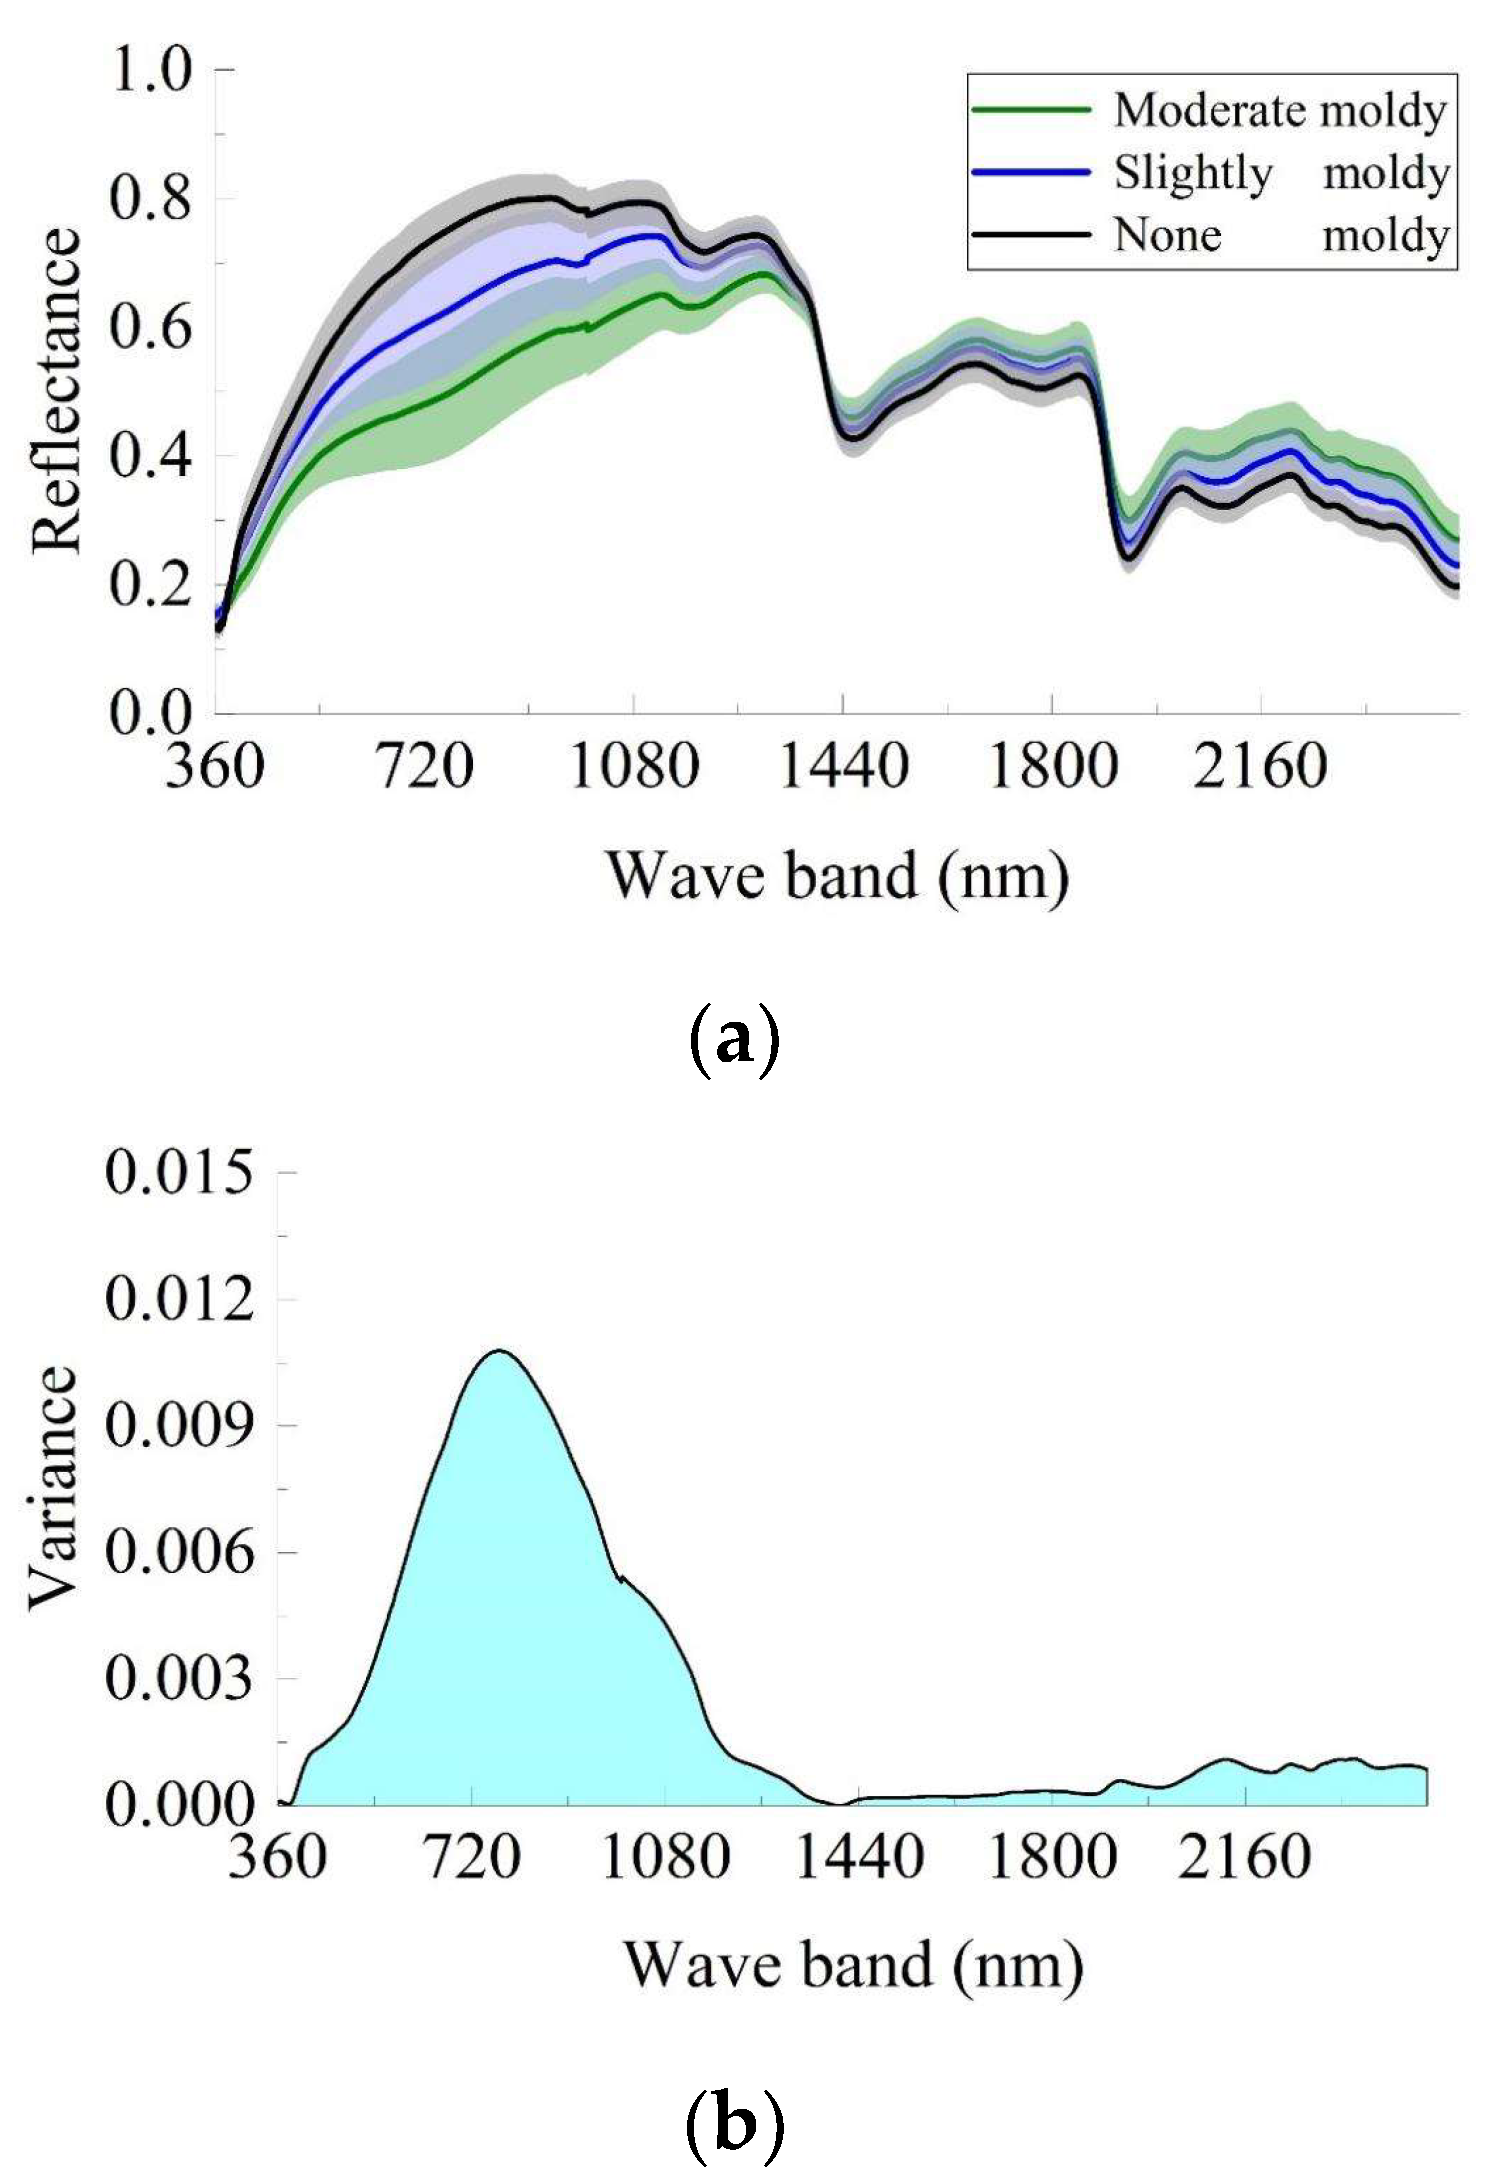
Three sets of data were collected and averaged from each PCRC sample collection area. The average reflectance spectral data curves of 153 sets of non-moldy, lightly moldy, and moderately moldy PCRC areas were collected using the existing hyperspectral detection system, as shown in Figure 8a. The specific bands with significant differences were further analyzed by calculating the variance, as Figure 8b shows the variance of the three kinds of spectra.
The maximum variance of 0.011 occurs at 780 nm in the near-infrared band, and the overall red light band (625–740 nm) region is also significant, with variance values greater than 0.007. Given the subsequent need to perform the aging process or several other functions of the machine vision research, these planning studies are mainly in the visible band, so this test still employs the visible light camera. The light source is a combination of a 650 nm red LED light source and an existing light source, which can enhance the visibility of the effect of mold in the images.
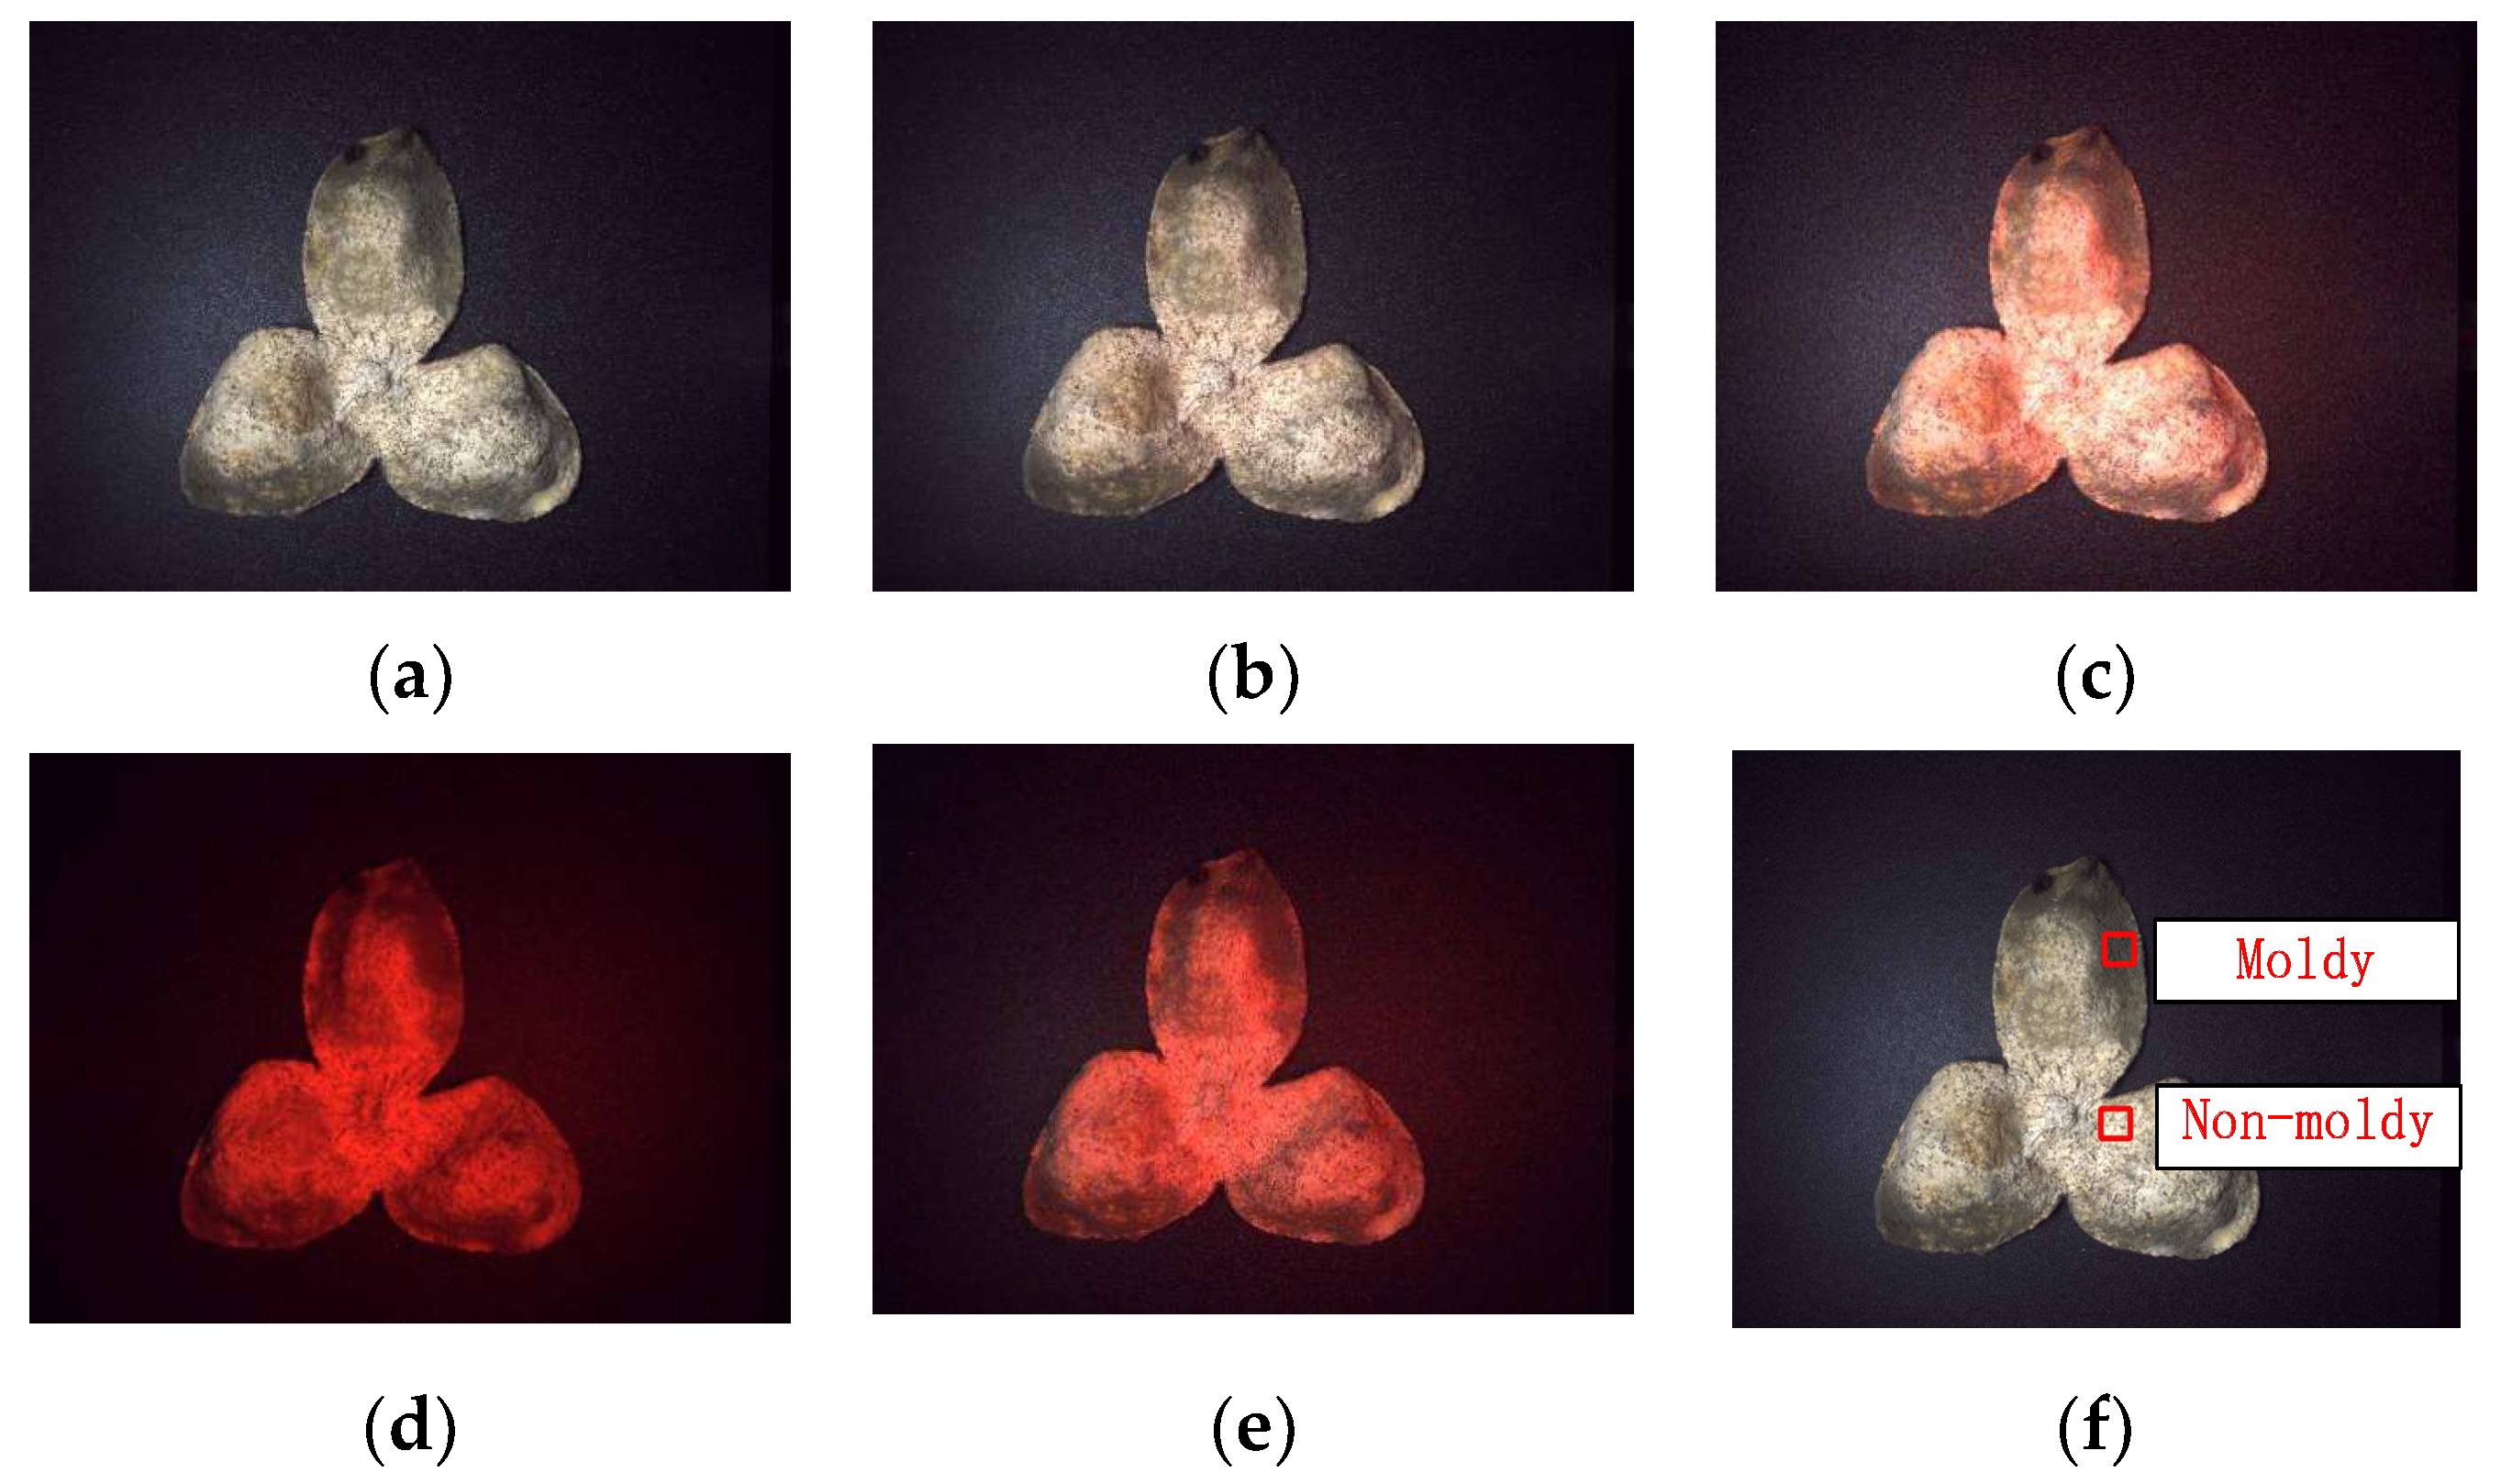
According to the results of the pre-test spectral reflectance curve, red light can be added for image acquisition to increase the contrast between the moldy and the non-moldy areas. To achieve a better red light ratio, the same type of white LED and red LED is used to design the enhancement light source, using different electrical power excitations for the red and white light ratios. The white LED and red LED are both ring distributions with the same structure, and both contain 56 beads in the same arrangement; therefore, the red LED light source has a wavelength of 650 nm. The experimental investigation was designed for the ratio selection of the enhancement light source, then the image acquisition was performed on a black carbon fiber plate in a black box, and a JHSM500m vertical 5 million color camera with a focal length of 6 mm, a shooting height of 23 cm, and a resolution of 2592 × 1944 was used. The same PCRC sample was collected and the same moldy area and non-moldy areas were dug (Figure 9f) (whilst the moldy area was measured at the upper left coordinates X = 1338, Y = 632 starting point, the non-moldy area was measured at the upper left coordinate X = 1324, Y = 1214, and both dug a rectangular area of 85 × 80 pixels).
The similarity of the color histograms of the moldy and non-moldy areas in the images of PCRC with different light source ratios was compared. Since the larger the obtained correlation value is, the higher the similarity of the color histograms is, and the smaller the image differences are, this causes a smaller correlation. It can distinguish the moldy and non-moldy areas. Based on the data a, b, and c from Table 1, when the white light electric power is constant, a higher ratio of red light electric power means a smaller correlation. The correlation of the d of the pure red light is the smallest, and thus, adding a red LED light source with a wavelength of 650 nm to the collected images can improve the difference between the moldy and non-moldy areas, thereby improving the recognition rate. Therefore, including a red light source in the subsequent UAV camera module set is critical.
Natural light environments differ due to the characteristics of different warehouses and the different times of day in the same warehouses as well as the height of the UAV and its actual distance from the PCRC. Choosing an optimal light source power is a complex problem that must be based on the actual conditions of the application site. No in-depth analysis was performed in this study and the subsequent tests were based on the laboratory simulation of a controlled environment.

3.2. Analysis of Moldy Identification Test on PCRC Samples

Currently, the more commonly used techniques for separating color image processing, which involve the different combinations of color feature factors, such as 2G-R-B, 2R-G-B, and so on, have been effective in other detection tasks [29,30,31]. However, for PCRC mildew, we used the color property to further divide the original color image into two parts for processing; the part showing green color being classified as the moldy region, and the remaining non-green region being classified as the non-moldy region. The excess red features in Equation (1) were selected for the preprocessing segmentation of the image [32].
E x R = 1.4 × R G
where R, G, and B represent the red, green, and blue components, respectively.
The main steps of the proposed method for processing the moldy PCRC images in this study are as follows:
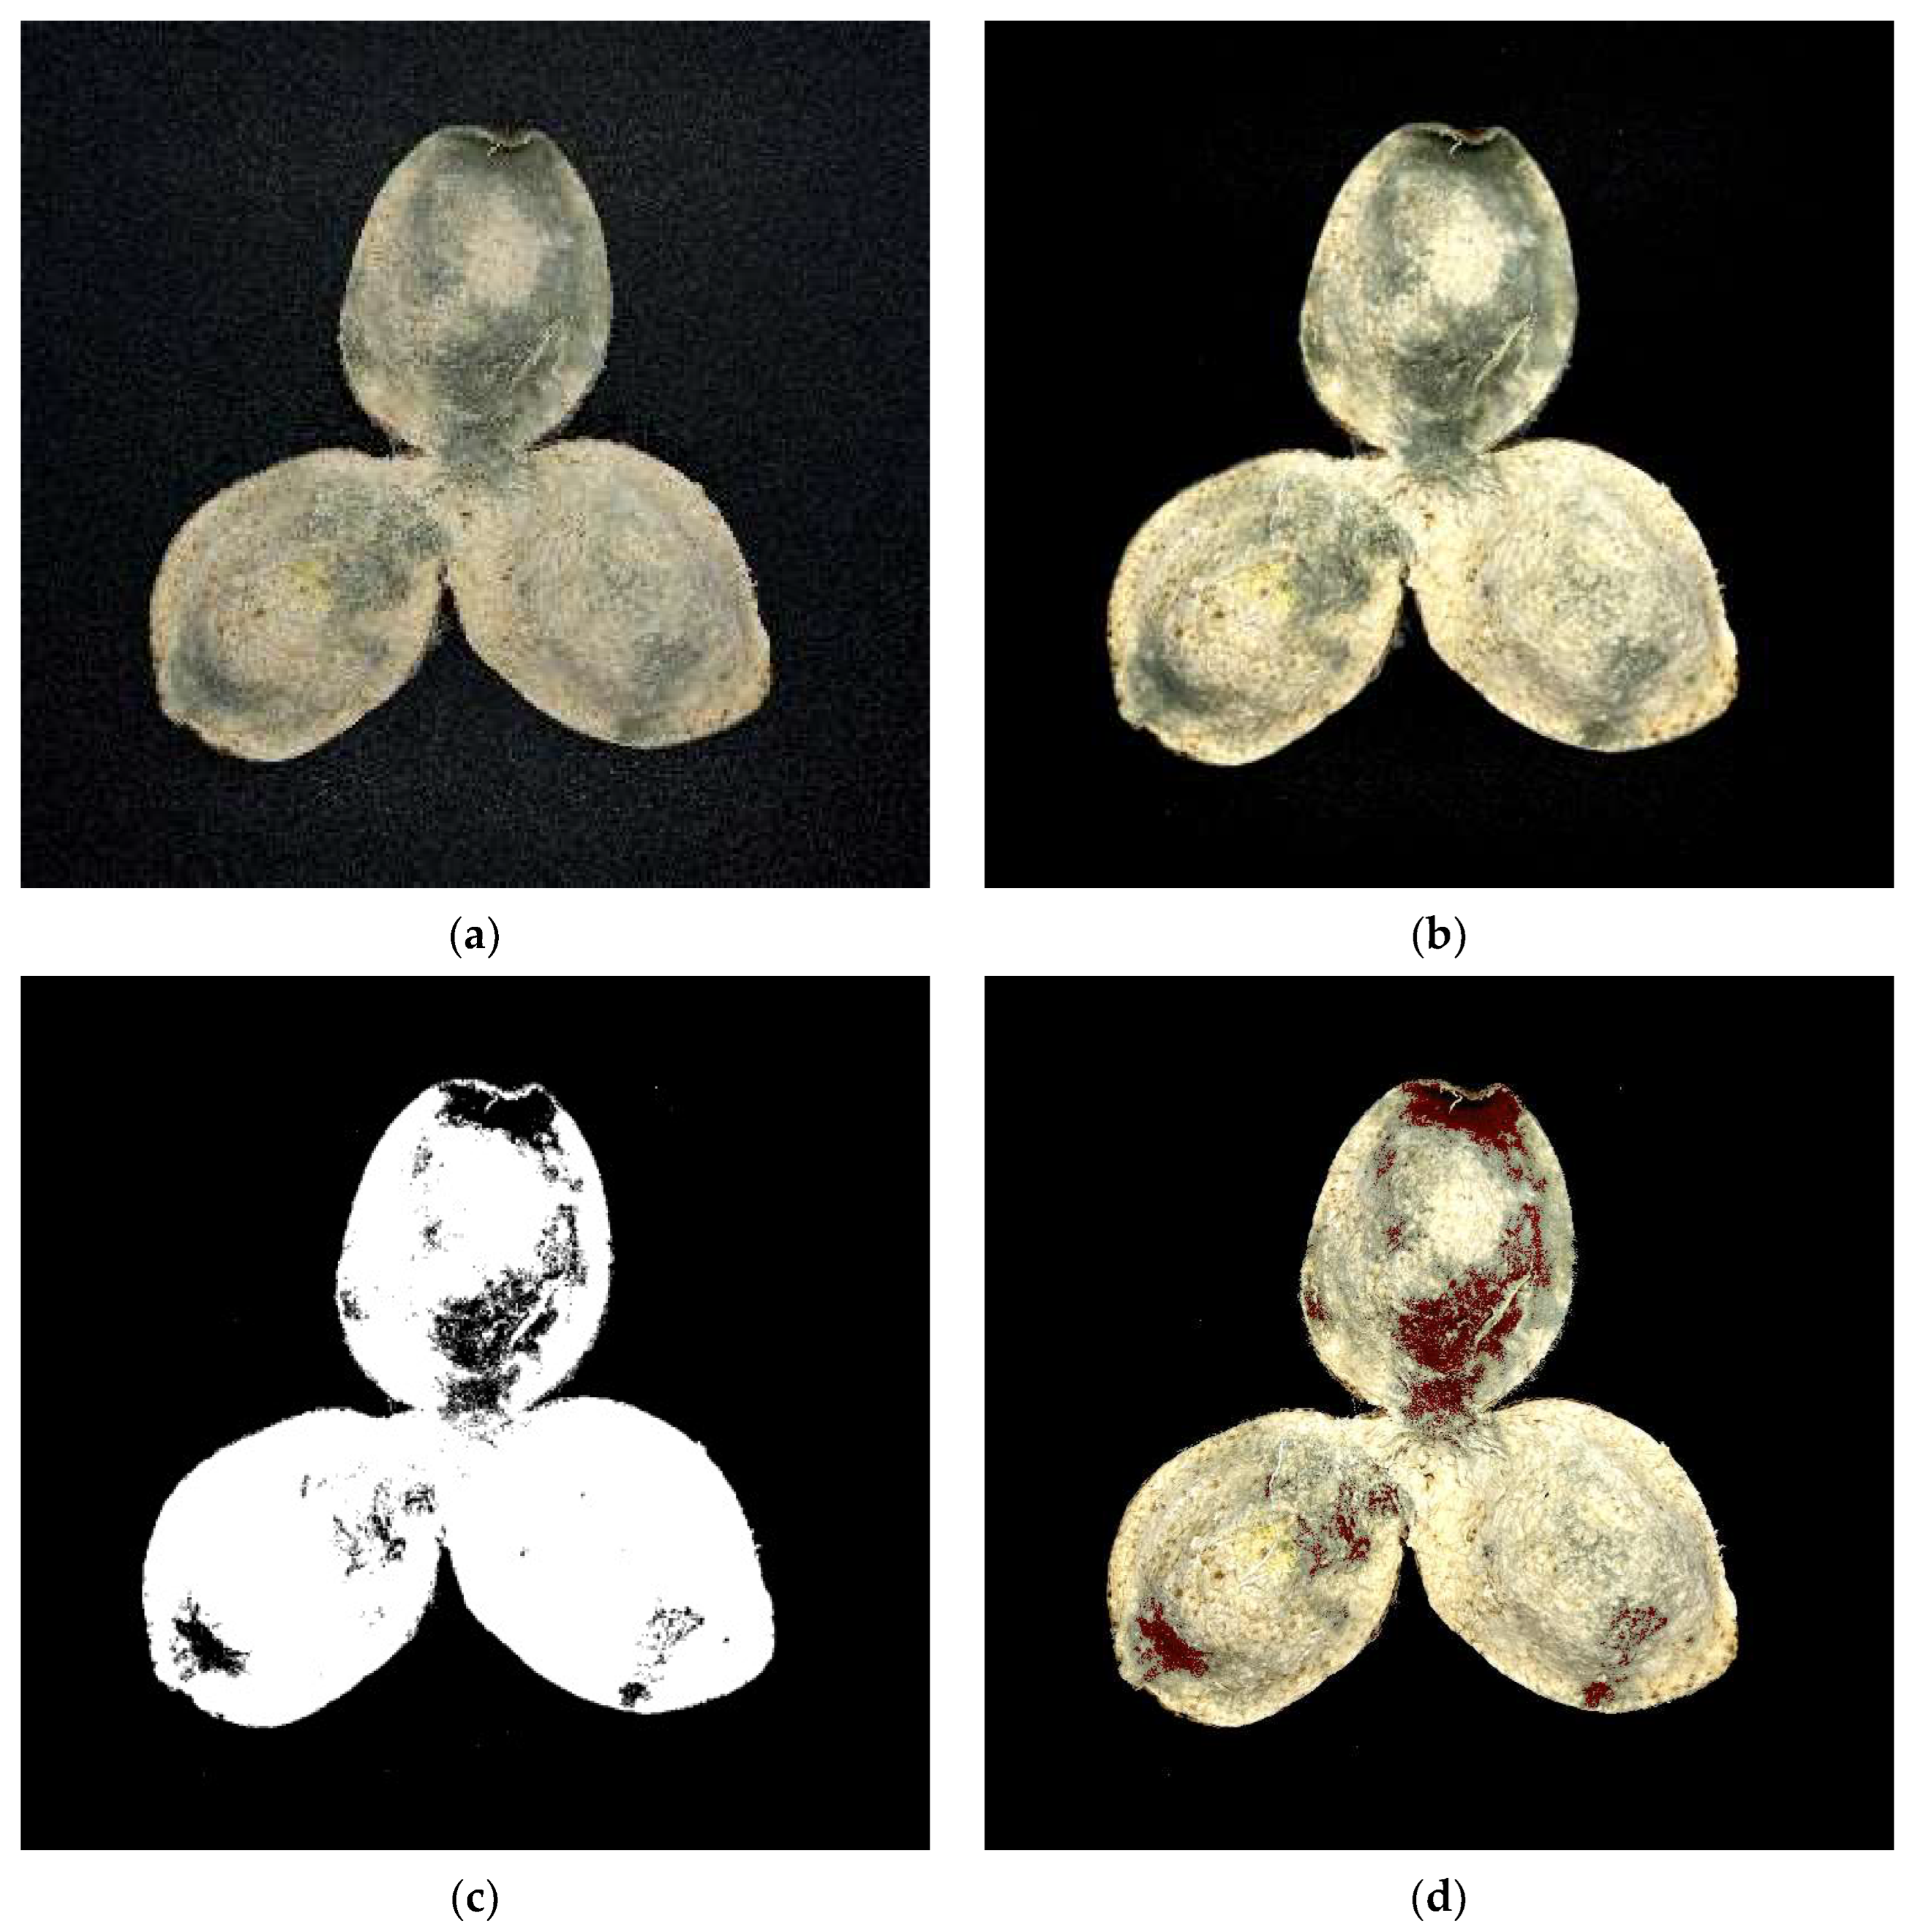
(1) Acquiring the original images; (2) Denoising the images and performing contrast adjustment based upon this; (3) Graying out the acquired color images based on the excess red (1.4R-G) feature of the images, and obtaining the binary images by threshold segmentation using the Otsu method [33]; and (4) Superimposing two images. Following the above process, the moldy region was effectively extracted with a significant effect.
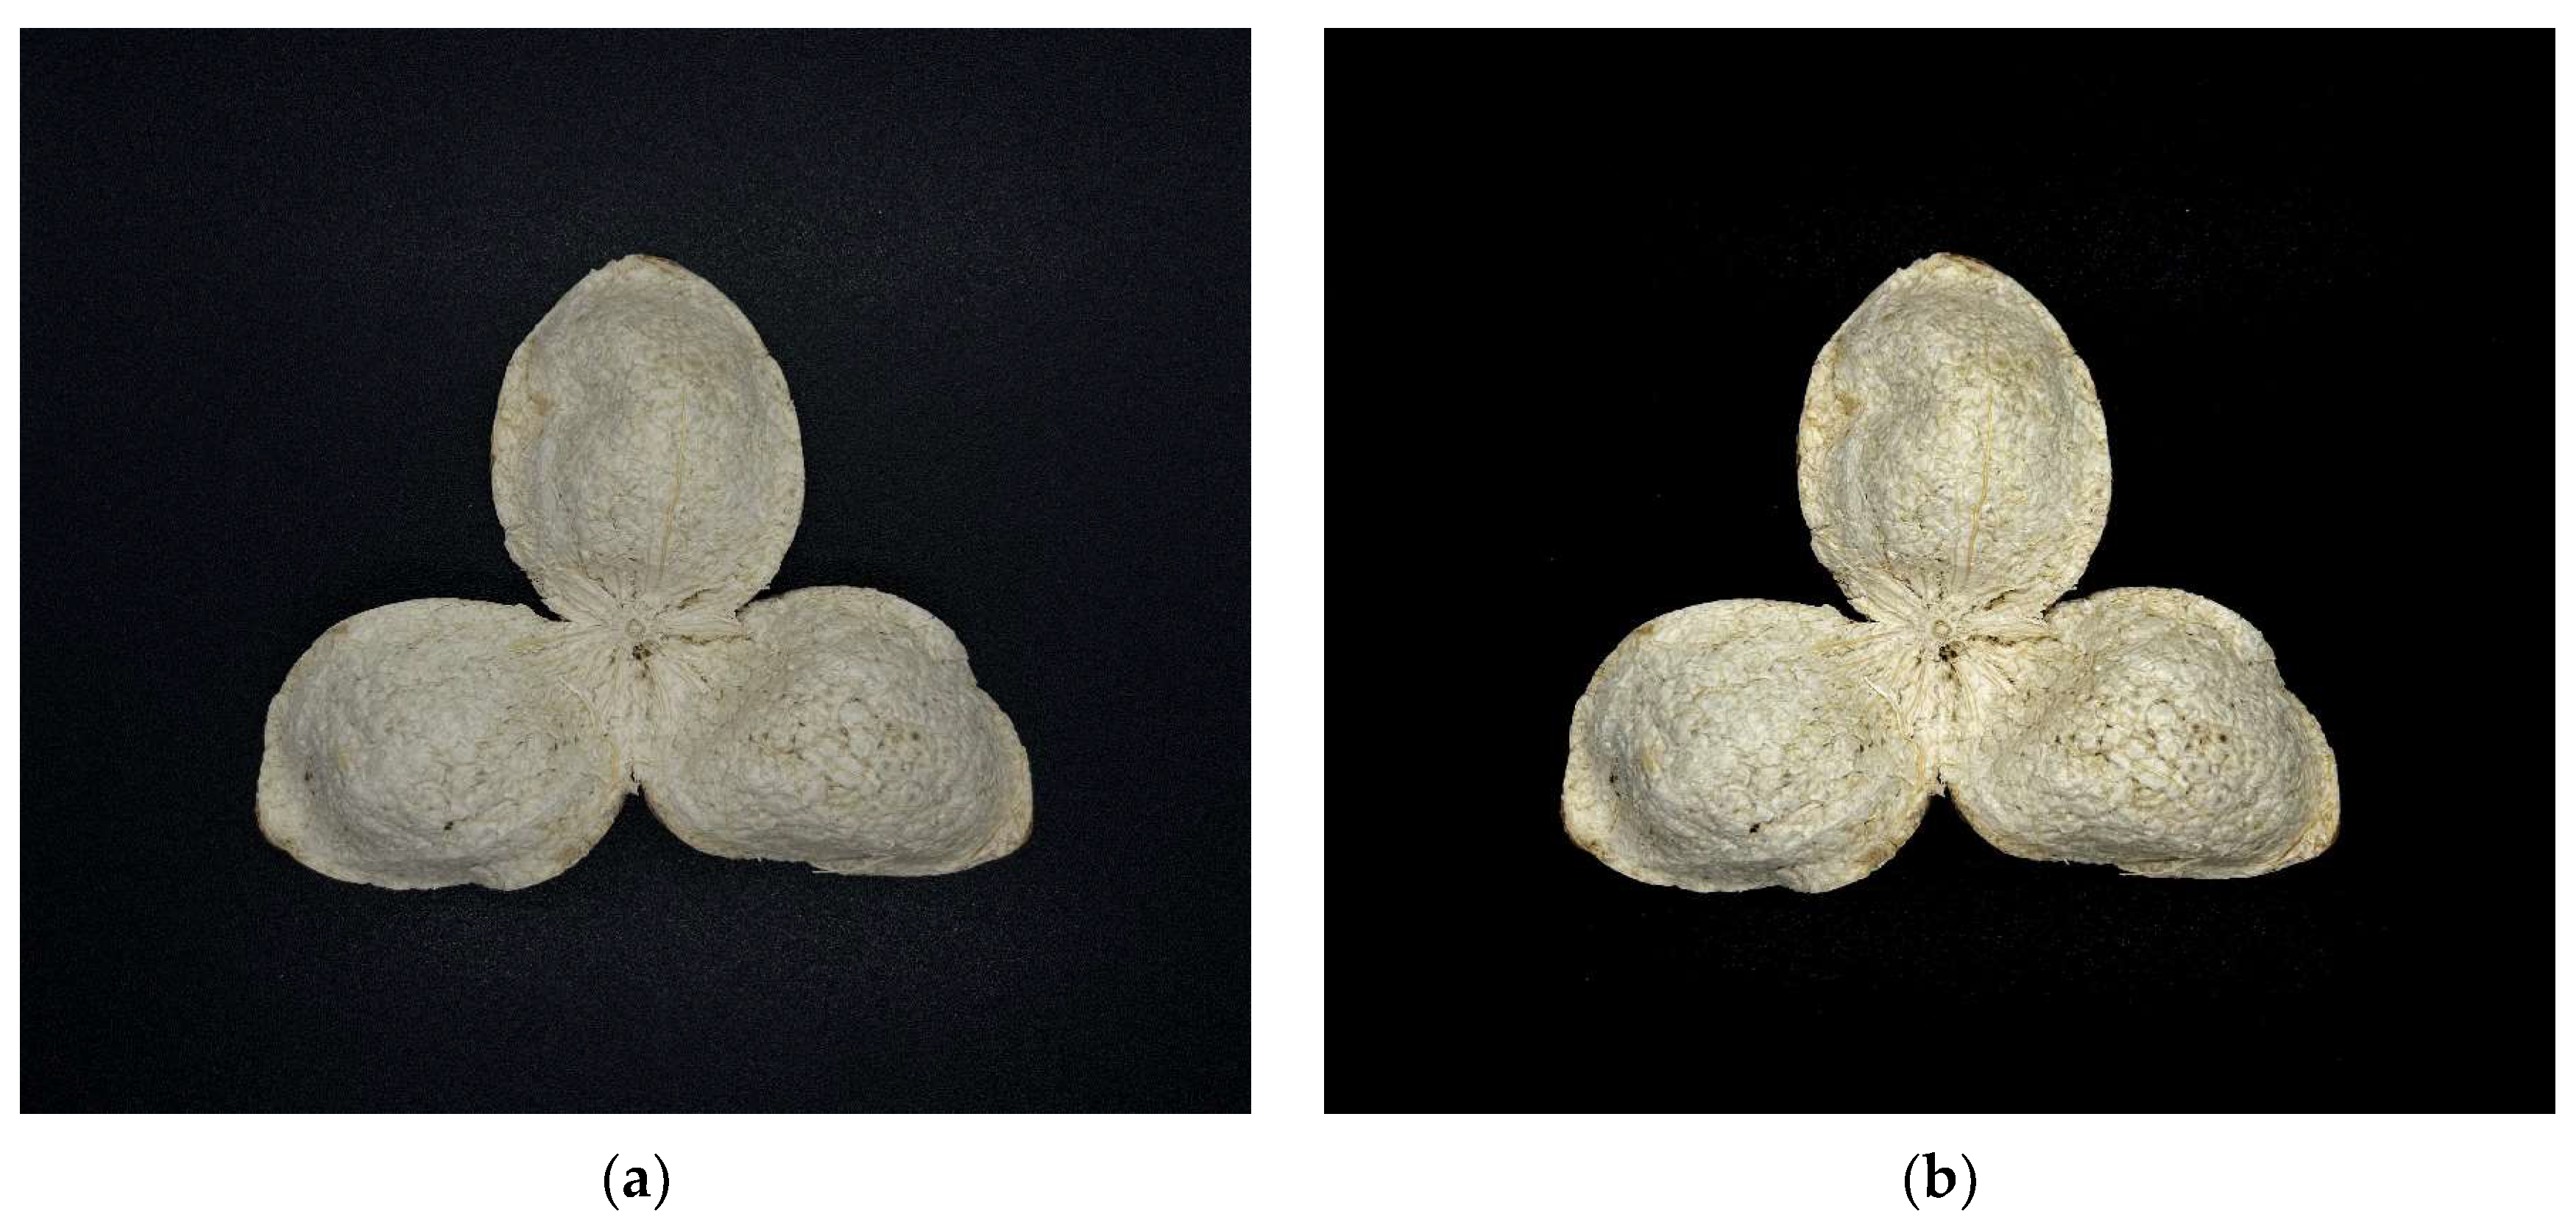
Based on Figure 10 and Figure 11, the black pixels excluding the external background are the moldy areas, and the white background is the non-moldy area. The experimental results show that the use of excess red features with the Otsu method can better segment the moldy area, and perform the necessary preparation for subsequent recognition. The misjudgment of the non-moldy PCRC was caused by the uneven shape and uneven light, so we added a special light source and obtained multiple photos from different angles to reduce this error, which will also reduce misclassification. Because PCRC itself also has some autologous scars, the miscalculations cannot be completely eliminated, but can be minimizes as described previously. Therefore, a fault-tolerant threshold value needs to be given.
After removing the moldy areas, the pixel points were iterated to calculate the pixel, and the area of interest was extracted from the entire PCRC to traverse its internal global pixel points. Then, the percentage of the non-moldy area was calculated. Given that the area of the non-moldy region (white pixel points after segmentation) was n, the entire region (internal global white pixel points) is m, and the percentage is r. The calculation equation can be obtained as follows:
r = n m × 100 %
Given the threshold value to determine whether the sample is moldy, because there is no standard instrumentation in the PCRC industry to quickly discern the degree of moldiness, it is basically executed according to expert experience. In this paper, we started from the color features, whilst the white fluffy features were difficult to be extracted, and the presence of a small amount of similarity in the color autogenous scars of PCRC was misidentified. Based on the data from Table 2, industry experts calibrated the algorithm, and the threshold value was finally selected to be 95%, resulting in the false extraction rate falling within 5%. The 5% includes misclassified pixels or real moldy spots, but the overall proportion is small, so it can meet the requirements of enterprises.
To verify the generality of the algorithm in this study for identifying moldy and non-moldy PCRC regions, fifteen different quality states of PCRC from non-moldy to moldy were collected for the discrimination test of the above model, and the statistical recognition rates are shown in Table 3.
Based on the statistics, 14 of the 15 PCRC samples had a 93.3% identification rate, which complies with the discrimination requirements. However, from the statistics, we can see that samples 1, 2, and 3 are all around this threshold, so we plotted samples 1, 2, and 3 to further analyze their differences and perform the whole pipeline works on them (Figure 12). Based on Figure 12, sample 1 and sample 3 have a small amount of mold at the edges, and whilst sample 2 had more autogenous scars, finally resulting in the ratios being located at the critical threshold and sample 3 being misclassified, the identification of the wrong place for the serial number 3, with a mold identification rate, was 95.04%, which was located at the critical threshold. This method has a low recognition rate for the white fuzz in the least serious mold, although there is some uncertainty, and it also demonstrates the effectiveness of the threshold selection; thus, in the actual classification of such PCRC, double verification by an expert is needed.

4. Conclusions and Outlook

Large PCRC warehouses are mainly concentrated in the Jiangmen area of China, for which there has been a lack of systematic research to date into rapid mold detection. The use of UAVs for the detection of mold in PCRC storage is a future development direction of intelligent warehouses. For large PCRC warehouses, different degrees of mold will bring corresponding economic losses. PCRC is so expensive that these economic losses are worth paying attention to. The location of mold is a random event and we cannot predict it. Regularly and rapidly detecting mold across the whole warehouse and reducing the corresponding economic loss due to mold is a meaningful task. Meanwhile, it is also a strong technological necessity for PCRC companies. This paper proposed a rapid detection method using UAV instead of manual detection, which can detect mold rapidly in the whole large PCRC warehouse. This study innovatively addressed this challenge, and the following points were performed in this study, which obtained useful results:
(1) To make the variables (temperature, humidity, light, etc.) controllable, we used a closed black box to build a real-time image acquisition system with controllable variables for PCRC mildew, and allowed for the design and optimization of subsequent moldy region extraction algorithms. However, there are differences within the actual storage environment, for example, the stacked images of the stored PCRC present a challenge to image segmentation and threshold selection, while the motion path planning and vibration of the UAV affect the quality of the captured images, but the recognition algorithm used in this study still has room for adjustment and optimization, and the experiment of combining the results of this study with the UAV will be the focus of subsequent research.
(2) To reduce the influence of light sources on image acquisition, we designed an enhanced light source based on the multispectral test. The statistical test data from cultivating samples with different degrees of mildew PCRC for the multispectral test showed that the difference in the band was most significant at 780 nm, whereas the overall reflectance difference in the band from 625 to 740 nm regions was more significant. The test confirmed that the enhancement of the light source enhanced the moldy recognition effect, as the addition of red light was collected after the difference between the moldy and the non-moldy areas significantly increased. However, the change in natural light during storage is uncertain, and its interaction with the ratio of the enhanced light source should be further investigated in future studies.
(3) By analyzing the color component rationing relationship between moldy and non-moldy regions, the improved excess red feature 1.4R g could effectively extract the moldy regions, the ratio of the non-moldy region to the total pixel area of PCRC was defined as the moldy judgment threshold, and 95% of the ratio was selected in our experiments with the expert opinions. The validation results showed that 14 of 15 samples were correct, with moldy samples accounting for 95.04%. Misclassification, due to the proximity of the defined value, resulted in a test accuracy rate of 93.3%. This method can meet the requirements of the rapid detection of moldy PCRC, and it provides a theoretical basis for subsequent UAVs equipped with cameras to participate in the inspection and achieve rapid automatic identification.

Author Contributions

Conceptualization, G.Y. and G.O.; Data curation, G.Y. and J.Q.; Formal analysis, G.Y.; Funding acquisition, G.Y. and J.M.; Investigation, J.Q.; Methodology, G.Y. and J.Q.; Resources, C.Z. and G.O.; Software, J.Q. and D.C.; Validation, G.Y., J.Q., H.L. and J.M.; Writing—original draft, G.Y., J.Q. and J.M.; Writing—review and editing, G.Y., J.Q., W.L. and J.M. All authors have read and agreed to the published version of the manuscript.

Funding

This research was funded by Guangdong Special Fund for Modern Agriculture Industry Technology System Innovation Teams, grant number 2019KJ125, and funded by National Natural Science Foundation of China, grant number 52205266.

Institutional Review Board Statement

Not applicable.

Informed Consent Statement

Not applicable.

Data Availability Statement

Not applicable.

Acknowledgments

The authors gratefully acknowledge the financial support of Guangdong Special Fund for Modern Agriculture Industry Technology System Innovation Teams, grant number 2019KJ125, and the fund of National Natural Science Foundation of China, grant number 52205266. The authors wish to thank their generous financial assistance.

Conflicts of Interest

C.Z. and G.O. were employee of the Jiangmen Palace International Food Inc., they provided the site and resources for this study, the research results will be used to improve their company’s warehousing conditions. This two authors have a project partnership with the corresponding author and the first author, whose all came from the South China Agricultural University. The other authors declare no conflict of interest.

References

  1. National Pharmacopoeia Commission. Pharmacopoeia of the People’s Republic of China, One Sections; China Medical Science and Technology Press: Beijing, China, 2020; pp. 199–200. [Google Scholar]
  2. Devi, K.P.; Rajavel, T.; Nabavi, S.F.; Setzer, W.N.; Ahmadi, A.; Mansouri, K.; Nabavi, S.M. Hesperidin: A promising anticancer agent from nature. Ind. Crop. Prod. 2015, 76, 582–589. [Google Scholar] [CrossRef]
  3. Pari, L.; Karthikeyan, A.; Karthika, P.; Rathinam, A. Protective effects of hesperidin on oxidative stress, dyslipidaemia and histological changes in iron-induced hepatic and renal toxicity in rats. Toxicol. Rep. 2015, 2, 46–55. [Google Scholar] [CrossRef] [Green Version]
  4. Huang, Y.; Ho, S. Polymethoxy flavones are responsible for the anti-inflammatory activity of citrus fruit peel. Food Chem. 2010, 119, 868–873. [Google Scholar] [CrossRef]
  5. Morley, K.L.; Ferguson, P.J.; Koropatnick, J. Tangeretin and nobiletin induce G1 cell cycle arrest but not apoptosis in human breast and colon cancer cells. Cancer Lett. 2007, 251, 168–178. [Google Scholar] [CrossRef]
  6. Song, B.L. Pharmacological effects of Chen Pi. J. Pract. Chin. Intern. Med. 2014, 8, 132–133. [Google Scholar]
  7. Luo, Y.; Zeng, W.; Huang, K.-E.; Li, D.-X.; Chen, W.; Yu, X.-Q.; Ke, X.-H. Discrimination of Citrus reticulata Blanco and Citrus reticulata ‘Chachi’ as well as the Citrus reticulata ‘Chachi’ within different storage years using ultra high performance liquid chromatography quadrupole/time-of-flight mass spectrometry based metabolomics approach. J. Pharmaceut. Biomed. 2019, 171, 218–231. [Google Scholar]
  8. Fu, M.; Xu, Y.; Chen, Y.; Wu, J.; Yu, Y.; Zou, B.; An, K.; Xiao, G. Evaluation of bioactive flavonoids and antioxidant activity in Pericarpium Citri Reticulatae (Citrus reticulata ‘Chachi’) during storage. Food Chem. 2017, 230, 649–656. [Google Scholar] [CrossRef]
  9. Yi, L.; Xie, P.; Liang, Y. Validity test of parlance “Pericarpium Citri Reticulatae, the older the bette” by GC/MS and HPLC. Chin. Pharm. J. Beijing 2005, 40, 1610. [Google Scholar]
  10. Zhang, L.; Zhou, J.; Zhu, Y.; Zhang, S.H. Comparative analysis on the chemical components of pericarpium Citri Reticulatae, citrus peels and fermented citrus peels with HPLC-DAD-ESI-MSn and GC-MS. Food Ferment. Ind. 2013, 39, 192–199. [Google Scholar]
  11. Yan, G.Q.; Qu, J.L.; Ou, G.L.; Mo, J.S.; Zhong, C.M.; Chen, D.Y.; Liu, Q.H.; Zhang, D.F. Current situation and countermeasures of drying and storage technology and equipment of Citrus reticulata ‘Chachi’. J. South. Agric. 2021, 52, 2543–2553. [Google Scholar]
  12. Yan, H.J.; Zhuo, Y.; Li, M.N.; Wang, Y.L.; Guo, H.; Wang, J.J.; Li, C.S.; Ding, F. Alfalfa yield prediction using machine learning and UAV multispectral remote sensing. Trans. Chin. Soc. Agric. Eng. 2022, 38, 64–71. [Google Scholar]
  13. Tao, H.L.; Xu, L.J.; Feng, H.K.; Yang, G.; Yang, X.; Miao, M.; Dai, Y. Estimation of plant height and biomass of winter wheat based on UAV digital image. Trans. Chin. Soc. Agric. Eng. 2019, 35, 107–116. [Google Scholar]
  14. Liu, Z.; Wan, W.; Huang, J.Y.; Han, Y.W.; Wang, J.Y. Estimation of peanut seedling emergence rate of based on UAV visible light image. Trans. Chin. Soc. Agric. Eng. 2018, 34, 60–71. [Google Scholar]
  15. Zhang, Y.; Liu, T.; He, J.; Yang, X.; Wang, L.; Guo, Y. Estimation of peanut seedling emergence rate of based on UAV visible light image. In Proceedings of the International Conference on Agri-Photonics and Smart Agricultural Sensing Technologies (ICASAST 2022), Zhengzhou, China, 4–6 August 2022; pp. 259–265. [Google Scholar]
  16. Su, W.; Jiang, K.; Yan, A.; Liu, Z.; Zhang, M.Z.; Wei, W. Monitoring of planted lines for breeding corn using UAV remote sensing image. Trans. Chin. Soc. Agric. Eng. 2018, 34, 92–98. [Google Scholar]
  17. Dai, J.G.; Zhang, G.S.; Guo, P.; Zeng, Y.J.; Cui, M.N.; Xue, J.L. Classification method of main crops in northern Xinjiang based on UAV visible waveband images. Trans. Chin. Soc. Agric. Eng. 2018, 34, 122–129. [Google Scholar]
  18. Frachtenberg, E. Practical drone delivery. Computer 2019, 52, 53–57. [Google Scholar] [CrossRef]
  19. Wang, P.C.; Duan, F.; Song, H.T.; Wang, S.; Ma, Y.C. An overview of the U.S. air-launched UAV program. In Proceedings of the 2020 Annual Academic Conference, Science and Technology Committee of China Academy of Spaceflight Electronics Technology, Chengdu, China, 26–28 November 2020. [Google Scholar]
  20. Xiao, B. Research on Warehouse Cargo Defect Detection System Based on UAV Vision; Southwest University of Science and Technology: Mianyang, China, 2021. [Google Scholar]
  21. Wang, J. Research and Implementation of a Quadrotor UAV Warehouse Inventory System Based on Machine Vision. Master’s Thesis, Southwest University of Science and Technology, Mianyang, China, 2021. [Google Scholar]
  22. Zhu, M.Y.; Yang, H.B.; Li, Z.W. Early detection and identification of rice sheath blight disease based on hyperspectral image and chlorophyll content. Spectrosc. Spect. Anal. 2019, 39, 1898–1904. [Google Scholar]
  23. Huang, S.P.; Qi, L.; Ma, X.; Xue, K.N.; Wang, W.J. Grading method of rice panicle blast severity based on hyperspectral image. Trans. Chin. Soc. Agric. Eng. 2015, 31, 212–219. [Google Scholar]
  24. Chen, Y.J.; Zhang, J.X.; Li, W.; Ren, Y.X.; Tan, Y.Z. A machine vision-based method for grading the maximum cross-sectional diameter of apples. J. Agric. Eng. 2012, 28, 284–288. [Google Scholar]
  25. Bu, X.Y. Research on Crop Disease Identification Method Based on Leaf Images. Master’s Thesis, Hefei University of Technology, Hefei, China, 2019. [Google Scholar]
  26. Blasco, J.; Aleixos, N.; Moltó, E. Computer vision detection of peel defects in citrus by means of a region oriented segmentation algorithm. J. Food Eng. 2007, 81, 535–543. [Google Scholar] [CrossRef]
  27. Diao, Z.H.; Wang, H.; Song, Y.M.; Wang, Y.P. A color and shape feature-based image segmentation method for cotton pest mites. Agric. Mech. Res. 2013, 30, 177–180. [Google Scholar]
  28. Zhang, N.N.; Liu, W.; Wang, W.; Lu, W.L.; Yuan, N. Research on the detection method of corn grain mold degree based on image processing. Chin. J. Cereals Oils 2015, 30, 112–116. [Google Scholar]
  29. Long, Z.; Jiang, Q.; Wang, J.; Zhu, H.; Li, B.; Wen, F. Research on method of tea flushes vision recognition and picking point localization. Transducer Microsyst. Technol. 2022, 2, 41–45. [Google Scholar]
  30. Arribas, J.I.; Sánchez-Ferrero, G.V.; Ruiz-Ruiz, G.; Gómez-Gil, J. Leaf classification in sunflower crops by computer vision and neural networks. Comput. Electron Agric. 2011, 78, 9–18. [Google Scholar] [CrossRef]
  31. Zhao, J.H.; Luo, X.W.; Zhou, Z.Y. A method of sugarcane disease image segmentation based on color and shape features. J. Agric. Mach. 2008, 39, 100–103. [Google Scholar]
  32. Pérez, A.; López, F.; Benlloch, J.; Christensen, S. Colour and shape analysis techniques for weed detection in cereal fields. Comput. Electron. Agric. 2000, 25, 197–212. [Google Scholar] [CrossRef]
  33. Otsu, N. A threshold selection method from gray-level histograms. IEEE Trans. Syst. Man Cybern. 1979, 9, 62–66. [Google Scholar] [CrossRef] [Green Version]
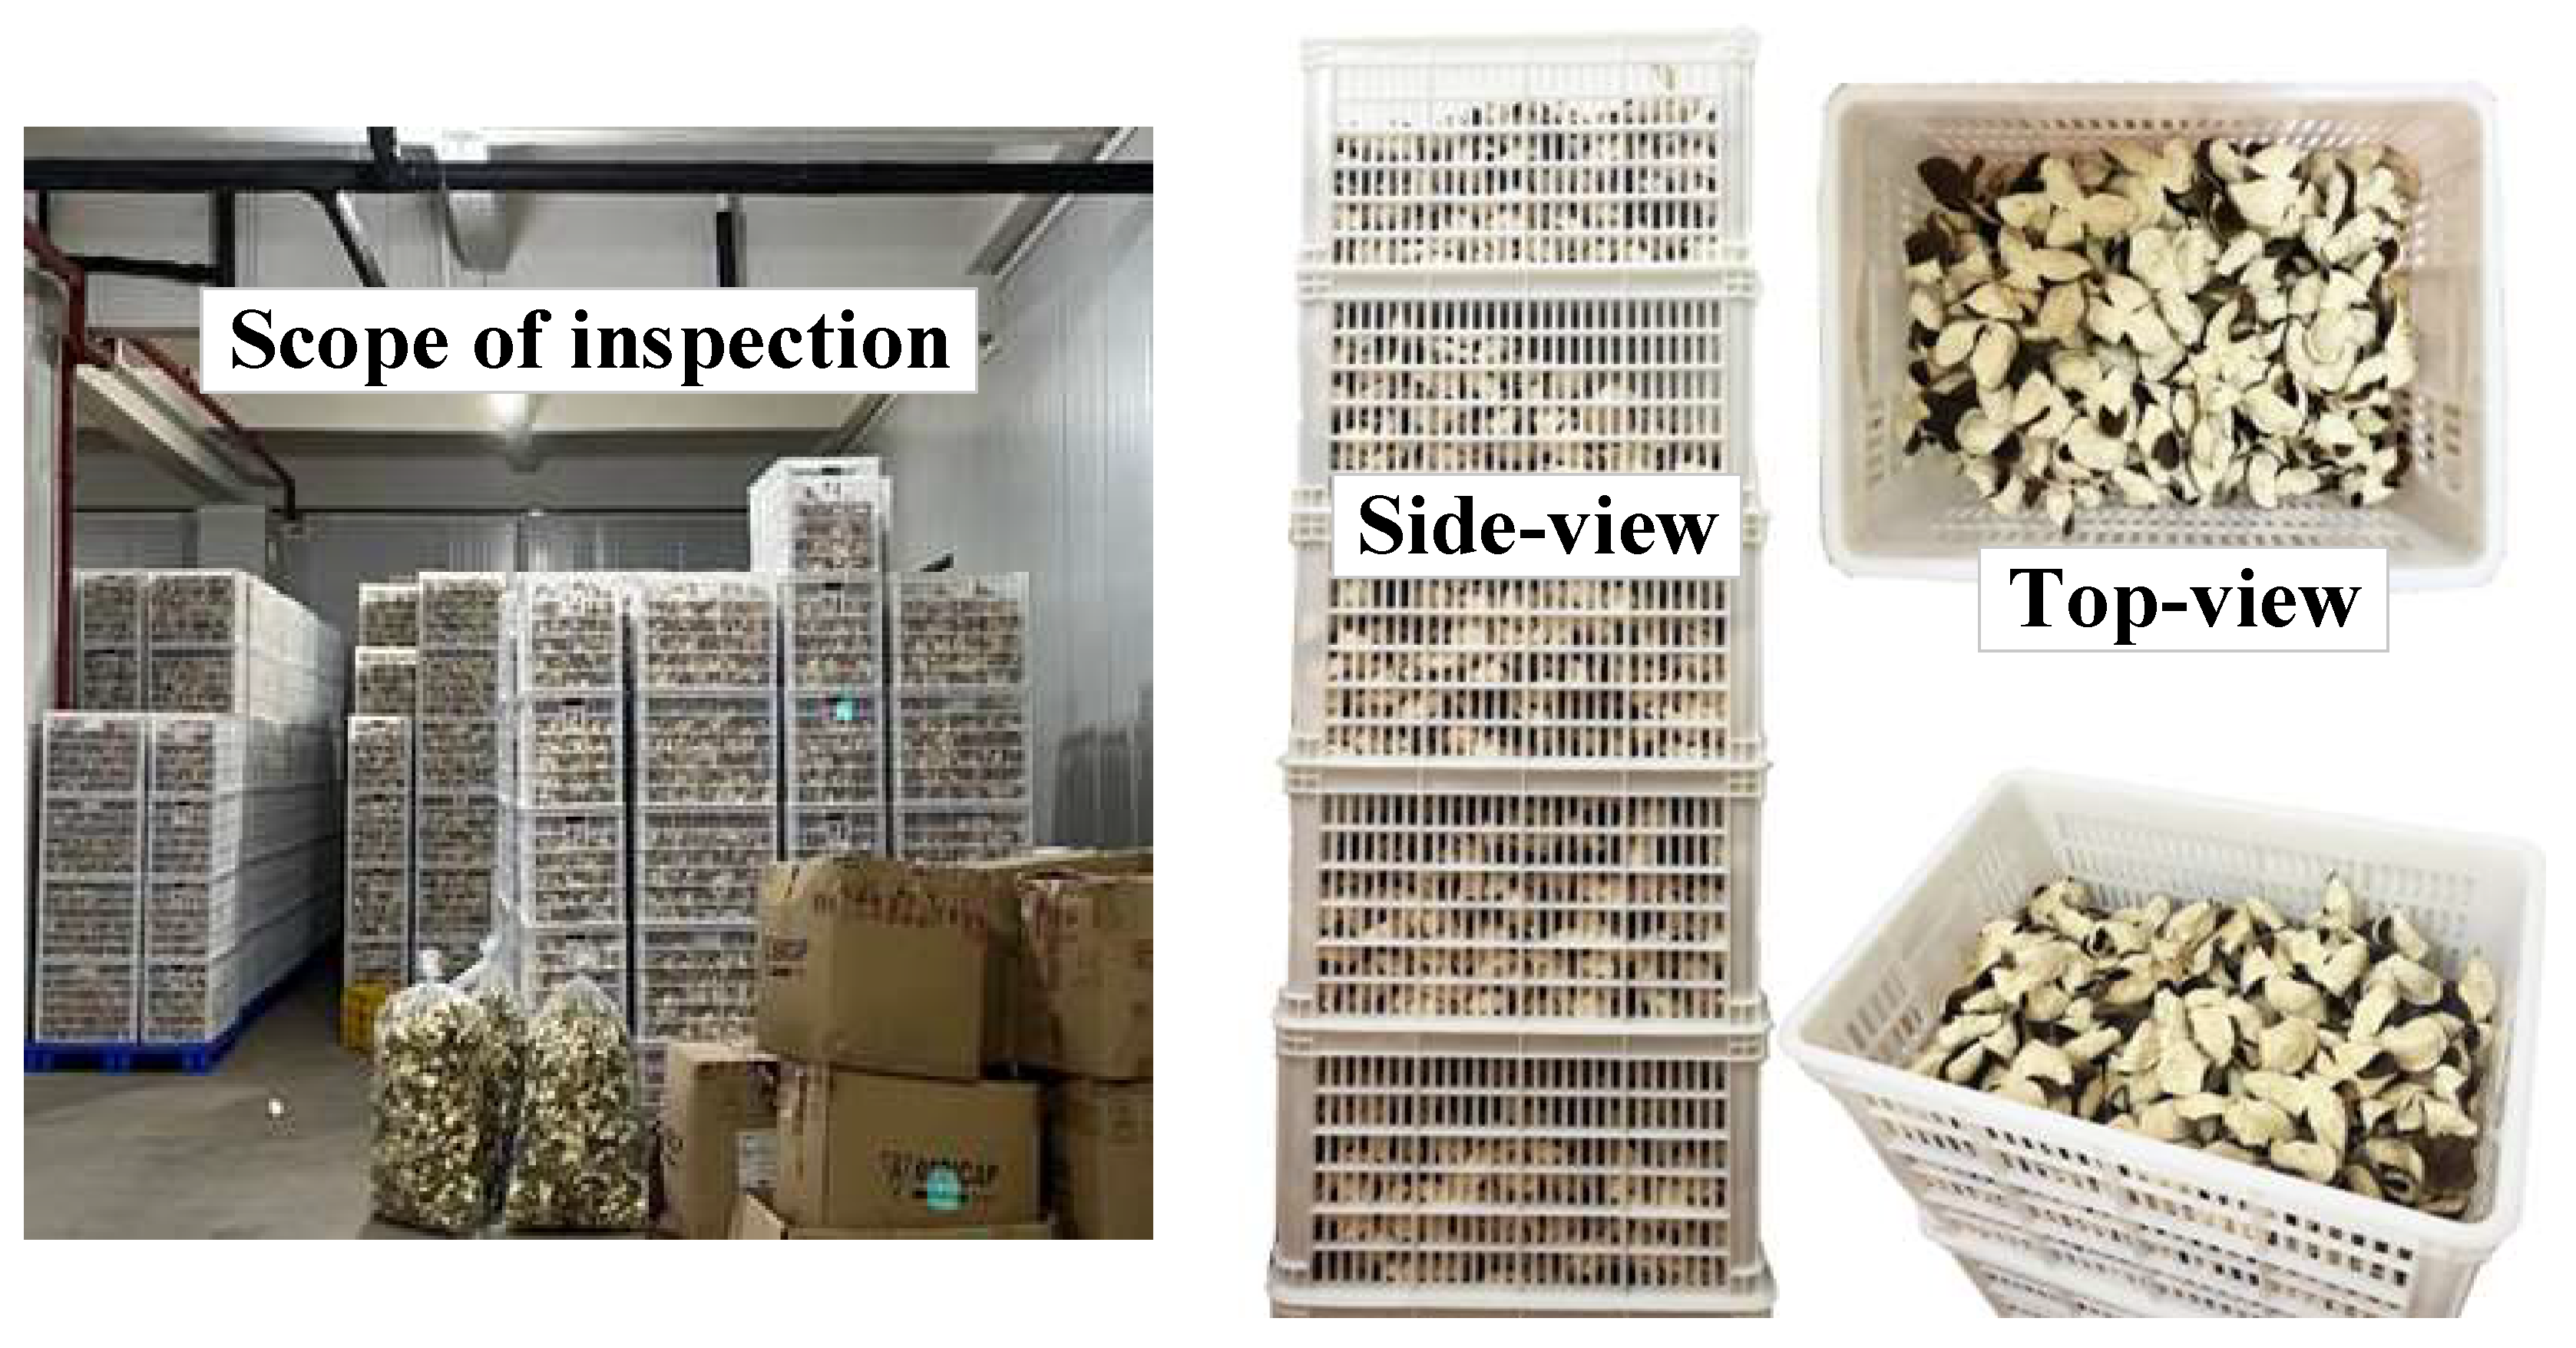
Figure 1. Common storage method and storage container of PCRC manufacturers in Xinhui.
Agriculture 13 00528 g001
Figure 2. UAV inspection program diagram.
Agriculture 13 00528 g002
Figure 3. (a) Actual view of PCRC warehouse (flight safety distance); and (b) Actual view of PCRC warehouse (dark environment).
Agriculture 13 00528 g003aAgriculture 13 00528 g003b
Figure 4. Moldy PCRC samples collection areas graded according to their degree of mold. (I) non-moldy in area; (II) lightly moldy in area, (III) moderately moldy in area.
Agriculture 13 00528 g004
Figure 5. Physical image of the multi-spectrum test platform.
Agriculture 13 00528 g005
Figure 6. PCRC mildew environmental experiment box.
Agriculture 13 00528 g006
Figure 7. The structure of PCRC identification.
Agriculture 13 00528 g007
Figure 8. (a) Average reflectance spectral analysis curve. (b) Variance spectral analysis curve. S 2 = i = 1 n ( x i x ) 2 n .
Agriculture 13 00528 g008
Figure 9. Various light sources of the PCRC moldy sample pictures. (a) Image under white light electric power 360 mW; (b) Image under white light electric power 360 mW and red light electric power 195 mW; (c) Image under white light electric power 360 mW and red light electric power 360 mW; (d) Image under red light electric power 360 mW; (e) Image under white light electric power 195 mW and red light electric power 360 mW; (f) The moldy area and non-moldy areas were dug in original image.
Agriculture 13 00528 g009
Figure 10. Image characterization of a non-moldy PCRC sample. (a) Original image of PCRC without mildew; (b) Image after denoising and contrast optimization; (c) Image segmented by EXR and Otus methods; (d) The stacking image sample.
Agriculture 13 00528 g010aAgriculture 13 00528 g010b
Figure 11. Image characterization of a moldy PCRC sample. (a) Original image of moldy PCRC; (b) Image after denoising and contrast optimization; (c) Image segmented by EXR and Otus methods; (d) The stacking image sample.
Agriculture 13 00528 g011
Figure 12. Image characterization of PCRC samples 1, 2, and 3. (a) Original image; (b) Image after denoising and contrast optimization; (c) Image segmented by EXR and Otus methods; and (d) The stacking image.
Agriculture 13 00528 g012
Table 1. Analysis of the difference between non-moldy and moldy areas under multiple light sources.
No.White Light Electric Power/mWRed Light Electric Power/mWCorrelation
a36000.00319
b3601950.00288
c3603600.00244
d03600.00036
e1953600.00129
Table 2. Identification ratio.
PCRC QualityNon-Moldy Area nAll Areas mRatio r (%)
Non-moldy1,619,4281,627,74699.49%
Non-moldy1,297,7191,313,75898.78%
Non-moldy1,381,3731,409,75097.99%
Moldy1,600,7671,693,61294.52%
Table 3. Experimental results after recognition algorithm processing.
No.Ratio (%)Identification ResultsActual Results
194.74%MoldyMoldy
295.11%Non-moldyNon-moldy
395.04%Non-moldyMoldy
485.03%MoldyMoldy
590.76%MoldyMoldy
696.61%Non-moldyNon-moldy
790.12%MoldyMoldy
889.87%MoldyMoldy
996.92%Non-moldyNon-moldy
1090.66%MoldyMoldy
1168.02%MoldyMoldy
1293.55%MoldyMoldy
1391.10%MoldyMoldy
1490.68%MoldyMoldy
1584.09%MoldyMoldy
Disclaimer/Publisher’s Note: The statements, opinions and data contained in all publications are solely those of the individual author(s) and contributor(s) and not of MDPI and/or the editor(s). MDPI and/or the editor(s) disclaim responsibility for any injury to people or property resulting from any ideas, methods, instructions or products referred to in the content.