Article

Prospects for Biodiesel Production from Emerging Algal Resource: Process Optimization and Characterization of Biodiesel Properties

1
Department of Biotechnology, Lahore College for Women University, Lahore 35200, Pakistan
2
Dr. Muhammad Ajmal Khan Institute of Sustainable Halophyte Utilization, University of Karachi, Karachi 75270, Pakistan
3
Department of Applied Sciences, University of the West of England, Bristol BS16 1QY, UK
4
Department of Botany, University of Karachi, Karachi 75270, Pakistan
5
Department of Botany, Division of Science and Technology, University of Education, Lahore 54770, Pakistan
6
Department of Applied Biology, College of Sciences, University of Sharjah, Sharjah P.O. Box 27272, United Arab Emirates
7
Department of Agricultural and Forest Sciences (DAFNE), University of Tuscia, 01100 Viterbo, Italy
8
Department of Chemical, Pharmaceutical and Agricultural Sciences (DOCPAS), University of Ferrara, 44121 Ferrara, Italy
*
Authors to whom correspondence should be addressed.
Agriculture 2023, 13(2), 407; https://doi.org/10.3390/agriculture13020407
Submission received: 24 December 2022 / Revised: 24 January 2023 / Accepted: 7 February 2023 / Published: 9 February 2023

Abstract

:
The present work focuses on the optimization of the energy conversion process and the use of algal resources for biodiesel production with ultrasound and microwave techniques in Oedogonium, Oscillatoria, Ulothrix, Chlorella, Cladophora, and Spirogyra for the first time. The fuel properties are investigated to optimize the efficiency of the newly emerging algal energy feedstock. The study indicates that the optimized microwave technique improves the lipid extraction efficiency in Oedogonium, Oscillatoria, Ulothrix, Chlorella, Cladophora, and Spirogyra (38.5, 34, 55, 48, 40, and 33%, respectively). Moreover, the ultrasonic technique was also effective in extracting more lipids from Oedogonium sp., Oscillatoria sp., Ulothrix sp., Chlorella, Cladophora sp., and Spirogyra sp. (32, 21, 51, 40, and 36%, respectively) than from controls, using an ultra-sonication power of 80 kHz with an 8-min extraction time. The fatty acid composition, especially the contents of C16:0 and C18:1, were also enhanced after the microwave and sonication pretreatments in algal species. Enhancement of the lipids extracted from algal species improved the cetane number, high heating value, cold filter plugging point, and oxidative stability as compared to controls. Our results indicate that the conversion of biofuels from algae could be increased by the ultrasound and microwave techniques, to develop an eco-green and sustainable environment.

Graphical Abstract

1. Introduction

Many countries are expected to undergo rapid urbanization over the next 25 years, which will influence their food, water, and land demands [1]. Only 2.8% of available water is suitable for human consumption [2], whereas, the remaining 97.2% is in the oceans and is too salty to use. Due to high salinity levels, approximately 1.5 million hectares of land are unfertile now for plant cultivation. These global megatrends of climate change and the growing production of energy from edible crops have created a significant food crisis [3].
The contribution of renewable energy is predicted to increase up to 63% by 2050. Biodiesels are renewable, highly biodegradable, and non-toxic, and thus are considered as favorable alternative fuels [4]. Edible crops such as coconut, soybean oil palm, and sun-flower, and non-edible feedstocks such as Jatropha, Miscanthus, rubber seed, waste frying oil, and Pongamia can be used for biodiesel production [5]. Compared to these traditional feedstocks, microalgae are considered as an alternative feedstock for third generation biofuels [6]. They have high photosynthetic capacities, able to trap 1.83 kg of CO2 per kg of biomass [7] and convert it into glucose and oxygen by photosynthesis. As compared to terrestrial crops, algae can produce 30–100 times more energy/hectare, with a potential biodiesel yield of 12,000 L/h [8]. Intracellular lipids are the main metabolites of microalgae which can be used as a feedstock for biodiesel production. Some microalgae contain up to 70% lipids, compared to 20–40% for typical oilseeds. The extracted lipids are converted into biodiesel by trans-esterification. Lipid extraction is the major step in biodiesel production [9], but it is subject to many challenges related to energy conversion and conservation and the optimal use of energy resources due to the structure of the algal cell wall. This is composed of hemi-cellulose and cellulose, together with glycoproteins, that possess high mechanical and chemical resistances that hamper the release of intracellular lipids [10,11]. The oil extraction methods for energy conversion from oil-bearing seeds are quite different to those required for algae, and hence, a fundamental understanding of lipid enhancement needs to be established to develop efficient and cost-effective strategies for oil extraction.
Lipid conversion to biodiesel from algal feedstocks depends upon an effective biomass disruption method to improve oil recovery and optimization of the energy processes [12]. Chemical-mediated extraction can cause bio-toxicity, lipid degradation, and device corrosion. A large quantity of energy is consumed by thermal disruption, while enzymatic degradation is very expensive. Mechanical methods (microwave, sonication, and hydrodynamic cavitation) are eco-friendly and non-toxic to the environment, and can disrupt the algal cells efficiently. Microwave assisted solvent extraction has shown significantly higher lipid recovery than solvent extraction alone [13]. Microwave assistance increases the lipid recovery from all solvent extraction methods (Hara and Radin’s [14], Folch’s [15], Chen’s [16], and Bligh and Dyer’s [17]). Direct lipid extraction is time consuming, whereas MAE takes a few minutes and uses ten times less solvent. In ultrasound-assisted extraction (UAE), the sample’s cells are ruptured by using ultrasound of frequency > 20 kHz in the culture medium, which generates repetitive regions of high pressure (compressions) and low pressure (rarefactions) [18].
The conversion of the extracted lipids to biofuels is affected by temperature, pressure, and extraction time. To optimize the extraction process for energy conversion, a good understanding of the complex relationship between the factors affecting lipid extraction is crucial [19]. Response surface methodology (RSM) is a powerful statistical technique for simultaneous consideration of independent variables and their interactions that affect an objective function [20]. Response Surface Methodology (RSM) based on Central Composite Design (CCD) has been used to design experiments and develop quadratic equation models to predict the optimum conditions for desirable responses [21]. In the current study, RSM with CCD has been applied to optimize various factors (power, heating time, and extraction time) for lipid extraction (response) from Oedogonium sp., Oscillatoria sp., Ulothrix sp., Chlorella sp., Spirogyra sp., and Cladophora sp., using MAE and UAE pretreatments, to evaluate whether these parameters have any significant effect on the percentage of lipid extracted.
In our previous study, 24% lipid was extracted from Oedogonium sp., 21% from Oscillatoria sp., 48% from Ulothrix sp., 33% from Chlorella sp., 23% from Cladophora sp., and 14% from Spirogyra sp., without pretreatment [22]. In the current study it was demonstrated that the extraction of microalga lipids, and their conversion to biodiesel, were significantly higher following pretreatment using MAE and UAE. No study has been attempted to use microwave and sonication pre-treatment techniques on Oedogonium sp., Oscillatoria sp., Ulothrix sp., Chlorella sp., Cladophora sp., and Spirogyra sp. to enhance the extraction of lipids and their conversion to biodiesel with a high heating value, cetane number, and oxidative stability [23]. The results of the present study demonstrate that MAE and UAE are an effective pretreatment to improve lipid recovery and fuel properties from algae, as compared with a previous study with a relatively short extraction time, and are essential for maintaining a good quality of lipid conversion to biofuel production [22,24]. Therefore, it is important to characterize algal resources for bioenergy productions by using their fatty acid profile and fuel values and their extraction methods. Therefore, the objectives of the study include: (1) Modelling and optimization of microwave and sonication pre-treatment parameters using the response surface method; (2) Evaluation of the effects of pretreatment on the fatty acid composition and on the fuel properties of algal biomass.

2. Materials and Methods

2.1. Algae Collections

Oedogonium sp., Oscillatoria sp., Ulothrix sp., Chlorella sp., Cladophora sp., and Spirogyra sp. were collected at different localities of Lahore, Pakistan. Supplementary Table S1 describes the algal characteristics. All these six algal strains were selected on the basis of abundance, high lipid contents, growth rate, adaptation to the environmental conditions, and high biomass productivity [24].

2.2. Molecular Identification

Further species of algae were collected from different areas of Punjab, Pakistan. Eight algal strains were selected on the basis of morphology and identified by matching 18SrDNA and ITS region. After DNA extraction the 18SrDNA gene was amplified and sequenced by Macrogen, then the sequences were used to draw a phylogenetic tree using the MEGA6 software (Molecular Evolutionary Genetics Analysis, Version 6, Tokyo, Japan) [25].

2.3. Cultivation and Harvesting

The algal species were cultivated in Blue Green medium with pH 7, at 25 °C, and a 16 h:8 h light dark cycle. Algal biomass was harvested by centrifugation at 1800× g for 5 min and the pellets were used for pretreatment [10]. The experimental workflow is illustrated in Figure 1.

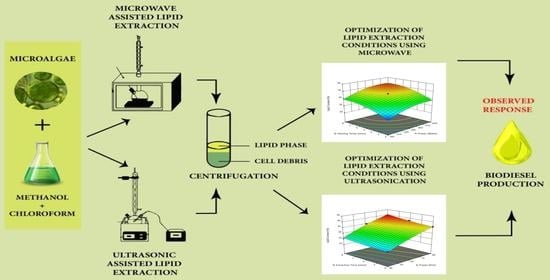
2.4. Microwave Assisted Lipid Extraction

A weight of 0.2 g of the dried algal samples (Oedogonium sp., Oscillatoria sp., Ulothrix sp., Chlorella sp., Cladophora sp., and Spirogyra sp.) was suspended in 30 mL of chloroform/methanol (2:1, v/v). The samples were treated by microwave with 180–600 watts power, 2–8 min heating, and 3–4 h extraction time. The mixture was centrifuged at 8000 rpm for 10 min, the supernatant was filtered, and then the filtrate was dried in the oven at 40 °C. The lipid contents were calculated as a percentage of the dry weight of the sample.
L i p i d   c o n t e n t   ( % ) = ( w e i g h t   o f   l i p i d s / w e i g h t   o f   s a m p l e s ) × 100

2.5. Ultrasonic Assisted Lipid Extraction

Dried algal sample (0.2 g) was added to 30 mL of chloroform/methanol (2:1, v/v). The sample was treated by ultrasound at 40–80 kHz with 4–8 min extraction time. The mixture was centrifuged at 8000 rpm for 10 min, the supernatant was filtered, and the filtrate was dried in the oven at 40 °C. The lipid contents, as a percentage, were calculated from Equation (1).

2.6. Response Surface Optimization Designs of Two Extraction Processes

The response surface methodology with Central Composite Design (Design Expert® software, version 11, Stat-Ease, Inc. Godward, Minneapolis, MN) was employed to optimize the lipid extraction. The experimental design consisted of power, heating time, and extraction time as design variables for MAE, and lipid extraction and power or heating time for UAE lipid extraction, while considering the lipid content as a response. Table 1, Table 2, Table 3, Table 4, Table 5 and Table 6, detail the experimental design of the microwave assisted lipid extraction from Oedogonium sp., Oscillatoria sp., Ulothrix sp., Chlorella sp., Cladophora sp., and Spirogyra sp. with 20 experiments. Table 7 shows the experimental design of the sonication assisted lipid extraction from Oedogonium sp., Oscillatoria sp., Ulothrix sp., Chlorella sp., Cladophora sp., and Spirogyra sp. with 13 experiments.

2.7. Statistical Analysis

Analysis of variance (ANOVA) and least significant difference was performed to analyze the data of the central composite design in the Design Expert® software ( Stat-Ease, Inc. Godward, version 11, Minneapolis, MN, USA).

2.8. Transesterification and Fatty Acid Methyl Esters (FAMEs) Analysis

The extracted lipids, after pretreatment of all studied algal strains, were transesterified by the protocol described in Munir et al. [10]. After completion of trans-esterification, the reaction mixture was cooled to room temperature and centrifuged at 3000 rpm to obtain an upper layer, of fatty acid methyl ester (biodiesel), and a lower layer (glycerol). The biodiesel upper layer was washed with warm distilled water at 50 °C to remove traces of catalyst and methanol. After transesterification, recovered FAMEs were injected to GCMS. [26].

2.9. Fuel Properties

The fuels’ properties, such as higher heating value, cetane number, iodine value, saponification valve, oxidation stability, cold filter plugging point, density, long chain saturation factor, and kinematic viscosity were calculated using the formula described in [26].

3. Results and Discussions

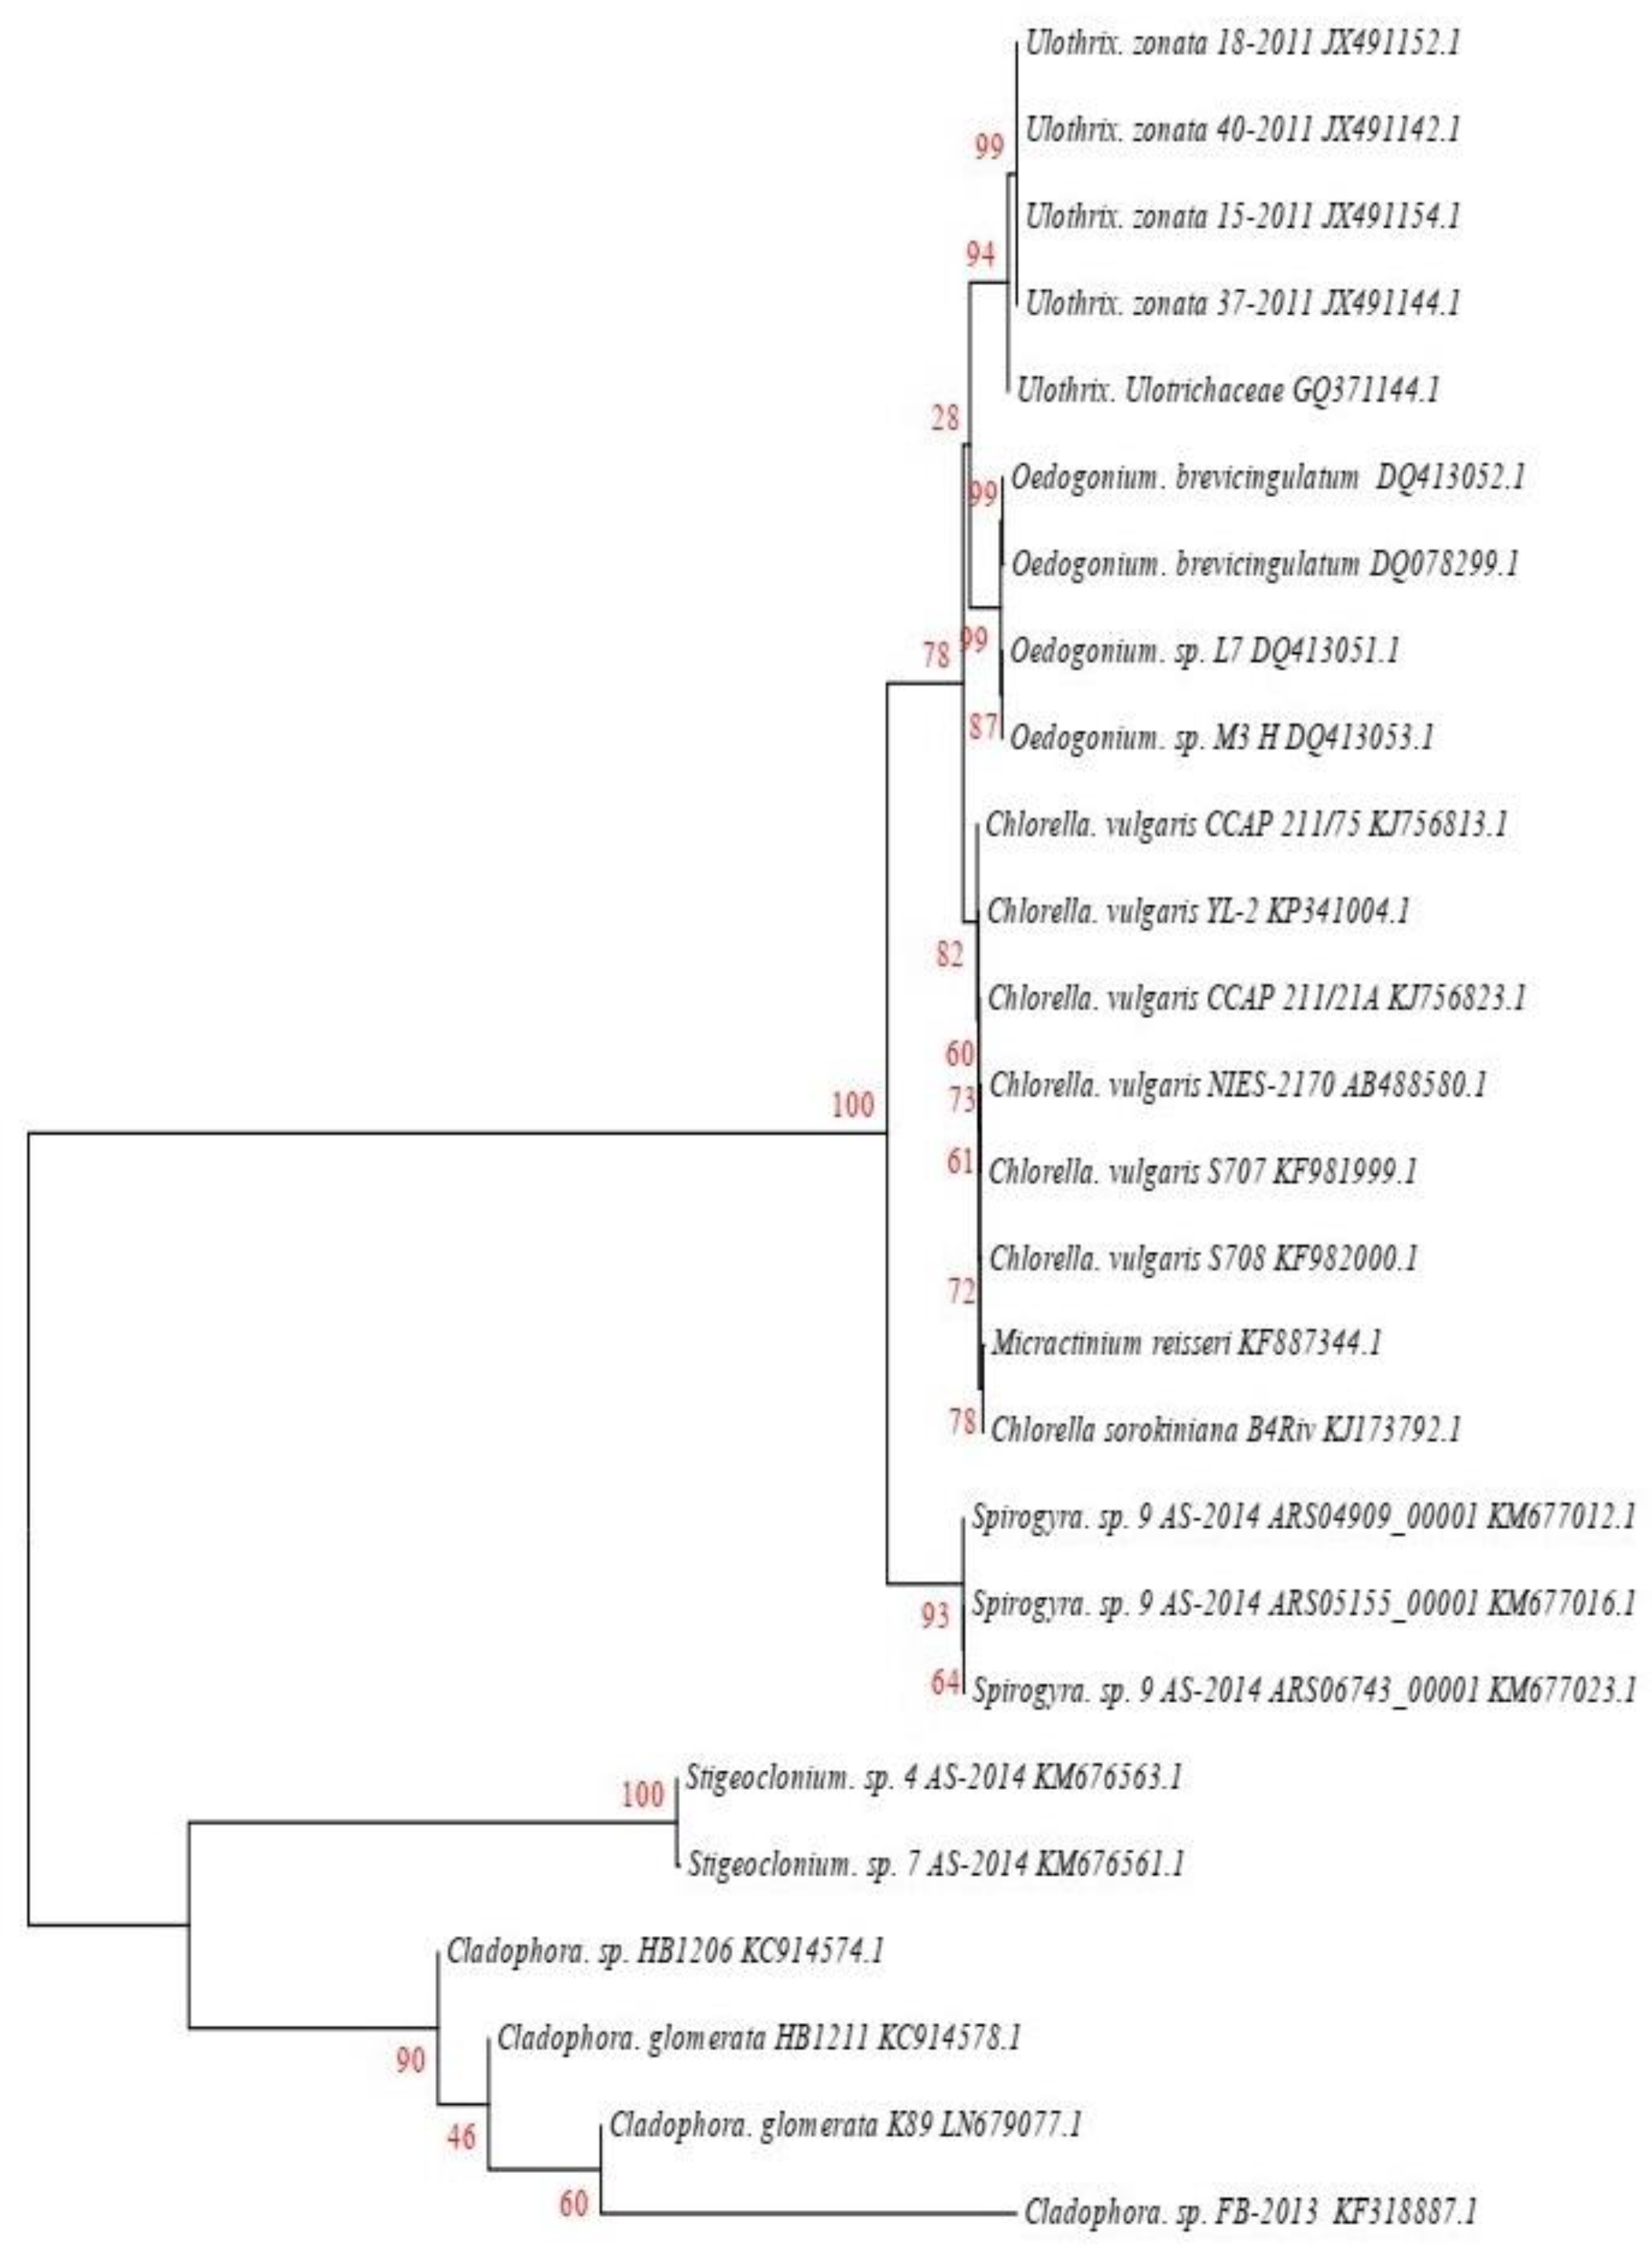
3.1. Molecular Identification of Algae

The analyzed 18S rRNA or ITS sequences of algae species were assembled and compared by BLAST and CLUSTALW, and a phylogenetic tree was constructed. Figure 2 shows that the accession no KU563009 had 95% identification with Chlorella sorokiniana (KJ173792.1), while KU865579 had the closest similarity (91%) to Chlorella vulgaris. KU865580, showed the closest similarity (84%) to Cladophora sp. (KF318887.1), KU865577 showed 90% homology with Hydrodictyon reticulatum (KM676903), KU865576 had 94% similarity to Oedogonium sp. (DQ413053), KU865578 showed 93% homology with Spirogyra sp. (KM677012.1), KM676563.1 has 90% similarity to Stigeoclonium sp., and KU865575 showed 92% similarity to Ulothrix sp. (JX491152.1).

3.2. Experimental Design and Statistical Analysis

The effect of power, heating, and extraction time in lipid extraction with microwave assistance, and power and extraction time in lipid extraction with sonication assistance, was evaluated in the algal species for the lipid content extraction. This included 20 repeats in each experiment of MAE and 13 runs in UAE (Table 1, Table 2, Table 3, Table 4, Table 5, Table 6 and Table 7). The impact of each factor on the lipid extraction with microwave assistance is shown in Table 2, Table 3, Table 4, Table 5, Table 6 and Table 7. From Oedogonium sp., 38.5% lipids was obtained, 40% from Cladophora sp., and 33% from Spirogyra sp., under the optimized conditions: microwave power 600 watts, 8 min heating time, and 4 h extraction time. From Oscillatoria sp., 34% lipids was extracted at microwave power 600 watts, 5 min heating time, and 3.5 h extraction time. From Ulothrix sp., 55% lipids, and 48% from Chlorella sp., were extracted at microwave power 600 watts, 8 min heating time, and 3 h extraction time, and microwave power 600 watts, 8 min heating time, and 4 h extraction time, respectively. Increasing the microwave power from 180 to 600 W resulted in an increase in the lipid extraction efficiency. When the power exceeded 600 W, the extraction rates decreased. Increasing the microwave heating time from 1 to 8 min significantly increased the lipid content. Extending the extraction time after microwaving from 2.5 to 3.5 h significantly increased the lipid content, but a slight reduction of lipid content was found in all observed species after the extraction time was prolonged beyond 3.5 h (Table 1, Table 2, Table 3, Table 4, Table 5 and Table 6).
During the microwave-assisted lipid extraction, algal cell membranes are weakened by the oscillation of polar substances generated by the heating effects of the microwaves, making it suitable for the extraction of intracellular metabolites. Earlier studies also indicate that MAE heats the extracts quickly and accelerates the extraction process [27,28]. Ulothrix sp. is a significant species for oil production, containing up to 60% lipid contents [24], whereas the lipid contents in Chlorella sp. have been measured as being up to 30% [24,29]. Gupta et al. [28] extracted 30% lipid from Oedogonium sp. by MAE. The lipid content was increased 20-fold, as compared to the controls, by using MAE in Chlorella sp. [30]. Ali and Watson [18] used 1021 W microwave power for 5 min to increase the lipid content 3-fold as compared to the control in Chlorella sp. From Dunaliella tertiolecta, 57.02% lipids was obtained at 160 sec extraction time and 490 W microwave power [31]. Many other researchers have used the MAE technique for algal lipid extraction, obtaining 28.6% lipid from Chlorella sp. [32], 32.8% from Nannochloropsis sp. [33], 39% from N. gaditana [34], and 28.9% from Chlorella vulgaris [35]. This oil extraction research suggests that these algal species can compete favorably with other conventional sources for biofuel production, if applied with the proper methods and extraction time. The oil content in algal species has been reported to vary from 14–63% of the dry weight [36]. The algal species studied in this research produced higher yields than those reported above, ranging from 40–50%, with the optimization of different methods.
As listed in Table 7, using the ultrasonic technique, 32% lipid was obtained from Oedogonium sp., 21% from Oscillatoria sp., 51% from Ulothrix sp., 40% from Chlorella sp., 36% from Cladophora sp., and 20% from Spirogyra sp., under an ultra-sonication power of 80 kHz and with an 8 min extraction time. Increasing the sonication power from 30 to 80 kHz, and the extraction time from 3 to 8 min, resulted in an enhanced lipid extraction efficiency in all observed species. In this technique, ultrasonic waves create cavitation bubbles in a solvent and these bubbles collapse to generate shock waves near the algae cells, causing disruptions of cellular walls and the release of the lipids into the solvent [37]. Abd El Fatah et al. [38] extracted 15% lipids from Oscillatoria sp. by solvent extraction that could be improved by MAE or UAE. Sonication with higher frequencies caused more effective cell disruption. Many other scientists have used the UAE technique for algal lipid extraction, obtaining 18.9% lipid from Nanno chloropsis [33], 8.8% from Scenedesmus sp. [39], 36% from N. gaditana [34], and 26.4% from Chlorella vulgaris [35]. Ferreira et al. [40] extracted 19% of total lipids with ultra-sonication from Chlorella sp. Silva et al. [41] conducted a study to find out the best algal lipid extraction method from a mixed algal culture. Zheng et al. [42] extracted 6, 15, 10, and 18% lipids from Chlorella vulgaris by grinding, ultrasound, bead milling and microwave, respectively. Approximately 24% lipid was extracted from Spirogyra sp. using ultra-sonication at 40 KHz for 30 min–2 h at 30 °C [23].
However, UAE is difficult to scale up and uses large amounts of power. Microwaves are a more suitable choice of technique for algal lipid extraction, having numerous benefits such as, a reduced extraction time and solvent usage, an improved extraction yield, a lower response period and operational expenses, as well as being environmentally friendly.

3.3. Equations in Terms of Coded Factors of Quadratic Models

The RSM suggested a quadratic model that relates the lipid content to the independent variables (Equations (2)–(13) in Table 8). The lipid content was the response and A, B, C were the coded terms used for the investigated parameters. A is microwave power, B is microwave heating time, and C is extraction time. These equations can accurately describe the interaction between the interactions, factors, and response.

3.4. Analysis of Variance (ANOVA)

To analyze the significance, reliability, and fitness of the model, a lack of fit and an ANOVA test was applied. The results are shown in Supplementary Tables S1–S12. All the models show a p-value < 0.0001, which indicates that all the models are highly significant in the response except the quadratic model in Oscillatoria sp. (MAE), having a p-value < 0.0002. Nevertheless, in this study, all the p-values are < 0.0500, which indicates that the model is significant. In the case of MAE, the p value of coefficients of power and heating time were < 0.0001, while the p value for extraction time was 0.0053 in Oedogonium sp. In Oscillatoria sp., the p value of power was < 0.0006, heating time < 0.0074, and extraction time, 0.6153. In Ulothrix sp., the p values of power and heating time were <0.0001, while the p value of the extraction time was 1. In Chlorella sp., the p values of power and heating time were < 0.0001, while the p value of the extraction time was 0.7547. In Cladophora sp., the p values of power and heating time were < 0.0001, while the p value of extraction time was 0.0043. In Spirogyra sp., the p values of power and heating time were < 0.0001, while the p value of extraction time was 0.0222. In the case of UAE, the p value of coefficients power was < 0.0001, and extraction time was 0.0002 in Oedogonium sp. The p value of power and extraction time were < 0.0001 in Ulothrix sp., Chlorella sp., Cladophora sp., and Spirogyra sp. The model F-values in all the models were significant. There is only a 0.01% chance in all models, expect Oscillatoria sp. (MAE) which has 0.02% chance, that an F-value this large could occur by chance. The lack of fit value was > 0.05 (insignificant) in all models, indicating that the models are reliable and a good fit to the actual data.

3.5. Validation of Models

R2 is the correlation coefficient which indicates whether or not the experimental data fit the model. R2 must be at least 0.90. In all the models, the R2 values were greater than 0.90 (Supplementary Tables S13 and S14), thus indicating a good compatibility between the actual and calculated results within the wide range of the experiments. C.V% in all models was less than 10, indicating a good fit of all models to the experimental data. In all the models, adequate precision was more than four (4), this indicates that the model noise ratio is located in the satisfactory range. So, all the models were valid and can be used to navigate the design space.

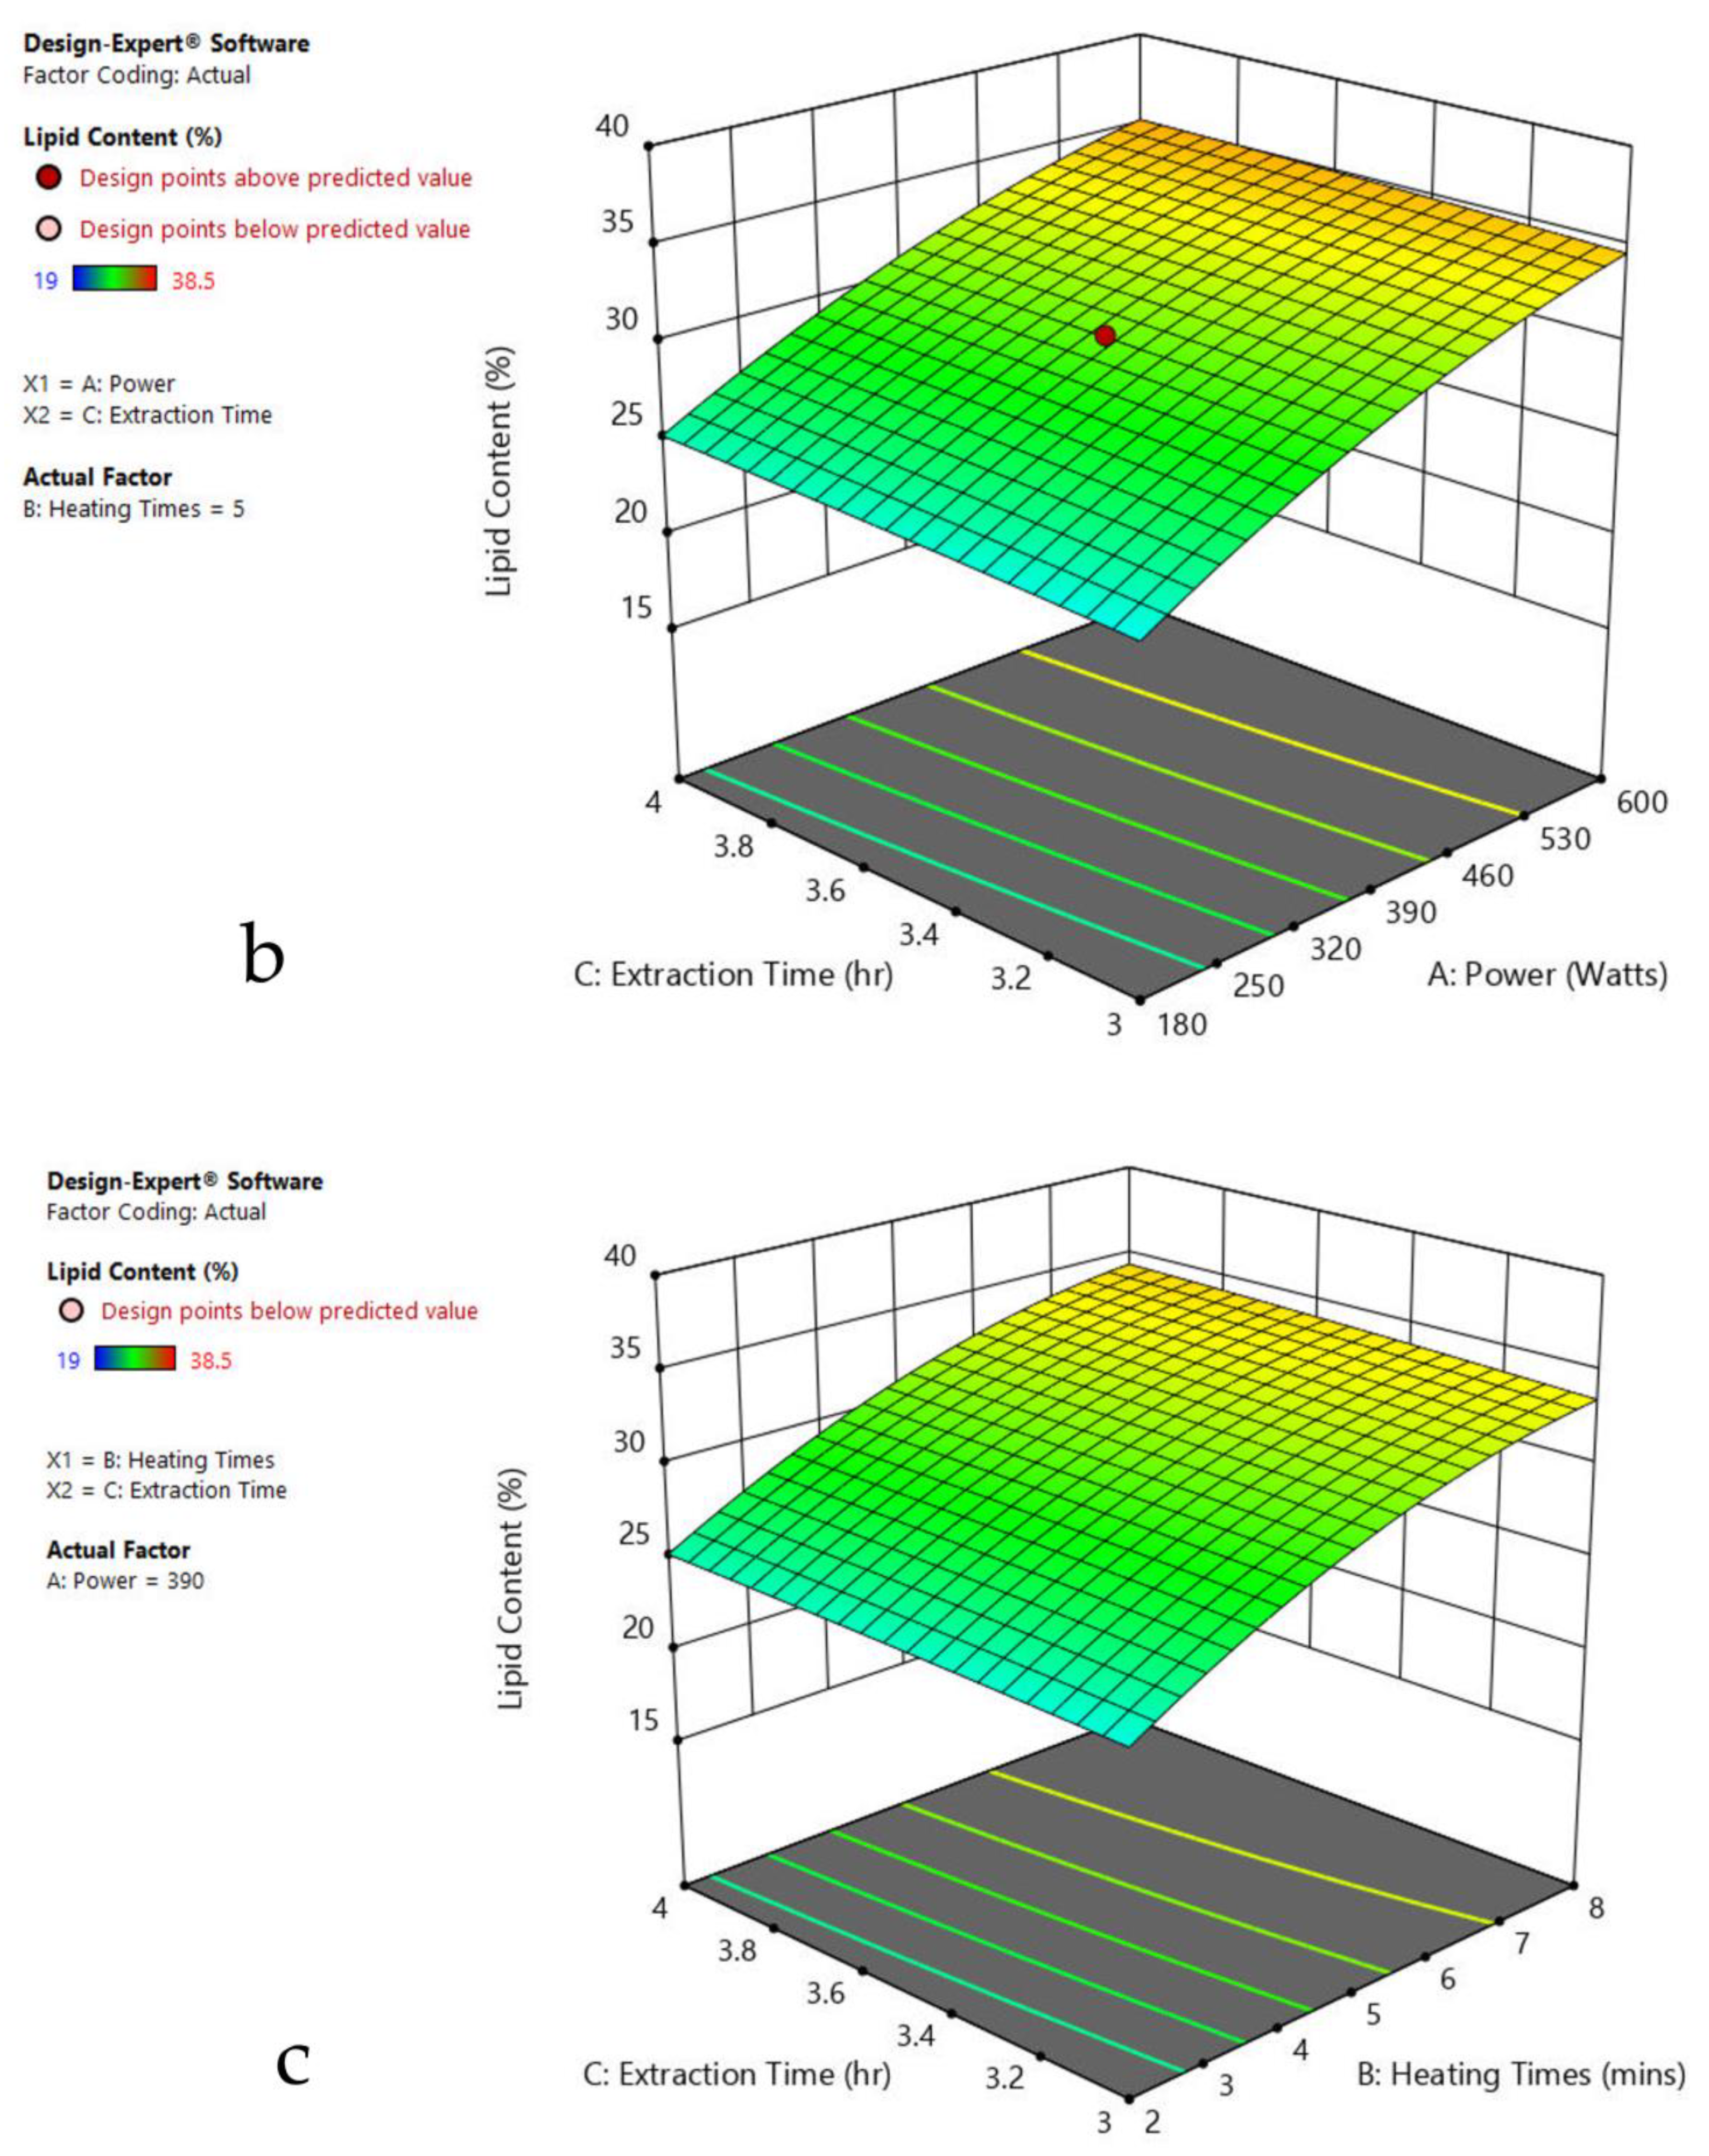
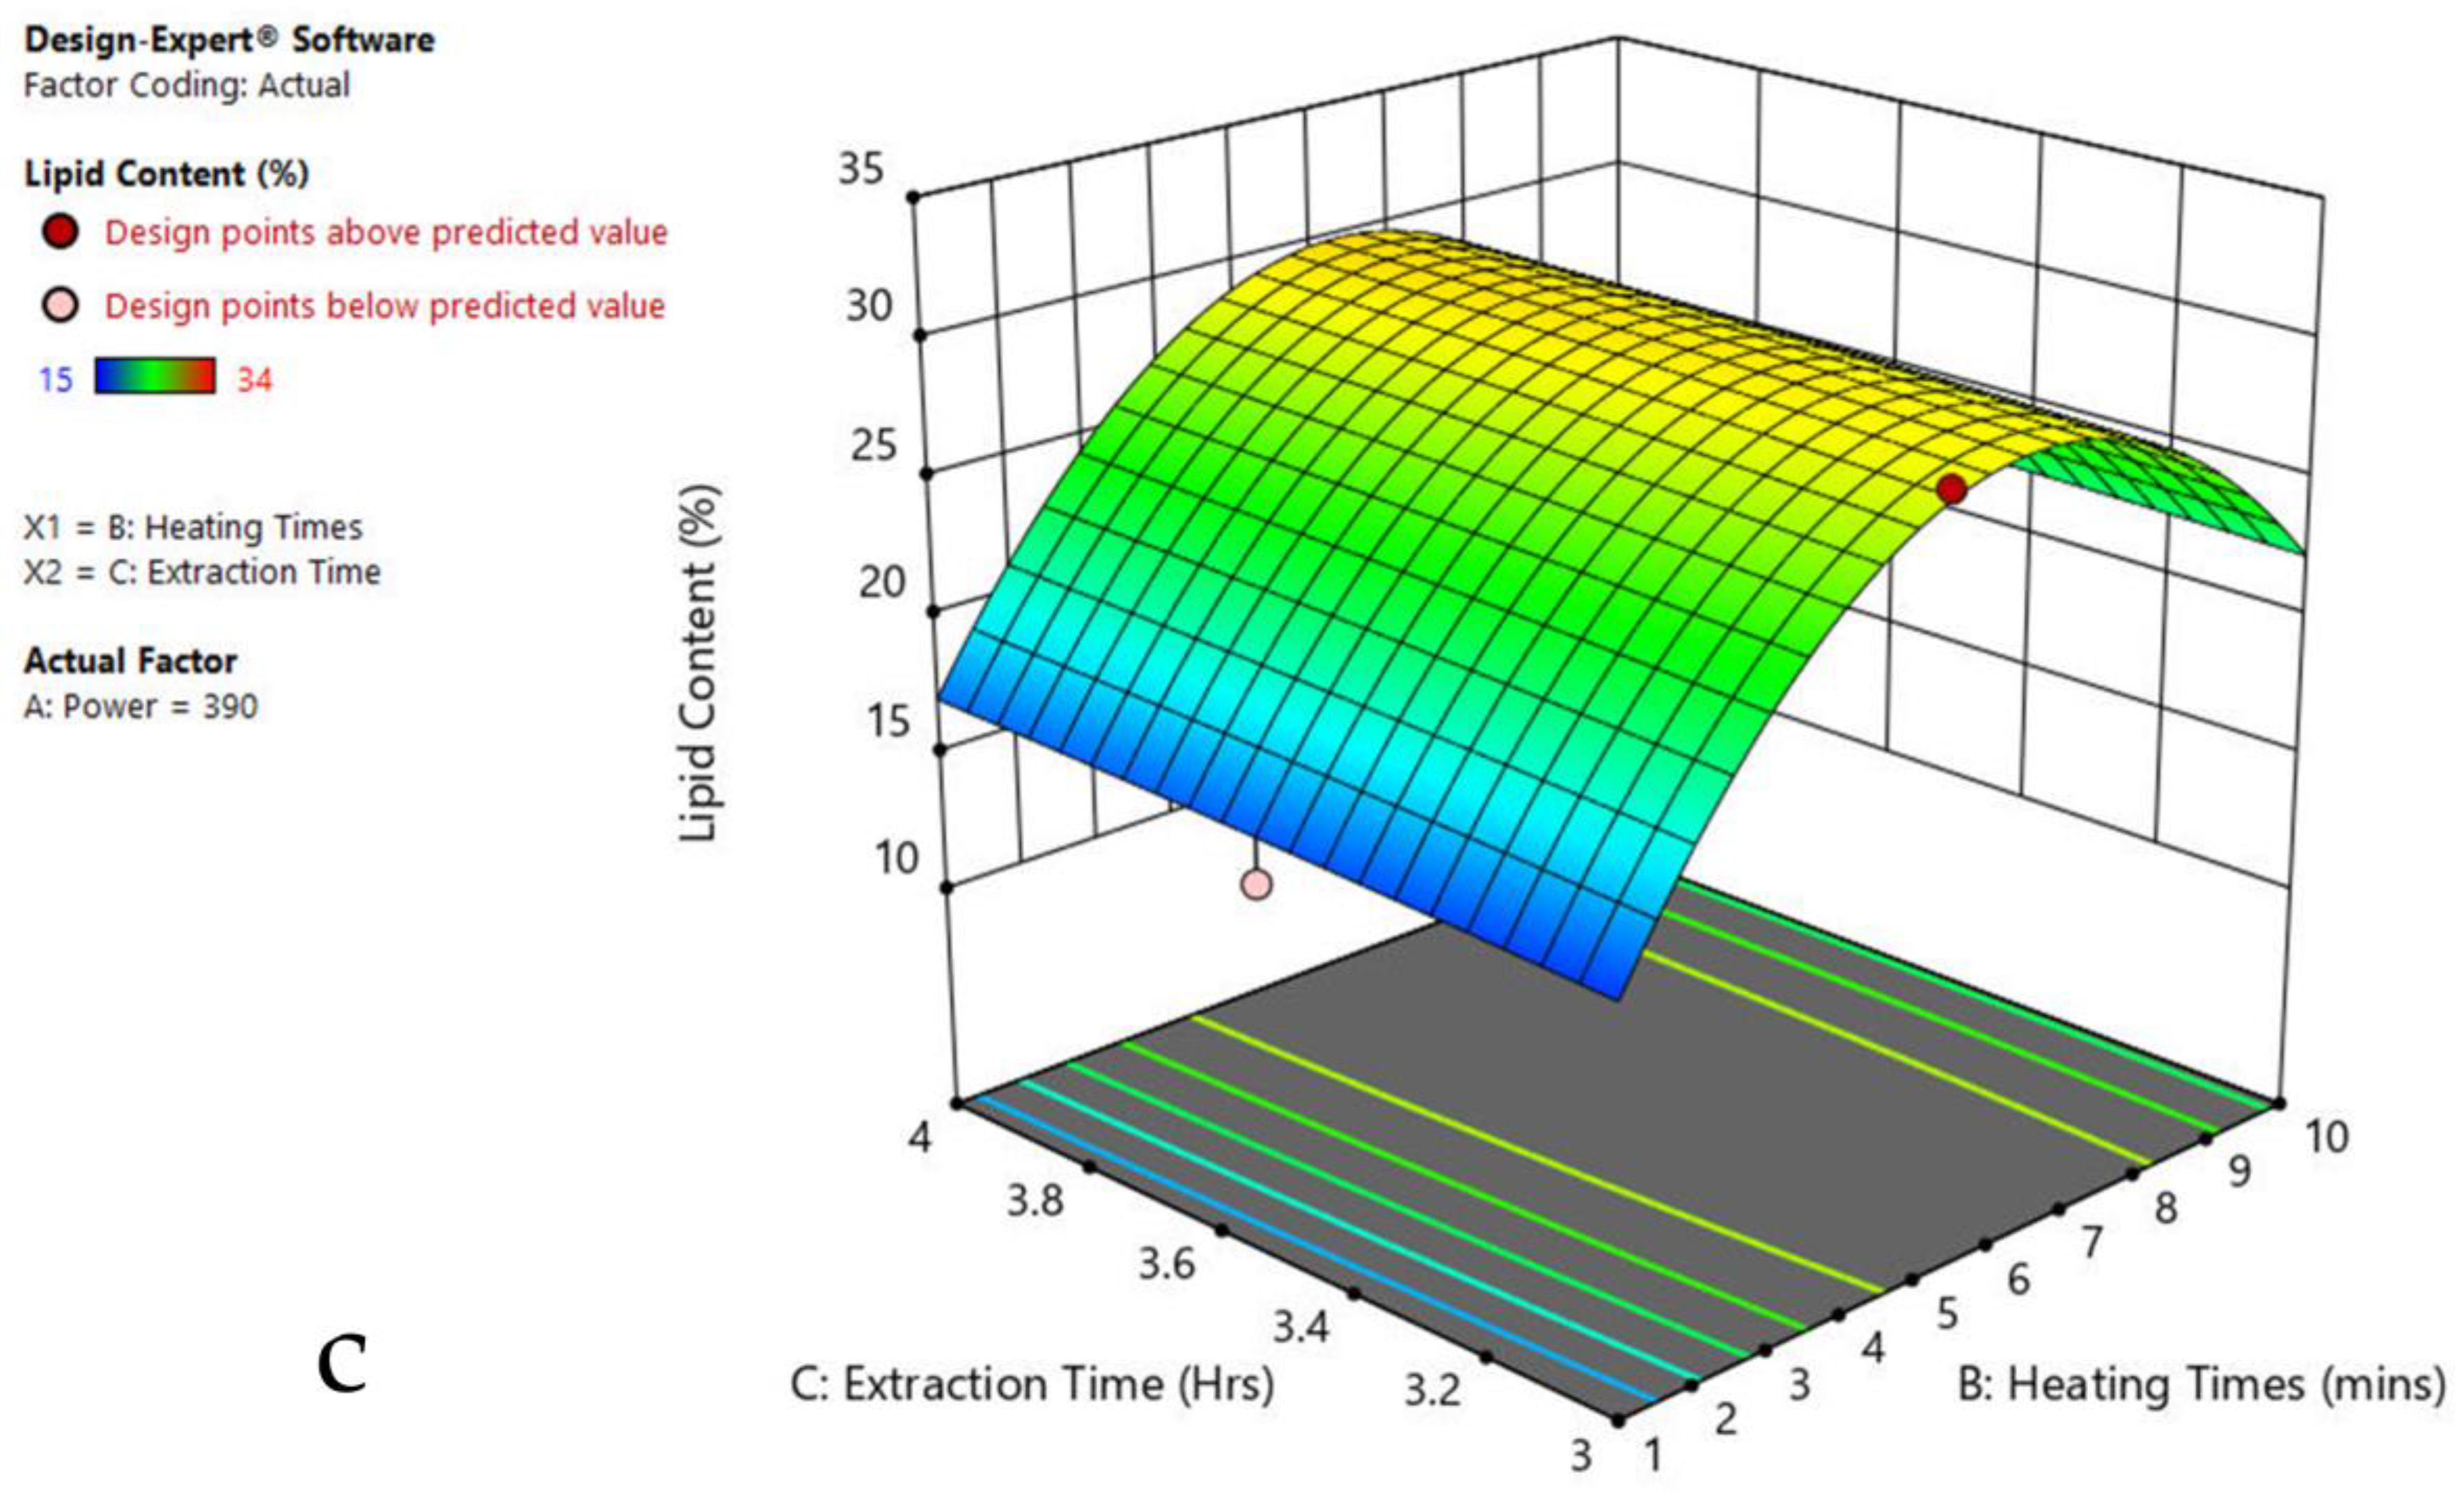
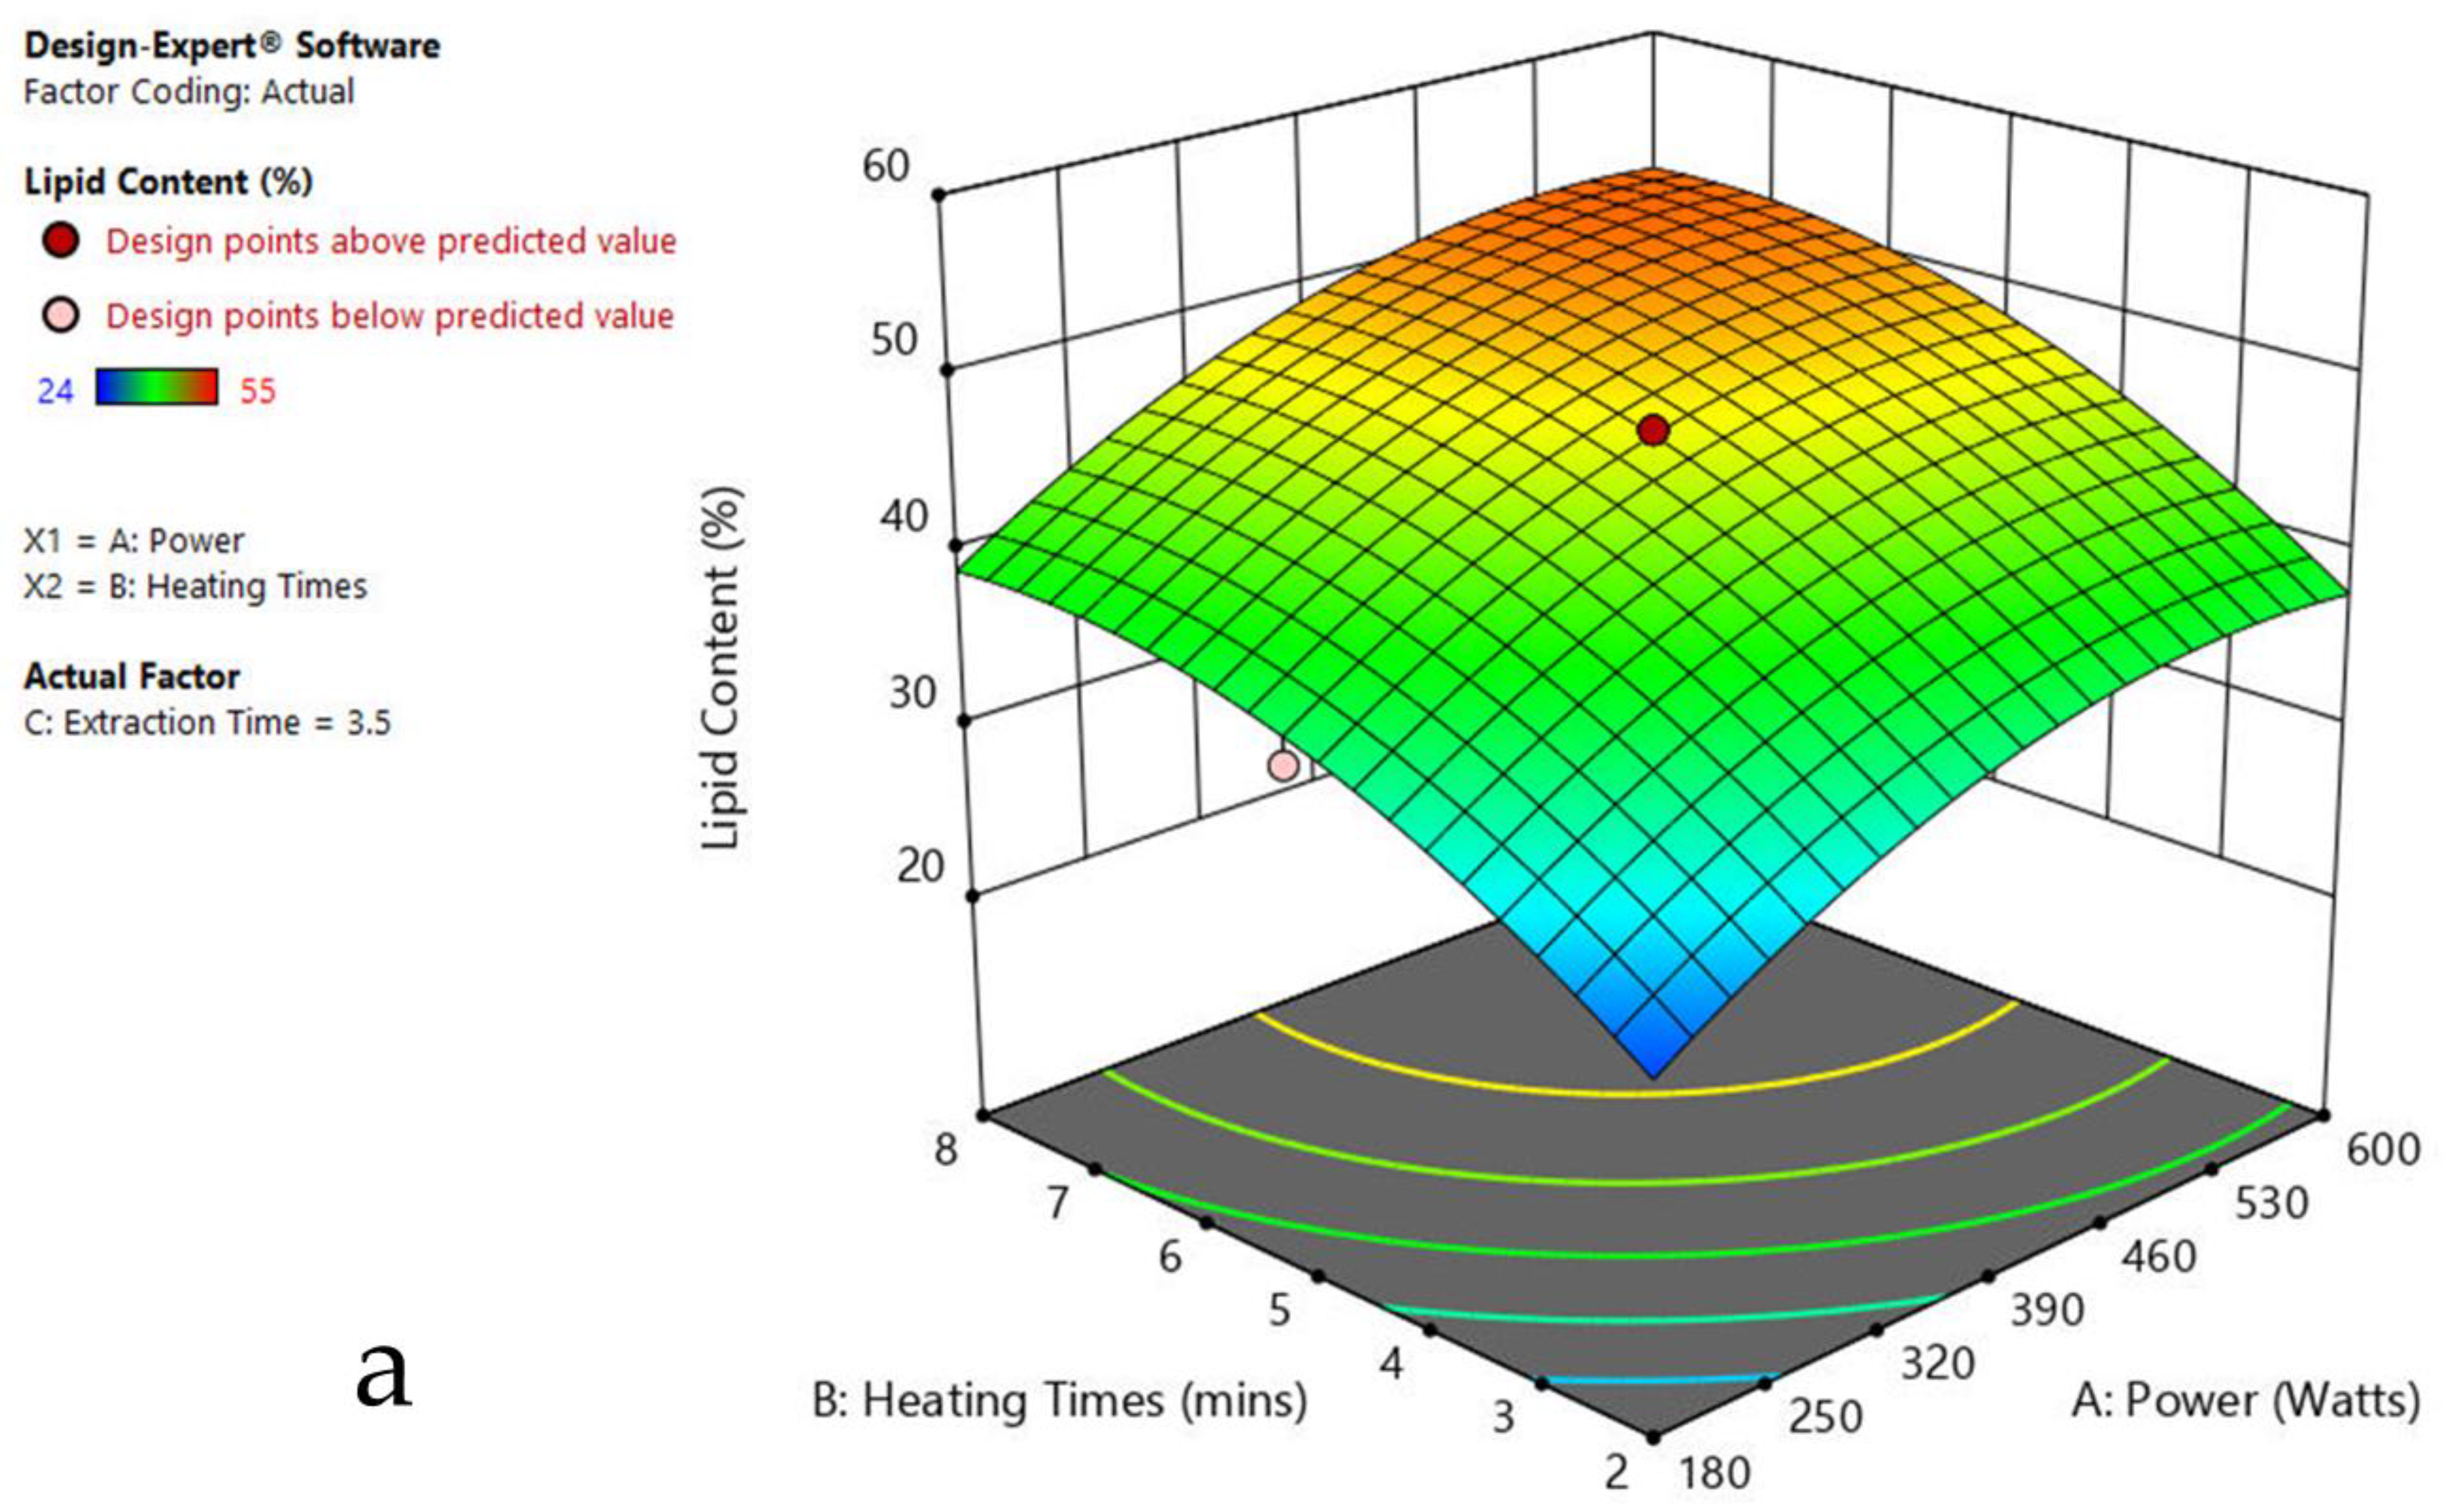
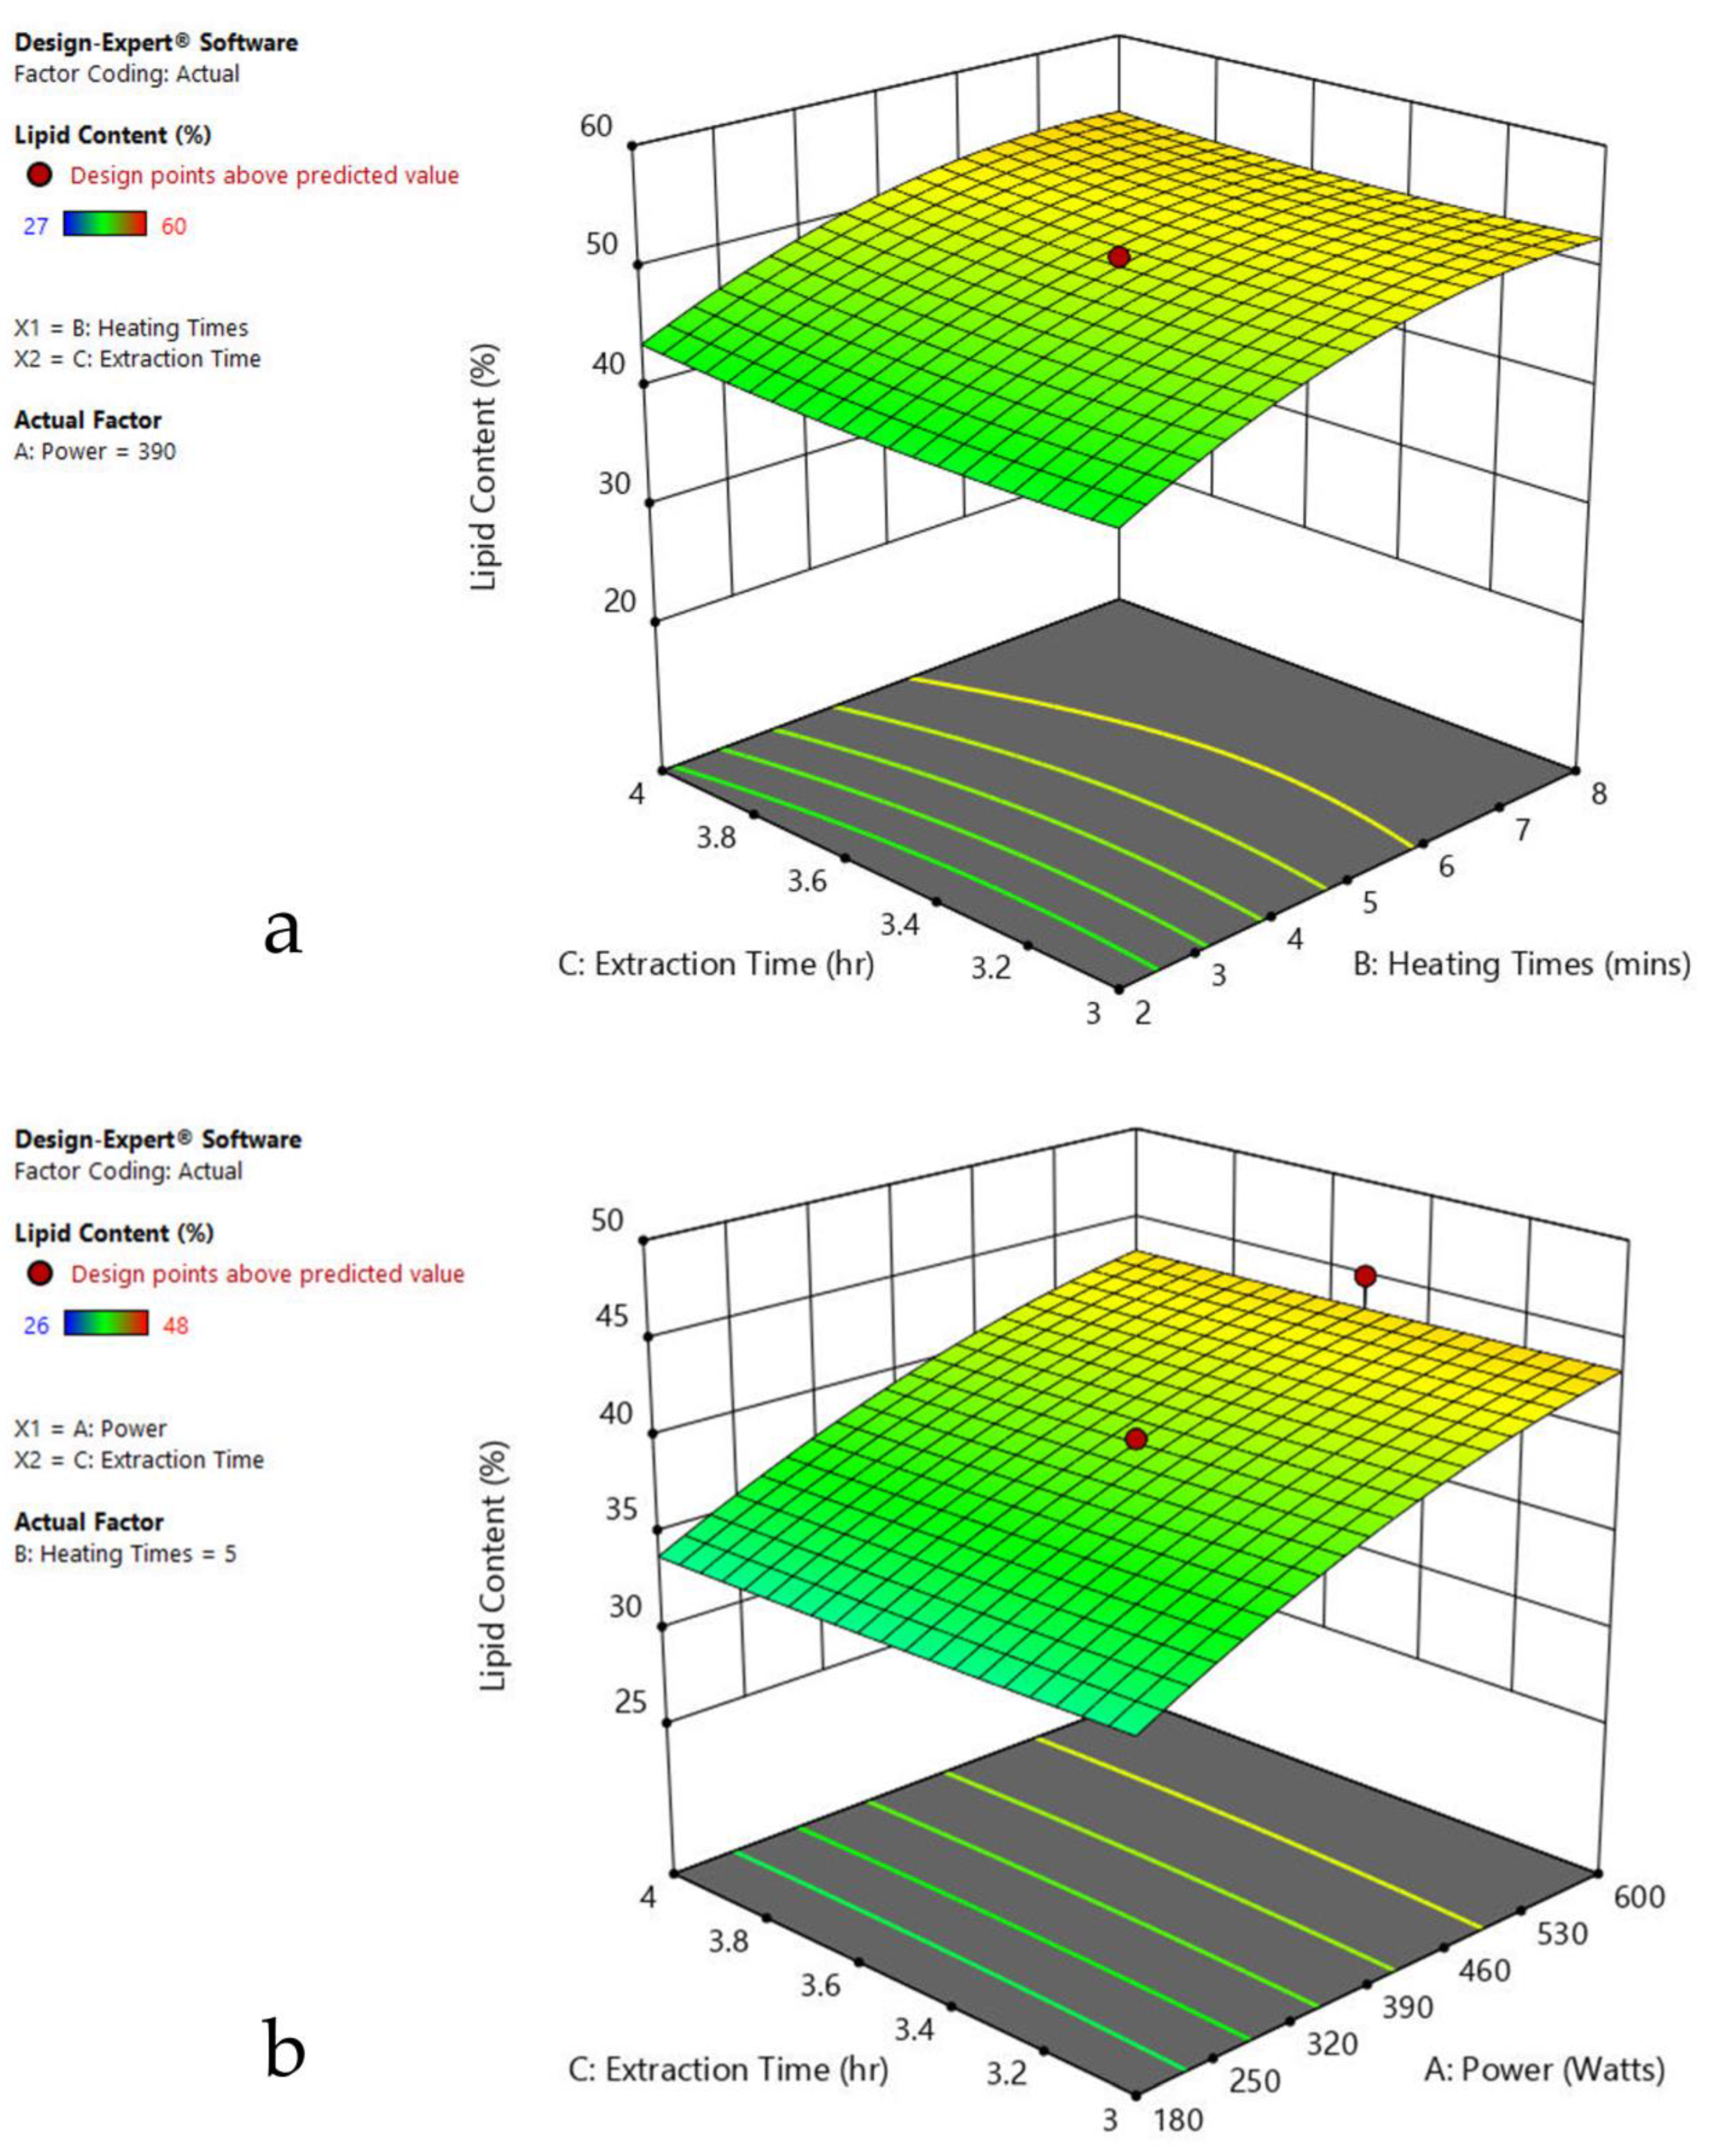
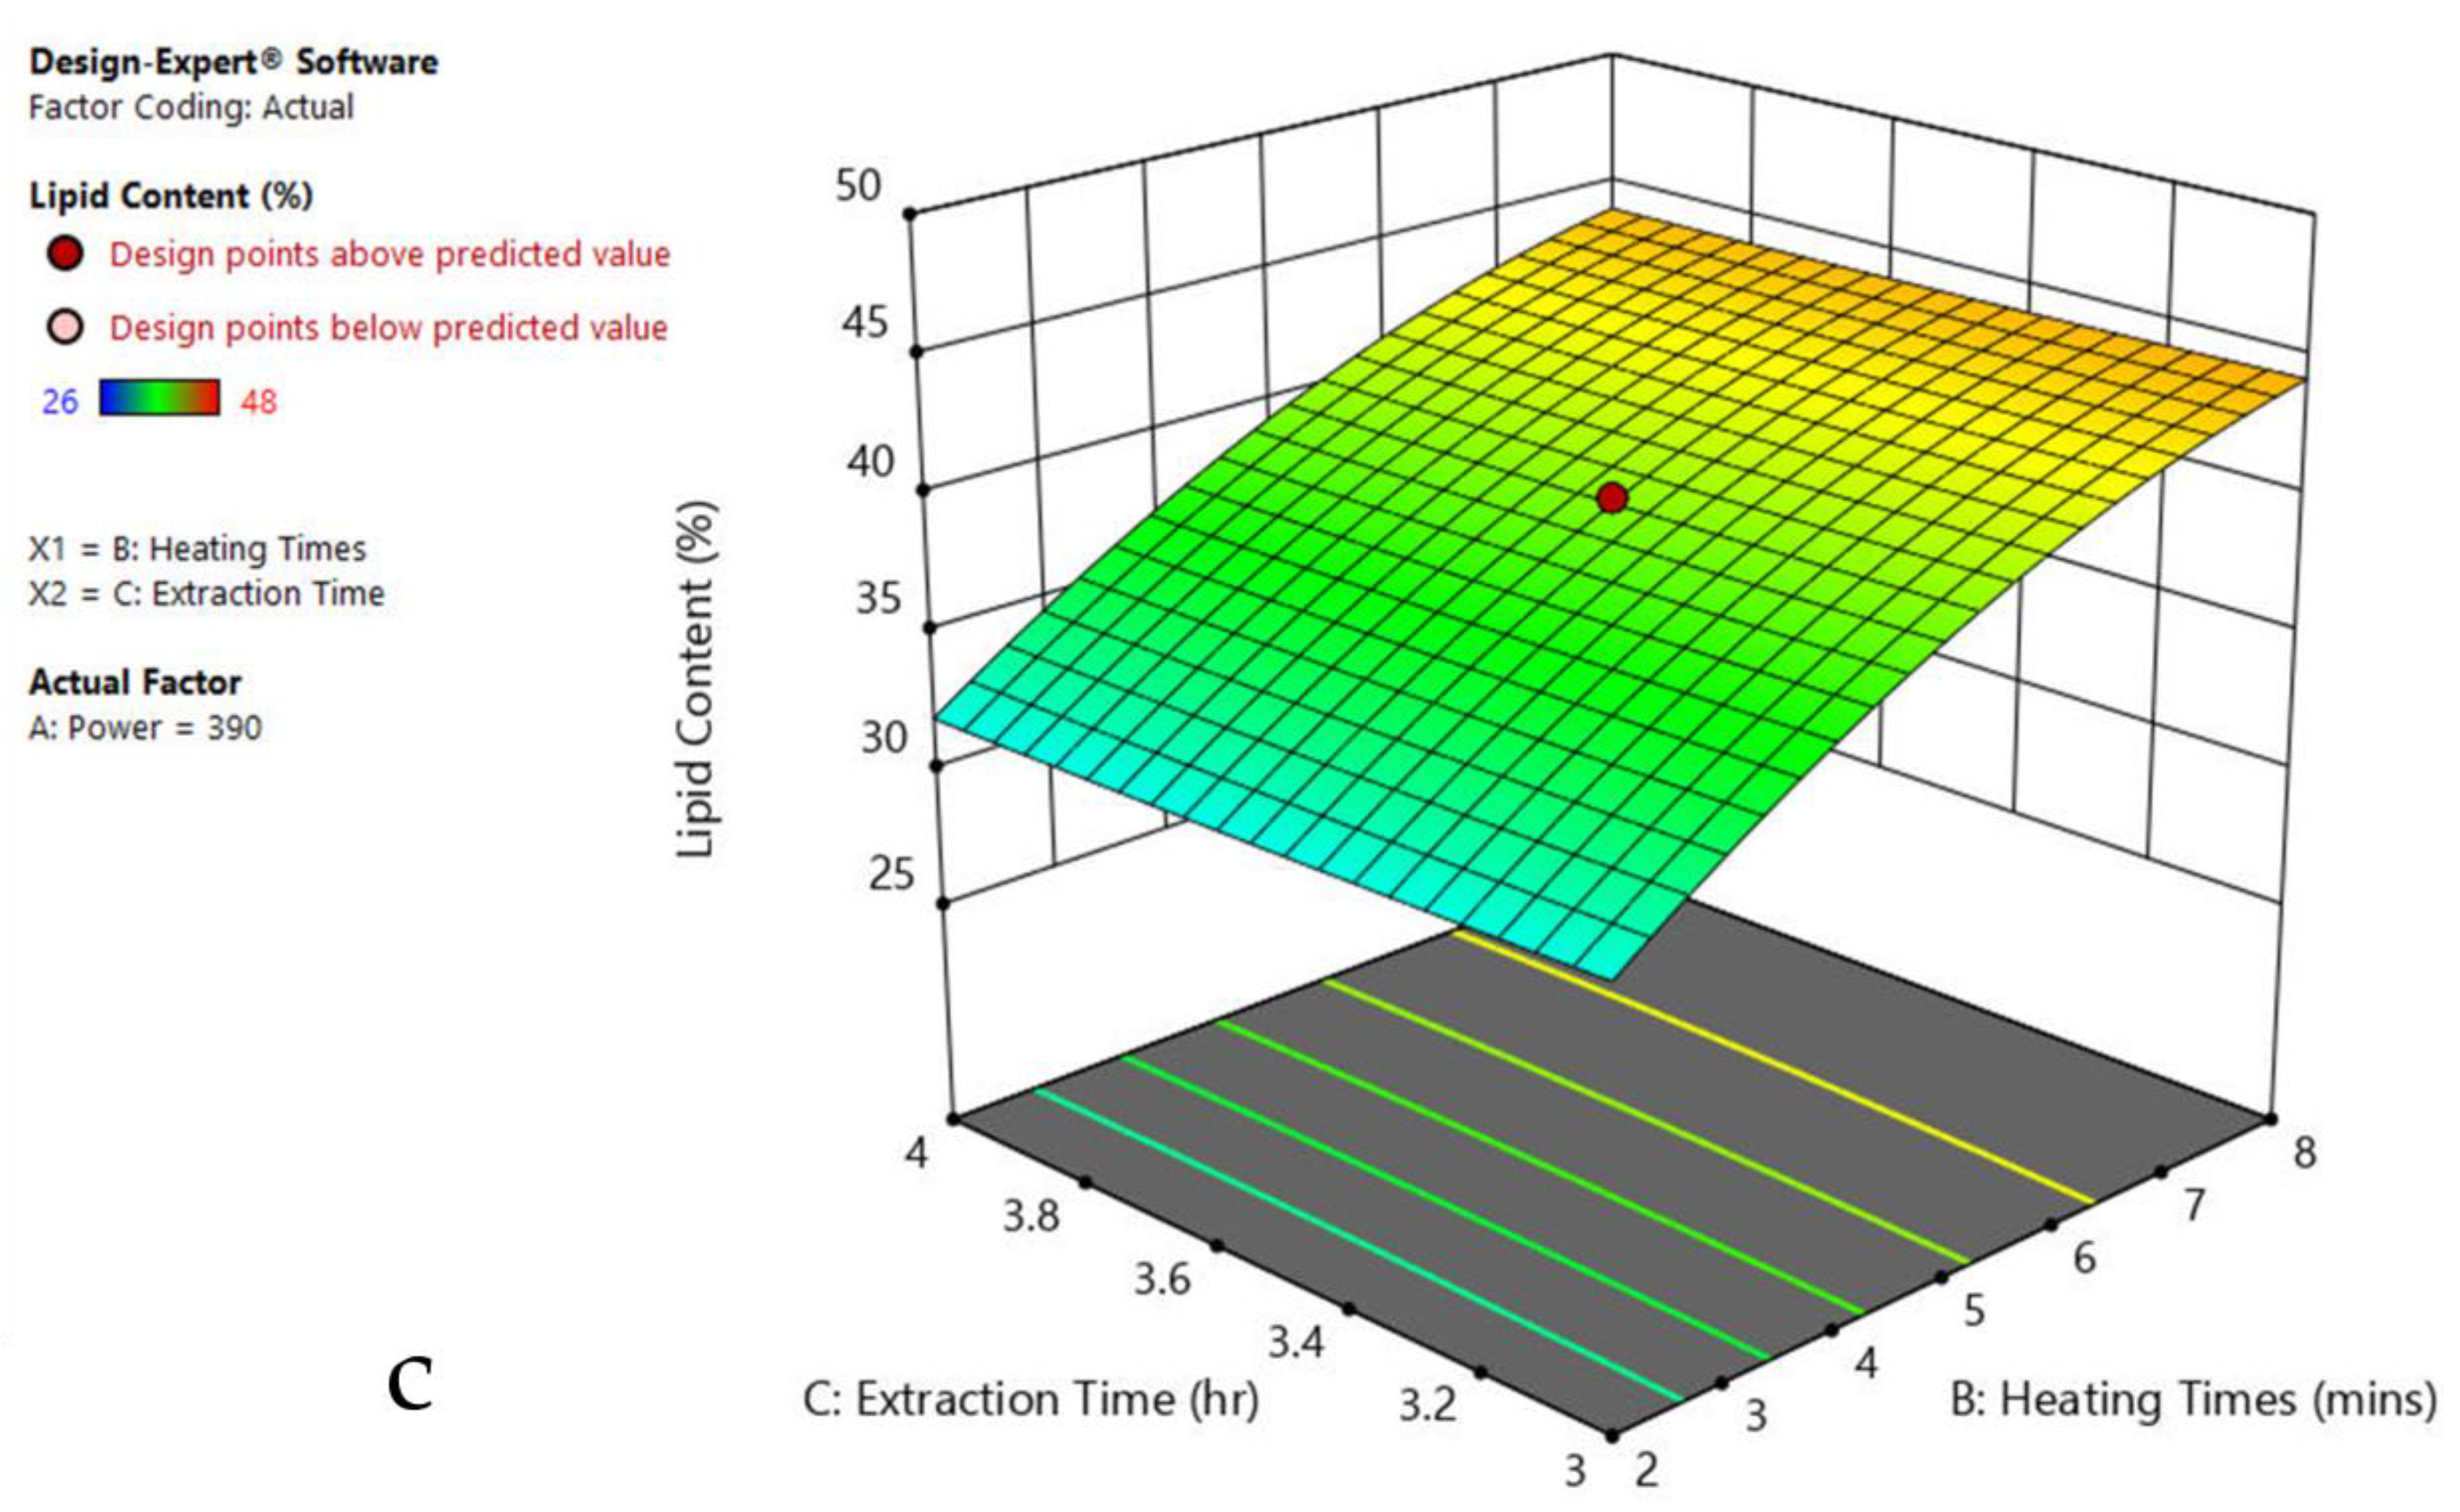
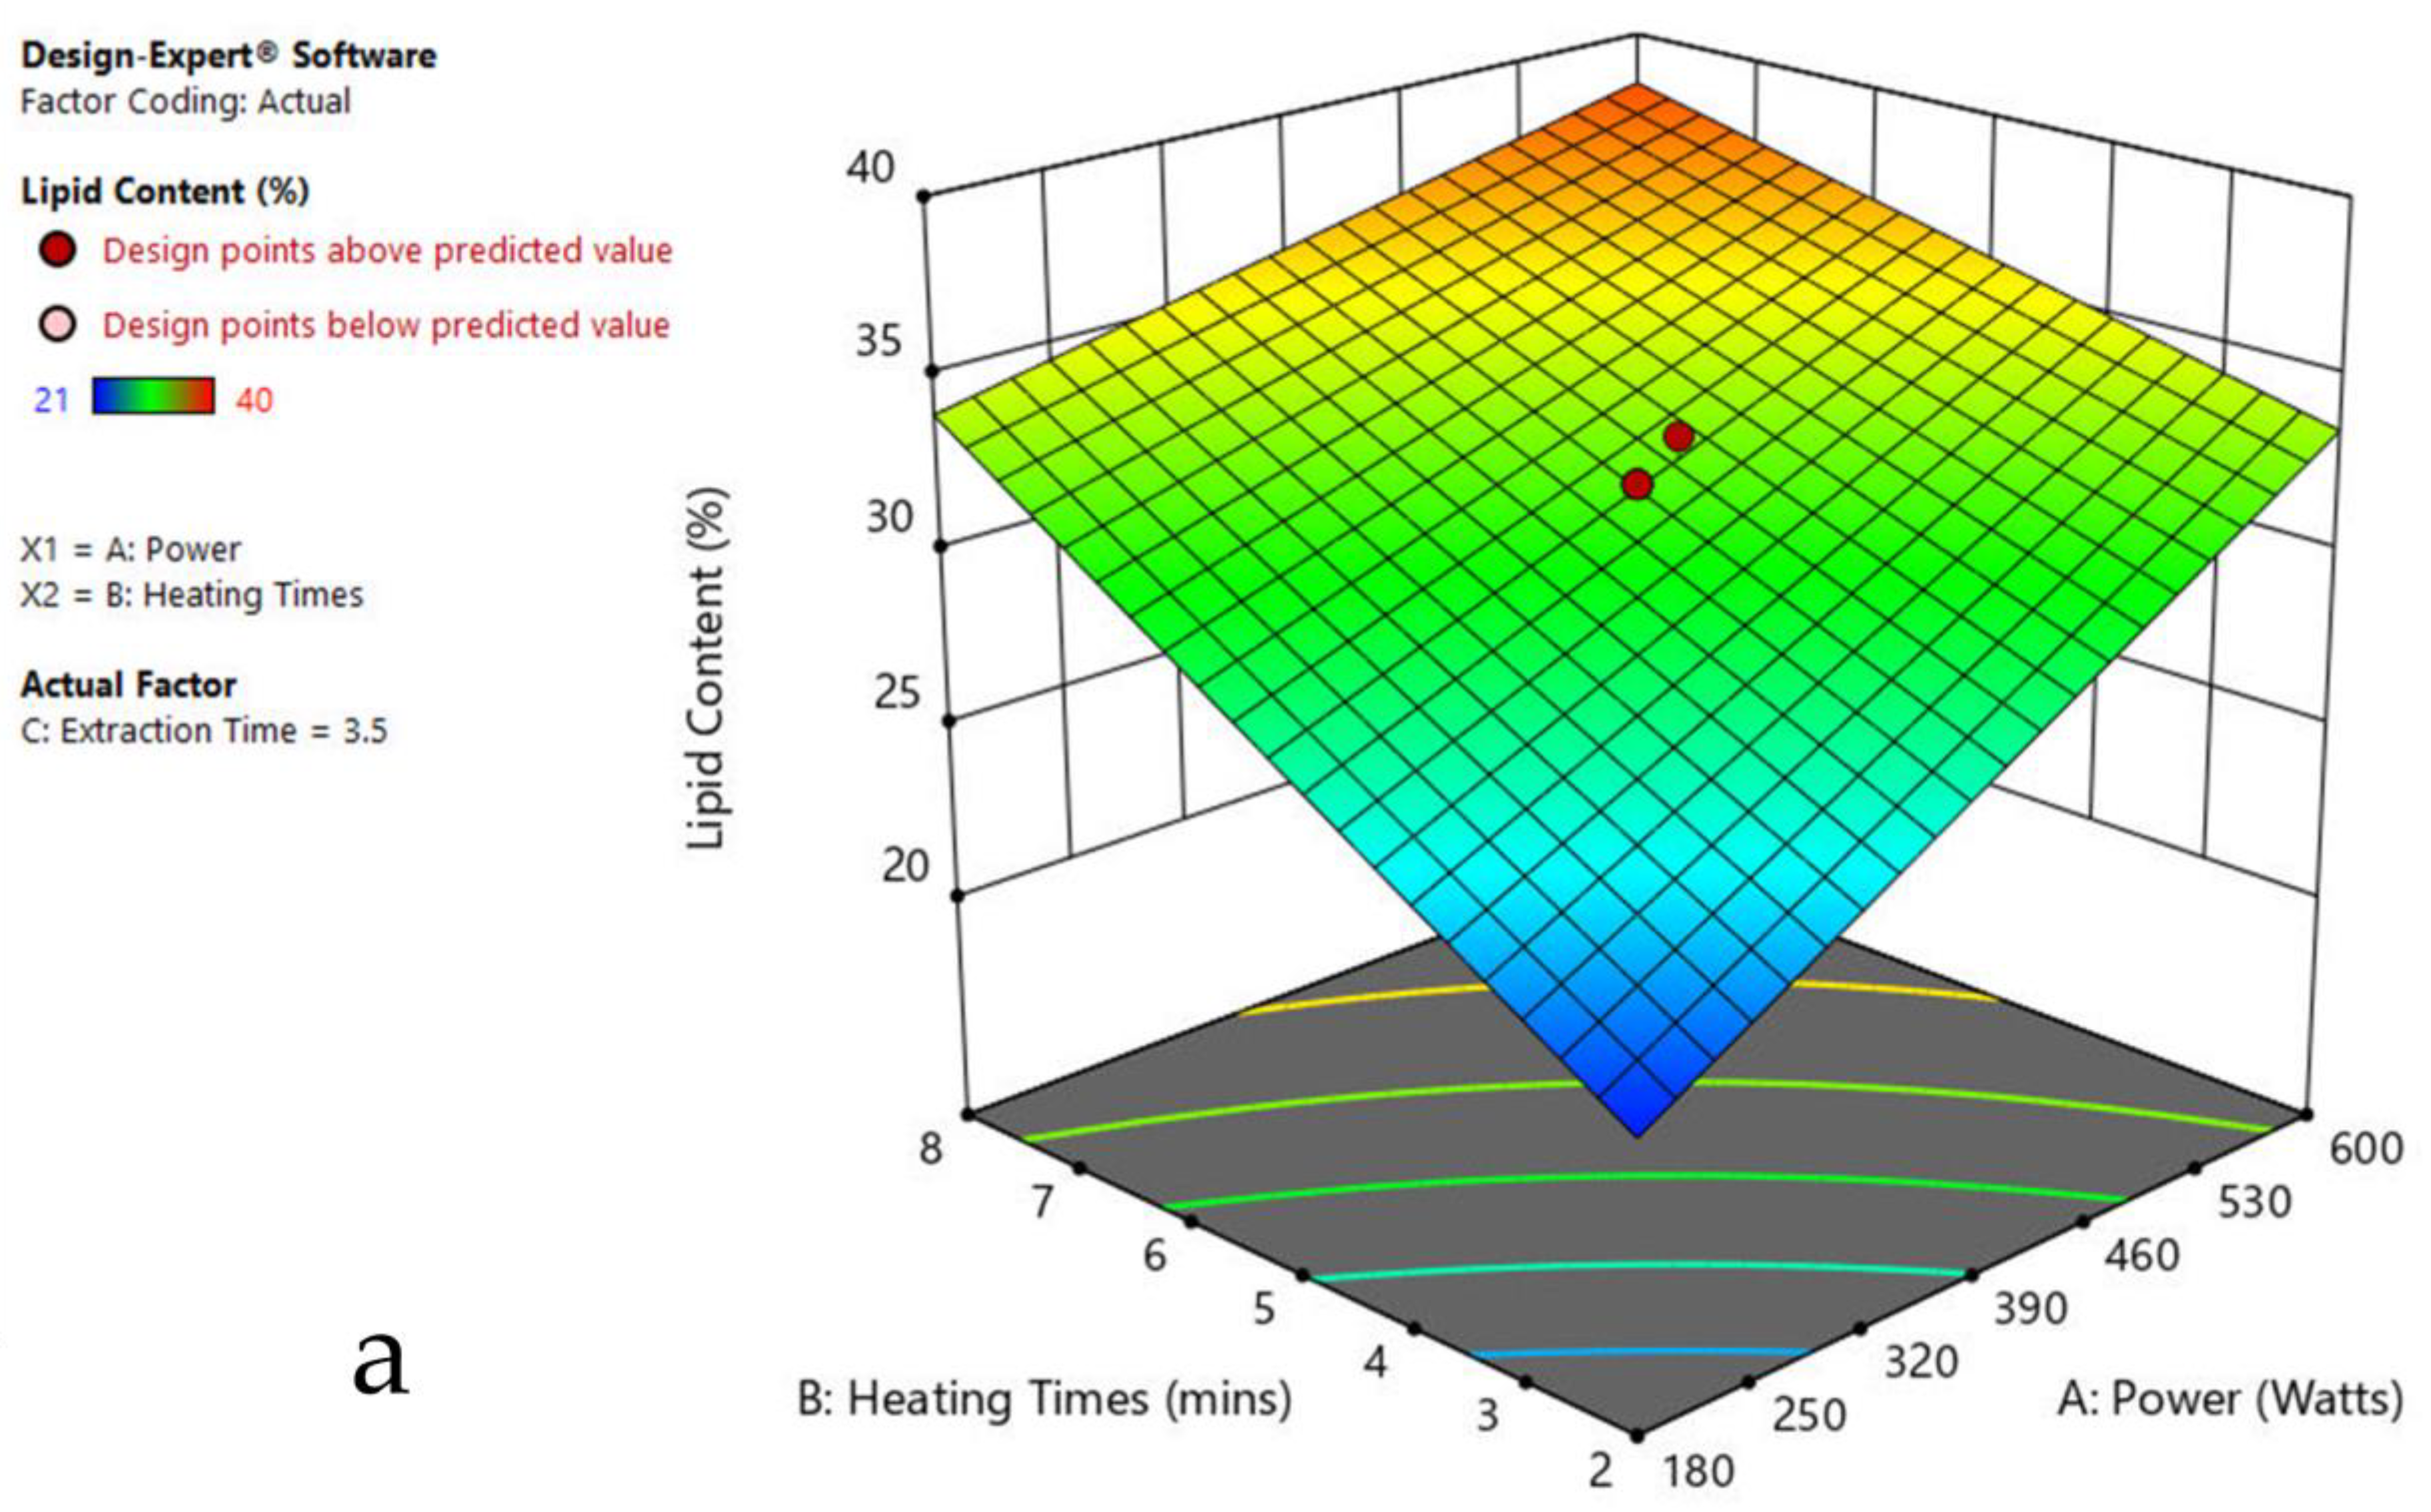
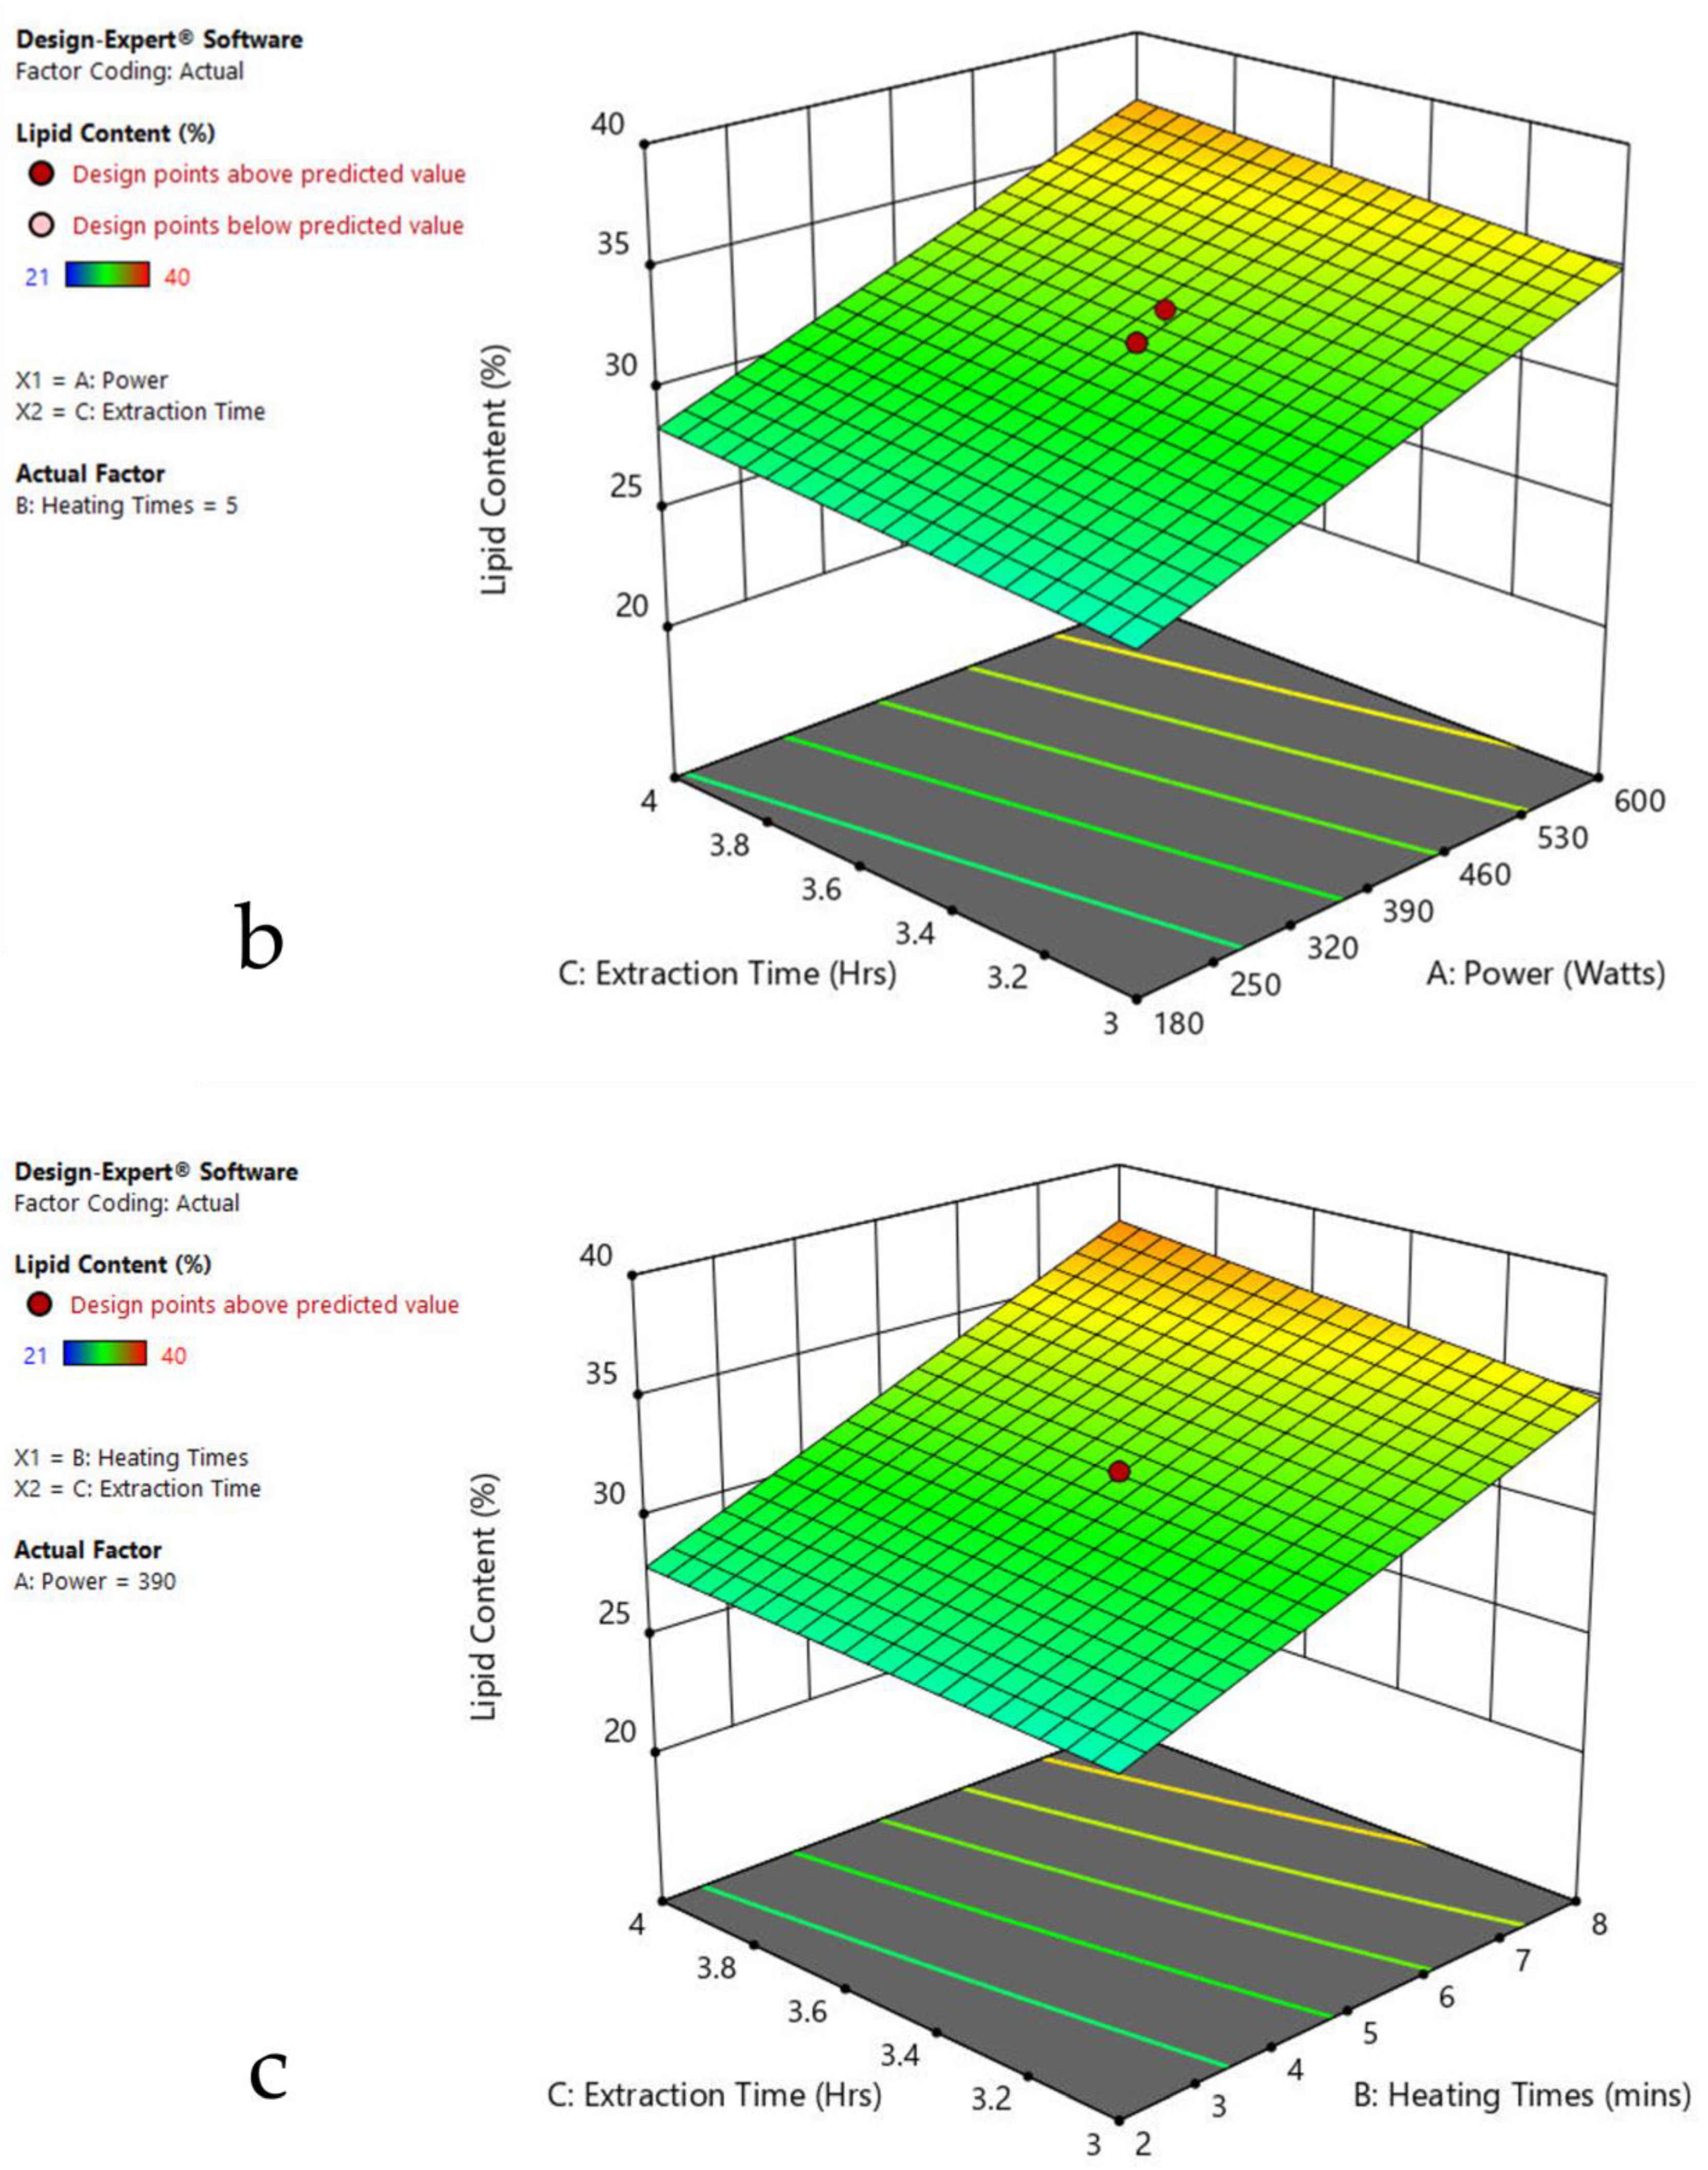
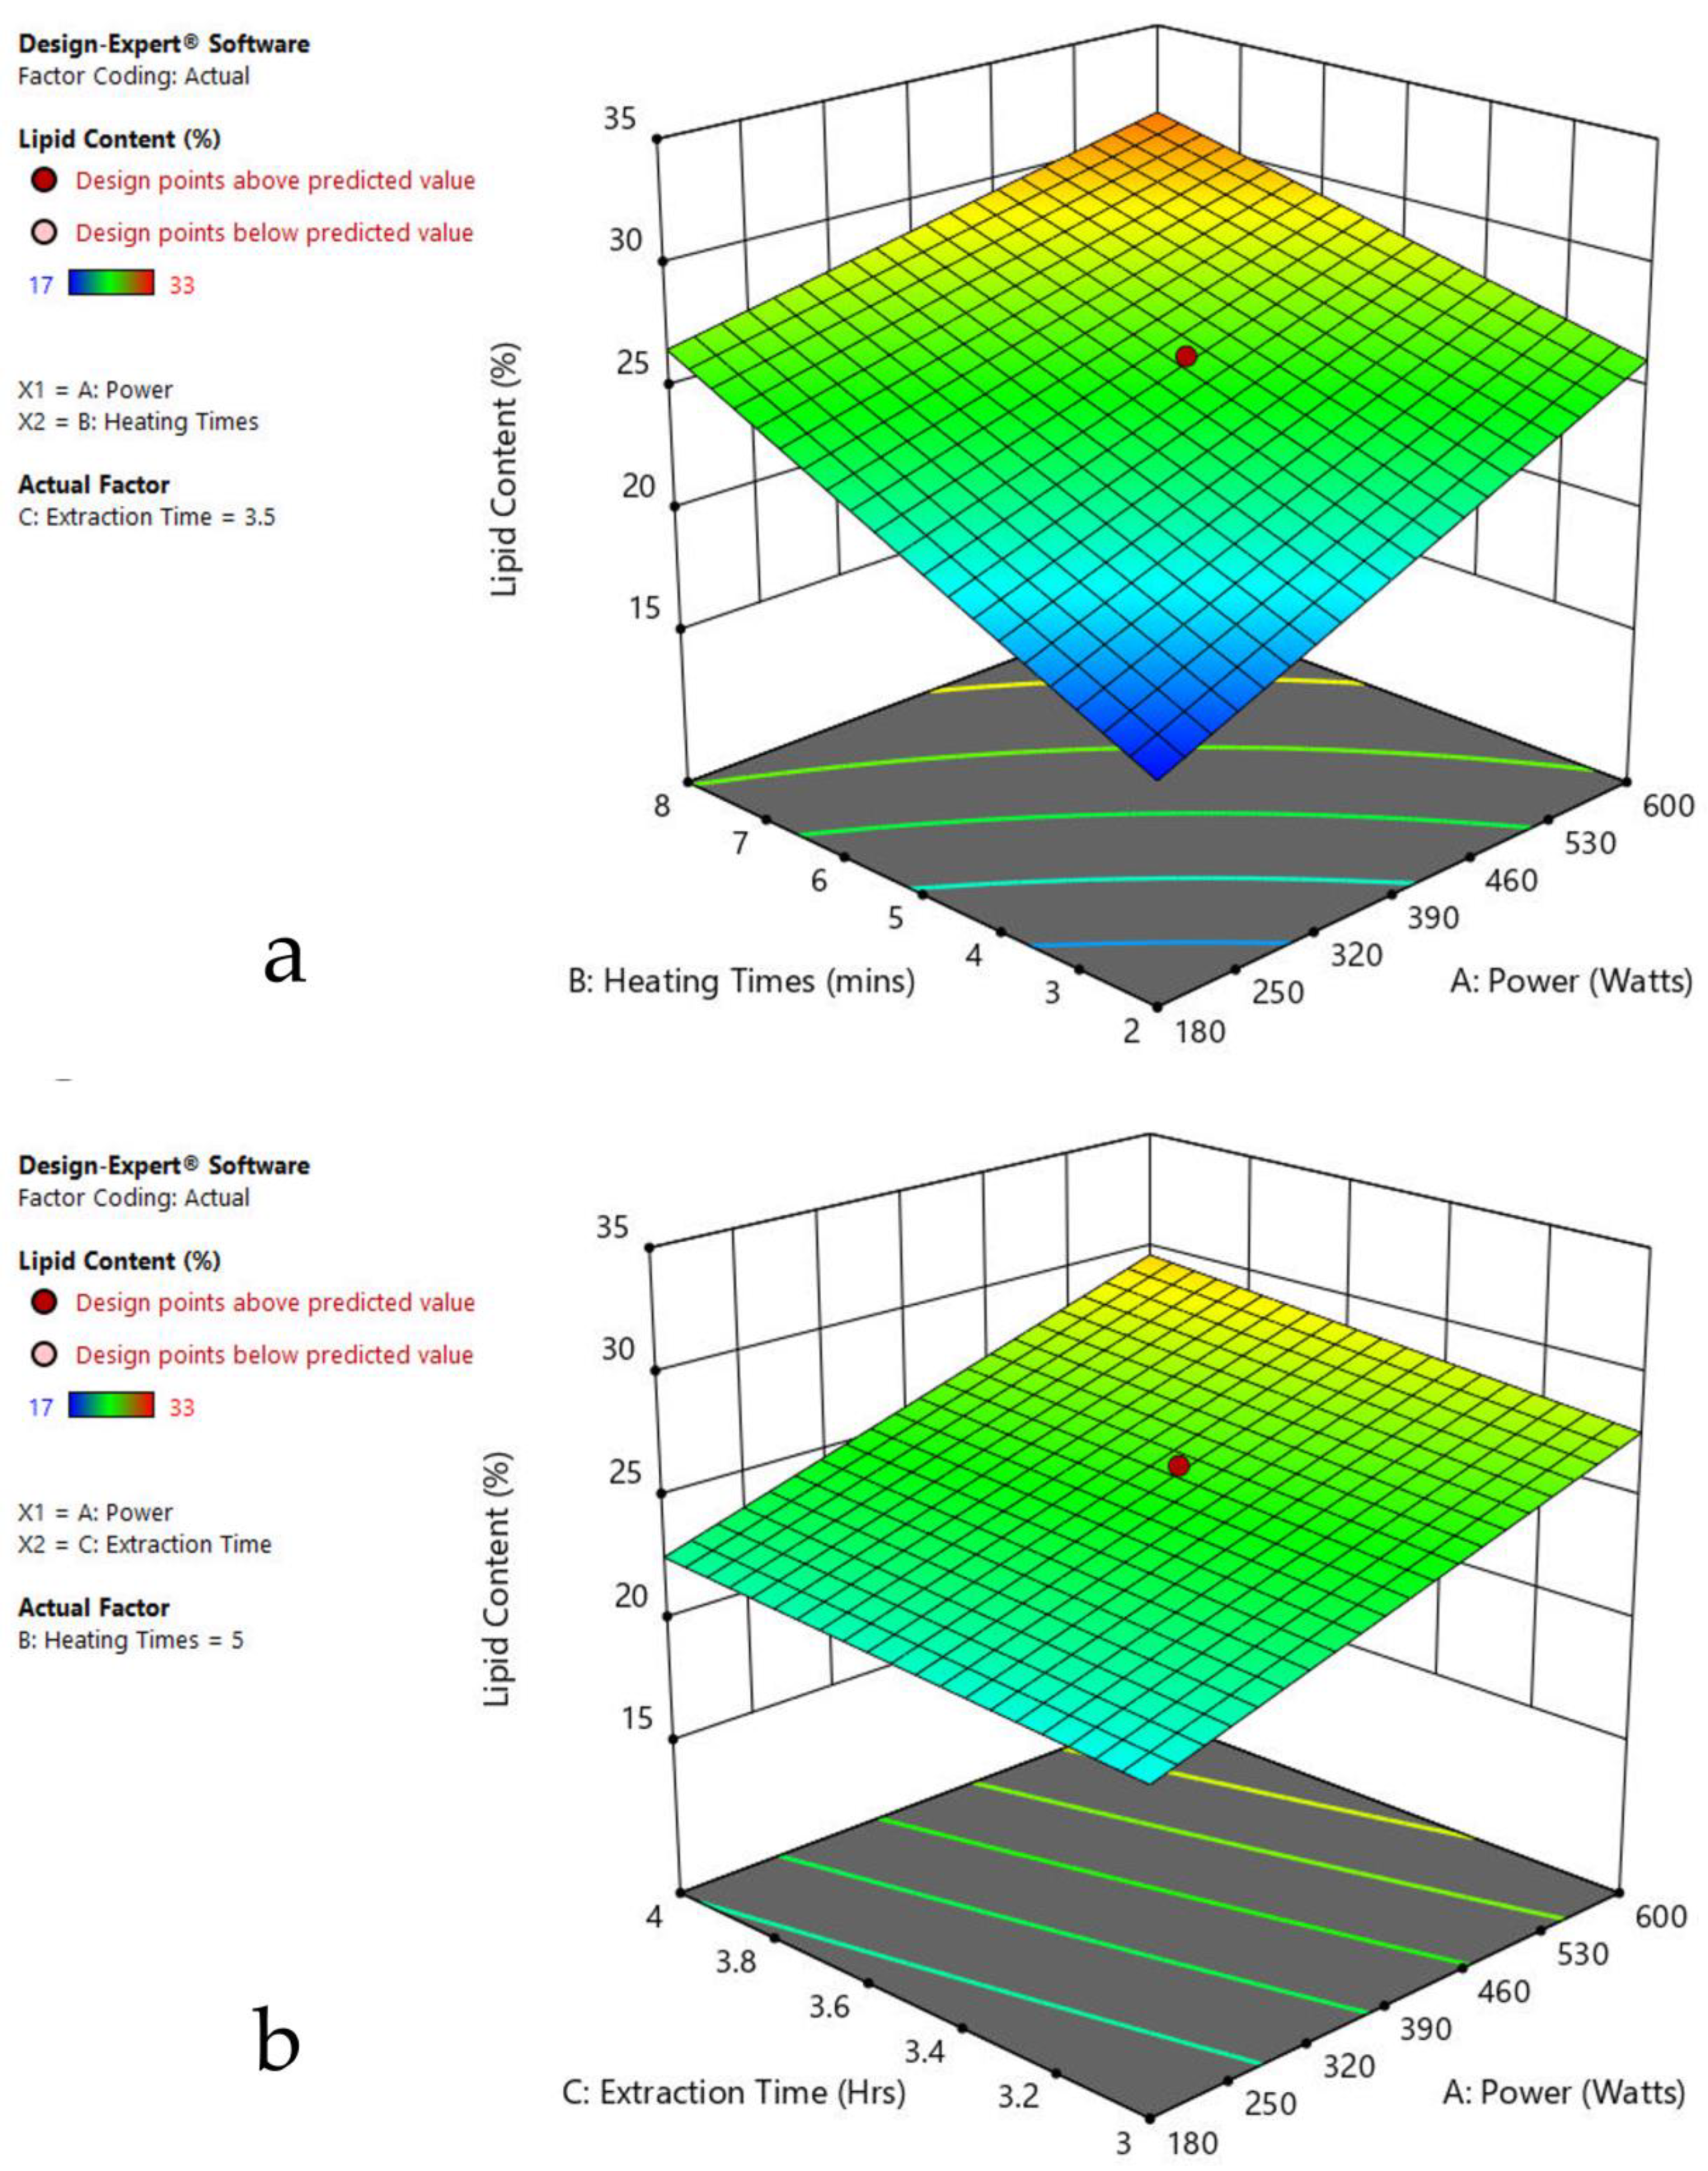
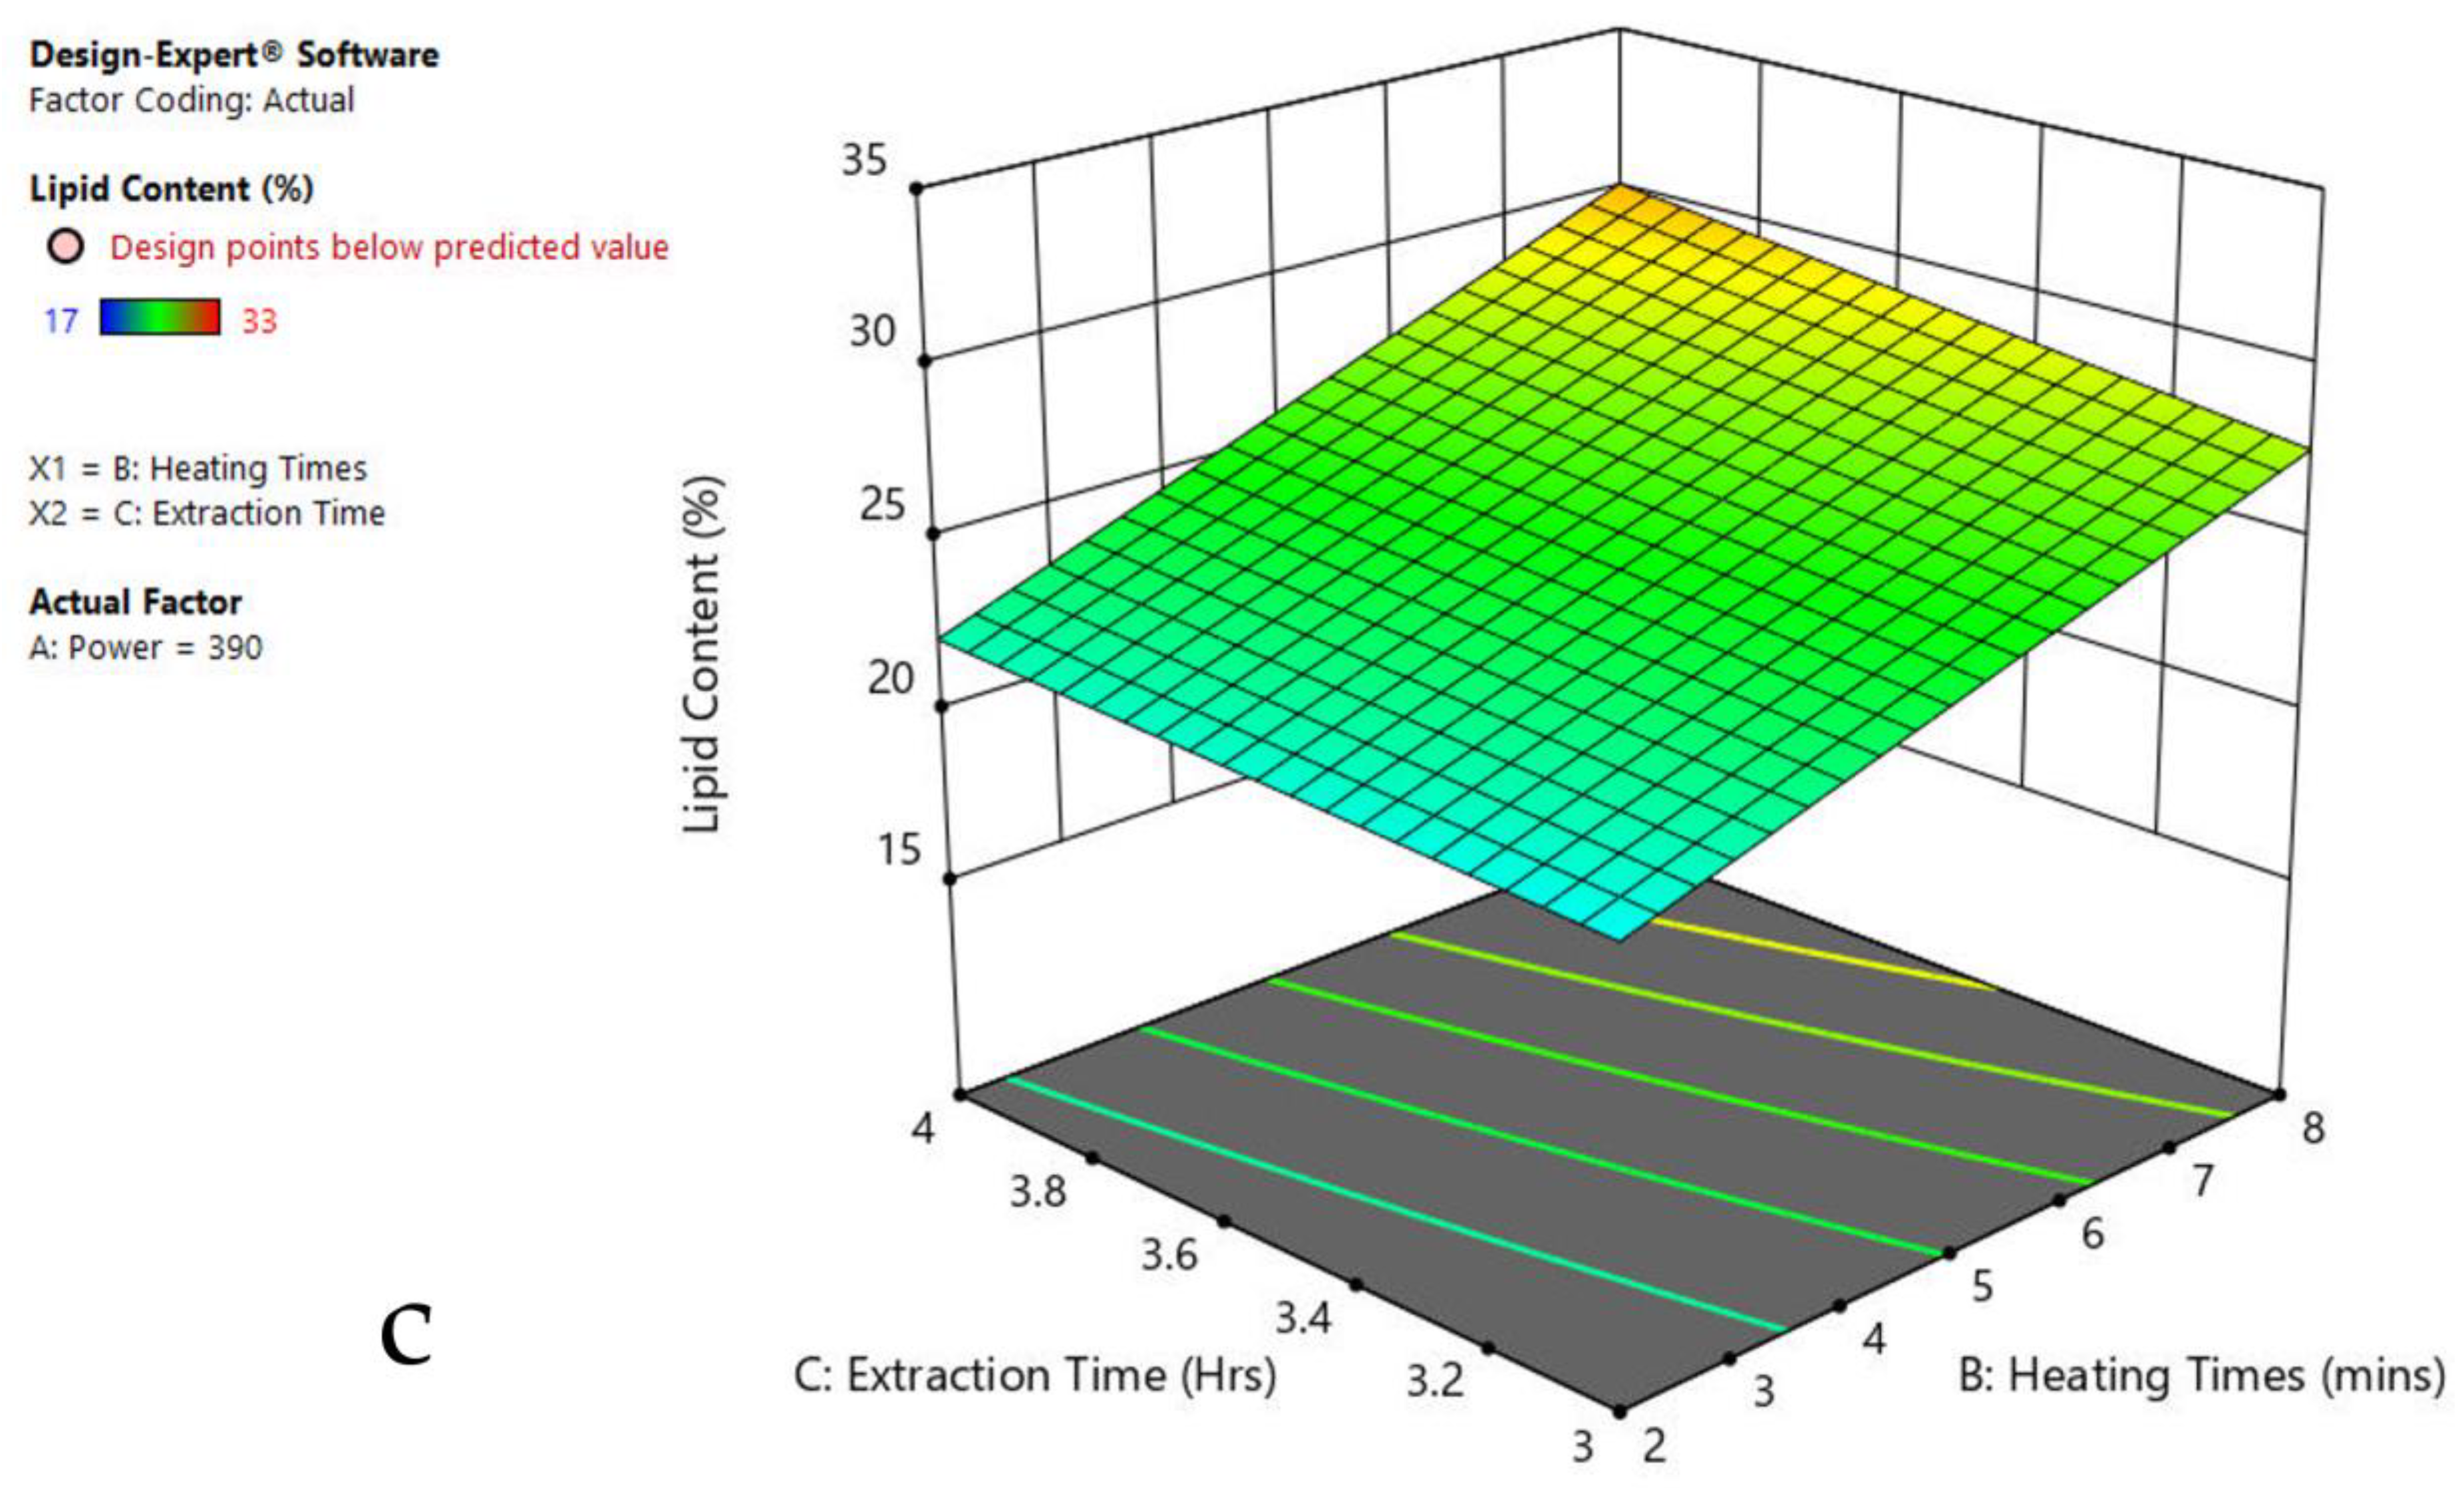
3.6. Interaction of Factors

The 3-D response surface graphs show the effect of factors on a particular response, and also demonstrate the interaction between factors, to locate the best level of each factor for the maximum response. The curved slope on the three-dimensional response surface (Figure 3, Figure 4, Figure 5, Figure 6, Figure 7 and Figure 8) displays the influence of microwave power, heating time, and extraction time on the lipids extracted from particular species. As the figures show, microwave power and heating time significantly influenced the lipid content.
The plots indicate that increasing the microwave power from 180 to 600 W resulted in the increase of the lipid extraction efficiency. When the power exceeded 600 W, the extraction rates were decreased. Increasing the microwave heating time from 1 to 8 min significantly increased the lipid content, but there was a slight reduction of the lipid content if the heating time was longer than 8 min. Extending the extraction time after microwaving from 2.5 to 3.5 h significantly increased the lipid content, but a slight reduction of lipid content was found in all observed species when extraction time was prolonged by more than 3.5 h. The red color indicates the points above the predicted value, while the pink color indicates the points below the predicted value.
Figure 9 displays the significant influence of sonication power and heating time on the lipid content of particular species. Increasing the sonication power from 30 to 80 kHz, and the extraction time from 3 to 8 min, resulted in an enhanced lipid extraction efficiency in all observed species.
According to the three-dimensional response surface (Figure 3, Figure 4, Figure 5, Figure 6, Figure 7, Figure 8 and Figure 9), there is a strong relationship between microwave power, heating time, and sonication power on the lipid content.

3.7. Fatty Acid Composition

Fatty acids are a major constituent of microalgae biomass. Fatty acids present in triacylglycerol are of commercial interest, because they can be used for the production of transportation fuels, bulk chemicals, nutraceuticals, and food commodities. To determine the quality of biodiesel, the fatty acid compositions of Oedogonium sp., Oscillatoria sp., Ulothrix sp., Chlorella sp., Cladophora sp., and Spirogyra sp. before and after pretreatment were analyzed, as listed in Table 9. The algae which were not treated with pretreatment methods are termed as the controls. The experiment runs having the highest lipid content (MAE runs number 7, 12, 15, 10, 9, 13; and UAE runs number 6, 6, 13, 2, 6, 2 of Oedogonium sp., Oscillatoria sp., Ulothrix sp., Chlorella sp., Cladophora sp. and Spirogyra sp., respectively) were further analyzed by GCMS. Palmitoleic acid, palmatic acid, oleic acid, myristic acid, linolenic acid, linoleic acid, and stearic acid are the major fatty acids detected in all six algal strains. Palmitoleic acid, palmatic acid, and oleic acid increased after pretreatment in all algal species, while myristic acid, linolenic acid, linoleic acid, and stearic acid decreased. The results indicate that Oedogonium sp. has a relatively high oleic acid as compared to other tested species. Gondoic acid, myristoleic acid, and arachidic acid were detected in Spirogyra sp., while traces of myristoleic acid were detected in Cladophora sp. Arachidate (21:0) was found in all tested algal strains except Oedogonium sp. and Cladophora sp. Erucate (22:1) was found in Ulothrix sp., Chlorella sp., and Spirogyra sp. Behenic acid was detected in Oedogonium sp., Ulothrix sp., Chlorella sp., and Cladophora sp. after microwave pretreatment. Arachidate, erucate, behenic acid, gondoic acid, and arachidic acid are only present in algal lipids and not in seed oils. Algal fatty acids range from 12 to 22 carbons in length [43], while 50–65% UFAs were found in Nannochloropsis oleabundans, Dunaliella tertiolecta, S. maxima, S. obliquus and C. vulgaris [44]. Palmitic acid was detected as the major component in Chlorella sp., Scenedesmus sp. and Botryococu sp., at 35.3%, 33.3%, and 31.7%, respectively, during cultivation in sewage water [45]. Studied algal oils consists of a combination of archidonic, eicosapentaenoic, docosahexaenoic, gamma-linolenic, and linoleic acids [46]. Methyl palmitate, methyl stearate, methyloleate, and methyl linoleate are the main components of Tolypothryx [47], Pithophora [48], Spirogyra, Hydrodictyon, Rhizoclonium [24] and Cladophora, while Chlorella vulgaris has mostly methyl linoleate and methyl palmitate [49]. MAE enhanced by 12% MUFAs, and by 1.5-fold PUFAs, in C. minutissima. Similar results were reported for T. cutaneum, where C16:0 and C18:1 comprise 60% of the total FAMEs [30]. The same trend is shown in the present study, where C16:0, C16:1, C18:1, C18:2, and C20:5 comprise 84.76% of the total fatty acids. In the current study, although both pretreatments induce these valuable fatty acids, microwave treatment induces more than sonication. The same was reported in Chlorella sp., where 61% fatty acids were extracted using UAE and 75% after MAE. The present study suggests that pretreatment is very important before lipid extraction, especially microwave treatment rather than sonication, because microwaves selectively release lipids from the algal matrix by causing local superheating of the lipid compounds to selectively extract them [50]. In contrast, ultrasound destroys the algal cell wall and releases unnecessary products, such as aroma compounds and other secondary metabolites, as well as lipids [51].

3.8. Fuel Properties

The fatty acid compositions and fuel properties of oils are important for the evaluation of biodiesel quality (Table 10). Fatty Acid Methyl Esters (FAME) are esters of fatty acids. The physical characteristics of fatty acid esters are closer to those of fossil diesel fuels than pure vegetable oils, but their properties depend on the type of vegetable oil. FAMEs analysis defines the quality of biodiesel. In the present study, the fuel properties were identified from fatty acid composition by using different formulas. The iodine value correlates with the degree of oil unsaturation in these studied algal strains. A low iodine value is very important for the oxidative stability of biodiesel produced from these new algal resources, because a high level of unsaturation cause glyceride polymerization and deposit formation, which ultimately deceases engine performance [52]. The iodine value of each algal strain used here was in the range of 77–93 g I2/100 g. According to the EN 14214 standard, biodiesels with an IV less than 120 g I2/100 g can improve engine performance. Both applied pretreatments on algal oil reduced IV compared to untreated controls. The saponification values were 170–206 mg KOH/g in all six studied algal strains. High SV levels mean a high acid percentage in biodiesel, that causes soap formation, which is not recommended [53]. The results indicated that SV levels reduced after the application of sonication and microwave pretreatments in algal species, especially in Chlorella sp. The reduction of the SV values by applying these pretreatment techniques promotes the production of biodiesel from these algal strains on a commercial scale. In the present study, the cetane numbers (CN) in all algal strains were in the range of 49–59, which seems an acceptable range compared to the current standards for biodiesel according to ASTM D6751 standard CN (minimum 47), while European standard EN 14214 (minimum 51) is recommended for better engine performance. A high CN relates to a good engine performance, which has been achieved in Chlorella sp. after microwave pretreatment [54]. The high heating values (HHV) in all species tested were in the range of 38.1 to 41 MJ/kg, while the highest HHV was observed in Chlorella sp. after microwave pretreatment. According to ASTM standard, the HHV for biodiesel should be more than 35 MJ/kg [55,56]. The cold filter plugging point determines the flow performance of biodiesel [57]. The CFPPs of the biodiesel from the six algae species were in the range of −10.6 to −16.3 °C. According to EN 14214, the CFPP of biodiesel should be 5–20 °C. Biodiesel rich in stearic and palmitic acid has a poor CFPP. In the current study, stearic acid reduced after pretreatment. The CFPPs of different algal strains have been reported to be between −12.3 to 20.8 °C [58], while peanut has a 19 °C CFPP, which is the highest among the seed oils [59].
Kinematic viscosity should be 1.9–6.0 mm2 s−1 (ASTM 6751) and 3.5–5.0 mm2 s−1 (EN 14214). Here, the overall kinematic viscosities of the biodiesels from all six algae strains were in the range of 3.6 to 4.1 mm2 s−1. According to EN 14214, the density of biodiesel should be 0.86–0.9 g cm−3, while there is no specification for density in ASTM 6751. Here, the densities of the biodiesels from the six algae strains were in the range of 0.87 to 0.88 g cm−3. In order to store biodiesel for a long time without autoxidation, biodiesel must have a suitable oxidation stability, which is ≥ 6 h at 110 °C (EN 14214), while no specification was recorded in ASTM 6751. In the current study, the oxidation stabilities of all six algae species were in the range of 56 to 237 h at 110 °C. In the present study, the highest oxidation stability was 237 h at 110 °C, in Chlorella sp. A good quality biodiesel has a high cetane number, low iodine value, high heating value, good cold flow properties, and high oxidation stability [60]. Oleic acid is a vital component of biodiesel due to its low meting point, high cetane number, and sufficient oxidative stability [61]. In the present study, when the pretreatment was applied to the algal strains, oleic acid increased in all six species. In the present study, all the studied fuel properties of the biodiesels from Oedogonium sp., Oscillatoria sp., Ulothrix sp., Chlorella sp., Cladophora sp., and Spirogyra sp. were within the range of the ASTM 6751 and EN 14214 standards. Furthermore, pretreatments not only enhance lipid recovery from algal biomass, but also improve lipid composition and fuel properties.

3.9. Comparative Analysis of Lipid Extraction Pretreatment

Lipid extraction is a primary bottleneck for commercial algal biodiesel production. Solvent extraction (chloroform, methanol, and hexane) is an extensively applied method for lipid recovery, but the algal cell walls act as a barrier between the lipids and the solvent. To overcome this problem, numerous mechanical, chemical, and biological cell disruption methods have been extensively studied [13,62]. Figure 10 demonstrates that mechanical methods, such as MAE and UAE, are an effective pretreatment to improve lipid recovery from algae as compared with previous studies [22,24].

4. Conclusions

Pretreatment of microalgal biomass is essential for the maximal recovery of biofuel precursors from complex microalgal cell walls. In the present work, a microwave method was exploited to enhance the biodiesel yield from microalgal biomass. This study suggested that the applied pretreatment protocols are able to enhance the lipid contents, particularly in Ulothrix, for biofuel production. The application of MAE is concluded to be an efficient technique for lipid extraction under the given conditions, due to a higher oil yield, lower solvent consumption, and lower time duration of Oedogonium sp., Oscillatoria sp., Ulothrix sp., Chlorella sp., Cladophora sp., and Spirogyra sp. We conclude that the statistical design methodology offers an efficient and feasible approach for the optimization of lipid extraction parameters in the studied algal strains. An improved fatty acid composition due to pretreatment offers the production of biodiesel at a low cost, which can enhance the energy resources and address the energy crisis at a mass scale in Pakistan. Overall, the current research facilitates a cost-effective, green methodology for microalgal biomass pretreatment in a short duration. Further, scale-up studies and in-depth technological interventions, such as using microwave absorbers, are required to establish the process’s credibility on a large scale.

Supplementary Materials

The following supporting information can be downloaded at: https://www.mdpi.com/article/10.3390/agriculture13020407/s1, Table S1: ANOVA results for developed quadratic model in Oedogonium (MAE); Table S2: ANOVA results for developed quadratic model in Oscillatoria (MAE); Table S3: ANOVA results for developed quadratic model in Ulothrix (MAE); Table S4: ANOVA results for developed quadratic model in Chlorella (MAE); Table S5: ANOVA results for developed quadratic model in Cladophora (MAE); Table S6: ANOVA results for developed quadratic model in Spirogyra (MAE); Table S7: ANOVA for developed quadratic model in Oedogonium (SAE); Table S8: ANOVA for developed quadratic model in Oscillatoria (SAE); Table S9: ANOVA for developed quadratic model in Ulothrix (SAE); Table S10: ANOVA for developed quadratic model in Chlorella (SAE); Table S11: ANOVA for developed quadratic model in Cladophora (SAE); Table S12: ANOVA for developed quadratic model in Spirogyra (SAE); Table S13: Fit Statistics for Response Surface Quadratic Model (MAE); Table S14: Fit Statistics for response Surface Quadratic Model (SAE).

Author Contributions

Conceptualization N.M.; methodology M.H. (Maria Hasnain); formal analysis Z.A. (Zainul Abideen); investigation M.H. (Maria Hasnain); resources, N.M.; writing-original draft preparation, M.H. (Maria Hasnain); writing-review and editing M.H. (Maria Hasnain), N.M., Z.A. (Zainul Abideen), H.M., M.H. (Maria Hamid), Z.A. (Zaheer Abbas), A.E.-K., R.M. and E.R.; visualization M.H. (Maria Hasnain), N.M., Z.A. (Zaheer Abbas), H.M., M.H. (Maria Hamid), Z.A. (Zainul Abideen), A.E.-K., R.M. and E.R.; supervision, N.M.; project administration and funding acquisition N.M. All authors have read and agreed to the published version of the manuscript.

Funding

This work was supported by the Higher Education Commission [grant number NRPU-2738] awarded to Neelma Munir.

Institutional Review Board Statement

Not applicable.

Informed Consent Statement

Not applicable.

Data Availability Statement

Not applicable.

Conflicts of Interest

Authors have no conflict of interest.

Abbreviations

Analysis of variance (ANOVA); Microwave assisted extraction (MAE); Ultrasound-assisted extraction (UAE); Response surface methodology (RSM); Central Composite Design (CCD); Triacylglyceride (TAG); FAME Fatty acid methyl ester; ASTM American Society for Testing and Materials; CN Cetane number; IV Iodine value; CFPP Cold filter plugging point; GCMS Gas chromatography-mass spectrometry; SV Saponification value; DU Degree of unsaturation; LCSF Long chain saturated factor; HHV Higher heating value; KV Kinematic viscosity, υ; ρ Density; MUFA Mono unsaturated fatty acid; PUFA Poly unsaturated fatty acid.

References

  1. Munir, N.; Hasnain, M.; Roessner, U.; Abideen, Z. Strategies in Improving Plant Salinity Resistance and Use of Salinity Resistant Plants for Economic Sustainability. Crit. Rev. Environ. Sci. Technol. 2022, 52, 2150–2196. [Google Scholar]
  2. Qadri, H.; Bhat, R.A. The Concerns for Global Sustainability of Freshwater Ecosystems. In Fresh Water Pollution Dynamics and Remediation; Springer: Singapore, 2020; pp. 1–13. [Google Scholar]
  3. Mann, A.; Kumar, A.; Sanwal, S.K.; Sharma, P.C. Sustainable Production of Pulses under Saline Lands in India. In Legume Crops-Prospects, Production and Uses; InTech Open: London, UK, 2020. [Google Scholar]
  4. Menegazzo, M.L.; Fonseca, G.G. Biomass Recovery and Lipid Extraction Processes for Microalgae Biofuels Production: A Review. Renew. Sustain. Energy Rev. 2019, 107, 87–107. [Google Scholar]
  5. Munir, N.; Abideen, Z.; Sharif, N. Development of Halophytes as Energy Feedstock by Applying Genetic Manipulations. All Life 2020, 13, 1–10. [Google Scholar]
  6. Hasnain, M.; Abideen, Z.; Naz, S.; Roessner, U.; Munir, N. Biodiesel Production from New Algal Sources Using Response Surface Methodology and Microwave Application. Biomass Convers. Biorefinery 2021. [Google Scholar] [CrossRef]
  7. Reed, O. Global Warming: Modeling Surface Structures for the Capture of Carbon Dioxide; University of Tennessee at Chattanooga: Chattanooga, TN, USA, 2020. [Google Scholar]
  8. Muhammad, G.; Alam, M.A.; Mofijur, M.; Jahirul, M.I.; Lv, Y.; Xiong, W.; Ong, H.C.; Xu, J. Modern Developmental Aspects in the Field of Economical Harvesting and Biodiesel Production from Microalgae Biomass. Renew. Sustain. Energy Rev. 2021, 135, 110209. [Google Scholar]
  9. Gnansounou, E.; Raman, J.K. Life Cycle Assessment of Algae Biodiesel and Its Co-Products. Appl. Energy 2016, 161, 300–308. [Google Scholar] [CrossRef]
  10. Hasnain, M.; Abideen, Z.; Anthony Dias, D.; Naz, S.; Munir, N. Utilization of Saline Water Enhances Lipid Accumulation in Green Microalgae for the Sustainable Production of Biodiesel. BioEnergy Res. 2022, 1–14. [Google Scholar] [CrossRef]
  11. Patil, S.; Lali, A.M.; Prakash, G. An Efficient Algae Cell Wall Disruption Methodology for Recovery of Intact Chloroplasts from Microalgae. J. Appl. Biol. Biotechnol. 2020, 8, 23–28. [Google Scholar]
  12. Teuling, E.; Wierenga, P.A.; Agboola, J.O.; Gruppen, H.; Schrama, J.W. Cell Wall Disruption Increases Bioavailability of Nannochloropsis Gaditana Nutrients for Juvenile Nile Tilapia (Oreochromis Niloticus). Aquaculture 2019, 499, 269–282. [Google Scholar]
  13. Patel, A.; Mikes, F.; Matsakas, L. An Overview of Current Pretreatment Methods Used to Improve Lipid Extraction from Oleaginous Microorganisms. Molecules 2018, 23, 1562. [Google Scholar]
  14. Hara, A.; Radin, N.S. Lipid Extraction of Tissues with a Low-Toxicity Solvent. Anal. Biochem. 1978, 90, 420–426. [Google Scholar] [CrossRef]
  15. Low, L.K. Analysis of Oils: Extraction of Lipids (Modified Folch’s Method). In Laboratory Manual on Analytical Methods and Procedures for Fish and Fish Products; Marine Fisheries Research Department, Southeast Asian Fisheries Development Center: Singapore, 1992; p. C–2. ISBN 9971883295. [Google Scholar]
  16. Chen, W.; Zhang, C.; Song, L.; Sommerfeld, M.; Hu, Q. A High Throughput Nile Red Method for Quantitative Measurement of Neutral Lipids in Microalgae. J. Microbiol. Methods 2009, 77, 41–47. [Google Scholar] [PubMed]
  17. Jensen, S.K. Improved Bligh and Dyer Extraction Procedure. Lipid Technol. 2008, 20, 280–281. [Google Scholar] [CrossRef]
  18. Ali, M.; Watson, I.A. Microwave Treatment of Wet Algal Paste for Enhanced Solvent Extraction of Lipids for Biodiesel Production. Renew. Energy 2015, 76, 470–477. [Google Scholar] [CrossRef]
  19. Katare, A.K.; Singh, B.; Shukla, P.; Gupta, S.; Singh, B.; Yalamanchili, K.; Kulshrestha, N.; Bhanwaria, R.; Sharma, A.K.; Sharma, S. Rapid Determination and Optimisation of Berberine from Himalayan Berberis Lycium by Soxhlet Apparatus Using CCD-RSM and Its Quality Control as a Potential Candidate for COVID-19. Nat. Prod. Res. 2022, 36, 868–873. [Google Scholar] [PubMed]
  20. Dehghani, M.H.; Karri, R.R.; Yeganeh, Z.T.; Mahvi, A.H.; Nourmoradi, H.; Salari, M.; Zarei, A.; Sillanpää, M. Statistical Modelling of Endocrine Disrupting Compounds Adsorption onto Activated Carbon Prepared from Wood Using CCD-RSM and DE Hybrid Evolutionary Optimization Framework: Comparison of Linear vs Non-Linear Isotherm and Kinetic Parameters. J. Mol. Liq. 2020, 302, 112526. [Google Scholar]
  21. Pashaei, H.; Ghaemi, A.; Nasiri, M.; Karami, B. Experimental Modeling and Optimization of CO2 Absorption into Piperazine Solutions Using RSM-CCD Methodology. ACS Omega 2020, 5, 8432–8448. [Google Scholar]
  22. Munir, N.; Sharif, N.; Naz, S.; Saleem, F.; Manzoor, F. Harvesting and Processing of Microalgae Biomass Fractions for Biodiesel Production (a Review). Sci. Technol. Dev. 2016, 32, 235–243. [Google Scholar]
  23. Reddy, A.; Majumder, A.B. Use of a Combined Technology of Ultrasonication, Three-Phase Partitioning, and Aqueous Enzymatic Oil Extraction for the Extraction of Oil from Spirogyra sp. J. Eng. 2014, 2014, 740631. [Google Scholar]
  24. Sharif, N.; Munir, N.; Saleem, F.; Aslam, F.; Naz, S. Mass Cultivation of Various Algal Species and Their Evaluation as a Potential Candidate for Lipid Production. Nat. Prod. Res. 2015, 29, 1938–1941. [Google Scholar]
  25. Hasnain, M.; Abideen, Z.; Hashmi, S.; Naz, S.; Munir, N. Assessing the Potential of Nutrient Deficiency for Enhancement of Biodiesel Production in Algal Resources. Biofuels 2022, 14, 1–34. [Google Scholar]
  26. Hasnain, M.; Munir, N.; Siddiqui, Z.S.; Ali, F.; El-Keblawy, A.; Abideen, Z. Integral Approach for the Evaluation of Sugar Cane Bio-Waste Molasses and Effects on Algal Lipids and Biodiesel Production. Waste Biomass Valorization 2023, 14, 23–42. [Google Scholar] [CrossRef]
  27. Singh, A.; Nigam, P.S.; Murphy, J.D. Mechanism and Challenges in Commercialisation of Algal Biofuels. Bioresour. Technol. 2011, 102, 26–34. [Google Scholar] [PubMed]
  28. Gupta, S.; Sharma, R.; Soni, S.K.; Sharma, S. Biomass Utilization of Waste Algal Consortium for Extraction of Algal Oil. J. Algal Biomass Util. 2012, 3, 34–38. [Google Scholar]
  29. Munir, N.; Imtiaz, A.; Sharif, N.; Haq, R.; Naz, S. Screening of Lipid Contents of Microalgae by Optimization of Oil Extraction Processes. Pak. J. Sci. 2016, 68, 1. [Google Scholar]
  30. Kumar, M.; Sun, Y.; Rathour, R.; Pandey, A.; Thakur, I.S.; Tsang, D.C.W. Algae as Potential Feedstock for the Production of Biofuels and Value-Added Products: Opportunities and Challenges. Sci. Total Environ. 2020, 716, 137116. [Google Scholar] [CrossRef]
  31. Qv, X.; Zhou, Q.; Jiang, J. Ultrasound-enhanced and Microwave-assisted Extraction of Lipid from Dunaliella tertiolecta and Fatty Acid Profile Analysis. J. Sep. Sci. 2014, 37, 2991–2999. [Google Scholar]
  32. Martínez, N.; Callejas, N.; Morais, E.G.; Costa, J.A.V.; Jachmanián, I.; Vieitez, I. Obtaining Biodiesel from Microalgae Oil Using Ultrasound-Assisted in-Situ Alkaline Transesterification. Fuel 2017, 202, 512–519. [Google Scholar]
  33. Koberg, M.; Cohen, M.; Ben-Amotz, A.; Gedanken, A. Bio-Diesel Production Directly from the Microalgae Biomass of Nannochloropsis by Microwave and Ultrasound Radiation. Bioresour. Technol. 2011, 102, 4265–4269. [Google Scholar] [CrossRef]
  34. Bermúdez Menéndez, J.M.; Arenillas, A.; Menéndez Díaz, J.Á.; Boffa, L.; Mantegna, S.; Binello, A.; Cravotto, G. Optimization of Microalgae Oil Extraction under Ultrasound and Microwave Irradiation. J. Chem. Technol. Biotechnol. 2014, 89, 1779–1784. [Google Scholar]
  35. Garoma, T.; Janda, D. Investigation of the Effects of Microalgal Cell Concentration and Electroporation, Microwave and Ultrasonication on Lipid Extraction Efficiency. Renew. Energy 2016, 86, 117–123. [Google Scholar]
  36. Jakhar, A.M.; Aziz, I.; Kaleri, A.R.; Hasnain, M.; Haider, G.; Ma, J.; Abideen, Z. Nano-Fertilizers: A Sustainable Technology for Improving Crop Nutrition and Food Security. NanoImpact 2022, 27, 100411. [Google Scholar] [PubMed]
  37. Nowacka, M.; Wiktor, A.; Dadan, M.; Rybak, K.; Anuszewska, A.; Materek, L.; Witrowa-Rajchert, D. The Application of Combined Pre-Treatment with Utilization of Sonication and Reduced Pressure to Accelerate the Osmotic Dehydration Process and Modify the Selected Properties of Cranberries. Foods 2019, 8, 283. [Google Scholar] [CrossRef] [PubMed]
  38. Abd El Fatah, H.M.; El-Baghdady, K.Z.; Zakaria, A.E.; Sadek, H.N. Improved Lipid Productivity of Chlamydomonas globosa and Oscillatoria pseudogeminata as a Biodiesel Feedstock in Artificial Media and Wastewater. Biocatal. Agric. Biotechnol. 2020, 25, 101588. [Google Scholar] [CrossRef]
  39. Lee, J.-Y.; Yoo, C.; Jun, S.-Y.; Ahn, C.-Y.; Oh, H.-M. Comparison of Several Methods for Effective Lipid Extraction from Microalgae. Bioresour. Technol. 2010, 101, S75–S77. [Google Scholar]
  40. Ferreira, A.F.; Dias, A.P.S.; Silva, C.M.; Costa, M. Effect of Low Frequency Ultrasound on Microalgae Solvent Extraction: Analysis of Products, Energy Consumption and Emissions. Algal Res. 2016, 14, 9–16. [Google Scholar] [CrossRef]
  41. De Souza Silva, A.P.F.; Costa, M.C.; Lopes, A.C.; Neto, E.F.A.; Leitão, R.C.; Mota, C.R.; dos Santos, A.B. Comparison of Pretreatment Methods for Total Lipids Extraction from Mixed Microalgae. Renew. Energy 2014, 63, 762–766. [Google Scholar]
  42. Zheng, H.; Yin, J.; Gao, Z.; Huang, H.; Ji, X.; Dou, C. Disruption of Chlorella vulgaris Cells for the Release of Biodiesel-Producing Lipids: A Comparison of Grinding, Ultrasonication, Bead Milling, Enzymatic Lysis, and Microwaves. Appl. Biochem. Biotechnol. 2011, 164, 1215–1224. [Google Scholar]
  43. Gouveia, L.; Oliveira, A.C. Microalgae as a Raw Material for Biofuels Production. J. Ind. Microbiol. Biotechnol. 2009, 36, 269–274. [Google Scholar]
  44. Fulke, A.B.; Mudliar, S.N.; Yadav, R.; Shekh, A.; Srinivasan, N.; Ramanan, R.; Krishnamurthi, K.; Devi, S.S.; Chakrabarti, T. Bio-Mitigation of CO2, Calcite Formation and Simultaneous Biodiesel Precursors Production Using Chlorella sp. Bioresour. Technol. 2010, 101, 8473–8476. [Google Scholar] [CrossRef]
  45. Maheshwari, N.; Krishna, P.K.; Thakur, I.S.; Srivastava, S. Biological Fixation of Carbon Dioxide and Biodiesel Production Using Microalgae Isolated from Sewage Waste Water. Environ. Sci. Pollut. Res. 2020, 27, 27319–27329. [Google Scholar] [CrossRef] [PubMed]
  46. Bagul, S.Y.; Bharti, R.K.; Dhar, D.W. Assessing Biodiesel Quality Parameters for Wastewater Grown Chlorella sp. Water Sci. Technol. 2017, 76, 719–727. [Google Scholar] [CrossRef] [PubMed]
  47. Benayache, N.-Y.; Nguyen-Quang, T.; Hushchyna, K.; McLellan, K.; Afri-Mehennaoui, F.-Z.; Bouaïcha, N. An Overview of Cyanobacteria Harmful Algal Bloom (CyanoHAB) Issues in Freshwater Ecosystems. Limnology: Some New Aspects of Inland Water Ecology; InTech Open: London, UK, 2019; pp. 1–25. [Google Scholar]
  48. Selvarajan, R.; Felföldi, T.; Tauber, T.; Sanniyasi, E.; Sibanda, T.; Tekere, M. Screening and Evaluation of Some Green Algal Strains (Chlorophyceae) Isolated from Freshwater and Soda Lakes for Biofuel Production. Energies 2015, 8, 7502–7521. [Google Scholar] [CrossRef] [Green Version]
  49. Rizwan, M.; Mujtaba, G.; Memon, S.A.; Lee, K. Influence of Salinity and Nitrogen in Dark on Dunaliella tertiolecta’s Lipid and Carbohydrate Productivity. Biofuels 2022, 13, 475–481. [Google Scholar]
  50. Rokicka, M.; Zieliński, M.; Dudek, M.; Dębowski, M. Effects of Ultrasonic and Microwave Pretreatment on Lipid Extraction of Microalgae and Methane Production from the Residual Extracted Biomass. BioEnergy Res. 2021, 14, 752–760. [Google Scholar]
  51. Almutairi, A.W.; Toulibah, H.E. Effect of Salinity and Ph on Fatty Acid Profile of the Green Algae Tetraselmis suecica. J. Pet. Environ. Biotechnol. 2017, 8, 3–8. [Google Scholar] [CrossRef]
  52. Chi, N.T.L.; Anto, S.; Ahamed, T.S.; Kumar, S.S.; Shanmugam, S.; Samuel, M.S.; Mathimani, T.; Brindhadevi, K.; Pugazhendhi, A. A Review on Biochar Production Techniques and Biochar Based Catalyst for Biofuel Production from Algae. Fuel 2021, 287, 119411. [Google Scholar]
  53. Sathish, T.; Singaravelu, D.K. Diesel Engine Emission Characteristics Study Using Algae Biofuel. J. Sci. Ind. Res. 2020, 79, 547–551. [Google Scholar]
  54. Karthikeyan, S.; Periyasamy, M.; Prathima, A. Performance Characteristics of CI Engine Using Chlorella vulgaris Microalgae Oil as a Pilot Dual Fuel Blends. Mater. Today Proc. 2020, 33, 3277–3282. [Google Scholar] [CrossRef]
  55. Banerji, A.; Deshpande, R.; Elk, M.; Shoemaker, J.A.; Tettenhorst, D.R.; Bagley, M.; Santo Domingo, J.W. Highlighting the Promise of QPCR-Based Environmental Monitoring: Response of the Ribosomal RNA: DNA Ratio of Calanoid Copepods to Toxic Cyanobacteria. Ecotoxicology 2021, 30, 411–420. [Google Scholar]
  56. Carter, S.K.; Pilliod, D.S.; Haby, T.; Prentice, K.L.; Aldridge, C.L.; Anderson, P.J.; Bowen, Z.H.; Bradford, J.B.; Cushman, S.A.; DeVivo, J.C. Bridging the Research-Management Gap: Landscape Science in Practice on Public Lands in the Western United States. Landsc. Ecol. 2020, 35, 545–560. [Google Scholar]
  57. Javed, F.; Aslam, M.; Rashid, N.; Shamair, Z.; Khan, A.L.; Yasin, M.; Fazal, T.; Hafeez, A.; Rehman, F.; Rehman, M.S.U. Microalgae-Based Biofuels, Resource Recovery and Wastewater Treatment: A Pathway towards Sustainable Biorefinery. Fuel 2019, 255, 115826. [Google Scholar]
  58. Rahman, A.; Agrawal, S.; Nawaz, T.; Pan, S.; Selvaratnam, T. A Review of Algae-Based Produced Water Treatment for Biomass and Biofuel Production. Water 2020, 12, 2351. [Google Scholar] [CrossRef]
  59. Li, P.; Du, Z.; Chang, C.; Zhao, S.; Xu, G.; Xu, C.C. Efficient Catalytic Conversion of Waste Peanut Shells into Liquid Biofuel: An Artificial Intelligence Approach. Energy Fuels 2020, 34, 1791–1801. [Google Scholar] [CrossRef]
  60. Joshi, M.P.; Thipse, S.S. Combustion Analysis of a Compression-Ignition Engine Fuelled with an Algae Biofuel Blend and Diethyl Ether as an Additive by Using an Artificial Neural Network. Biofuels 2021, 12, 429–438. [Google Scholar] [CrossRef]
  61. Fan, L.; Zhang, H.; Li, J.; Wang, Y.; Leng, L.; Li, J.; Yao, Y.; Lu, Q.; Yuan, W.; Zhou, W. Algal Biorefinery to Value-Added Products by Using Combined Processes Based on Thermochemical Conversion: A Review. Algal Res. 2020, 47, 101819. [Google Scholar] [CrossRef]
  62. Bai, X.; Naghdi, F.G.; Ye, L.; Lant, P.; Pratt, S. Enhanced Lipid Extraction from Algae Using Free Nitrous Acid Pretreatment. Bioresour. Technol. 2014, 159, 36–40. [Google Scholar]
Figure 1. Experimental workflow of screening and pretreatments of algal biomass for biodiesel production.
Agriculture 13 00407 g001
Figure 2. Phylogenetic tree of identified and closely related sequences, constructed using a nucleotide substitution model, 1000 rounds of bootstrap resampling, and the Kimura 2-parameter through-neighbor joining method.
Agriculture 13 00407 g002
Figure 3. Response surface plots of the combined effect of MAE parameters on lipid content of Oedogonium sp. (a) Heating time (h) and Power (Watts) (b) Extraction time (h) and Power (Watts) (c) Extraction time (h) and Heating time (Mins). Color based on response value: blue color shows the minimum points, red color shows the maximum points, pink color indicates points below the predicted value.
Agriculture 13 00407 g003aAgriculture 13 00407 g003b
Figure 4. Response surface plots of the combined effect of MAE parameters on lipid content of Oscillatoria sp. (a) Heating time (hr) and Power (Watts) (b) Extraction time (hr) and Power (Watts) (c) Extraction time (hr) and Heating time (Mins). Color based on response value: blue color shows the minimum points, red color shows the maximum points, pink color indicates points below the predicted value.
Agriculture 13 00407 g004aAgriculture 13 00407 g004b
Figure 5. Response surface plots of the combined effect of MAE parameters on lipid content of Ulothrix sp. (a) Heating time (hr) and Power (Watts) (b) Extraction time (hr) and Power (Watts) (c) Extraction time (hr) and Heating time (Mins). Color based on response value: blue color shows the minimum points, red color shows the maximum points, pink color indicates points below the predicted value.
Agriculture 13 00407 g005aAgriculture 13 00407 g005b
Figure 6. Response surface plots of the combined effect of MAE parameters on lipid content of Chlorella sp. (a) Heating time (hr) and Power (Watts) (b) Extraction time (hr) and Power (Watts) (c) Extraction time (hr) and Heating time (Mins). Color based on response value: blue color shows the minimum points, red color shows the maximum points, pink color indicates points below the predicted value.
Agriculture 13 00407 g006aAgriculture 13 00407 g006b
Figure 7. Response surface plots of the combined effect of MAE parameters on lipid content of Cladophora sp. (a) Heating time (hr) and Power (Watts) (b) Extraction time (hr) and Power (Watts) (c) Extraction time (hr) and Heating time (Mins). Color based on response value: blue color shows the minimum points, red color shows the maximum points, pink color indicates points below the predicted value.
Agriculture 13 00407 g007aAgriculture 13 00407 g007b
Figure 8. Response surface plots of combined effect of the MAE parameters on lipid content of Spirogyra sp. (a) Heating time (hr) and Power (Watts) (b) Extraction time (hr) and Power (Watts) (c) Extraction time (hr) and Heating time (Mins). Color based on response value: blue color shows the minimum points, red color shows the maximum points, pink color indicates points below the predicted value.
Agriculture 13 00407 g008aAgriculture 13 00407 g008b
Figure 9. Response surface plots of the combined effect of UAE parameters on lipid content of (a) Oedogonium sp. (b) Oscillatoria sp. (c) Ulothrix sp. (d) Chlorella sp. (e) Cladophora sp. (f) Spirogyra sp. Color based on response value: blue color shows the minimum points, red color shows the maximum points, pink color indicates points below the predicted value.
Agriculture 13 00407 g009aAgriculture 13 00407 g009b
Figure 10. Comparison of algal lipids (%) after pretreatment with conventional lipid extraction method.
Agriculture 13 00407 g010
Table 1. Central composite design results of the combined effect of factors of MAE in Oedogonium sp.
Factor 1Factor 2Factor 3Response 1
StdRunA:PowerB:Heating TimesC:Extraction TimeLipid Content
WattsMinsHr%
13139053.531
221808326
9339053.531
19439052.530
5539054.532
3639053.531
1776008438.5
1886002428
11939053.531
161039013.522
71139053.531
4121802319
613390103.535
14141802420
8156008338
121675053.537
10176002327.5
15181808427
11939053.531
202036053.531
Table 2. Central composite design results of the combined effect of factors of MAE in Oscillatoria sp.
Factor 1Factor 2Factor 3Response 1
StdRunA:PowerB:Heating TimesC:Extraction TimeLipid Content
WattsMinsHrs%
711808428
321808326
16339053.529
14439054.532
9518053.524
866008432
171802317
15839053.529
11939013.516
2106002331
5111802420
101260053.534
201339053.529
1214390103.533.5
191539053.529
4166008332
13173905331
6186002432
171939053.529
182039053.529
Table 3. Central composite design results of the combined effect of MAE in Ulothrix sp.
Factor 1Factor 2Factor 3Response 1
StdRunA:PowerB:Heating TimesC:Extraction TimeLipid Content
WattsMinsHr%
1216002438
13239053.547
131802324
154390103.549
16539052.547
5639054.548
2071802430
9818053.535
3939053.547
10101808338
111139013.529
8126008445
41375053.547
17141808439
2156008355
71639053.547
61739053.547
14186002337
181939053.547
192039053.547
Table 4. Central composite design results of the combine effect of factors of MAE in Chlorella sp.
Factor 1Factor 2Factor 3Response 1
StdRunA:PowerB:Heating TimesC:Extraction TimeLipid Content
WattsMinsHr%
16139053.540
17239054.539
14339053.540
1546008347
256002437
761802326
171808339
6839053.540
11939053.540
4106008448
121139052.540
201239013.527
81339083.542
181439053.540
19156002337
31670053.541
5171802426
101839053.540
91960053.545
13201808439
Table 5. Central composite design results of the combined effect of factors of MAE in Cladophora sp.
Factor 1Factor 2Factor 3Response 1
StdRunA:PowerB:Heating TimesC:Extraction TimeLipid Content
WattsminsHrs%
14139053.532
521802422
636002434
246002333
751808435
361808333
9736553.530
10841553.533
896008440
1101802321
111139053.532
4126008337
121339053.532
131439053.532
191539054.534
161639052.532
201739013.524
151839083.537
181970053.537.5
172060053.538
Table 6. Central composite design results of the combined effect of factors of MAE in Spirogyra sp.
Factor 1Factor 2Factor 3Response 1
StdRunA:PowerB:Heating TimesC:Extraction TimeLipid Content
WattsMinsHrs%
9136553.523
121802317
10341553.526
13439053.525
12539053.525
666002427
771808428
14839053.525
496008330
2106002326
3111808326
5121802418
8136008433
111439053.525
201539054.526
171639052.524
191739013.518
151839083.527
181970053.532
162060053.531.5
Table 7. Central composite design results of the combined effect of factors of UAE in algal species.
Factor 1Factor 2Lipid Content
StdRunA:PowerB:Extraction TimeOedogonium sp.Oscillatoria sp.Ulothrix sp.Chlorella sp.Cladophora sp.Spirogyra sp.
kHzMins%%%%%%
81608252045352919
122606241744322616
93606241744322616
34408171636262115
15404161435241513
46808322151403620
107606241744322616
78603211638302515
29804271846362917
1110606241744322616
1311606241744322616
61280631.519493831.518
513306141432201413
Table 8. Equations in terms of coded factors of quadratic model of MAE.
Lipid Parameter ContentsCorrelation
Oedogonium sp. + 31.09 + 5.12 A + 4.56 B + 0.4375 C + 0.8750 A B 0.1250 A C + 0.0000 B C 1.18 A 2 1.60 B 2 0.0781 C 2 (2)
Oscillatoria sp. + 32.51 + 3.80 A + 2.27 B + 0.5193 C 1.0000 A B 0.2500 A C + 0.0000 B C 2.66 A ² 1.49 B ² 0.3234 C ²         (3)
Ulothrix sp. + 46.70 + 6.08 A + 6.73 B + 0.0000 C + 0.2500 A B 2.00 A C 2.00 B C 4.05 A ² 4.04 B ² + 0.0858 C ²     (4)
Chlorella sp. + 39.79 + 4.66 A + 6.01 B 0.1250 C 0.5000 A B + 0.0000 A C + 0.0000 B C 1.20 A ² 1.78 B ² + 0.0802 C ² (5)
Cladophora sp. + 31.86 + 4.15 A + 4.37 B + 0.8750 C 1.87 A B + 0.1250 A C + 0.3750 B C 2.68 A ² 2.60 B ² 0.0991 C ²   (6)
Spirogyra sp. + 25.29 + 3.41 A + 3.62 B + 0.8750 C 1.12 A B + 0.1250 A C + 0.3750 B C 1.10 A ² 1.30 B ² 0.0341 C ² (7)
Equations in terms of coded factors of quadratic model of SAE
Oedogonium sp. + 24.09 + 6.66 A + 1.38 B + 1.00 A B 0.1193 A ²   0.6625 B ²       (8)
Oscillatoria sp. + 16.98 + 2.13 A + 1.29 B + 0.2500 A B 0.0161 A ² + 0.4066 B ²         (9)
Ulothrix sp. + 44.01 + 6.44 A + 1.80 B + 1.00 A B 0.9815 A ² 1.23 B ²     (10)
Chlorella sp. + 32.11 + 6.59 A + 1.79 B + 0.5000 A B 0.9575 A ² + 0.3769 B ²     (11)
Cladophora sp. + 25.88 + 6.87 A + 2.71 B + 0.2500 A B 1.10 A ² + 0.9397 B ²         (12)
Spirogyra sp. + 15.98 + 2.13 A + 1.29 B + 0.2500 A B 0.0161 A ² + 0.4066 B ²         (13)
Table 9. Lipid composition of algal strains.
Fatty AcidsOedogonium sp.Oscillatoria sp.Ulothrix sp.Chlorella sp.Cladophora sp.Spirogyra sp.
ControlMAEUAEControlMAEUAEControlMAEUAEControlMAEUAEControlMAEUAEControlMAEUAE
Myristoleic acid (14:1)0.15-----------0.32--0.180.120.15
Myristic acid (14:0)0.370.250.280.340.260.300.190.120.160.200.100.150.180.110.150.05-0.01
Hexadecadienoic (16:2)0.460.290.34------------2.282.112.18
Palmitoleic acid (16:1)2.923.53.20.381.120.81---0.100.310.22---0.370.560.41
Palmatic acid (16:0)1.191.381.263.123.213.190.281.100.571.01.281.190.441.220.980.190.310.29
Linolenic acid (18:3)0.440.390.40------------0.680.450.51
Linoleic acid (18:2)0.380.230.282.181.912.10.60.40.50.500.410.462.131.801.901.561.111.28
Oleic acid (18:1)3.123.523.312.153.112.250.461.911.510.100.250.150.150.190.170.351.231.17
Stearic acid (18:0)1.321.231.273.142.722.98---------0.06--
Gondoic acid (20:1)---------------0.18--
Arachidic acid (20:0)---------------0.14--
Erucic acid (22:1)0.460.290.31------0.120.110.100.120.120.12---
Caprylate (8:0)---0.720.710.700.340.330.34---0.340.330.34---
Caprate (10:0)---1.381.361.380.670.510.61---0.130.130.12---
Laurate (12:0)---8.578.518.520.280.280.28---0.620.600.61---
Methyl myristate (14:0)4.513.523.81---3.353.213.292.211.911.893.343.293.312.161.901.95
Methyl palmitoleate (16:1)3.163.013.1110.49.519.815.134.135.103.132.72.93.272.933.125.904.214.34
Methyl palmitate (16:0)46.4139.1040.112.510.0111.124.4121.1422.240.0343734.329.130.049.743.244.5
Linolenate (18:3)2.352.122.249.178.518.812.642.262.430.810.490.627.626.216.911.431.211.32
Linoleate (18:2)2.582.232.43.132.692.819.167.818.122.121.721.915.464.414.900.540.350.43
Methyl oleate (18:1)28.0625.2426.116.1914.0115.644.2440.1241.142.539.141.842.838.139.029.127.028.3
Methyl stearate (18:0)2.172.252.1827.1427.2127.13.874.154.103.923.253.51---5.25.85.5
Arachidate (21:0)---0.650.620.642.442.212.361.0-----1.11.11.1
Erucate (22:1)---- 2.232.192.211.0-----0.50.50.5
Behenic acid (22:0)-0.10-----0.15--0.12--0.13----
Table 10. Fuel properties of the six algal strains studied here.
AlgaeIV (g
I2100/g fat)
SV (mg
KOH/g)
CNLCSFCFPP (°C)HHVi (MJ/kg)ρ (g cm−3)ʋ (mm2 /s)Y (Hour) at 110 °C
Biodiesel Standard EN 14214≤120-≥51-≤5/≤−20NA0.86–0.93.5–5.0≥6
Biodiesel Standard
ASTM D6751-02
NA-≥47-NA≥35NA1.9–6.0-
Oedogonium sp.Control91.6202500.85−13.838.180.874.0171
MAE81178560.75−14.738.50.873.8192
UAE84182540.76−14.038.40.873.6176
Oscillatoria sp.Control93206491.60−11.4380.883.956
MAE88.3194521.4−11.838.30.874.064
UAE90.7199501.8−10.738.10.874.158
Ulothrix sp.Control88.8195510.028−16.338.120.883.6199
MAE81.6180540.11−16.138.60.873.7297
UAE85185530.057−16.238.30.873.6238
Chlorella sp.Control88195522.05−14.2139.10.873.7237
MAE77170591.7−11.13410.873.9290
UAE82182551.8−10.6139.10.873.8258
Cladophora sp.Control91201500.04−16.338.400.873.658.6
MAE80176570.12−16.039.50.873.768
UAE82182560.09−16.1390.873.762
Spirogyra sp.Control92204500.09−13.6400.883.955
MAE82182550.03−16.339.50.87478
UAE85188530.02−16.3390.873.958
Disclaimer/Publisher’s Note: The statements, opinions and data contained in all publications are solely those of the individual author(s) and contributor(s) and not of MDPI and/or the editor(s). MDPI and/or the editor(s) disclaim responsibility for any injury to people or property resulting from any ideas, methods, instructions or products referred to in the content.

