Article

Detection of the Corn Kernel Breakage Rate Based on an Improved Mask Region-Based Convolutional Neural Network

College of Mechanical and Electrical Engineering, Henan Agricultural University, Zhengzhou 450002, China
*
Author to whom correspondence should be addressed.
Agriculture 2023, 13(12), 2257; https://doi.org/10.3390/agriculture13122257
Submission received: 31 October 2023 / Revised: 6 December 2023 / Accepted: 8 December 2023 / Published: 10 December 2023

Abstract

:
Real-time knowledge of kernel breakage during corn harvesting plays a significant role in the adjustment of operational parameters of corn kernel harvesters. (1) Transfer learning by initializing the DenseNet121 network with pre-trained weights for training and validating a dataset of corn kernels was adopted. Additionally, the feature extraction capability of DenseNet121 was improved by incorporating the attention mechanism of a Convolutional Block Attention Module (CBAM) and a Feature Pyramid Network (FPN) structure. (2) The quality of intact and broken corn kernels and their pixels were found to be coupled, and a linear regression model was established using the least squares method. The results of the test showed that: (1) The MAPb50 and MAPm50 of the improved Mask Region-based Convolutional Neural Network (RCNN) model were 97.62% and 98.70%, in comparison to the original Mask Region-based Convolutional Neural Network (RCNN) model, which were improved by 0.34% and 0.37%, respectively; the backbone FLOPs and Params were 3.09 GMac and 9.31 M, and the feature extraction time was 206 ms; compared to the original backbone, these were reduced by 3.87 GMac and 17.32 M, respectively. The training of the obtained prediction weights for the detection of a picture of the corn kernel took 76 ms, so compared to the Mask RCNN model, it was reduced by 375 ms; based on the concept of transfer learning, the improved Mask RCNN model converged twice as quickly with the loss function using pre-training weights than the loss function without pre-training weights during training. (2) The coefficients of determination R2 of the two models, when the regression models of the pixels and the quality of intact and broken corn kernels were analyzed, were 0.958 and 0.992, respectively. These findings indicate a strong correlation between the pixel characteristics and the quality of corn kernels. The improved Mask RCNN model was used to segment mask pixels to calculate the corn kernel breakage rate. The verified error between the machine vision and the real breakage rate ranged from −0.72% to 0.65%, and the detection time of the corn kernel breakage rate was only 76 ms, which could meet the requirements for real-time detection. According to the test results, the improved Mask RCNN method had the advantages of a fast detection speed and high accuracy, and can be used as a data basis for adjusting the operation parameters of corn kernel harvesters.

1. Introduction

In China, corn is a significant feed, economic product, and food crop [1]. China has intensively marketed corn harvesters as mechanization has advanced. However, corn breakage can be easily caused by improperly adjusting the operational parameters of corn harvesters [2]. According to the national standard “GB/T 21962-2020” [3], corn harvester breakage rates must not exceed 5%. Therefore, to decrease the breakage rate when the corn breakage rate is high, the operational parameters of corn kernel harvesters must be changed. Traditional methods of measuring the corn kernel breakage rate include picking, weighing, and calculating by hand, which is labor- and time-intensive and does not allow for real-time detection of and feedback on the breakage rate. There is an urgent demand for innovative techniques and approaches. Using machine vision technology to recognize and segment intact and broken corn kernels to calculate the breakage rate not only improves efficiency but also has advantages such as precision and non-destructive testing. With recent advancements in machine vision technology, techniques like segmentation, object identification, and image classification have achieved prominence in the agricultural sector. The utilization of machine vision technology for crop detection has been the subject of extensive research conducted by both domestic and international scholars.
Regarding crop identification, Qiu [4] et al. used a convolutional neural network (CNN) to detect rice seeds of four different types and compared it to closest-neighbor KNN and support vector machine (SVM) methods with various training sample sizes. In the validation set, the CNN had a recognition accuracy of 87.0%; Han [5] et al. identified peanut samples containing aflatoxin using hyperspectral imaging and CNN techniques, with a recognition accuracy of 90.0%; Przybyo [6] and colleagues employed a CNN to learn both the local and global properties of acorns, which were then used to distinguish between healthy and broken acorns, with an accuracy of 85.0%; Zhang [7] et al. improved the AlexNet model to recognize five levels of peanut pods, with an average accuracy of 95.43%; Mao [8] et al. identified moderate, severe, and yellow dwarf illness using an improved faster RCNN, with an average accuracy of 91.06%.
In grain integrity recognition, Ni [9] et al. used a hierarchical system research method to establish a prototype detection visual system for corn kernels, which was used to distinguish between intact and broken corn kernels, with an accuracy of 87%. The detection time for a single corn kernel was between 1.5 s and 1.8 s; Steenhoek [10] et al. explored the detection of broken and moldy corn kernels. They utilized the color difference between broken and moldy corn kernels and intact kernels, and used the RGB pixel value of the image as a feature parameter. The recognition accuracy for broken and moldy corn kernels using neural networks reached 92%, but different lighting and camera depth effects could lead to image segmentation errors; Zhao [11] et al. used convolutional neural networks to recognize the integrity of peanut seeds, with a classification accuracy of 98.18% and an average detection time of 18 ms for a single peanut image; Chen [12] et al. adopted the multi-scale retinex with a color restoration algorithm to enhance the images and distinguish between intact and broken rice grains by color. The final segmentation result was then obtained using morphological processing. When encountering situations where impurities were similar to the color of the grains, classification and recognition errors arose readily; Song [13] et al. used the watershed approach and an improved object segmentation algorithm based on the OpenCV image processing package to extract the contours of soybean seeds in the image. Respectively, 95.2% and 91.25% of intact and broken soybean seeds were recognized. An image took an average time of 1.16 s to process, which is far too long.
In terms of calculation of the breakage rate, Mahirah et al. [14,15] proposed a dual light source illumination monitoring system for grain breakage and impurity content in the grain bin of a grain combine harvester, but did not calculate the grain breakage rate and impurity content; Yang [16] et al. created an online sampling tool for the corn kernel breakage rate, which was only used to sample grains in the grain bin of the corn kernel harvester and did not detect the status of the corn kernel breakage rate; Chen [17] et al. used an improved watershed algorithm to segment soybean seed images. The accuracy rates for intact and broken seeds were 87.26% and 86.45%, respectively. Based on the constructed quantitative model for the soybean seed breakage rate, the relative error between the calculated breakage rate and the actual breakage rate was 0.79%; Jin [18] et al. used an improved U-Net network to detect and classify intact and broken soybean seeds. The values of the comprehensive evaluation index were 95.50% and 91.88%, respectively. The bench test results showed that the absolute error of the mean for detecting the soybean seed breakage rate was 0.13% compared to the mean absolute error for manual detection; Liu [19] et al. segmented soybean seed images based on the DeepLabV3+segmentation network. The comprehensive evaluation index F1 values for intact and broken seeds were 89.49% and 93.93%. The relative error between the breakage rate calculated by the constructed quantitative model and the actual breakage rate was 0.36%.
Machine vision technology is still immature in terms of its application to the detection of grain breakage rate. Most researchers have adopted the traditional machine learning method, but this form of recognition did not have a generalization ability, so it is necessary to develop a real-time method for the detection of the grain breakage rate using a deep learning algorithm. In this study, an improved Mask RCNN [20] model was proposed, which can reduce the computational burden (and the number of parameters), and improve the detection accuracy and detection speed. The improved Mask RCNN can realize fast and accurate identification and segmentation of corn kernels, and achieve the purpose of the real-time detection of the breakage rate.

2. Materials and Methods

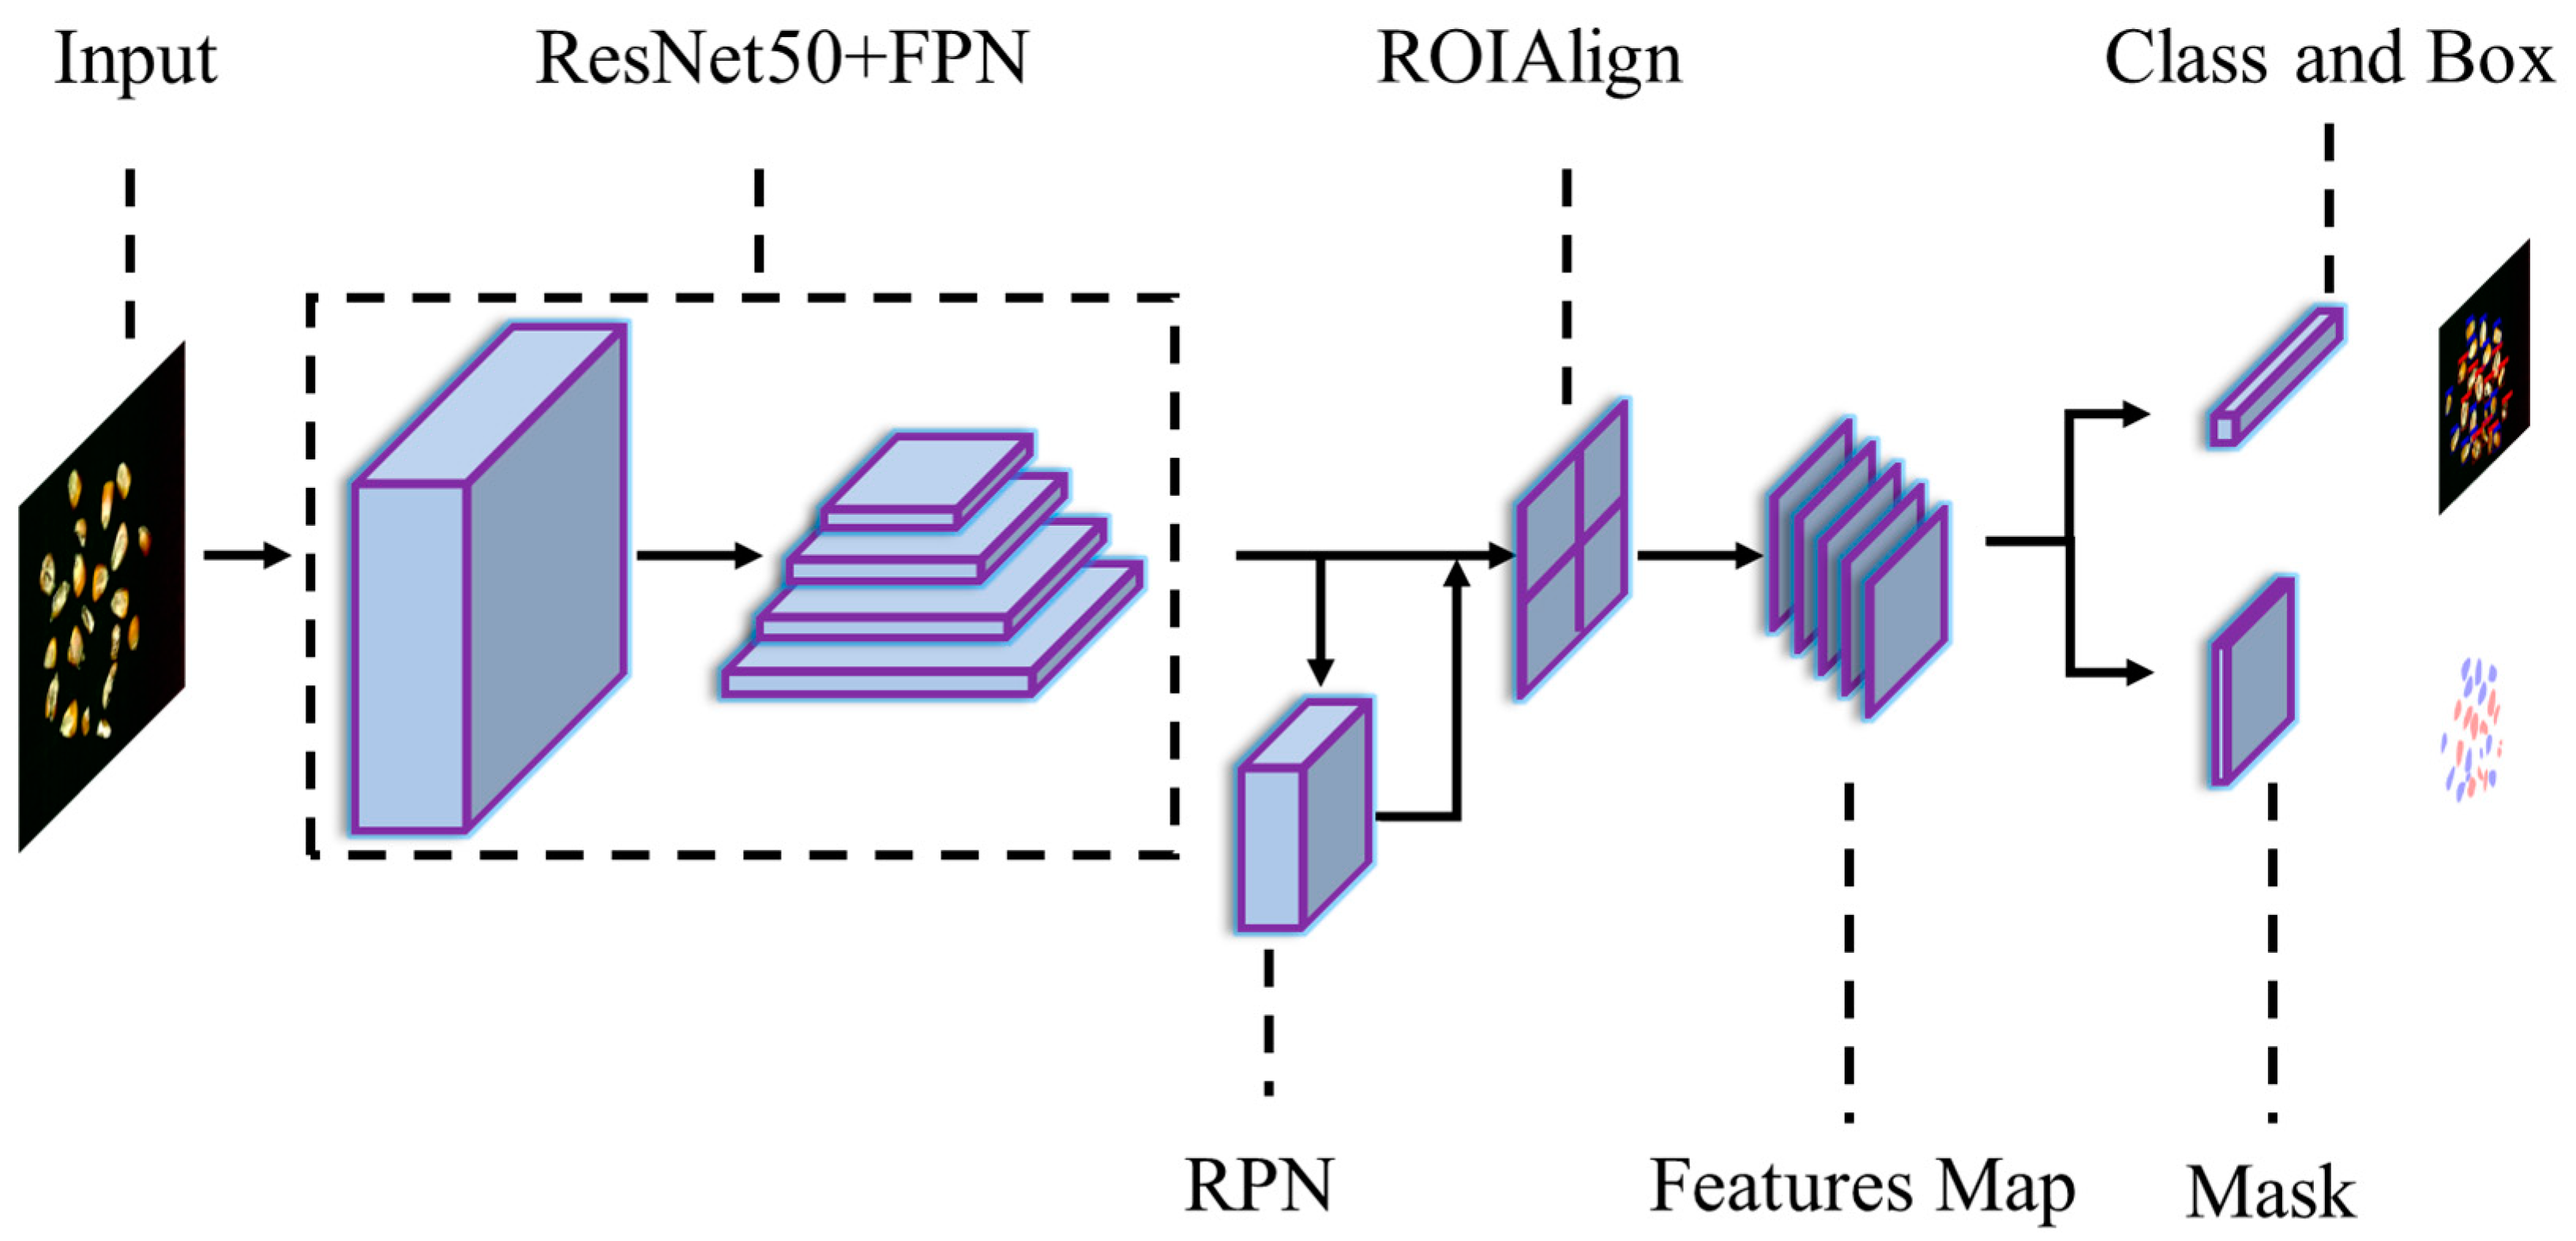
2.1. Description of the Mask RCNN

The Mask RCNN model is a two-stage algorithm employed for a range of tasks, including target classification, detection, and semantic segmentation. Based on the Faster RCNN [21] model, it adds a pixel for classifying the region of interest, predicts the branches of the target mask, and realizes the goals of classification, localization, and segmentation. The backbone feature extraction network, the Region Proposal Network, the Region of Interest Align (ROI Align) layer, the fully connected network, and the fully convolutional neural networks comprise the majority of the network structure of the Mask RCNN, as shown in Figure 1. The image is first entered into the ResNet50 feature extraction network to obtain feature maps of various stages, and then it enters the Feature Pyramid Network (FPN) structure to fuse features of various scales to obtain a common feature map that has strong semantic and spatial information simultaneously. Second, the common feature map is used to create anchor boxes of various sizes and proportions under the impact of the Region Proposal Network. Multiple candidate regions of various sizes are created by computing the Intersection Over Union (IOU) between each anchor box and the annotated real box in the image. On the one hand, boundary box regression is conducted after classifying the candidate regions into foreground and background. On the other hand, the ROI Align layer receives the feature pictures corresponding to the candidate boxes, which are then maximum or average pooled using bilinear interpolation to make them uniform in size. The target categorization, bounding box regression, and exact pixel-level segmentation of the target are accomplished using fully connected neural networks and fully convolutional networks.

2.2. Improving the Mask RCNN

Despite the Mask RCNN model returning a high detection accuracy, its sluggish detection speed makes it challenging to achieve real-time detection of the corn kernel breakage rate, and it is strongly dependent on the computer hardware’s computational capacity. This study aims to improve the Mask RCNN by reducing the parameters and improving the detection speed for the recognition and segmentation tasks of intact and broken corn kernels. First, replacing ResNet50_FPN with DenseNet121 [22] served as the backbone feature extraction network, accelerating the speed of feature extraction, and the Convolutional Block Attention Module (CBAM) [23] attention mechanism and FPN structure were added to improve the feature extraction on the basis of DenseNet121 to increase the detection accuracy, resulting in a DenseNet121_CBAM_FPN backbone feature extraction network (Figure 2). To reduce the training time and accelerate the convergence of the loss function, pre-training weights were loaded using the transfer learning concept.

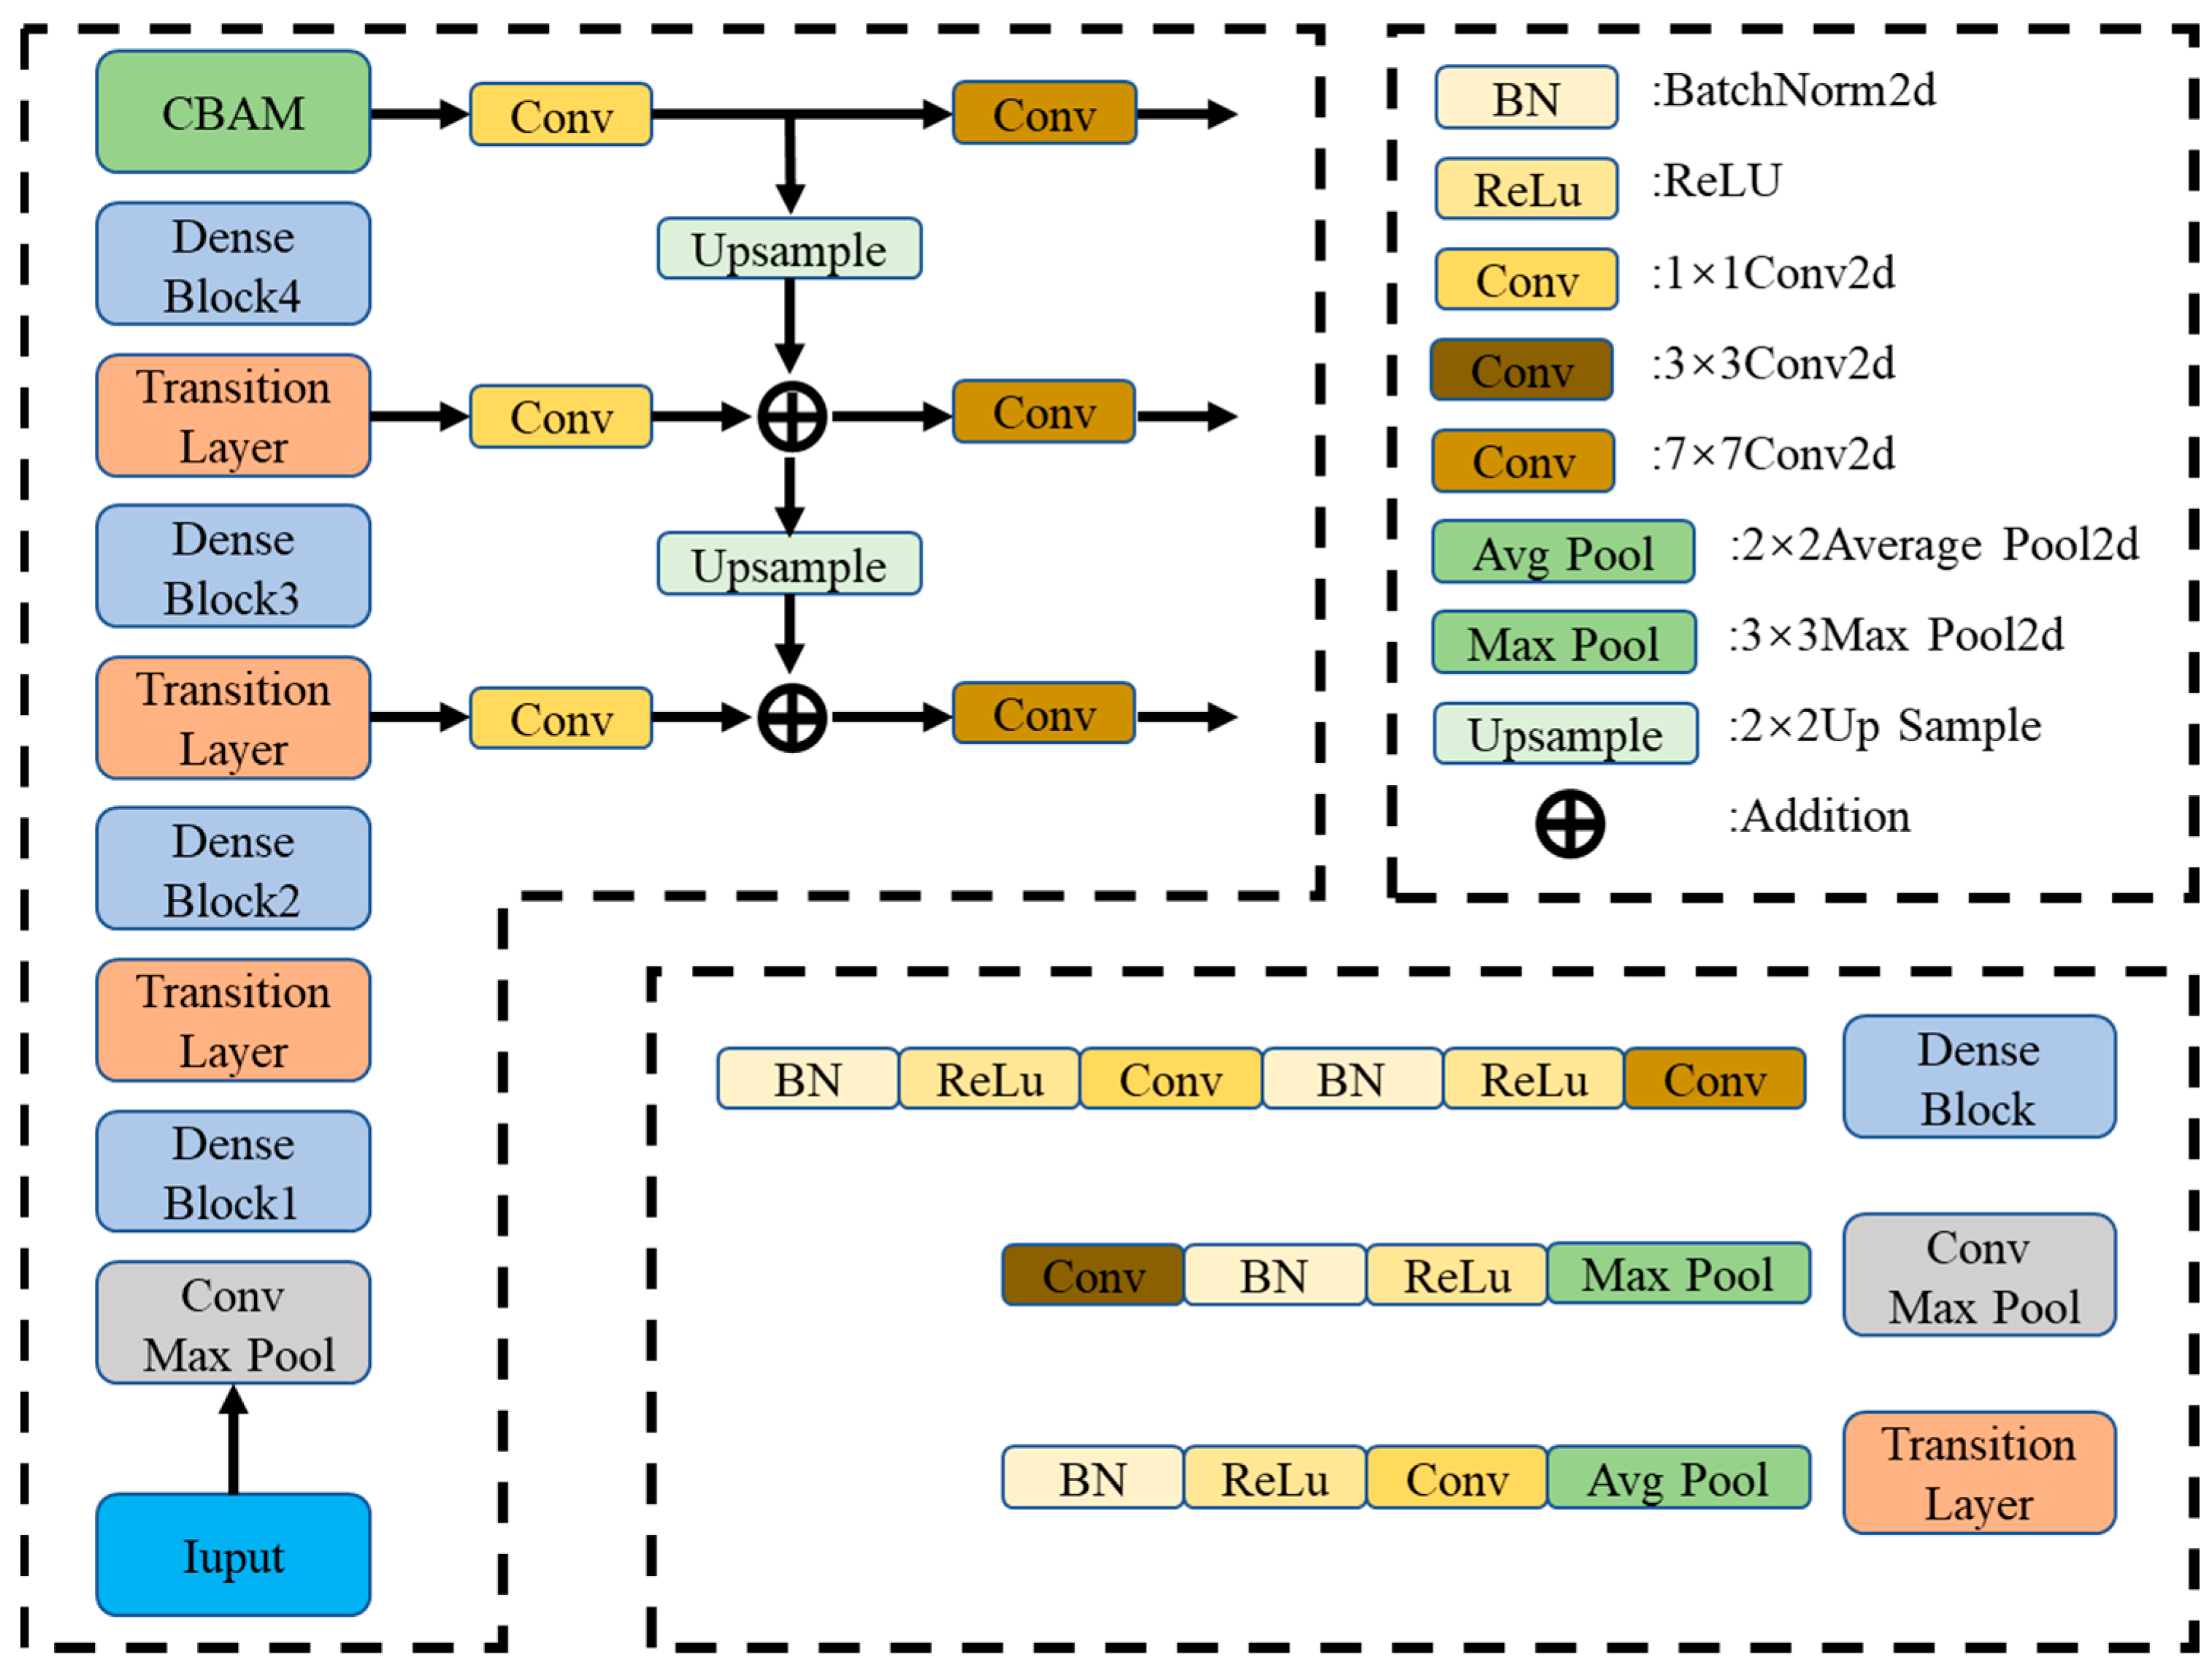
2.2.1. Replacing the Backbone Feature Extraction Network DenseNet

The complexity of the backbone feature extraction network increases in response to ongoing hardware upgrades. The ResNet network, which includes a residual structure as shown in Figure 3a, serves as the primary feature extraction network of the original Mask RCNN. The major benefit is that it can preserve the original features, prevent network deterioration, and overcome the gradient-vanishing issue often arising in deep neural network training by leveraging residual connections. However, a deep ResNet network necessitates intense computational power for training and reasoning, imposing onerous requirements in terms of the choice of hardware.
DenseNet, which begins with feature maps and uses a denser connection approach, is mostly based on the concept of the residual structure of ResNet. To ensure the maximal information flow between each layer (Figure 3b), forward propagation concatenates the feature maps of each layer with those of the other levels in the channel dimension.
DenseNet’s network topology outperforms ResNet’s in three key areas: (1) improving the feature propagation between networks; (2) implementing feature reuse while leveraging both low-level and high-level features; and (3) significantly lowering the number of parameters. Therefore, the study used DenseNet121 to replace ResNet50_ FPN to serve as the backbone feature extraction network of the Mask RNN for extracting specific features of the corn kernels. As shown in Figure 4, DenseBlock and transition structures comprise the majority of the topology of the DenseNet121 network.
The DenseBlock structure has a BN + ReLU + 1 × 1Conv + BN + ReLU + 3 × 3Conv composition, where the input of each layer comes from the feature maps of all the layers in front of it, and the output of each layer is directly connected to the input of all layers behind it to achieve feature reuse. To connect two neighboring DenseBlock structures, integrate the derived features, decrease the width and height of the feature map, and achieve the effect of downsampling and compressing the model, a transition layer structure with the formula BN + ReLU + 1 × 1Conv + 2 × 2 AvgPooling is employed.

2.2.2. CBAM Attention Mechanism

The attention mechanism is a network structure integrated into a model, designed to emphasize pertinent information, filter out less relevant details, and aid the model in choosing effective and appropriately sized features. This allows the model to extract features efficiently, allowing downstream tasks to focus on signals that are more closely related to the task at hand. As illustrated in Figure 5, the attention mechanism of the CBAM is a compact convolutional attention module that consists of the Channel Attention Module (CAM) and the Spatial Attention Module (SAM). The role of the CAM here is to process feature maps from different channels and focus on the meaningful feature map information. After that, the channel compression weight matrix is output, and then multiplied by the original input feature characteristic matrix. When the feature map adjusted by the CAM enters the spatial attention sub-module, the SAM will process the feature region of meaningful information in the feature map, generate the spatial compression weight matrix, and perform the same multiplication operation. And finally, the refined feature map is obtained. It is challenging for the feature extraction network to extract useful information from slightly broken corn kernels since their characteristics resemble those of intact corn kernels. The CBAM attention mechanism helps the network pay more attention to the damage in the corn kernels; even if their characteristics are similar to intact corn kernels, it can achieve differentiation. To filter out the unimportant information in the feature layer and extract the more effective features of corn kernels, this paper added the CBAM attention mechanism layer after the fourth DenseBlock layer of DenseNet121 to obtain the DenseNet121_CBAM backbone feature extraction network.

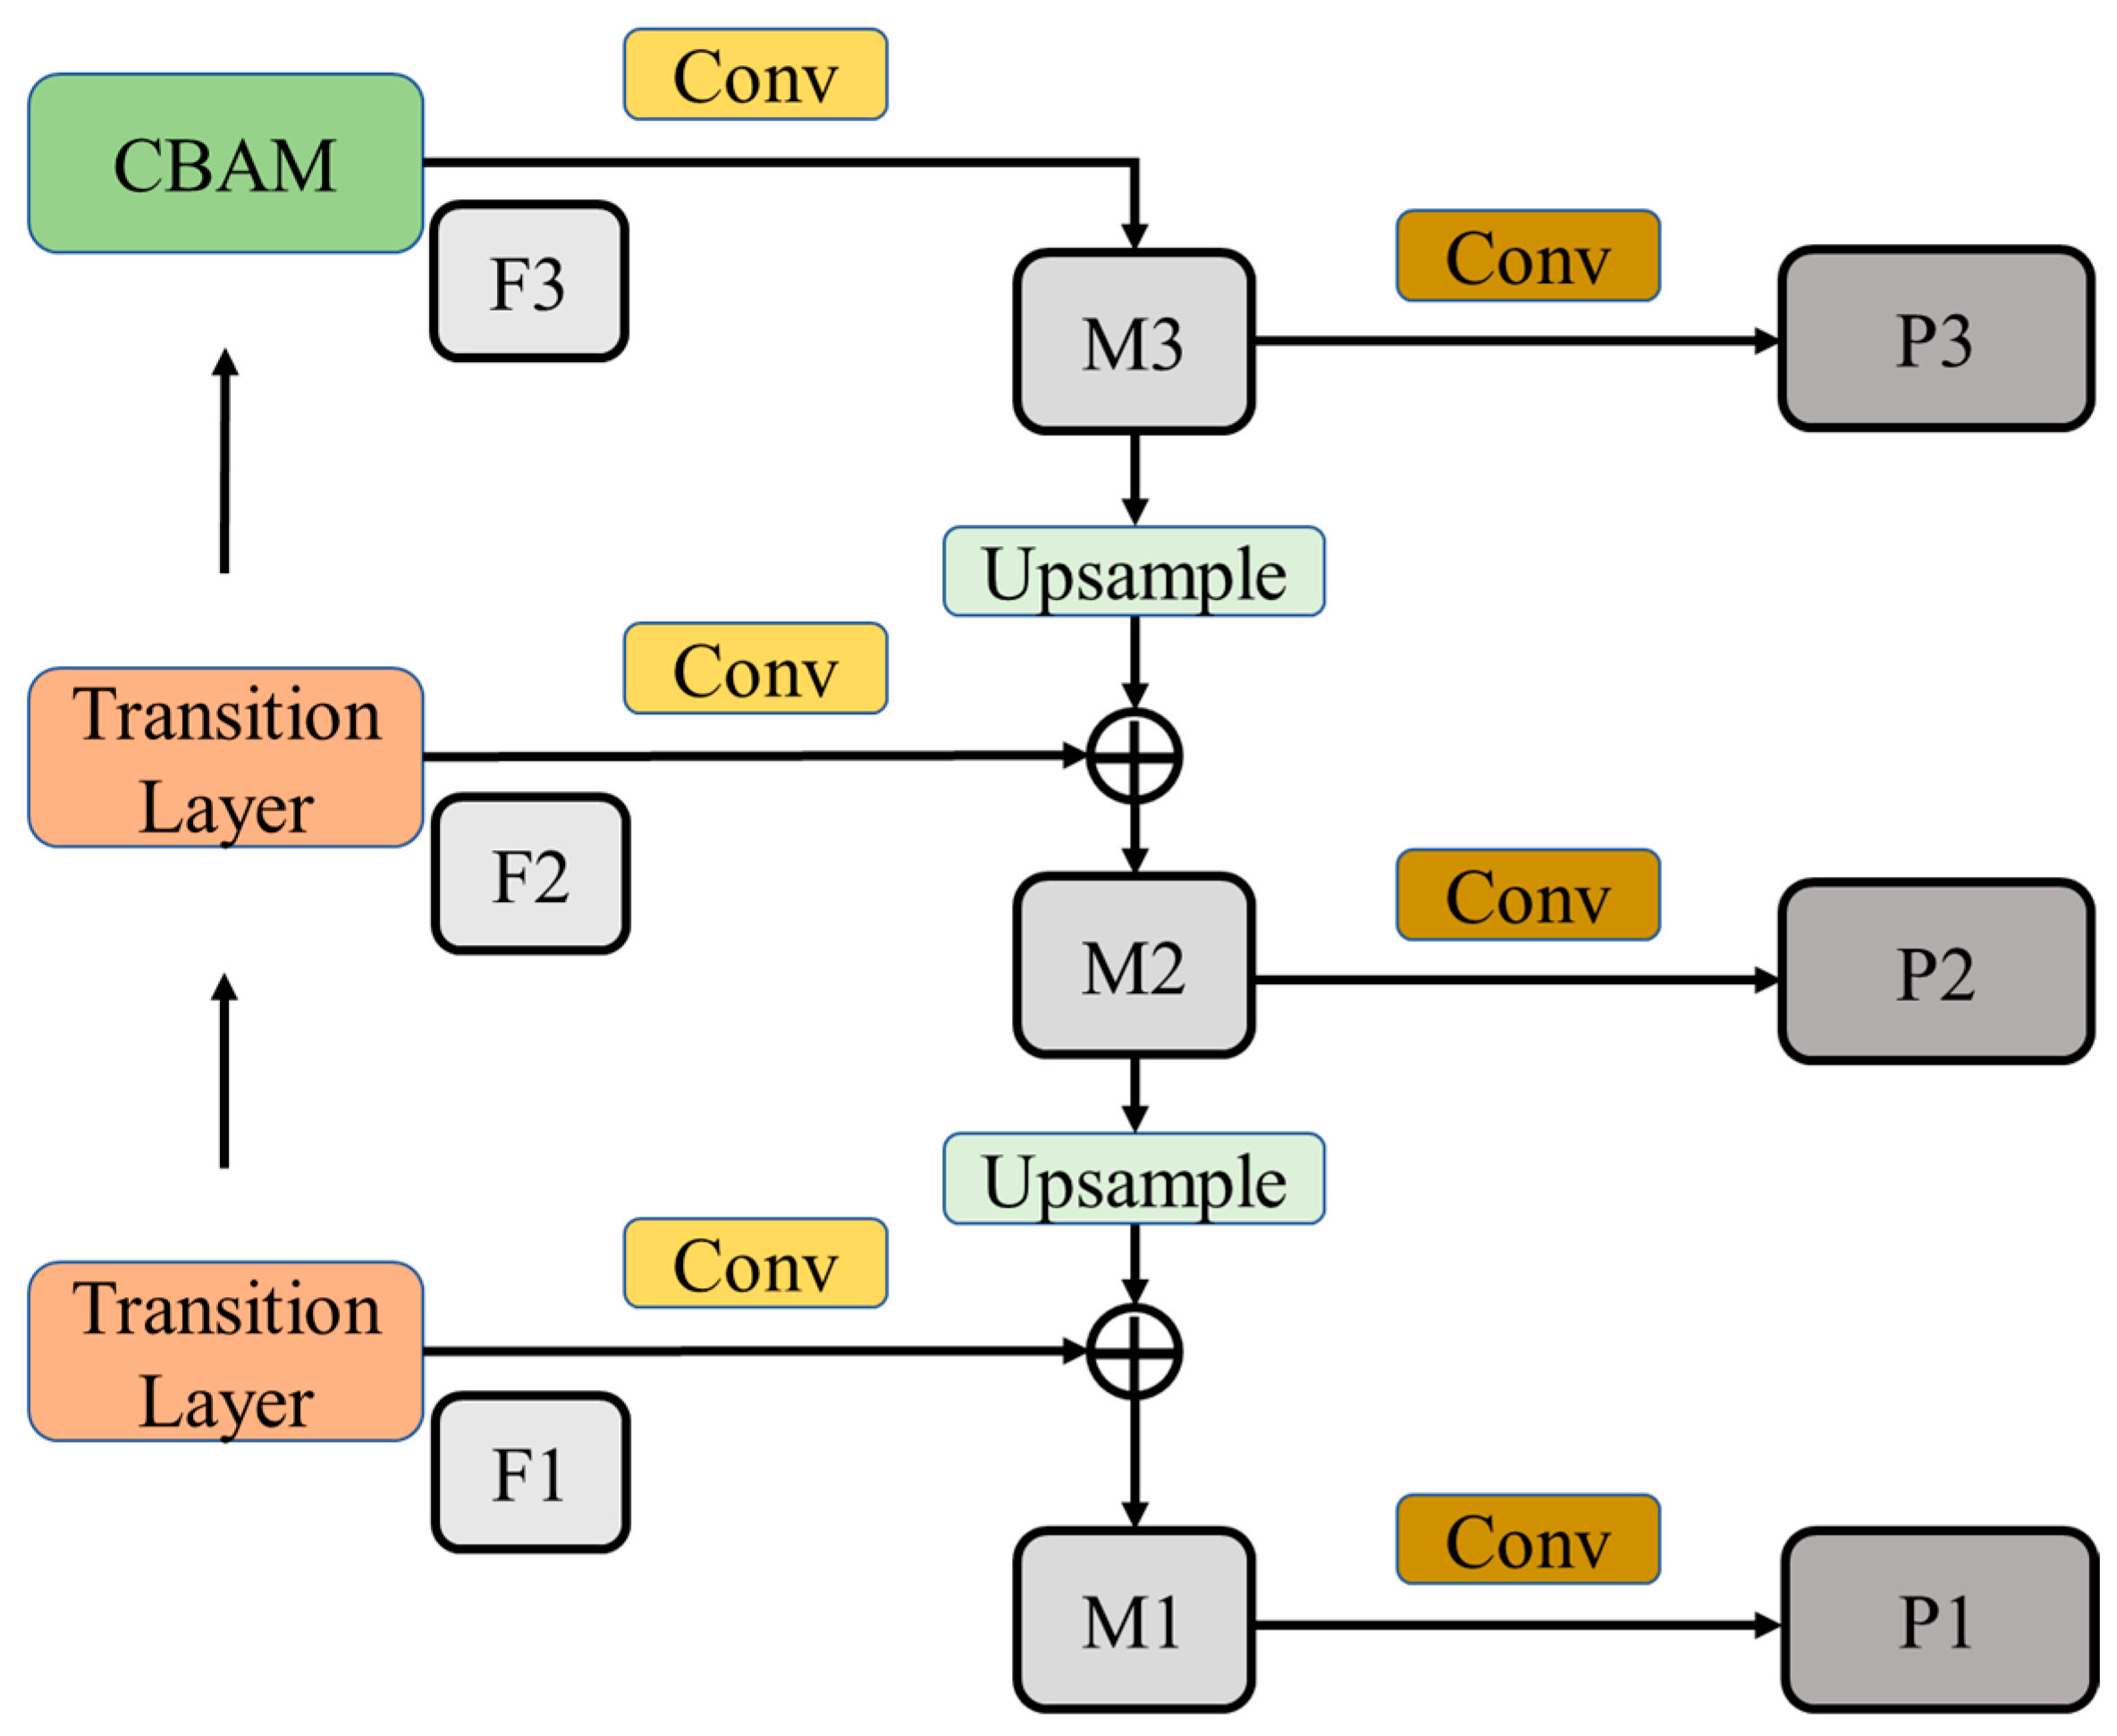
2.2.3. Multi-Scale Fusion FPN

The corn kernel feature maps extracted by the backbone feature network were relatively simple, and the lower-layer feature map had a higher resolution, containing more corn kernel locations and detailed information. However, due to the reduction in convolution, its semantics were lower and the noise greater. The high-level feature maps had strong semantic information, but the resolution was extremely low, and the perception of details was poor. The efficient fusion of the two-layer feature map can obtain more comprehensive corn kernel characteristics. To obtain more informative corn kernel feature maps, this paper adds an FPN structure after DenseNet121_CBAM to construct a DenseNet121_CBAM_FPN network (Figure 6). The corn kernel feature maps obtained from the second transition layer, the third transition layer, and the CBAM layer of the DenseNet_CBAM network were convolved and fused to obtain the M1, M2, and M3 feature maps. Following the convolution of the M1, M2, and M3 feature maps, P1, P2, and P3 feature maps with more abundant corn kernel information could be obtained.

2.2.4. Transfer Learning

The lack of intact and broken corn kernel data made the training of an optimum recognition and segmentation model difficult. The issue of having fewer datasets can be resolved using the transfer learning method. Transfer learning is the process of using previously learned model weights and characteristics to detect new tasks. Large-scale datasets were used to train the weights to improve their ability to express features. Additionally, it could efficiently cut the training time and accelerate the loss function convergence. As a result, DenseNet121 weights that were trained on the expansive ImageNet dataset were used. The pre-training weights were loaded to train and validate the corn kernel dataset using transfer learning.

2.3. Construction of a Corn Kernel Dataset and Establishment of the Pixel–Mass Relationship

2.3.1. Data Collection

A Grain King TB70 grain combine harvester modified with a 4YB-4A corn header was used to gather the corn kernels for this study in Laowangji Town, Zhecheng County, Shangqiu City, Henan Province (34°07′3.11″ N, 115°30′23.84″ E, at an altitude of approximately 44 m above mean sea level), China. The variety is Xianyu 335. A black cloth was covered with the requisite grains after the corn harvester had unloaded the grain. A Shunhuali 500W industrial camera (8 mm focal length lens, Shenzhen Shunhuali Electronics Co., LTD., Shenzhen, China.) was used to randomly record 600 photographs of the grains at various exposure levels and with various contaminants (Figure 7). Table 1 displays the specific image distribution.
Following the acquisition of the grain images, 200 intact and 160 broken corn kernels (Figure 8) were chosen and brought to the laboratory.

2.3.2. Data Preprocessing

For deep learning algorithms, the quality of the dataset directly affects the training and prediction performance of the network model. To improve the generalization ability and robustness of the network model and obtain more features of the corn kernels, 600 original images were appropriately expanded using traditional data augmentation methods such as adding noise, changing the brightness, horizontal flipping, vertical flipping, image shifts, etc. (Figure 9) to obtain 1200 enhanced images. The 1200 processed images were manually annotated using the Lableme tool software for the corn kernels. As this study aimed to achieve recognition and segmentation of the corn kernels, it was necessary to use the contour of corn kernels as a boundary for polygon annotation. Annotation targets can be divided into two categories, including intact and broken corn kernels. The broken corn kernels included cracks, root fractures, top damage, side damage, and so on. After image annotation, a JSON file containing the annotation information was obtained. Then, a specific script written in Python was used to convert the JSON file into a COCO dataset format that could be used to train the Mask RCNN model. The created dataset was then split (in a 7:2:1 ratio) into training, validation, and testing sets.

2.3.3. Establishment of the Pixel–Mass Relationship

Since the pixels and the quality of corn kernels fall into two different categories, it was necessary to develop a coupling relationship between the two to explain quality using pixels. Some of the corn kernels that were brought back were picked out and scattered evenly on a black cloth in the laboratory under natural daylight. Using a bracket, we secured the industrial camera above the velvet material and photographed the corn kernels with the lens some 150 mm vertically above the fabric (Figure 10). The corn kernels on the velvet material had to be removed after each image was captured, and a few more of the corn kernels that were dispersed there were chosen. We took 50 photographs of intact and broken corn kernels, respectively, and weighed each of them, recording the information associated with each photo using an electronic precision scale (to ±0.001 g).
The captured corn kernel images were imported into the Adobe Photoshop software, the pixels of the intact kernels and broken kernels were obtained based on the histogram information, and then the coupling relationship between the pixels and quality was established and a one-way linear regression fit was plotted (Figure 11).
The results from the least squares regression analysis, examining the relationship between pixel and mass for the corn kernels, revealed coefficients of determination values (R2) of 0.958 for the intact kernels and 0.992 for the broken kernels. The coefficient of determination measures the degree of correlation between the two variables, and the closer it is to 1, the stronger the correlation between the two variables, confirming that corn kernel pixels are highly correlated with quality. The univariate linear regression model was able to reflect the quantitative relationship between the kernel pixels and quality, which was expressed as:
M b = 4.3273 × 10 5 P b 0.1626
M f = 5.773 × 10 5 P f 0.1644
where Mb is the quality of the broken corn kernels, in g; Pb denotes the broken corn kernel pixel count, in pixels; Mf represents the quality of the intact corn kernels, in g; and Pf is the intact corn kernel pixel count, in pixels.

2.4. Calculation Method of the Corn Kernel Breakage Rate

The corn kernel breakage rate may be calculated using Python language programming based on the established association between the corn kernel pixel counts and quality after segmenting the pixel mask of the intact and broken corn kernels using the improved Mask RCNN model, as given by:
Z s = m s m i × 100 %
where Zs is the grain breakage rate, %; ms stands for the mass of broken corn kernels, g; mi is the total mass of sample corn kernels, g.

3. Results and Discussion

3.1. Experimental Environment and Model Training Parameter Settings

The experiment used a 64-bit Windows 11 system, equipped with a 12th Gen Intel (R) Core (TM) i7-12700KF CPU, with a main frequency of 3.61 GHz, 32 GB of memory, an NVIDIA 3080Ti graphics processing unit (GPU), and 12 GB of graphics memory. The deep learning framework was Python 1.10.0+Cuda11.3, the programming language was Python 3.8.0, and the programming environment was PyCharm Community Edition. Based on the results of multiple tests, we set the number of iterations (epoch) to 50, the attenuation factor to 0.1, the initial learning rate of the model parameters to 0.008, the batch size of training data to 8, and the training set to be randomly mixed before each iteration. The optimizer selected SGD and the momentum factor was set to 0.9; mixed precision training was adopted.

3.2. Evaluation Indicators

The percentage of actual positive samples in the predicted sample to all positive samples is known as precision, whereas the percentage of actual positive samples in the predicted sample to all predicted samples is known as recall, as given by:
P = T P T P + F P
R = T P T P + F N
where, True Positive (TP) is the correct recognition of positive samples as positive samples; True Negative (TN) is the correct recognition of negative samples as negative samples; False Positive (FP) is a negative sample that is incorrectly recognized as a positive sample; a d False Negative (FN) is when a positive sample is mistakenly identified as a negative sample.
Mean Average Precision (MAP) is an important indicator used to measure the performance of network models, as given by:
A P = 0 1 p ( r ) d r
M A P = i = 1 k A P i k
where, Average Precision (AP) is the average accuracy of identifying a certain class, and k is the total number of classifications.
Five indicators were used in this experiment to analyze and compare the experimental results with the original network: MAPb50 (IoU = 0.50), MAPm50 (IoU = 0.50), the computational complexity (FLOPs), the parameter complexity (Params) of the backbone feature extraction network, and the feature extraction time (Time).

3.3. Model Training

Five sets of experiments were designed to train various backbone feature extraction networks of the Mask RNN model on the corn seed dataset while using the same experimental environment and training parameters, to test the efficacy of using DenseNet121_CBAM_FPN as the backbone feature extraction network of the Mask RNN model. The apparent effects of various backbone feature extraction networks on detection performance are shown in Table 2.
The results in Table 2 showed the following:
(1)
The Mask RCNN model, which uses DenseNet121 as the backbone feature extraction network, was 97.16% and 98.18% on MAPb50 and MAPm50, respectively, its computation amount and parameter number were 2.88 GMac and 6.95 M, and the feature extraction time was 170 ms;
(2)
The Mask RCNN model incorporating the CBAM attention mechanism into the DenseNet121 network structure achieved 97.32% and 98.29% on MAPb50 and MAPm50, respectively, with a computational and parameter load of 2.88 GMAc and 7.08 M, and a feature extraction time of 176 ms;
(3)
The Mask RCNN model using an FPN structure in the DenseNet121 network structure had a performance of 97.28% and 98.35% on MAPb50 and MAPm50, respectively, with a computational and parameter load of 3.09 GMAc and 9.18 M, and a feature extraction time of 202 ms;
(4)
The Mask RCNN model incorporating the CBAM attention mechanism and FPN structure into the DenseNet121 network structure achieved 97.62% and 98.70%, respectively, on MAPb50 and MAPm50, with a computational and parameter load of 3.09 GMAc and 9.31 M, and a feature extraction time of 206 ms. Compared to the ResNet50_FPN backbone feature extraction network, it improved by 0.34% and 0.37% on MAPb50 and MAPm50, respectively, and reduced the computational complexity by 3.87 GMac, the parameter size by 17.32 M, and the feature extraction time by 22 ms. The results showed that DenseNet121_CBAM_FPN, as the backbone feature extraction network, improved the accuracy of corn kernel recognition and segmentation compared to the original Mask RCNN model, and reduced the computational burden, parameter quantity, and feature extraction time, proving the effectiveness of the improved Mask RCNN model.
As shown in Figure 12, during the training process of the corn kernel dataset, the improved Mask RCNN model outperformed the original network model, even though MAPb50 and MAPm50 increased more slowly and tended to stabilize between 20 and 50 iterations.
Using the idea of transfer learning to load the pre-trained weights of DenseNet121 for training, it can be seen from Figure 13a,b that the loss function of the model without pre-trained weights converged slowly, reaching complete convergence after about 40 iterations. The loss function of the model with pre-trained weights converged faster, reaching complete convergence after about 20 iterations. In comparison, the convergence of the loss function using pre-trained weights was twice as fast as that without pre-trained weights.

3.4. Visualization Analysis of Different Segmented Networks

The corn kernel dataset was trained using the original Mask RCNN, improved Mask RCNN, and YOLACT (You Only Look At CoefficienTs) [24] network models. YOLACT is a classic real-time segmentation model, which has the characteristics of a good segmentation effect and rapid detection; the results are displayed in Table 3. The improved Mask RCNN model had an increase of 0.34% and 0.37% in MAPb50 and MAPm50 compared to the original Mask RCNN model, and a reduction of 375 ms in the testing time for one image, as shown by the findings in the table. The MAPb50 and MAPm50 exhibited increases of 0.83% and 0.92%, respectively, and a reduction in the testing time of 17 ms for one image when compared to the YOLACT network model.
Figure 14 displays the visualization outcomes for the three network models. The segmentation of intact and broken corn kernels by the original Mask RCNN model and the improved Mask RCNN model both yielded masks that were better suited to corn kernels. The detection performance of the YOLACT network model was subpar, with recognition mistakes and evident rough edges visible on the segmentation mask that deviated somewhat from the corn kernels. The improved Mask RCNN model outperformed the YOLACT network model in terms of the visual effect. Compared with the traditional machine learning algorithm of Yang [25], the improved Mask RCNN increased the recognition accuracy of corn kernels and optimized the segmentation of corn kernels.
Images with various exposure intensities and other contaminants were chosen for segmentation and recognition to better demonstrate the robustness of the enhanced Mask RCNN model. As shown in Figure 15, in photos in challenging settings, intact and broken corn kernels could still be recognized and separated, and the pixel segmentation result was quite accurate, demonstrating the improved durability of the Mask RCNN model.

3.5. Real-Time Detection of the Corn Kernel Breakage Rate

We chose five times at random and selected any hybrid corn kernels, both healthy or damaged, then photographed them using an industrial camera positioned 150 mm above them, and sent the images to an enhanced Mask RCNN model for breakage rate detection. Then, corn kernels were manually selected to determine the breakage rate, and the time was logged. Table 4 lists a comparison of the outcomes. The statistics in Table 4 show that the detection was substantially faster than that realized using manual calculation, and the error range between the machine vision detection and manual calculation was between 0.72% and 0.65%. Therefore, human computation of the corn kernel breakage rates can be replaced by machine vision detecting technology.

4. Conclusions

Building upon the Mask RCNN concept, this study introduced the DenseNet121 backbone feature extraction network as the fundamental framework. The DenseNet121_CBAM_FPN backbone feature extraction network was established by adding the CBAM attention mechanism and FPN structure. The improved Mask RCNN model outperformed the baseline model on MAPb50 and MAPm50 by 0.34% and 0.37%, respectively. The computational and parameter quantities dropped by 3.87 GMAc and 17.32 M, respectively, when compared to the ResNet50_FPN backbone feature extraction network. The time taken to extract features lowered by 22 ms, while the time taken to detect images decreased by 395 ms. The improved Mask RCNN model had a higher accuracy of recognition and faster speed of detection, which proved the effectiveness of the improved network.
The relationship between the quality of corn kernels and pixel characteristics was established. Machine vision had a detection error of between −0.72% and 0.65% for the corn kernel breakage rate. The typical detection time for a given image of corn kernels was 76 ms, which can be used to replace the manual measurement of the breakage rate of corn kernels with machine vision detection technology.
In the next research work, a corn kernel sampling device fixed to a corn kernel harvester will be designed to detect the breakage rate of corn kernels in real time in conjunction with the improved Mask RCNN model.
This study did not address the overlap among the corn kernels, focusing solely on the classification and division of broken corn kernels on the surface. Investigating this situation in greater detail is suggested as a fruitful direction for future research.

Author Contributions

Conceptualization, H.Z. and X.H.; methodology, H.Z. and Z.L.; investigation, Z.Y. and C.Z.; Visualization, Y.D. and P.L.; writing—original draft preparation, Z.L. All authors have read and agreed to the published version of the manuscript.

Funding

This research was funded by Henan Province Modern Agricultural Industrial Technology System Maize Whole-process Mechanization Special Project (HARS-22-02-G4); National Key Research and Development Program (2018YFD0300704); and Henan Province Science and Technology Research (222102110457).

Institutional Review Board Statement

Not applicable.

Data Availability Statement

The data presented in this study are available on request from the authors.

Acknowledgments

The authors would like to thank their college and the laboratory, as well as gratefully appreciate the reviewers who provided helpful suggestions for this manuscript.

Conflicts of Interest

The authors declare no conflict of interest.

References

  1. Cheng, S.; Han, H.; Qi, J.; Ma, Q.; Liu, J.; An, D.; Yang, Y. Design and Experiment of Real-Time Grain Yield Monitoring System for Corn Kernel Harvester. Agriculture 2023, 13, 294. [Google Scholar] [CrossRef]
  2. Li, X.; Zhang, W.; Xu, S.; Du, Z.; Ma, Y.; Ma, F.; Liu, J. Low-Damage Corn Threshing Technology and Corn Threshing Devices: A Review of Recent Developments. Agriculture 2023, 13, 1006. [Google Scholar] [CrossRef]
  3. GB/T 21962-2020; Corn Combine Harvester. China Standards Press: Beijing, China, 2020.
  4. Qiu, Z.J.; Chen, J.; Zhao, Y.Y.; Zhu, S.S.; He, Y.; Zhang, C. Variety identification of single rice seed using hyperspectral imaging combined with convolutional neural network. Appl. Sci. 2018, 8, 212. [Google Scholar] [CrossRef]
  5. Han, Z.Z.; Gao, J.Y. Pixel-level aflatoxin detecting based on deep learning and hyperspectral imaging. Comput. Electron. Agric. 2019, 164, 104888. [Google Scholar] [CrossRef]
  6. Przybyło, J.; Jabłoński, M. Using deep convolutional neural network for oak acorn viability recognition based on color images of their sections. Comput. Electron. Agric. 2019, 156, 490–499. [Google Scholar] [CrossRef]
  7. Zhang, R.Q.; Li, Z.W.; Hao, J.J.; Sun, L.; Li, H.; Han, P. Image recognition of peanut pod grades based on transfer learning with convolutional neural network. Trans. Chin. Soc. Agric. Eng. 2020, 36, 171–180. [Google Scholar]
  8. Mao, R.; Zhang, Y.C.; Wang, Z.X.; Gao, S.C.; Zhu, T.; Wang, M.L.; Hu, X.P. Recognizing stripe rust and yellow dwarf of wheat using improved Faster-RCNN. Trans. Chin. Soc. Agric. Eng. 2022, 38, 176–185. [Google Scholar]
  9. Ni, B.; Paulsen, M.R.; Reid, J.F. Corn kernel crown shape identification using image processing. Trans. ASAB 1997, 40, 833–838. [Google Scholar] [CrossRef]
  10. Steenhoek, L.W.; Misra, M.K.; Batchelor, W.D.; Davidson, J.L. Probabilistic Neural Networks for Segmentation of Features in Corn Kernel Images. Proc. Nutr. Soc. 2001, 41, 225–234. [Google Scholar] [CrossRef]
  11. Zhao, Z.H.; Song, H.; Zhu, J.B.; Lu, L.; Sun, L. Identification algorithm and application of peanut kernel integrity based on convolution neural network. Trans. Chin. Soc. Agric. Eng. 2018, 34, 195–201. [Google Scholar]
  12. Chen, J.; Gu, Y.; Lian, Y.; Han, M.N. Online recognition method of impurities and broken paddy grains based on machine vision. Trans. Chin. Soc. Agric. Eng. 2018, 34, 187–194. [Google Scholar]
  13. Song, C.X.; Yu, C.Y.; Xing, Y.C.; Li, S.M.; He, H.; Yu, H.; Feng, X.Z. Algorith for acquiring multi-phenotype parameters of soybean seed based on OpenCV. Trans. Chin. Soc. Agric. Eng. 2022, 38, 156–163. [Google Scholar]
  14. Mahirah, J.; Kazuya, Y.; Munenori, M.; Naoshi, K.; Yuichi, O.; Tetsuhito, S.; Harshana, H.; Usman, A. Double Lighting Machine Vision System to Monitor Harvested Paddy Grain Quality during Head-Feeding Combine Harvester Operation. Machines 2015, 3, 352–363. [Google Scholar]
  15. Mahirah, J.; Kazuya, Y.; Munenori, M.; Naoshi, K.; Yuichi, O.; Tetsuhito, S.; Harshana, H.; Usman, A. Monitoring harvested paddy during combine harvesting using a machine vision-Double lighting system. Eng. Agric. Environ. Food. 2017, 10, 140–149. [Google Scholar] [CrossRef]
  16. Yang, L.; Wang, Z.; Bai, X.P.; Gao, L.; Hu, W.B. Design of on-line sampling device for maize kernel broken rate. J. Agric. Mech. Res. 2019, 41, 121–124+129. [Google Scholar]
  17. Chen, M.; Ni, Y.L.; Jin, C.Q.; Xun, J.S.; Zhang, G.Y. Online Monitoring Method of Mechanized Soybean Harvest Quality Based on Machine Vision. Trans. Chin. Soc. Agric. Eng. 2021, 52, 91–98. [Google Scholar]
  18. Jin, C.Q.; Liu, S.K.; Chen, M.; Yang, T.X.; Xu, J.S. Online quality detection of machine-harvested soybean based on improved U-Net network. Trans. Chin. Soc. Agric. Eng. 2022, 38, 70–80. [Google Scholar]
  19. Liu, S.K.; Jin, C.Q.; Chen, M.; Yang, T.X.; Xu, J.S. Online detection method of detecting crushing rate of soybean harvest based on DeepLabV3+ network. J. Chin. Agric. Mech. 2023, 44, 170–175. [Google Scholar]
  20. He, K.M.; Gkioxari, G.; Dollár, P.; Girshick, R. Mask R-CNN; ICCV: Venice, Italy, 2017; pp. 2980–2988. [Google Scholar]
  21. Ren, S.Q.; He, K.M.; Girshick, R.; Sun, J. Faster R-CNN: Towards Real-Time Object Detection with Region Proposal Networks. IEEE Trans. Pattern Anal. Mach. Intell. 2017, 39, 1137–1149. [Google Scholar] [CrossRef] [PubMed]
  22. Huang, G.; Liu, Z.; Laurens, V.D.M.; Kilian, Q.W. Densely Connected Convolutional Networks; CVPR: Honolulu, HI, USA, 2017; pp. 2261–2269. [Google Scholar]
  23. Woo, S.; Park, J.; Lee, J.Y.; Kweon, I.S. CBAM: Convolutional Block Attention Module; CVPR: Long Beach, CA, USA, 2018; pp. 3–19. [Google Scholar]
  24. Bolya, D.; Zhou, C.; Xiao, F.Y.; Lee, Y.J. YOLACT: Real-Time Instance Segmentation; ICCV: Seoul, Republic of Korea, 2019; pp. 9156–9165. [Google Scholar]
  25. Yang, L. Research on Online Inspection Equipment and Method for Broken Rate of Maize Kernels. Master’s Thesis, Shenyang Institute of Automation, Chinese Academy of Sciences, Shengyang, China, 2018. [Google Scholar]
Figure 1. Mask RCNN model structure.
Agriculture 13 02257 g001
Figure 2. DenseNet121_CBAM_FPN backbone feature extraction network.
Agriculture 13 02257 g002
Figure 3. ResNet and DenseNet network structure. (a) ResNet, (b) DenseNet.
Agriculture 13 02257 g003aAgriculture 13 02257 g003b
Figure 4. DenseNet network model structure.
Agriculture 13 02257 g004
Figure 5. CBAM attention mechanism.
Agriculture 13 02257 g005
Figure 6. Feature pyramid network structure.
Agriculture 13 02257 g006
Figure 7. Images of corn grains under different conditions. (a) Low-exposure image of small amount of impurities. (b) Low-exposure excess-impurity image. (c) Normal-exposure image of small amounts of impurities. (d) Normal exposure of excess impurity image. (e) High-exposure images of small amounts of impurities. (f) High-exposure images of excess impurities.
Agriculture 13 02257 g007aAgriculture 13 02257 g007b
Figure 8. Intact and broken corn kernels. (a) Intact corn kernels. (b) Broken corn kernels.
Agriculture 13 02257 g008
Figure 9. Traditional dataset enhancement methods. (a) Original image. (b) Horizontal flip. (c) Vertical flip. (d) Image shift. (e) Increased brightness. (f) Salt-and-pepper noise.
Agriculture 13 02257 g009
Figure 10. Corn kernel data acquisition experimental platform.
Agriculture 13 02257 g010
Figure 11. Linear regression analysis of pixel and mass. (a) The relationship between pixel and mass of broken corn kernels. (b) The relationship between pixel and mass of intact corn kernels.
Agriculture 13 02257 g011
Figure 12. Mask RCNN recognition and segmentation curves of different backbone feature extraction networks. (a) Mask RCNN recognition curves of different backbone feature extraction networks. (b) Mask RCNN segmentation curves of different backbone feature extraction networks.
Agriculture 13 02257 g012
Figure 13. Training and validation loss curves with and without pre-training weights. (a) Training loss curves with and without pre-training weights. (b) Validation loss curves with and without pre-training weights.
Agriculture 13 02257 g013
Figure 14. Test results of different network models. (a) Original Mask RCNN. (b) Improved Mask RCNN. (c) Yolact.
Agriculture 13 02257 g014
Figure 15. Detection results of images under different conditions. (a) Original image under complex conditions. (b) Detection image. (c) Split mask image.
Agriculture 13 02257 g015
Table 1. Corn kernel images under different conditions.
Impurity Condition Exposure ConditionNumber of ImagesTotal
Minor impurityLow exposure43600
Normal exposure80
High exposure55
Excess impurityLow exposure37
Normal exposure60
High exposure25
Table 2. Experimental results of different feature extraction networks on corn kernel dataset.
BackboneMAPb50 (%)MAPm50 (%)FLOPs (GMac)Params (M)Time (ms)
ResNet50_FPN97.2898.336.9626.63228
DenseNet12197.1698.182.886.95170
DenseNet121_CBAM97.3298.292.887.08176
DenseNet121_FPN97.2898.353.099.18202
DenseNet121_CBAM_FPN97.6298.703.099.31206
Table 3. Training and verification results of three different network models.
Network ModelMAPb50 (%)MAPm50 (%)Time (ms)
Original Mask RCNN97.2898.33451
Improved Mask RCNN97.6298.7076
Yolact96.2197.3493
Table 4. Comparison results of different detection methods of breakage rate.
Serial NumberMachine Vision (%)Detection Time (ms)Actual Calculation (%)Calculation Time (ms)
112.366411.896725
28.57889.298452
315.296914.917684
420.167919.517332
56.52787.059246
Disclaimer/Publisher’s Note: The statements, opinions and data contained in all publications are solely those of the individual author(s) and contributor(s) and not of MDPI and/or the editor(s). MDPI and/or the editor(s) disclaim responsibility for any injury to people or property resulting from any ideas, methods, instructions or products referred to in the content.

