
Will the Grain Imports Competition Effect Reverse Land Green Efficiency of Grain Production? Analysis Based on Virtual Land Trade Perspective

Abstract
:1. Introduction
1.1. Background
1.2. Literature Review
1.3. Literature Review of Land Use Efficiency
2. Materials and Methods
2.1. Measurement of the Grain Imports Competition Effect
2.1.1. Measurement Method of China’s Net Grain Import Virtual Land
2.1.2. Measurement of the Land-Saving Effect of Net Grain Imports in China
2.2. Measurement Method of Land Green Efficiency of Grain Production
2.3. Variable Selection
2.4. Empirical Model Design of Competitive Effects of Grain Imports Influencing Land Green Efficiency of Grain Production
3. Results
3.1. Measurement Results of Competitive Effects of Grain Imports
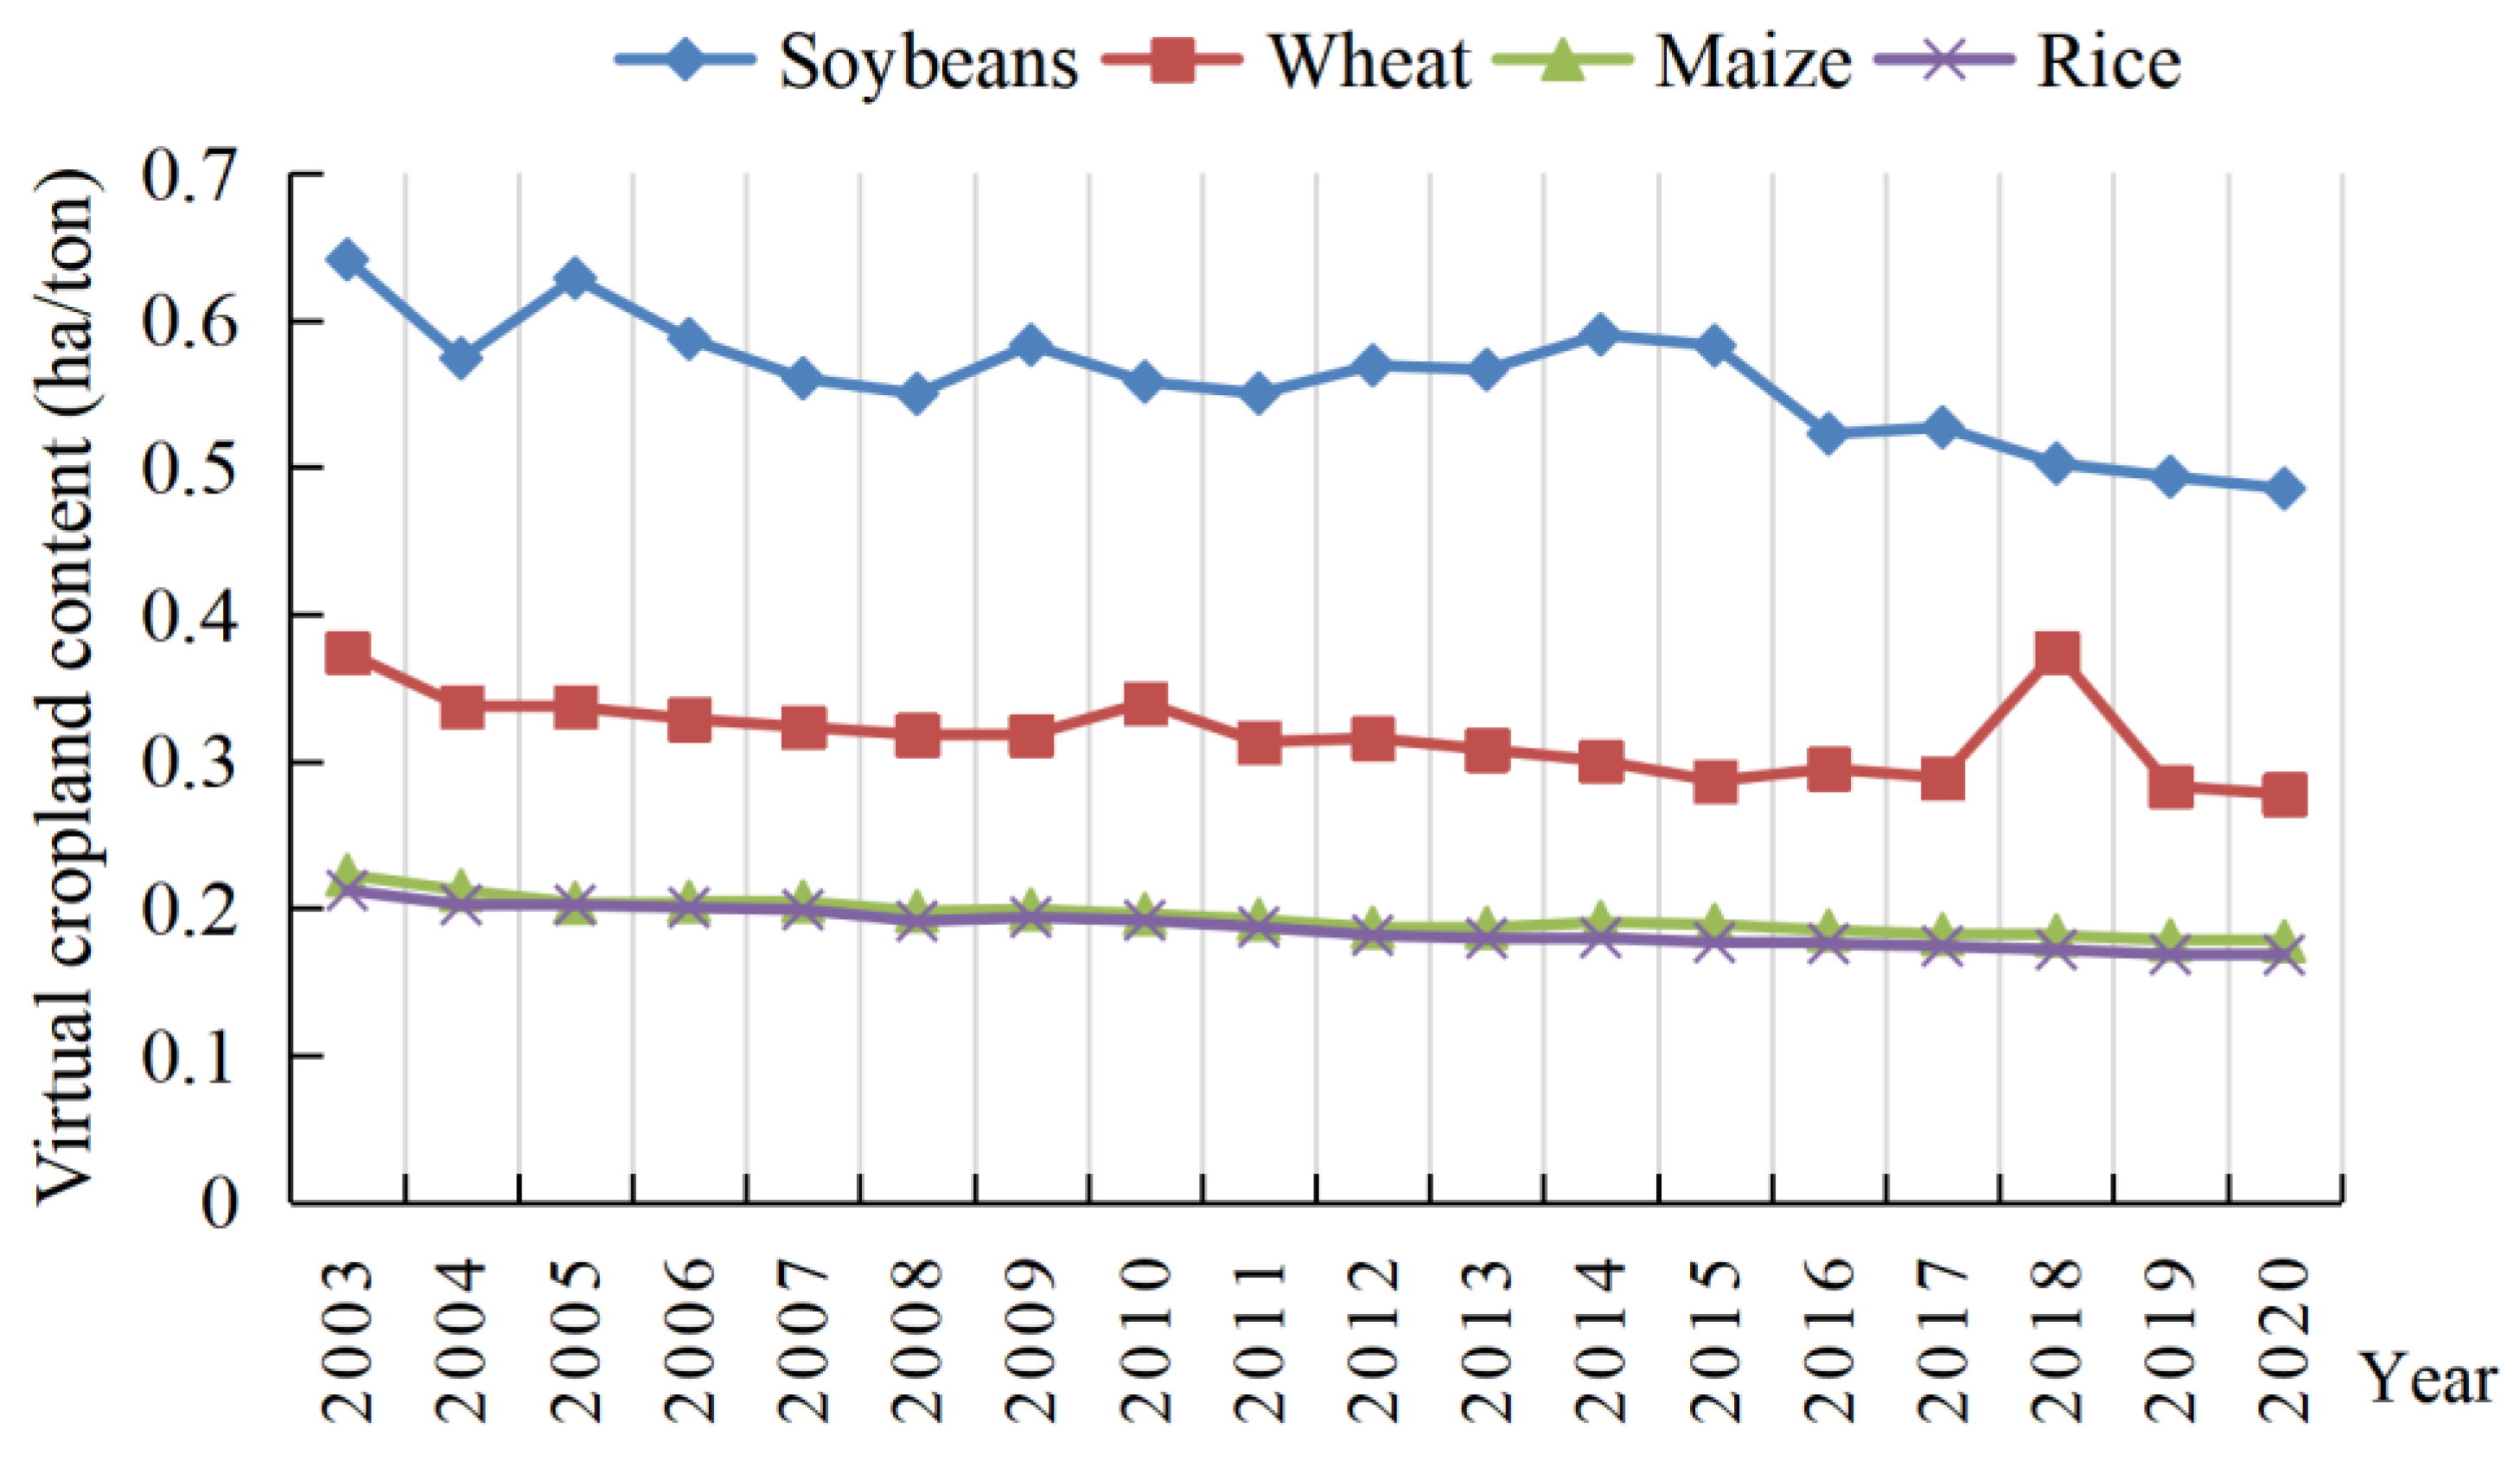
3.1.1. China’s Grain Production Virtual Land Content Time Variation Characteristics
3.1.2. China’s Virtual Land Content of Grain Production
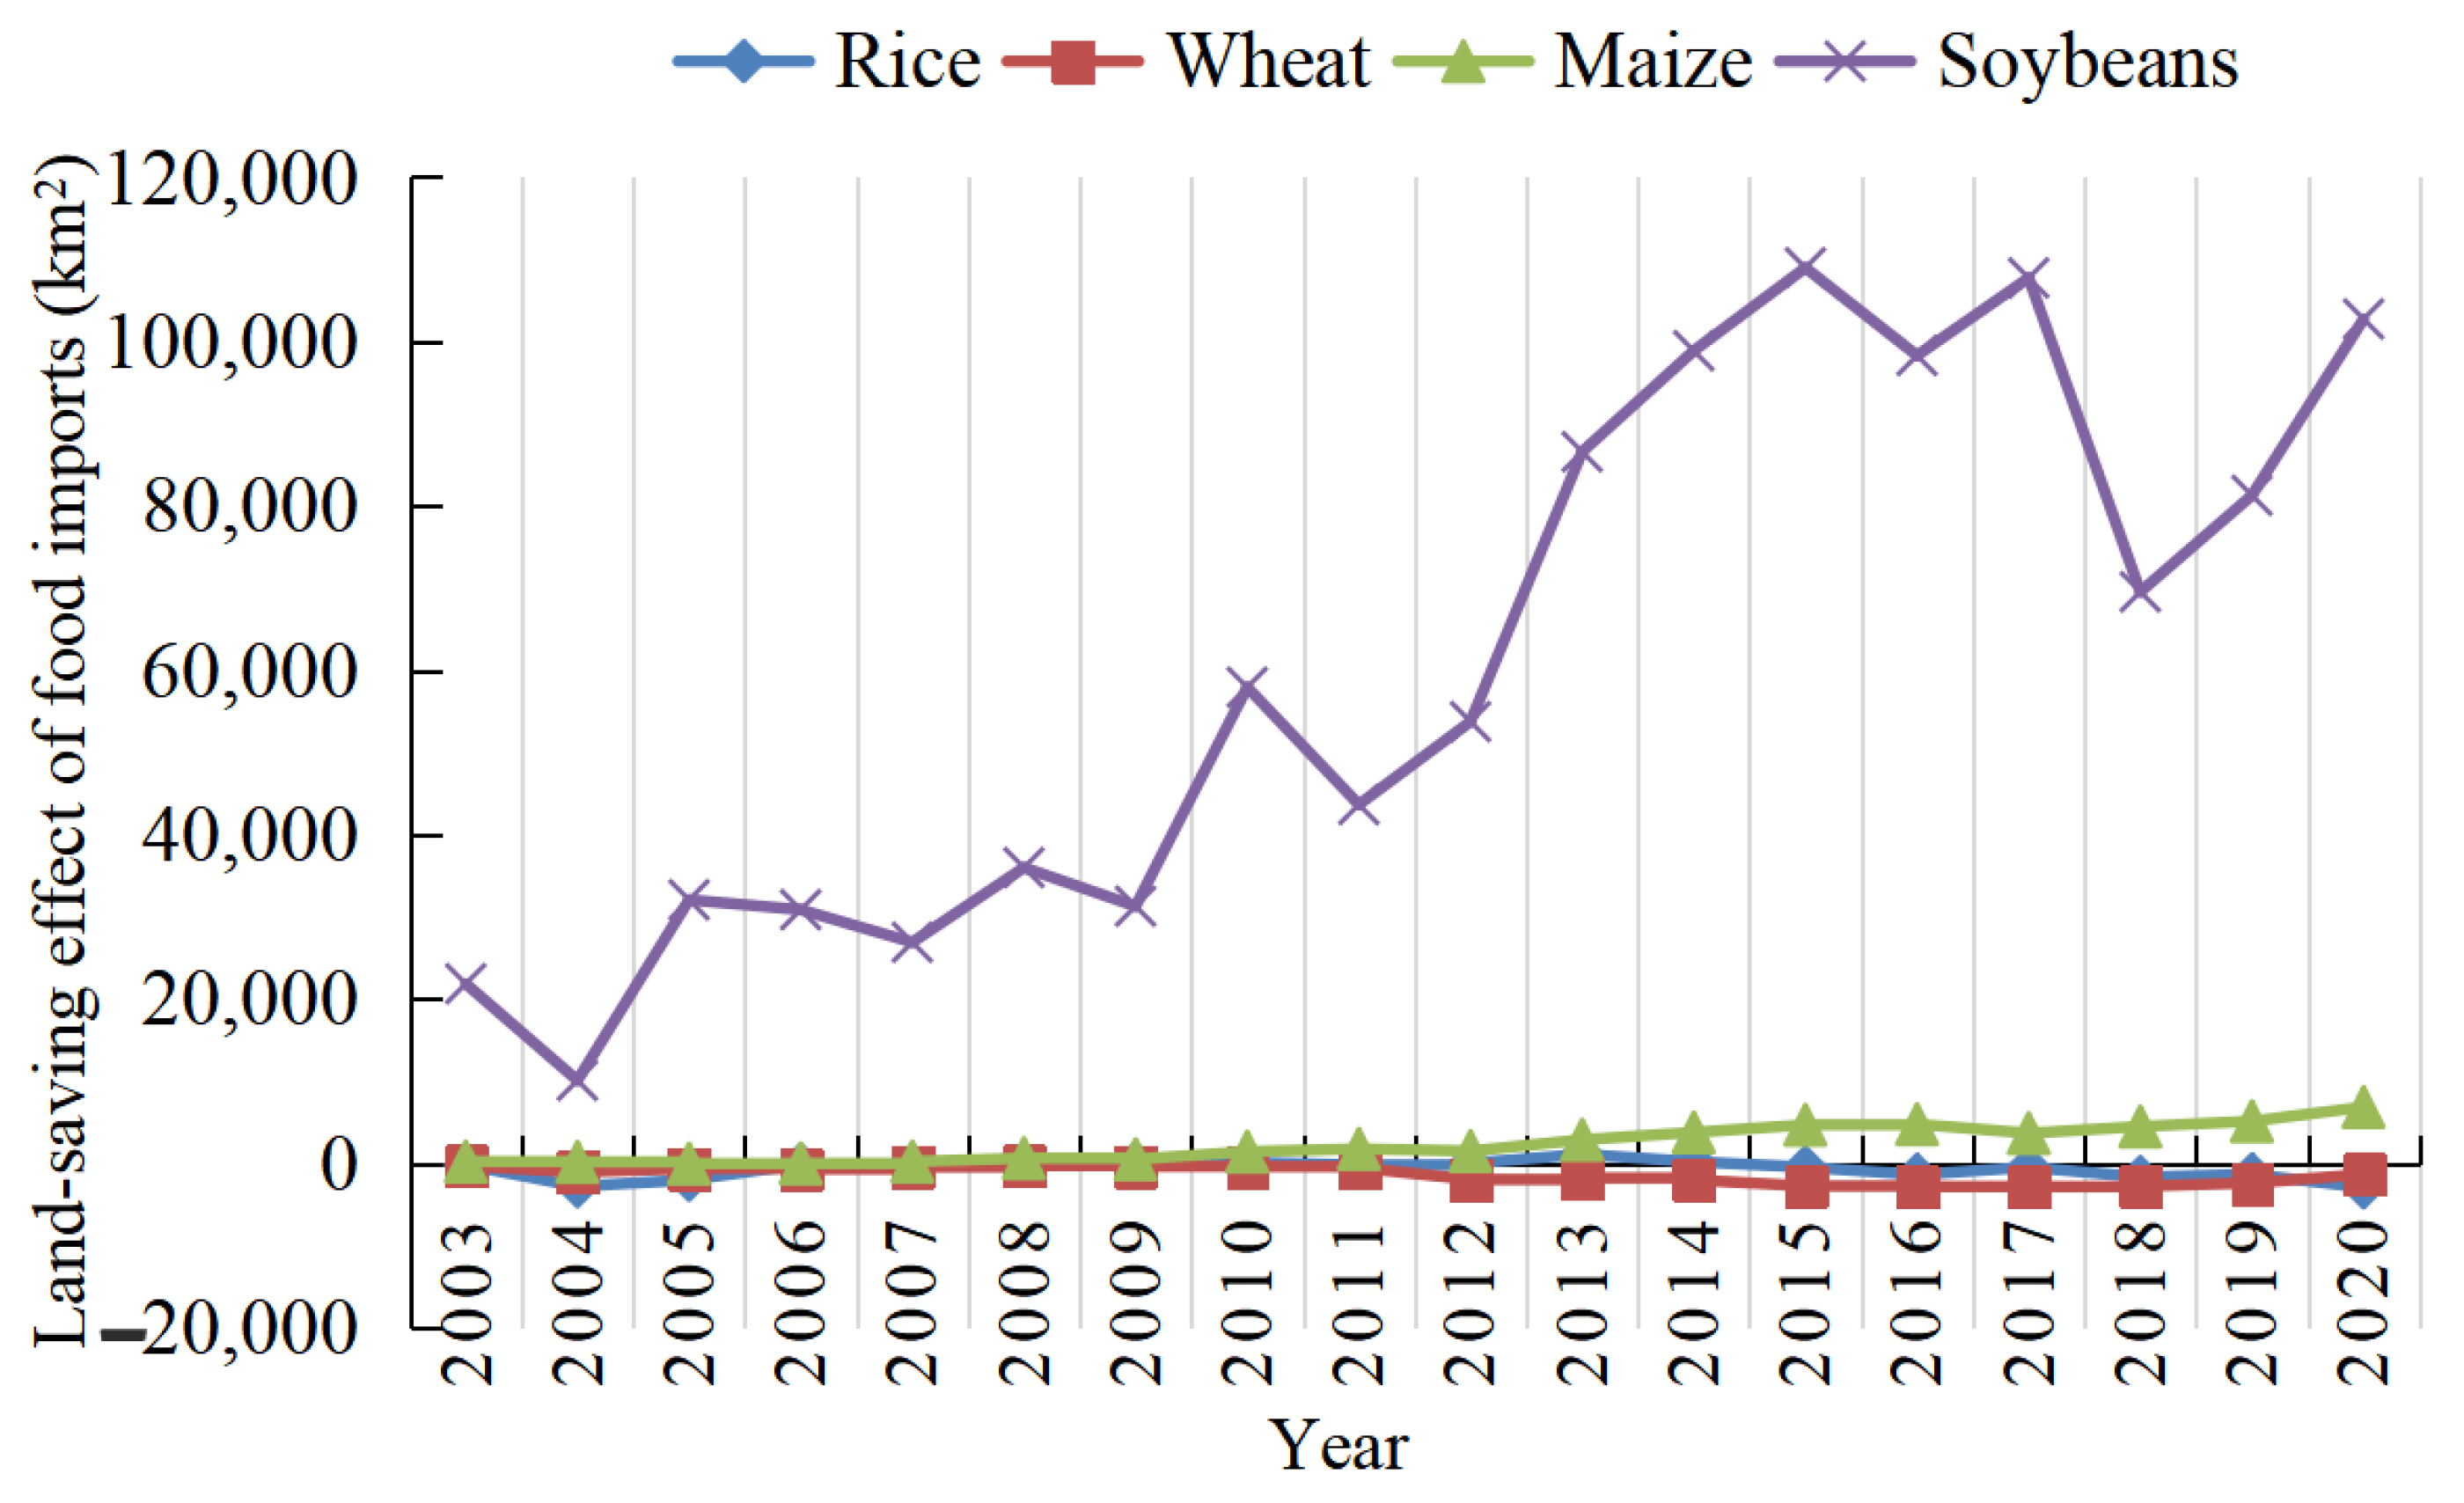
3.1.3. The Changing Characteristics of China’s Competitive Effects on Grain Imports
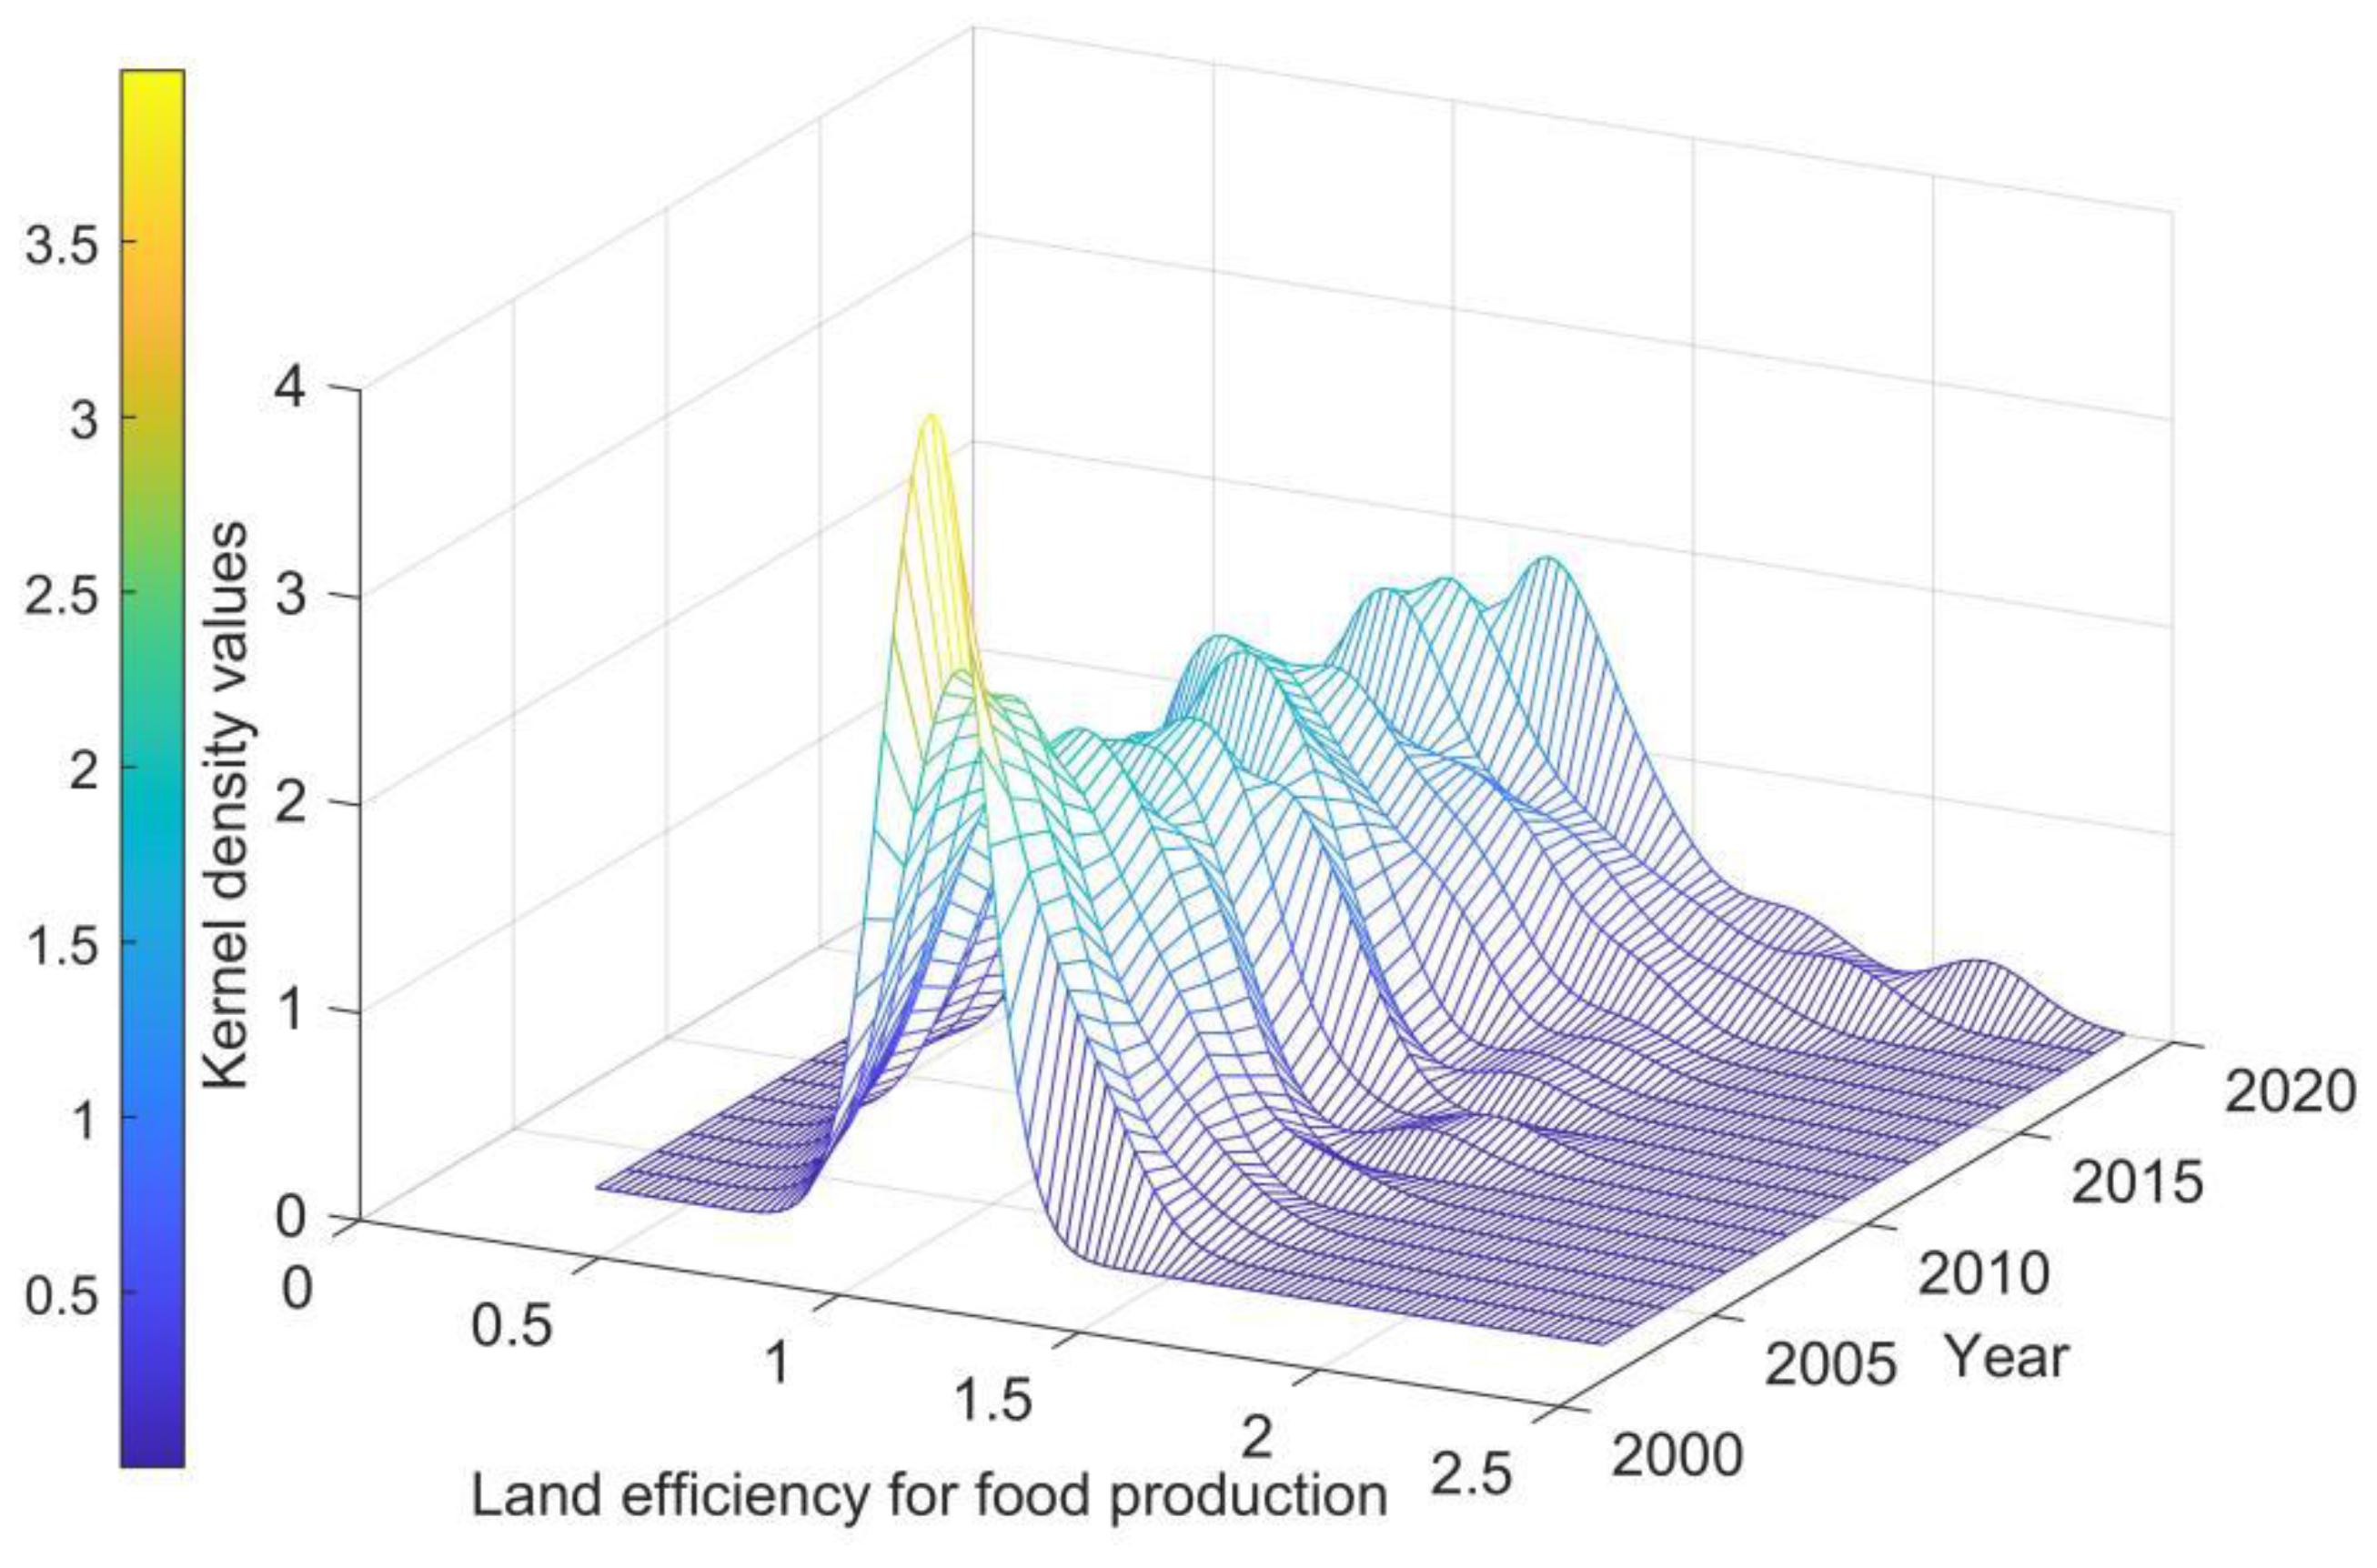
3.2. Results Analysis of Land Green Efficiency of Grain Production
3.3. Baseline Empirical of Competitive Effects of Grain Imports Affecting Land Green Efficiency of Grain Production
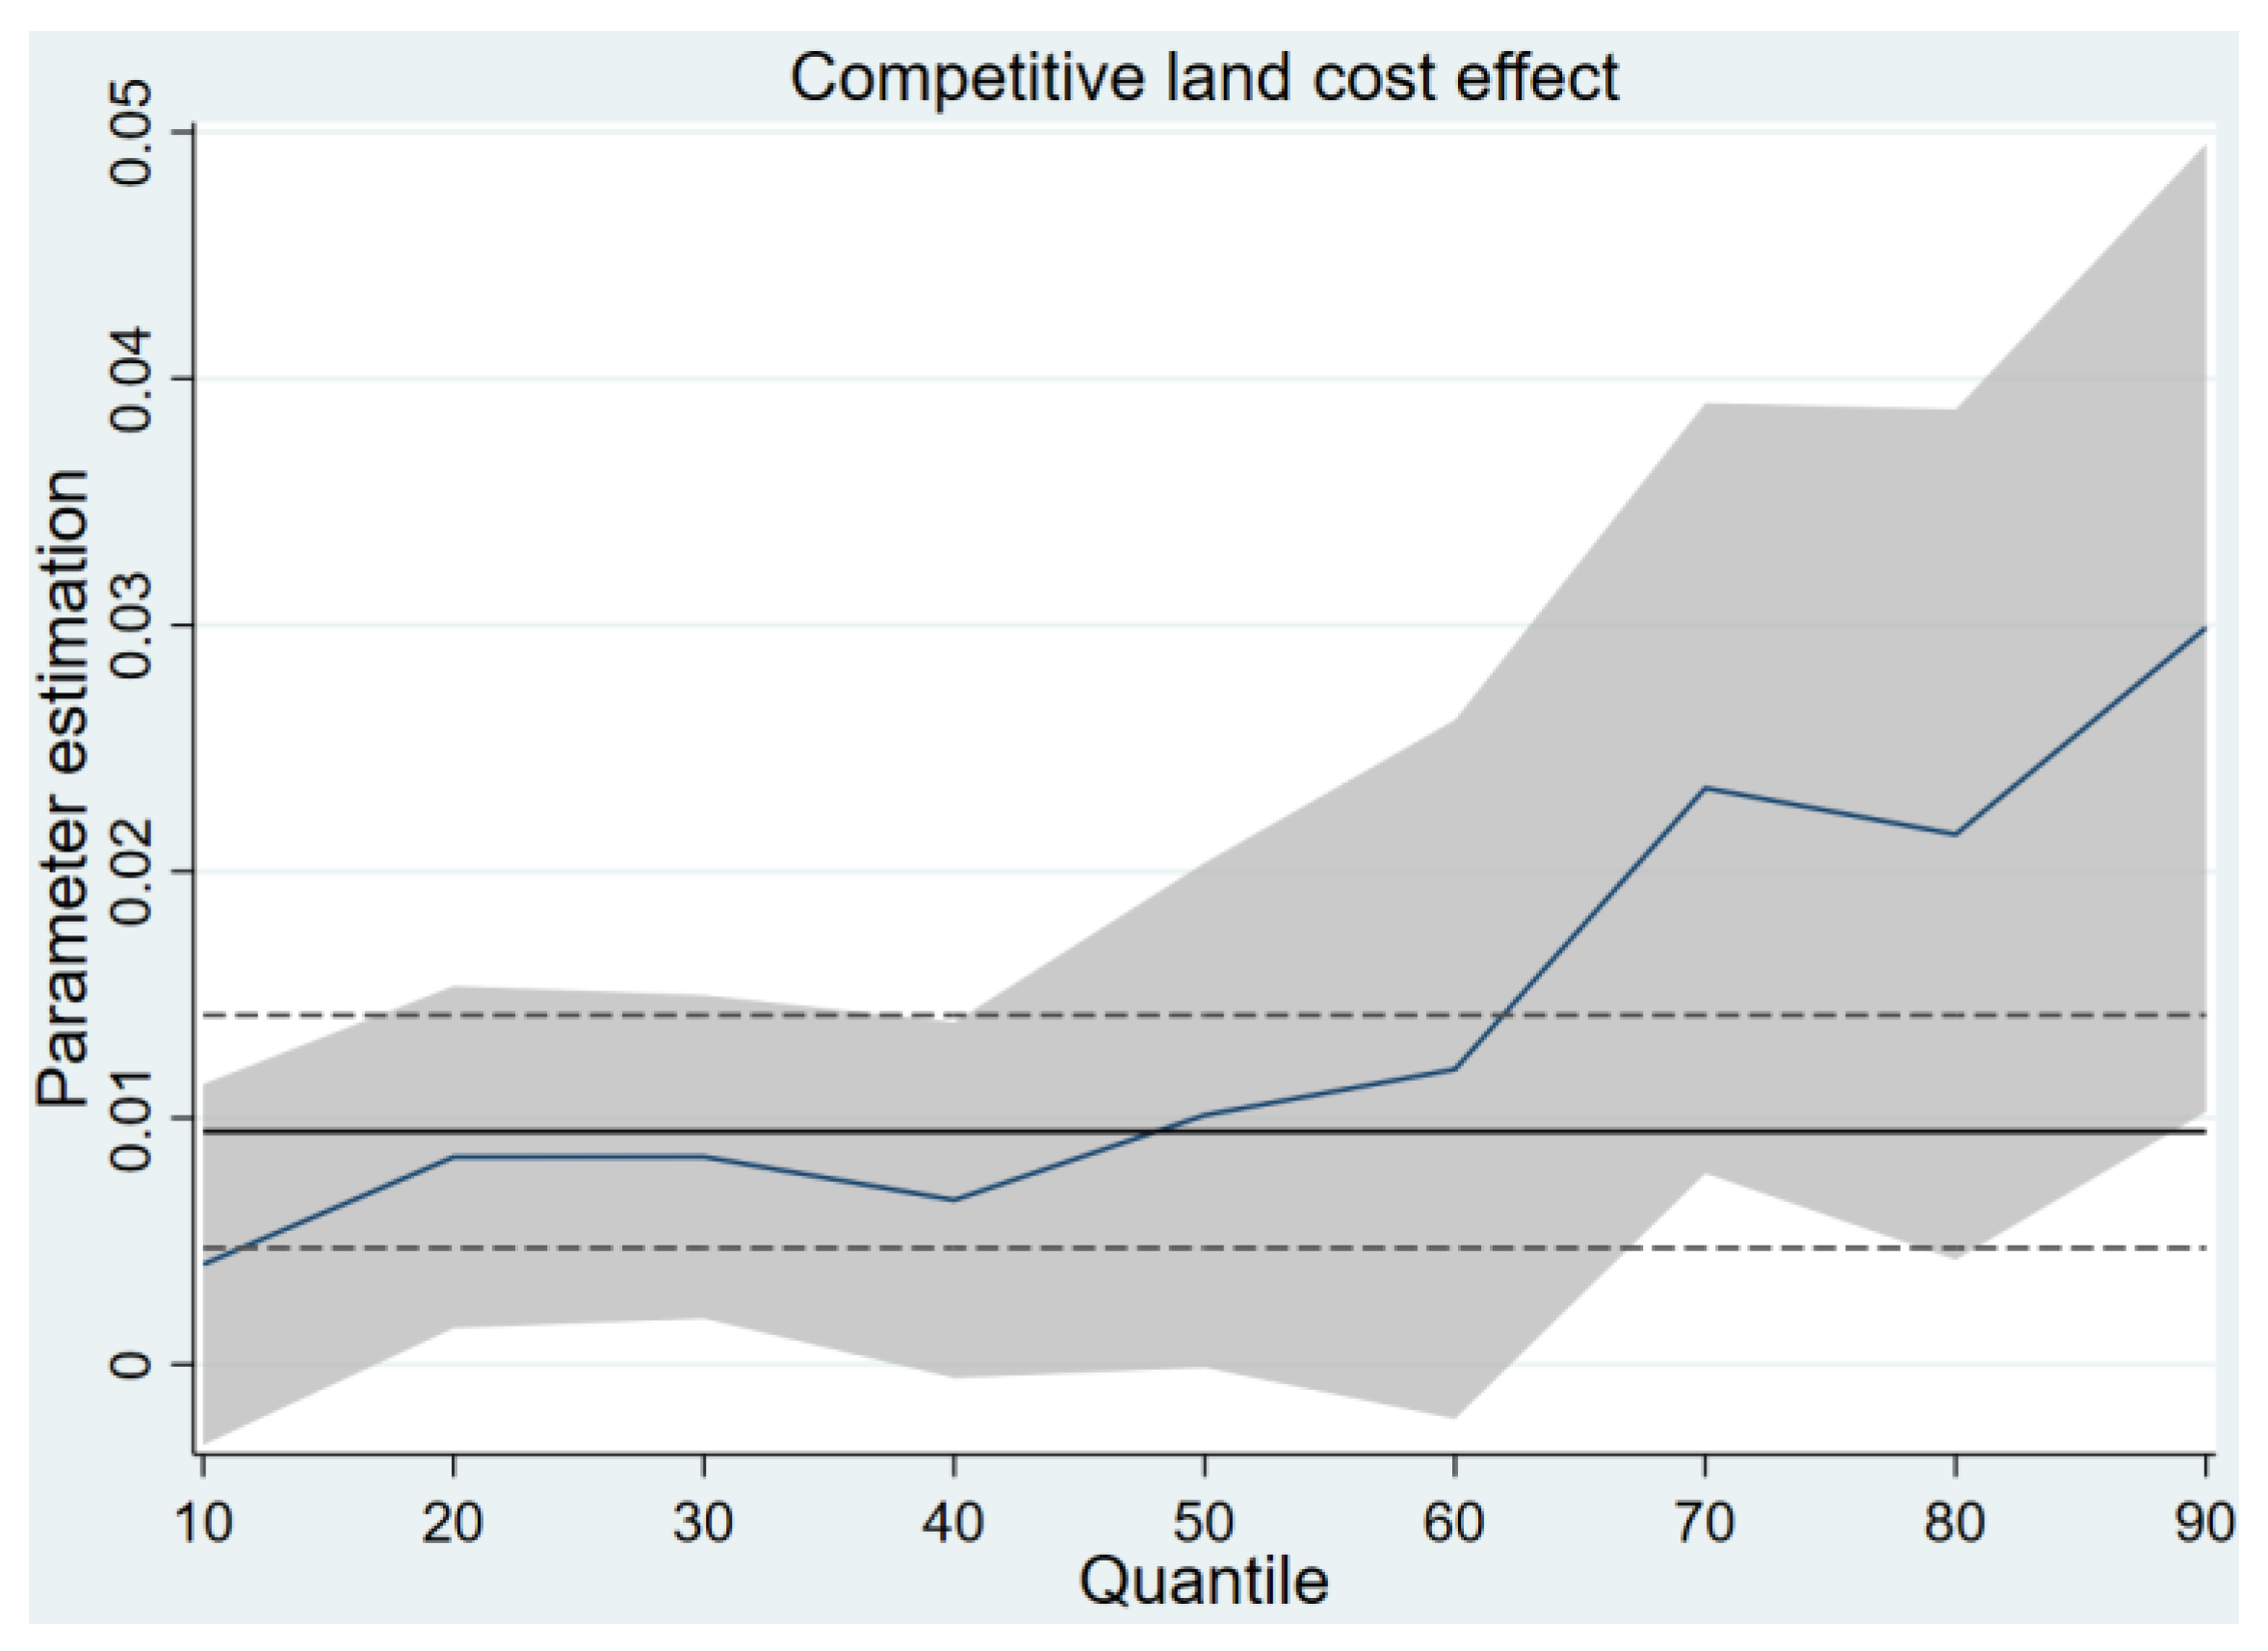
3.4. Quantile Empirical of Competitive Effects of Grain Imports Affecting Land Green Efficiency of Grain Production
3.5. Heterogeneity Analysis of Competitive Effects of Grain Imports Affecting Land Green Efficiency of Grain Production
3.5.1. Heterogeneity Analysis of North–South Regions in China
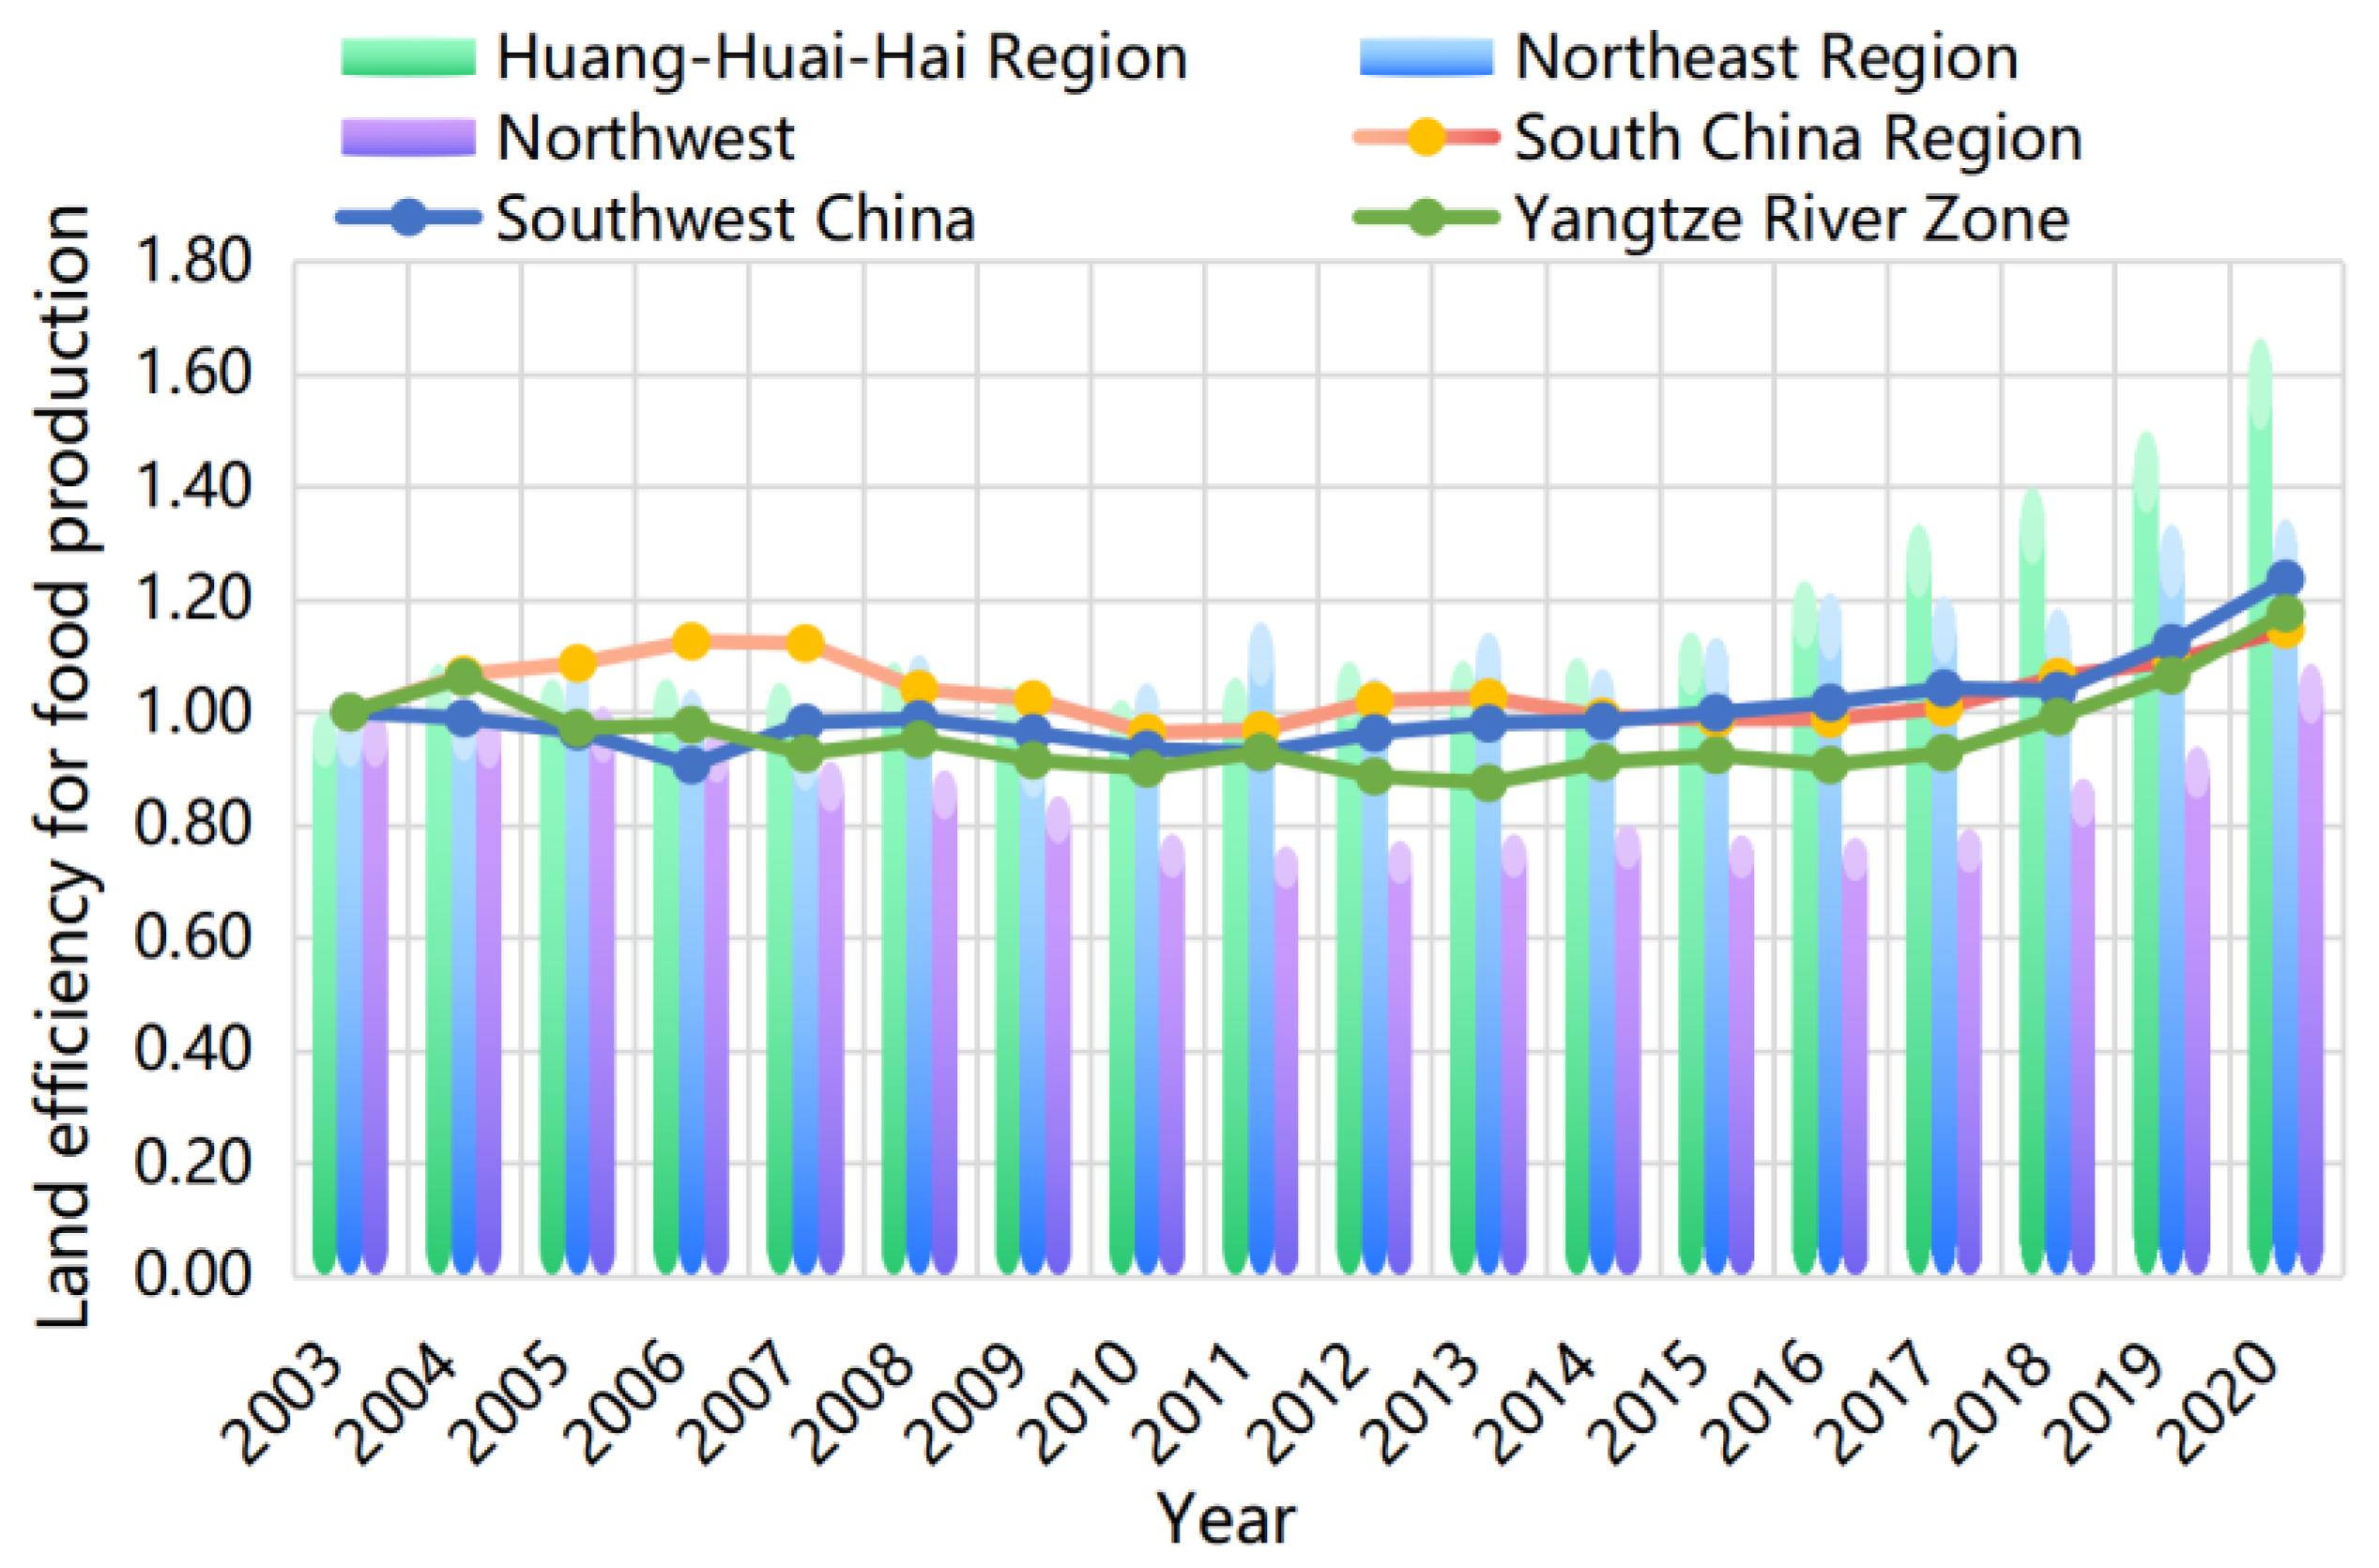
3.5.2. Heterogeneity Analysis of Sub-Grain Production Areas
3.5.3. Mechanisms of Competitive Effects of Grain Imports to Reduce Domestic Grain Profits to Force Land Green Efficiency Improvements
4. Discussion and Conclusions
4.1. Discussion of Empirical Results for Competitive Effects of Grain Imports Affecting Land Green Efficiency of Grain Production
4.2. Discussion and Conclusions of Sub-Regional Empirical Results
4.3. Discussion of the Mediating Mechanism of Competitive Effects of Grain Imports Affecting Land Green Efficiency of Grain Production
4.4. Conclusions
Author Contributions
Funding
Institutional Review Board Statement
Data Availability Statement
Acknowledgments
Conflicts of Interest
References
- Huang, F.; Liu, Z.; Ridoutt, B.G.; Huang, J.; Li, B.G. China’s water for food under growing water scarcity. Food Secur. 2015, 7, 933–949. [Google Scholar] [CrossRef]
- Feng, Q.; Cheng, G.D.; Endo, K.N. Water content variations and respective ecosystems of sandy land in China. Environ. Geol. 2001, 40, 1075–1083. [Google Scholar]
- Ji-Kun, H.; Wei, W.; Qi, C.; Wei, X. The prospects for China’s food security and imports: Will China starve the world via imports? J. Integr. Agric. 2017, 16, 2933–2944. [Google Scholar] [CrossRef]
- Deng, C.X.; Zhang, G.J.; Li, Z.W.; Li, K. Interprovincial food trade and water resources conservation in China. Sci. Total Environ. 2020, 737, 139651. [Google Scholar] [CrossRef] [PubMed]
- Neary, J.P. Putting the “New” into New Trade Theory: Paul Krugman’s Nobel Memorial Prize in Economics. Scand. J. Econ. 2009, 111, 217–250. [Google Scholar] [CrossRef]
- Sun, L.Y.; Miao, C.L.; Yang, L. Ecological-economic efficiency evaluation of green technology innovation in strategic emerging industries based on entropy weighted TOPSIS method. Ecol. Indic. 2017, 73, 554–558. [Google Scholar] [CrossRef]
- Yang, H.; Wang, L.; Abbaspour, K.C.; Zehnder, A.J.B. Virtual water trade: An assessment of water use efficiency in the international food trade. Hydrol. Earth Syst. Sci. 2006, 10, 443–454. [Google Scholar] [CrossRef]
- Huang, H.; von Lampe, M.; van Tongeren, F. Climate change and trade in agriculture. Food Policy 2011, 36, S9–S13. [Google Scholar] [CrossRef]
- Wichelns, D. The policy relevance of virtual water can be enhanced by considering comparative advantages. Agric. Water Manag. 2004, 66, 49–63. [Google Scholar] [CrossRef]
- Chen, G.Q.; Han, M.Y. Virtual land use change in China 2002–2010: Internal transition and trade imbalance. Land Use Policy 2015, 47, 55–65. [Google Scholar] [CrossRef]
- Wurtenberger, L.; Koellner, T.; Binder, C.R. Virtual land use and agricultural trade: Estimating environmental and socio-economic impacts. Ecol. Econ. 2006, 57, 679–697. [Google Scholar] [CrossRef]
- Yilin, L.; La, Z.; Varis, O.; Kai, F.; Gang, L.; Pute, W. Enhancing water and land efficiency in agricultural production and trade between Central Asia and China. Sci. Total Environ. 2021, 780, 146584. [Google Scholar] [CrossRef]
- Hanyuan, J.; Ciwen, Z. Will the structure of food imports improve China’s water-intensive food cultivation structure? A spatial econometric analysis. Water 2023, 15, 2800. [Google Scholar] [CrossRef]
- Marius, C.; Juan, S.; Andreea, A.; Simona Roxana, P. Deliver Smart, Not More! Building Economically Sustainable Competitiveness on the Ground of High Agri-Food Trade Specialization in the EU. Foods 2023, 12, 232. [Google Scholar] [CrossRef]
- Meier, T.; Christen, O.; Semler, E.; Jahreis, G.; Voget-Kleschin, L.; Schrode, A.; Artmann, M. Balancing virtual land imports by a shift in the diet. Using a land balance approach to assess the sustainability of food consumption. Germany as an example. Appetite 2014, 74, 20–34. [Google Scholar] [CrossRef] [PubMed]
- Qiang, W.L.; Niu, S.W.; Liu, A.M.; Kastner, T.; Bie, Q.; Wang, X.; Cheng, S.K. Trends in global virtual land trade in relation to agricultural products. Land Use Policy 2020, 92, 104439. [Google Scholar] [CrossRef]
- Yawson, D.O. Estimating virtual water and land use transfers associated with future food supply: A scalable food balance approach. MethodsX 2020, 7, 100811. [Google Scholar] [CrossRef]
- Quaye, A.K.; Hall, C.A.S.; Luzadis, V.A. Agricultural land use efficiency and food crop production in Ghana. Environ. Dev. Sustain. 2010, 12, 967–983. [Google Scholar] [CrossRef]
- Shao, L.; Guan, D.B.; Wu, Z.; Wang, P.S.; Chen, G.Q. Multi-scale input-output analysis of consumption-based water resources: Method and application. J. Clean. Prod. 2017, 164, 338–346. [Google Scholar] [CrossRef]
- Xu, Z.C.; Li, Y.J.; Chau, S.N.; Dietz, T.; Li, C.B.; Wan, L.W.; Zhang, J.D.; Zhang, L.W.; Li, Y.K.; Chung, M.G.; et al. Impacts of international trade on global sustainable development. Nat. Sustain. 2020, 3, 964–971. [Google Scholar] [CrossRef]
- Ringler, C.; Bhaduri, A.; Lawford, R. The nexus across water, energy, land and food (WELF): Potential for improved resource use efficiency? Curr. Opin. Environ. Sustain. 2013, 5, 617–624. [Google Scholar] [CrossRef]
- Wang, Z.M.; Nguyen, T.; Westerhoff, P. Food-Energy-Water Analysis at Spatial Scales for Districts in the Yangtze River Basin (China). Environ. Eng. Sci. 2019, 36, 789–797. [Google Scholar] [CrossRef]
- Hassan, R.M.; Faki, H.; Byerlee, D. The trade-off between economic efficiency and food self-sufficiency in using Sudan’s irrigated land resources. Food Policy 2000, 25, 35–54. [Google Scholar] [CrossRef]
- Li, Z.M.; Fu, W.; Luo, M.C.; Chen, J.C. The Coupling Coordination between the Competitiveness Level and Land Use Efficiency of Green Food Industry in China. Land 2022, 11, 2116. [Google Scholar] [CrossRef]
- Ciaian, P.; Baldoni, E.; Kancs, D.; Drabik, D. The Capitalization of Agricultural Subsidies into Land Prices. Annu. Rev. Resour. Econ. 2021, 13, 17–38. [Google Scholar] [CrossRef]
- Cao, C.; Yuan, G.J. Foreign trade and virtual land resources: A case study of China’s grain. Agric. Econ. Zemed. Ekon. 2022, 68, 259–270. [Google Scholar] [CrossRef]
- Osei-Owusu, A.K.; Kastner, T.; de Ruiter, H.; Thomsen, M.; Caro, D. The global cropland footprint of Denmark’s food supply 2000–2013. Glob. Environ. Change-Hum. Policy Dimens. 2019, 58, 101978. [Google Scholar] [CrossRef]
- Maroufpoor, S.; Bozorg-Haddad, O.; Maroufpoor, E.; Gerbens-Leenes, P.W.; Loaiciga, H.A.; Savic, D.; Singh, V.P. Optimal virtual water flows for improved food security in water-scarce countries. Sci. Rep. 2021, 11, 21027. [Google Scholar] [CrossRef]
- Cai, B.M.; Hubacek, K.; Feng, K.S.; Zhang, W.; Wang, F.; Liu, Y. Tension of Agricultural Land and Water Use in China’s Trade: Tele-Connections, Hidden Drivers and Potential Solutions. Environ. Sci. Technol. 2020, 54, 5365–5375. [Google Scholar] [CrossRef]
- Judd, V.C. The price-quality relationship: An empirical study of food products. J. Food Prod. Mark. 2000, 6, 11–24. [Google Scholar] [CrossRef]
- Masud, M.B.; Wada, Y.; Goss, G.; Faramarzi, M. Global implications of regional grain production through virtual water trade. Sci. Total Environ. 2019, 659, 807–820. [Google Scholar] [CrossRef] [PubMed]
- Hatzenbuehler, P.L.; Gillespie, J.M.; Oneil, C.E. Does healthy food cost more in poor neighborhoods? An analysis of retail food cost and spatial competition. Agric. Resour. Econ. Rev. 2012, 41, 43–56. [Google Scholar] [CrossRef]
- Oh, D.H. A global Malmquist-Luenberger productivity index. J. Product. Anal. 2010, 34, 183–197. [Google Scholar] [CrossRef]
- Li, Z.; Ye, W.; Jiang, H.; Song, H.; Zheng, C. Impact of the eco-efficiency of food production on the water–land–food system coordination in China: A discussion of the moderation effect of environmental regulation. Sci. Total Environ. 2023, 857, 159641. [Google Scholar] [CrossRef] [PubMed]
- Liu, D.; Zhu, X.; Wang, Y. China’s agricultural green total factor productivity based on carbon emission: An analysis of evolution trend and influencing factors. J. Clean. Prod. 2021, 278, 123692. [Google Scholar] [CrossRef]
- Zhi, Y.L.; Chen, J.F.; Wang, H.M.; Liu, G.; Zhu, W.M. Evaluation of the suitability of the composite system of “water-energy-food” in China from the perspective of symbiosis. China Popul. Resour. Environ. 2020, 30, 11. [Google Scholar]
- Buchthal, O.; Nelson-Hurwitz, D.; Hsu, L.; Byers, M.; Banna, J. Identifying Urban Immigrant Food-Cultivation Practices for Culturally-Tailored Garden-Based Nutrition Programs. J. Immigr. Minor. Health 2020, 22, 778–785. [Google Scholar] [CrossRef]
- Tichenor, N.E.; van Zanten, H.H.E.; de Boer, I.J.M.; Peters, C.J.; McCarthy, A.C.; Griffin, T.S. Land use efficiency of beef systems in the Northeastern USA from a food supply perspective. Agric. Syst. 2017, 156, 34–42. [Google Scholar] [CrossRef]
- Duro, J.A.; Lauk, C.; Kastner, T.; Erb, K.H.; Haberl, H. Global inequalities in food consumption, cropland demand and land-use efficiency: A decomposition analysis. Glob. Environ. Change-Hum. Policy Dimens. 2020, 64, 102124. [Google Scholar] [CrossRef]
- Lee, D.S.; Park, J.P. Application of bootstrap method to modelling of microbial food quality change. Ital. J. Food Sci. 2009, 21, 23–26. [Google Scholar]
- Czyzewski, B.; Matuszczak, A.; Grzelak, A.; Guth, M.; Majchrzak, A. Environmental sustainable value in agriculture revisited: How does Common Agricultural Policy contribute to eco-efficiency? Sustain. Sci. 2021, 16, 137–152. [Google Scholar] [CrossRef]
- Schug, B.S.; Brendel, E.; Chantraine, E.; Wolf, D.; Martin, W.; Schall, R.; Blume, H.H. The effect of food on the pharmacokinetics of nifedipine in two slow release formulations: Pronounced lag-time after a high fat breakfast. Br. J. Clin. Pharmacol. 2002, 53, 582–588. [Google Scholar] [CrossRef] [PubMed]
- Psomas, A.; Vryzidis, I.; Spyridakos, A.; Mimikou, M. MCDA approach for agricultural water management in the context of water-energy-land-food nexus. Oper. Res. 2021, 21, 689–723. [Google Scholar] [CrossRef]
- Qi, Y.Y.; Farnoosh, A.; Lin, L.; Liu, H. Coupling coordination analysis of China’s provincial water-energy-food nexus. Environ. Sci. Pollut. Res. 2022, 29, 23303–23313. [Google Scholar] [CrossRef]

| Variable Category | Variable | Calculation Method | Unit |
|---|---|---|---|
| Independent variable | Land green efficiency of grain production | Measured by the Global Malmquist–Luenberger Index | - |
| Dependent variable | Competitive effects of grain imports | Statistics | ×105 hectares |
| Instrumental variable | Farming scale | Milk production + beef production + poultry production + lamb production + pork production | ×108 tons |
| Control variable | Technical environment | Technology market turnover/internal R&D expenditure | - |
| Financial support for agriculture | Expenditure on agriculture, forestry, and water affairs in financial expenditure | ×1010 | |
| Agricultural machinery | Total power of agricultural machinery/number of employees in primary industry | Kilowatt/per | |
| Specialization of crop cultivation | Herfindahl index for wheat, rice, corn, beans, and potatoes | - | |
| Environmental regulation | Investment in environmental pollution control as a share of GDP | % | |
| Urbanization level | Share of urban population | % | |
| Percentage of village land | (Current land area of villages in each province/current land area of villages nationwide) × 100% | % | |
| Industrial and economic structure | Effective irrigated area/crop sown area | - |
| Region | Soybean Virtual Land | Maize Virtual Land | Rice Virtual Land | Wheat Virtual Land |
|---|---|---|---|---|
| Huang-Huai-Hai region | 0.594 | 0.201 | 0.185 | 0.184 |
| Northeast region | 0.545 | 0.329 | 0.164 | 0.165 |
| South China | 0.475 | 0.498 | 0.243 | 0.190 |
| Southwest China | 0.585 | 0.383 | 0.216 | 0.197 |
| Middle and lower reaches of the Yangtze River | 0.436 | 0.344 | 0.208 | 0.159 |
| Northwest | 0.686 | 0.272 | 0.161 | 0.223 |
| National | 0.554 | 0.338 | 0.197 | 0.187 |
| (1) | (2) | (3) | (4) | (5) | (6) | |
|---|---|---|---|---|---|---|
| Competitive effects of grain imports | 0.007 *** | 0.171 *** | 0.008 *** | 0.026 *** | ||
| (2.956) | (2.895) | (2.730) | (5.895) | |||
| Competitive effects of grain imports first-order lag | 0.012 *** | |||||
| (6.739) | ||||||
| Competitive effects of grain imports square | −0.001 *** | |||||
| (−5.042) | ||||||
| Technical environment | −0.001 | −0.001 | −0.006 | 0.001 | 0.029 | −0.003 |
| (−0.115) | (−0.087) | (−0.147) | (0.098) | (1.469) | (−0.282) | |
| Financial support for agriculture | 0.010 ** | 0.009 * | −0.022 | 0.005 | 0.002 | 0.005 |
| (2.248) | (1.959) | (−1.115) | (1.119) | (0.644) | (1.053) | |
| Agricultural machinery | 0.005 * | 0.005 * | 0.004 | 0.004 * | 0.010 *** | 0.006 ** |
| (1.954) | (1.944) | (0.416) | (1.687) | (6.344) | (2.082) | |
| Specialization of crop cultivation | 0.071 | 0.073 | 0.200 | 0.067 | −0.296 *** | 0.037 |
| (0.939) | (0.968) | (0.685) | (0.907) | (−5.292) | (0.499) | |
| Environmental regulation | −0.008 | −0.003 | 0.122 ** | 0.006 | −0.001 | 0.001 |
| (−0.686) | (−0.276) | (2.051) | (0.500) | (−0.069) | (0.079) | |
| Urbanization level | −0.419 * | −0.369* | −0.028 | −0.373 * | 0.607 *** | −0.234 |
| (−1.831) | (−1.673) | (−0.029) | (−1.666) | (6.592) | (−1.186) | |
| Percentage of village land | 0.003 | 0.005 | 0.125 | 0.009 | 0.037 *** | 0.011 |
| (0.224) | (0.400) | (1.490) | (0.726) | (9.485) | (0.952) | |
| Industrial and economic structure | −0.234 * | −0.187 | 0.981 | −0.142 | −0.374 ** | −0.099 |
| (−1.649) | (−1.316) | (1.490) | (−0.999) | (−2.317) | (−0.706) | |
| Time fixed effect | Yes | Yes | Yes | Yes | No | Yes |
| Individual fixed effects | Yes | Yes | Yes | Yes | No | Yes |
| Phase I F-statistic values | 13.33 | |||||
| Wald’s test value | 124.04 *** | |||||
| Constant term | 1.339 *** | 1.260 *** | −0.566 | 1.248 *** | −0.029 | 1.107 *** |
| (8.022) | (7.687) | (−0.567) | (7.462) | (−0.231) | (7.251) | |
| Observed values | 540 | 540 | 540 | 510 | 540 | 540 |
| (1) | (2) | (3) | (4) | (5) | (6) | (7) | (8) | (9) | |
|---|---|---|---|---|---|---|---|---|---|
| Competitive effects of grain imports | 0.004 | 0.008 ** | 0.008 ** | 0.007 * | 0.010 * | 0.012 * | 0.023 *** | 0.022 ** | 0.030 *** |
| (1.089) | (2.382) | (2.523) | (1.815) | (1.941) | (1.659) | (2.940) | (2.449) | (2.991) | |
| Technical environment | −0.030 *** | −0.037 *** | −0.040 *** | −0.030 | −0.017 | −0.001 | 0.006 | 0.018 | 0.114 ** |
| (−2.976) | (−3.565) | (−2.634) | (−1.446) | (−0.790) | (−0.025) | (0.244) | (0.449) | (2.083) | |
| Financial support for agriculture | 0.008 | 0.005 | 0.003 | −0.002 | −0.002 | −0.007 | −0.011 | 0.005 | 0.028 * |
| (1.413) | (0.970) | (0.593) | (−0.271) | (−0.264) | (−0.859) | (−1.178) | (0.383) | (1.861) | |
| Agricultural machinery | 0.007 | −0.005 | 0.006 | 0.005 | 0.011 ** | 0.013 *** | 0.015 ** | 0.025 ** | 0.022 * |
| (0.899) | (−0.621) | (0.775) | (0.800) | (2.217) | (2.641) | (1.978) | (2.343) | (1.912) | |
| Specialization of crop cultivation | −0.278 *** | −0.257 *** | −0.269 *** | −0.311 *** | −0.325 *** | −0.316 *** | −0.379 *** | −0.456 *** | −0.369 *** |
| (−5.836) | (−5.676) | (−5.014) | (−5.204) | (−6.545) | (−3.625) | (−3.416) | (−3.328) | (−2.720) | |
| Environmental regulation | 0.018 | 0.016 | −0.007 | −0.009 | −0.016 | −0.016 | −0.003 | −0.009 | −0.005 |
| (1.264) | (1.118) | (−0.435) | (−0.603) | (−1.155) | (−1.051) | (−0.178) | (−0.518) | (−0.244) | |
| Urbanization level | 0.479 *** | 0.584 *** | 0.566 *** | 0.621 *** | 0.577 *** | 0.550 *** | 0.515 *** | 0.722 *** | 0.660 ** |
| (5.139) | (5.621) | (5.612) | (5.510) | (6.818) | (6.031) | (3.073) | (2.796) | (2.280) | |
| Percentage of village land | 0.037 *** | 0.036 *** | 0.034 *** | 0.040 *** | 0.036 *** | 0.038 *** | 0.032 *** | 0.026 *** | 0.014 |
| (6.758) | (6.639) | (5.222) | (5.525) | (6.630) | (6.561) | (3.661) | (2.812) | (1.320) | |
| Industrial and economic structure | −0.301* | −0.277* | −0.288 * | −0.258 | −0.353* | −0.322 | −0.232 | −0.160 | −0.132 |
| (−1.810) | (−1.951) | (−1.914) | (−1.477) | (−1.877) | (−1.551) | (−0.922) | (−0.536) | (−0.466) | |
| Constant term | 0.902 *** | 0.895 *** | 0.948 *** | 0.934 *** | 1.053 *** | 1.055 *** | 1.010 *** | 0.935 *** | 0.926 *** |
| (5.859) | (6.880) | (6.800) | (6.685) | (7.566) | (7.184) | (5.497) | (6.425) | (6.384) |
| Northern Region | Southern Region | |||||||
|---|---|---|---|---|---|---|---|---|
| (1) | (2) | (3) | (4) | (5) | (6) | (7) | (8) | |
| Competitive effects of grain imports | 0.010 *** | 0.152 * | −0.001 | −0.006 | ||||
| (2.652) | (1.786) | (−0.363) | (−0.071) | |||||
| Competitive effects of grain imports first-order lag | 0.010 *** | 0.004 | ||||||
| (2.783) | (1.565) | |||||||
| Technical environment | −0.035 *** | −0.031 ** | 0.014 | −0.031 ** | −0.042 ** | −0.042 ** | −0.035 * | −0.040 * |
| (−2.601) | (−2.338) | (0.296) | (−2.353) | (−2.108) | (−2.111) | (−1.681) | (−1.851) | |
| Financial support for agriculture | 0.034 *** | 0.032 *** | −0.002 | 0.028 *** | 0.008 * | 0.008 * | 0.008 | 0.006 |
| (5.047) | (6.675) | (−0.069) | (6.154) | (1.877) | (1.903) | (0.392) | (1.298) | |
| Agricultural machinery | −0.030 *** | −0.028 *** | −0.004 | −0.032 *** | 0.009 *** | 0.009 *** | 0.009 *** | 0.009 *** |
| (−3.950) | (−3.737) | (−0.141) | (−6.290) | (6.366) | (6.374) | (2.924) | (6.292) | |
| Specialization of crop cultivation | −0.340 | −0.283 | 0.218 | −0.203 | 0.002 | 0.002 | 0.064 | 0.024 |
| (−1.416) | (−1.184) | (0.288) | (−0.812) | (0.026) | (0.025) | (0.478) | (0.385) | |
| Environmental regulation | −0.032 ** | −0.023 | 0.118 | −0.024 | 0.007 | 0.006 | −0.006 | 0.021 |
| (−2.259) | (−1.558) | (1.296) | (−1.610) | (0.399) | (0.375) | (−0.131) | (1.261) | |
| Urbanization level | −3.269 *** | −3.023 *** | −0.277 | −3.086 *** | 0.946 *** | 0.953 *** | 1.456 ** | 0.951 *** |
| (−9.726) | (−8.655) | (−0.134) | (−8.852) | (6.305) | (6.308) | (2.389) | (6.165) | |
| Percentage of village land | −0.012 | −0.008 | 0.062 | −0.007 | 0.026* | 0.026* | −0.006 | 0.026* |
| (−0.488) | (−0.353) | (0.765) | (−0.305) | (1.782) | (1.741) | (−0.055) | (1.795) | |
| Industrial and economic structure | −0.006 | 0.054 | 0.866 | 0.052 | −0.580 *** | −0.584 *** | −0.612 | −0.490** |
| (−0.039) | (0.330) | (1.301) | (0.322) | (−2.975) | (−2.992) | (−1.471) | (−2.559) | |
| Time fixed effect | Yes | Yes | Yes | Yes | Yes | Yes | Yes | Yes |
| Individual fixed effect | Yes | Yes | Yes | Yes | Yes | Yes | Yes | Yes |
| Phase I F-statistic values | 16.38 | 12.07 | ||||||
| Wald’s test value | 23.22 *** | 165.26 *** | ||||||
| Constant term | 2.800 *** | 2.584 *** | −0.075 | 2.669 *** | 0.996 *** | 0.998 *** | 0.913 | 0.920 *** |
| (9.481) | (8.592) | (−0.040) | (8.762) | (5.572) | (5.574) | (1.392) | (5.107) | |
| Observed value | 270 | 270 | 270 | 255 | 270 | 270 | 270 | 255 |
| Major Grain-Producing Areas | Non-Grain-Producing Areas | |||||||
|---|---|---|---|---|---|---|---|---|
| (1) | (2) | (3) | (4) | (5) | (6) | (7) | (8) | |
| Land cost competition effectiveness | 0.002 | 0.096 | 0.007 ** | 0.202 ** | ||||
| (0.533) | (0.412) | (2.337) | (2.471) | |||||
| Competitive effects of grain imports first-order lag | 0.004 * | 0.016 *** | ||||||
| (1.673) | (6.065) | |||||||
| Technical environment | −0.012 | −0.010 | 0.051 | −0.011 | −0.000 | −0.001 | −0.072 | 0.004 |
| (−0.646) | (−0.566) | (0.283) | (−0.630) | (−0.011) | (−0.090) | (−1.091) | (0.223) | |
| Financial support for agriculture | 0.001 | 0.001 | −0.005 | 0.002 | −0.004 | −0.003 | 0.030 | −0.006 |
| (0.189) | (0.171) | (−0.171) | (0.311) | (−0.516) | (−0.334) | (0.881) | (−0.729) | |
| Agricultural machinery | 0.009 | 0.008 | −0.044 | 0.001 | 0.003 | 0.004 | 0.016 | 0.004 |
| (1.233) | (1.088) | (−0.363) | (0.121) | (1.020) | (1.134) | (1.160) | (1.228) | |
| Specialization of crop cultivation | −0.405 ** | −0.402 ** | −0.319 | −0.125 | 0.149 | 0.156* | 0.388 | 0.121 |
| (−2.409) | (−2.392) | (−0.567) | (−0.661) | (1.585) | (1.698) | (0.964) | (1.311) | |
| Environmental regulation | 0.000 | 0.004 | 0.232 | 0.016 | −0.007 | −0.005 | 0.045 | 0.005 |
| (0.020) | (0.208) | (0.425) | (0.898) | (−0.428) | (−0.301) | (0.706) | (0.299) | |
| Urbanization level | −0.581 | −0.602 | −2.417 | −0.644 * | −0.173 | −0.105 | 0.998 | −0.098 |
| (−1.538) | (−1.586) | (−0.741) | (−1.761) | (−0.549) | (−0.389) | (0.643) | (−0.351) | |
| Percentage of village land | 0.028 ** | 0.028 ** | 0.085 | 0.032 ** | 0.002 | 0.002 | −0.187 | 0.006 |
| (1.984) | (2.000) | (0.653) | (2.323) | (0.064) | (0.076) | (−0.820) | (0.234) | |
| Industrial and economic structure | −0.259 * | −0.248 | 0.492 | −0.157 | −0.215 | −0.176 | 0.159 | −0.182 |
| (−1.725) | (−1.641) | (0.289) | (−1.122) | (−0.853) | (−0.706) | (0.157) | (−0.711) | |
| Time fixed effect | Yes | Yes | Yes | Yes | Yes | Yes | Yes | Yes |
| Individual fixed effect | Yes | Yes | Yes | Yes | Yes | Yes | Yes | Yes |
| Phase I F-statistic values | 0.199 | 11.32 | ||||||
| Wald’s test value | 0.97 | 126.43 *** | ||||||
| Constant term | 1.467 *** | 1.461 *** | 1.053 | 1.335 *** | 1.205 *** | 1.129 *** | 0.493 | 1.157 *** |
| (6.590) | (6.556) | (0.729) | (5.822) | (3.957) | (6.076) | (0.383) | (6.018) | |
| Observed value | 234 | 234 | 234 | 221 | 306 | 306 | 306 | 289 |
| (1) | (2) | (3) | (4) | |
|---|---|---|---|---|
| Competitive effects of grain imports | −0.006 * | 0.007 *** | 0.006 *** | |
| (−1.790) | (2.956) | (2.662) | ||
| grain production profit | −0.121 ** | −0.097 * | ||
| (−2.119) | (−1.688) | |||
| Technical environment | −0.031 ** | −0.005 | −0.001 | −0.004 |
| (−2.466) | (−0.444) | (−0.087) | (−0.349) | |
| Financial support for agriculture | −0.003 | 0.010 ** | 0.009 * | 0.008 * |
| (−0.647) | (2.134) | (1.959) | (1.878) | |
| Agricultural machinery | 0.000 | 0.005 * | 0.005 * | 0.005 * |
| (0.056) | (1.957) | (1.944) | (1.949) | |
| Specialization of crop cultivation | −0.294 *** | 0.051 | 0.073 | 0.058 |
| (−5.146) | (0.663) | (0.968) | (0.768) | |
| Environmental regulation | 0.032** | −0.004 | −0.003 | −0.001 |
| (2.285) | (−0.336) | (−0.276) | (−0.048) | |
| Urbanization level | −1.023 ** | −0.523 ** | −0.369 * | −0.445 * |
| (−2.297) | (−2.105) | (−1.673) | (−1.863) | |
| Percentage of village land | −0.031 ** | 0.001 | 0.005 | 0.004 |
| (−2.132) | (0.049) | (0.400) | (0.268) | |
| Industrial and economic structure | 0.024 | −0.225 | −0.187 | −0.184 |
| (0.226) | (−1.596) | (−1.316) | (−1.300) | |
| Time fixed effect | Yes | Yes | Yes | Yes |
| Individual fixed effect | Yes | Yes | Yes | Yes |
| Constant term | 0.788 *** | 1.410 *** | 1.260 *** | 1.316 *** |
| (3.397) | (7.947) | (7.687) | (7.563) | |
| Observed value | 540 | 540 | 540 | 540 |
Disclaimer/Publisher’s Note: The statements, opinions and data contained in all publications are solely those of the individual author(s) and contributor(s) and not of MDPI and/or the editor(s). MDPI and/or the editor(s) disclaim responsibility for any injury to people or property resulting from any ideas, methods, instructions or products referred to in the content. |
© 2023 by the authors. Licensee MDPI, Basel, Switzerland. This article is an open access article distributed under the terms and conditions of the Creative Commons Attribution (CC BY) license (https://creativecommons.org/licenses/by/4.0/).
Share and Cite
Ye, W.; Li, Z. Will the Grain Imports Competition Effect Reverse Land Green Efficiency of Grain Production? Analysis Based on Virtual Land Trade Perspective. Agriculture 2023, 13, 2220. https://doi.org/10.3390/agriculture13122220
Ye W, Li Z. Will the Grain Imports Competition Effect Reverse Land Green Efficiency of Grain Production? Analysis Based on Virtual Land Trade Perspective. Agriculture. 2023; 13(12):2220. https://doi.org/10.3390/agriculture13122220
Chicago/Turabian StyleYe, Weijiao, and Ziqiang Li. 2023. "Will the Grain Imports Competition Effect Reverse Land Green Efficiency of Grain Production? Analysis Based on Virtual Land Trade Perspective" Agriculture 13, no. 12: 2220. https://doi.org/10.3390/agriculture13122220
APA StyleYe, W., & Li, Z. (2023). Will the Grain Imports Competition Effect Reverse Land Green Efficiency of Grain Production? Analysis Based on Virtual Land Trade Perspective. Agriculture, 13(12), 2220. https://doi.org/10.3390/agriculture13122220