Multivariate Analysis of Clean Technologies in Agricultural and Livestock Companies in Castilla y León
Abstract
:1. Introduction
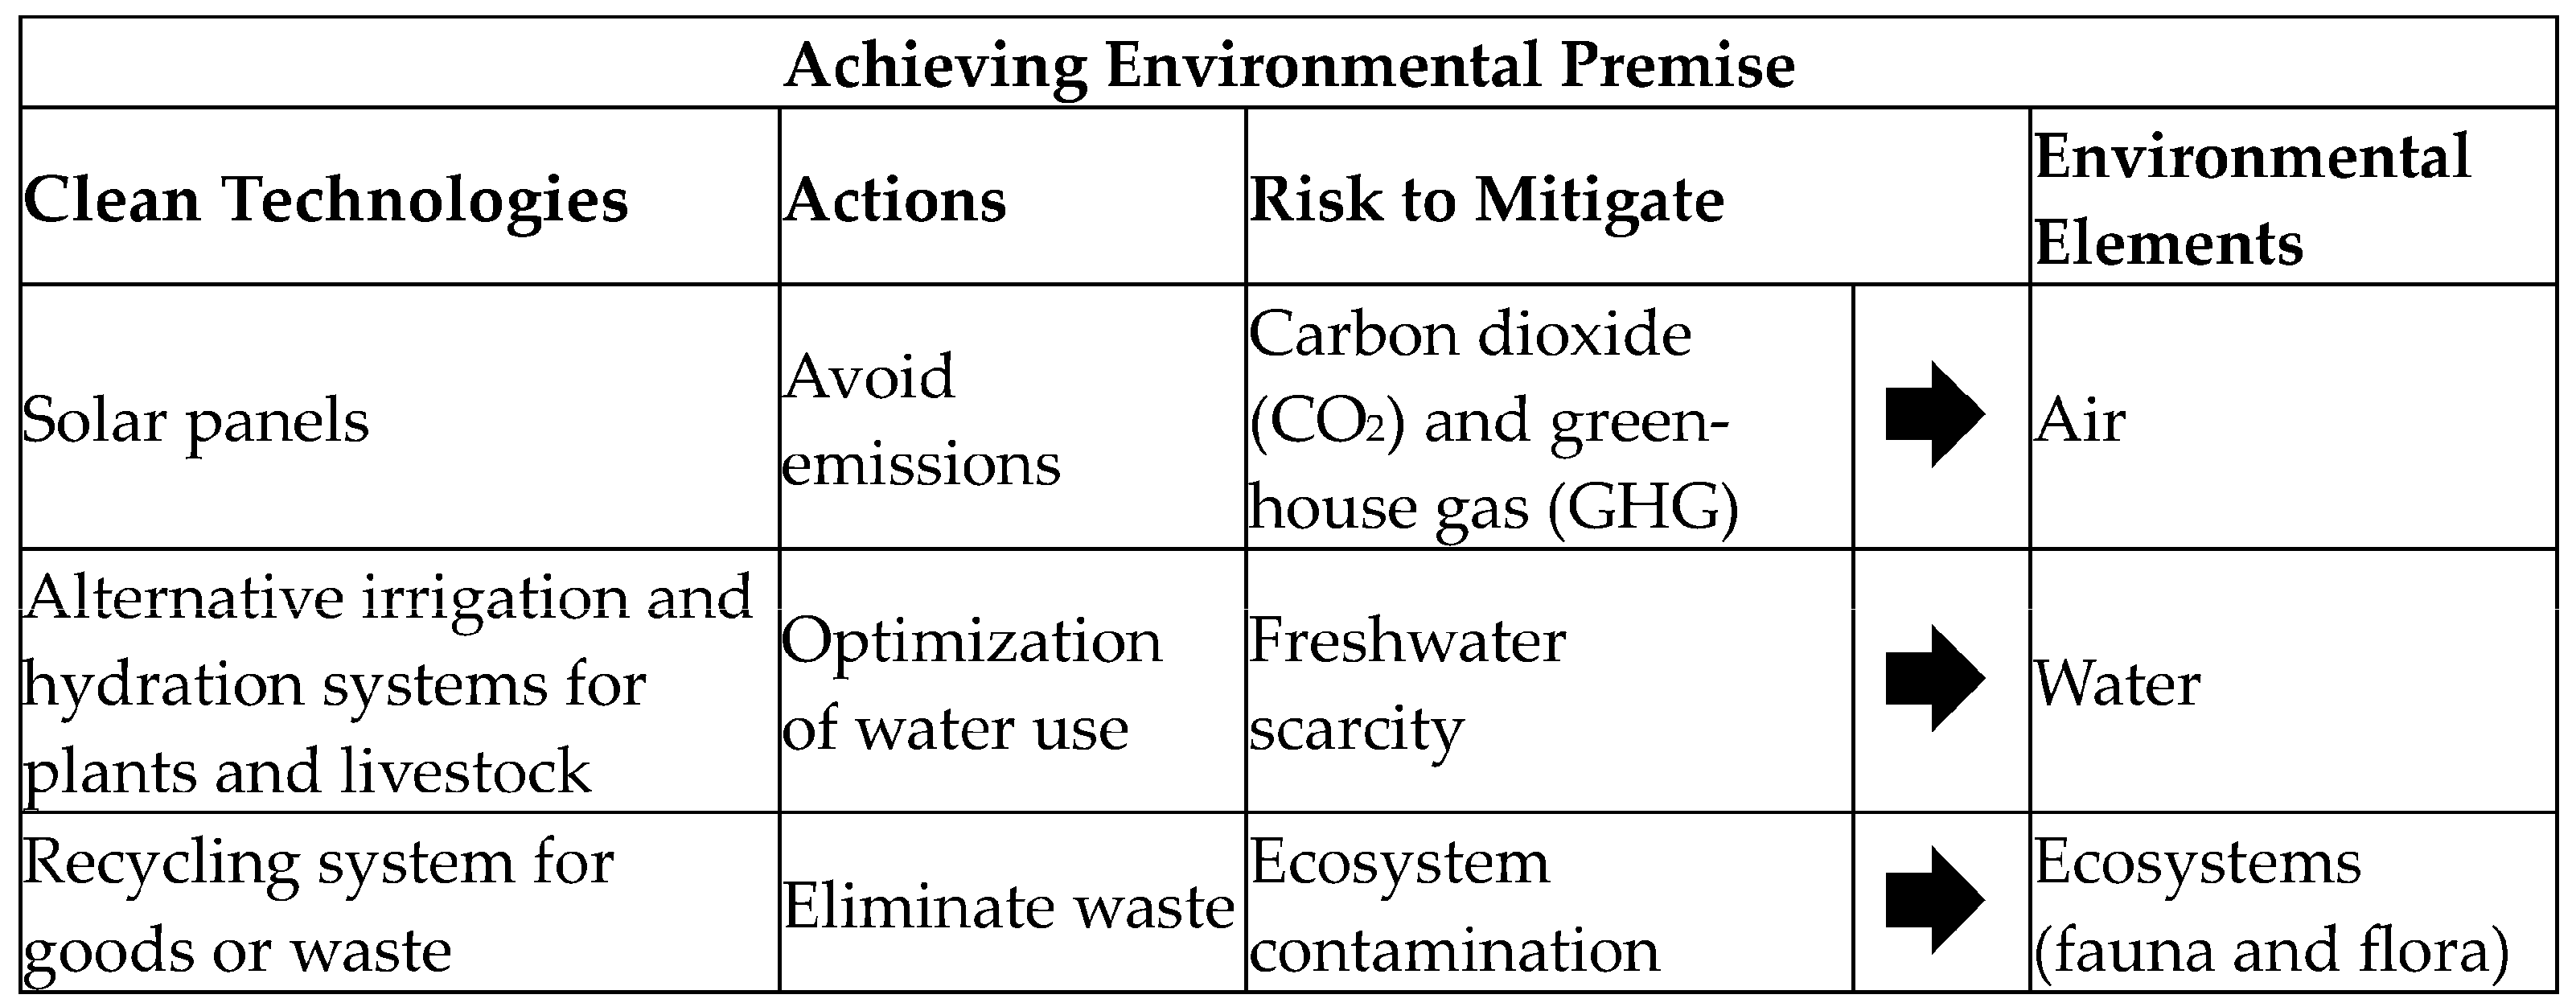
- RQ1. To infer the status of clean technologies used for the management of air, water and waste in the agricultural and livestock sectors, and the environmental commitment strategies;
- RQ2. To determine the relationship between the resources and capacities of agro-livestock companies and their investments in these clean technologies and environmental commitment strategies;
- RQ3. To analyze the relationship of the adoption of clean technologies and environmental commitment strategies with agro-livestock firms’ profitability.
2. Method
2.1. Population and Sample
2.2. Variables of Interest
2.2.1. Environmental Variables (RQ1)
2.2.2. Financial Variables (RQ2 and RQ3)
2.3. Multivariate Analysis Methodology
2.3.1. HJ-Biplot
2.3.2. External Logistic Biplot
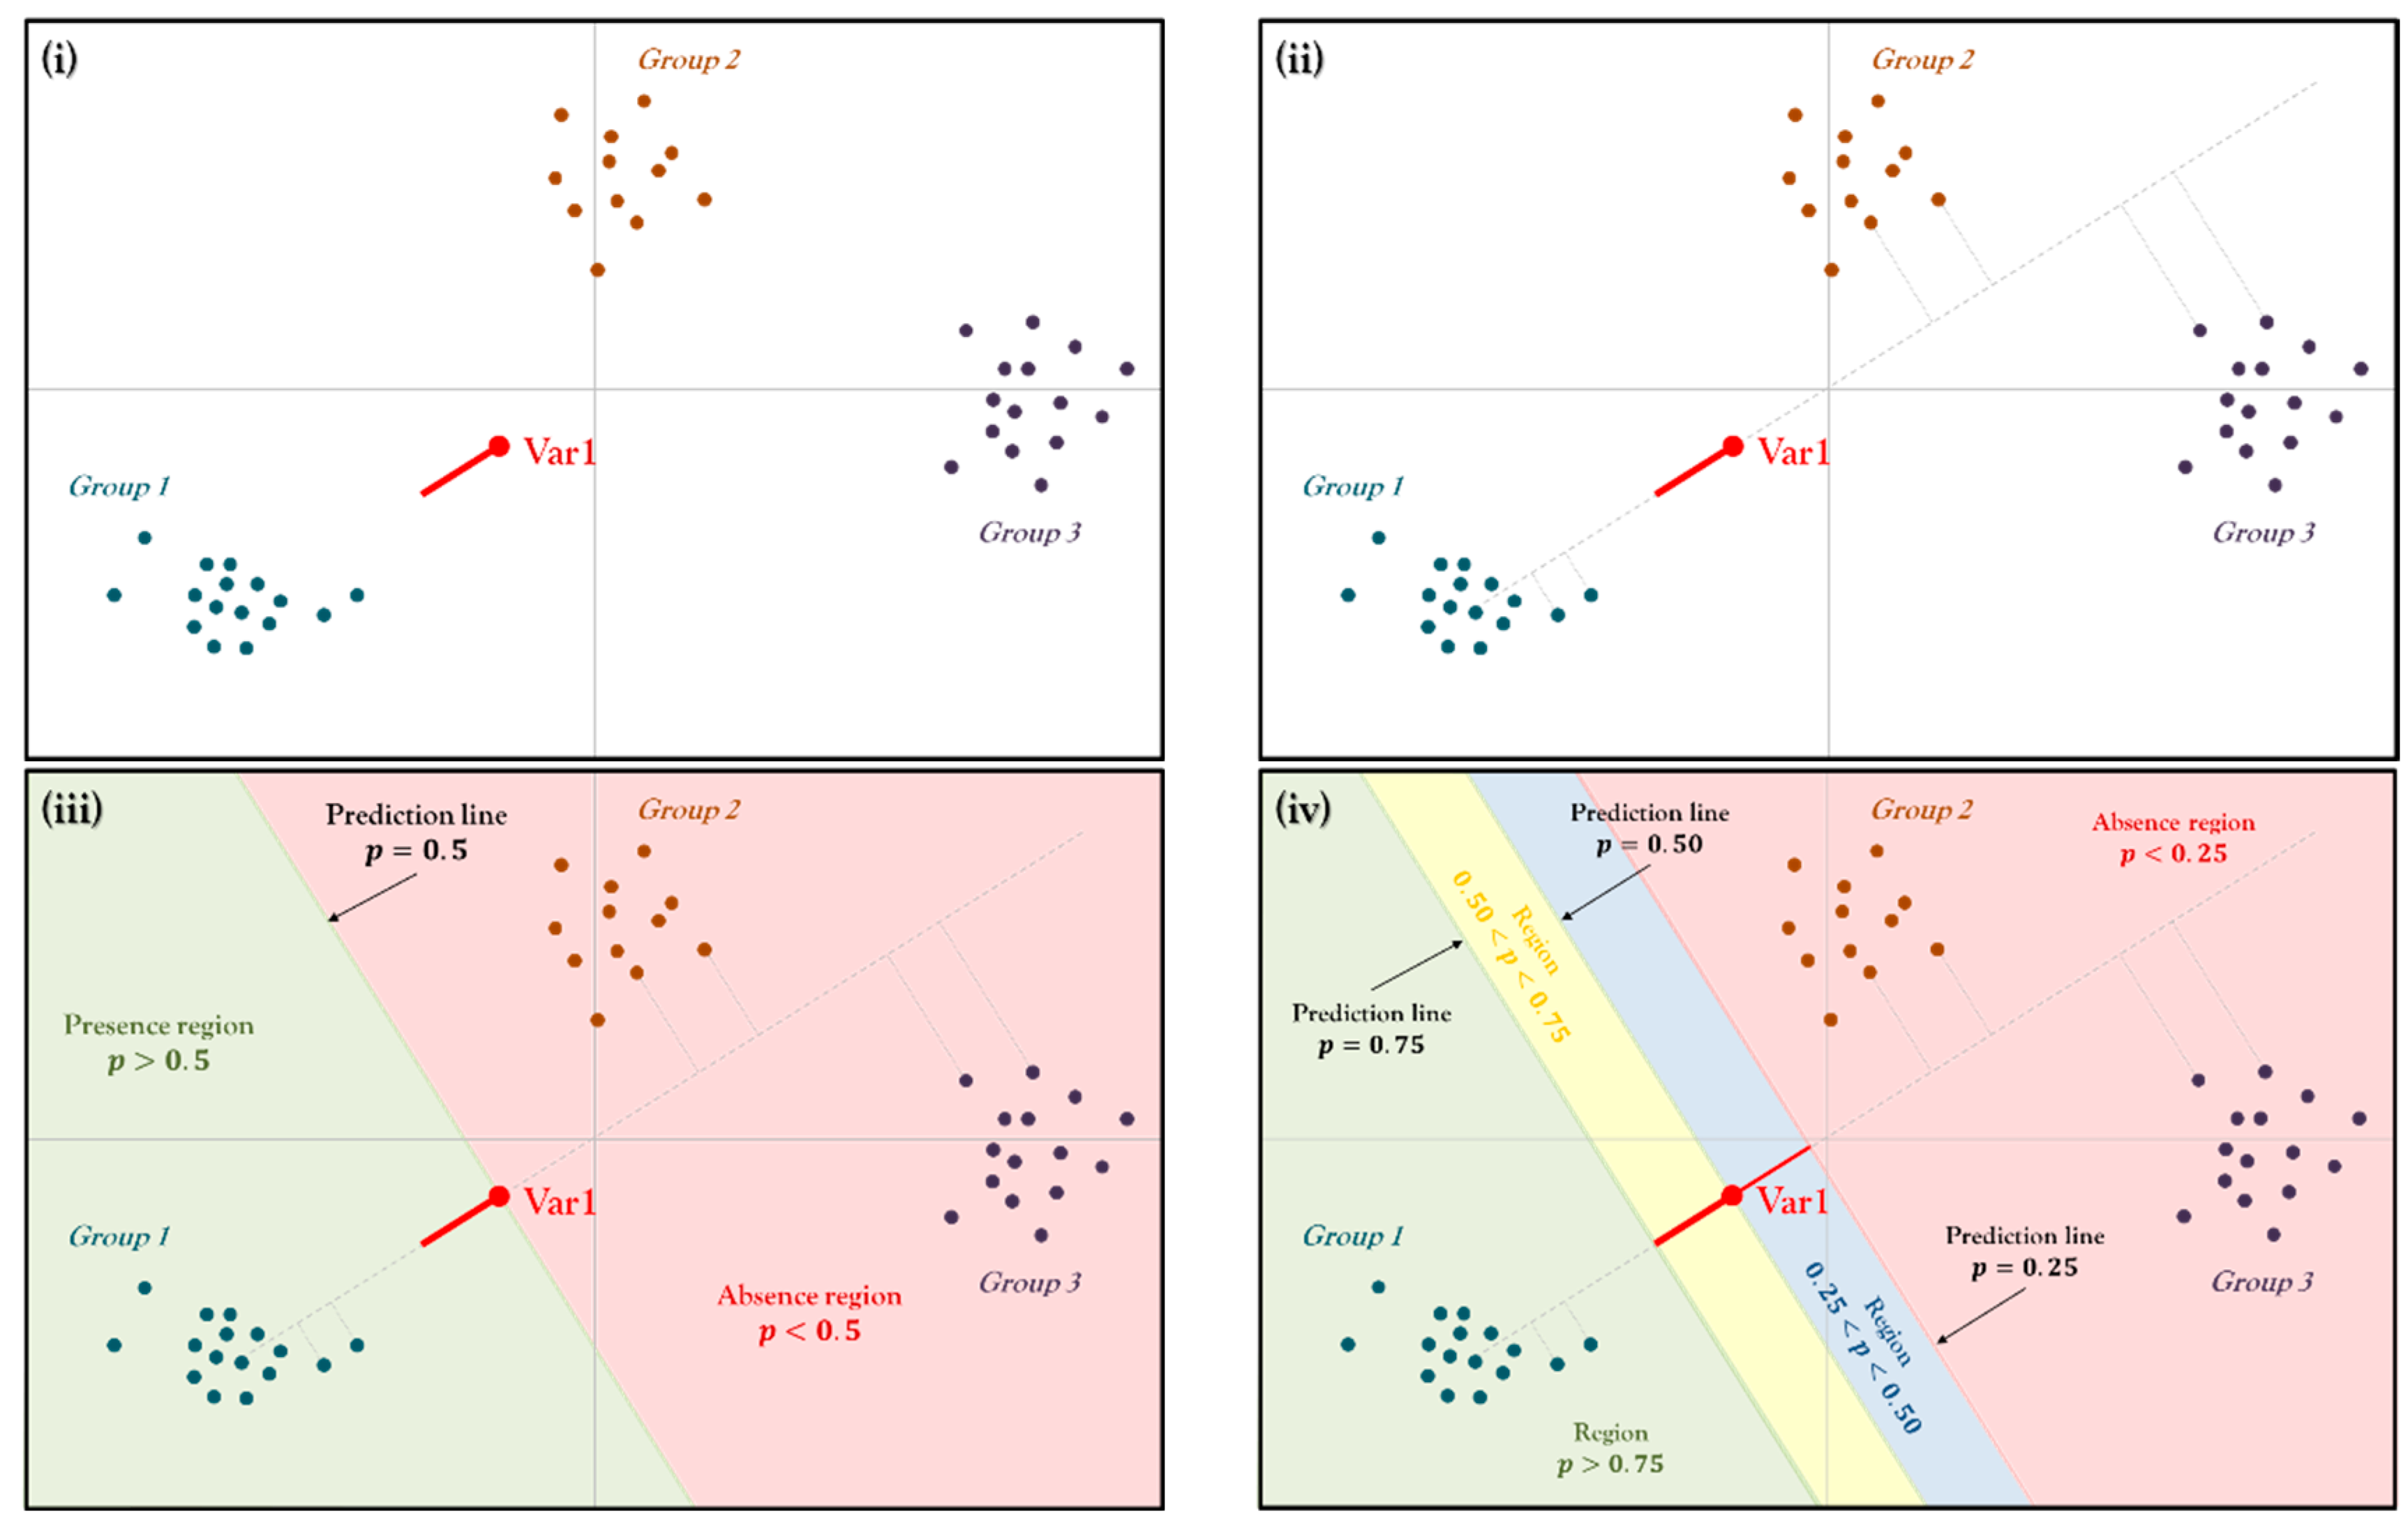
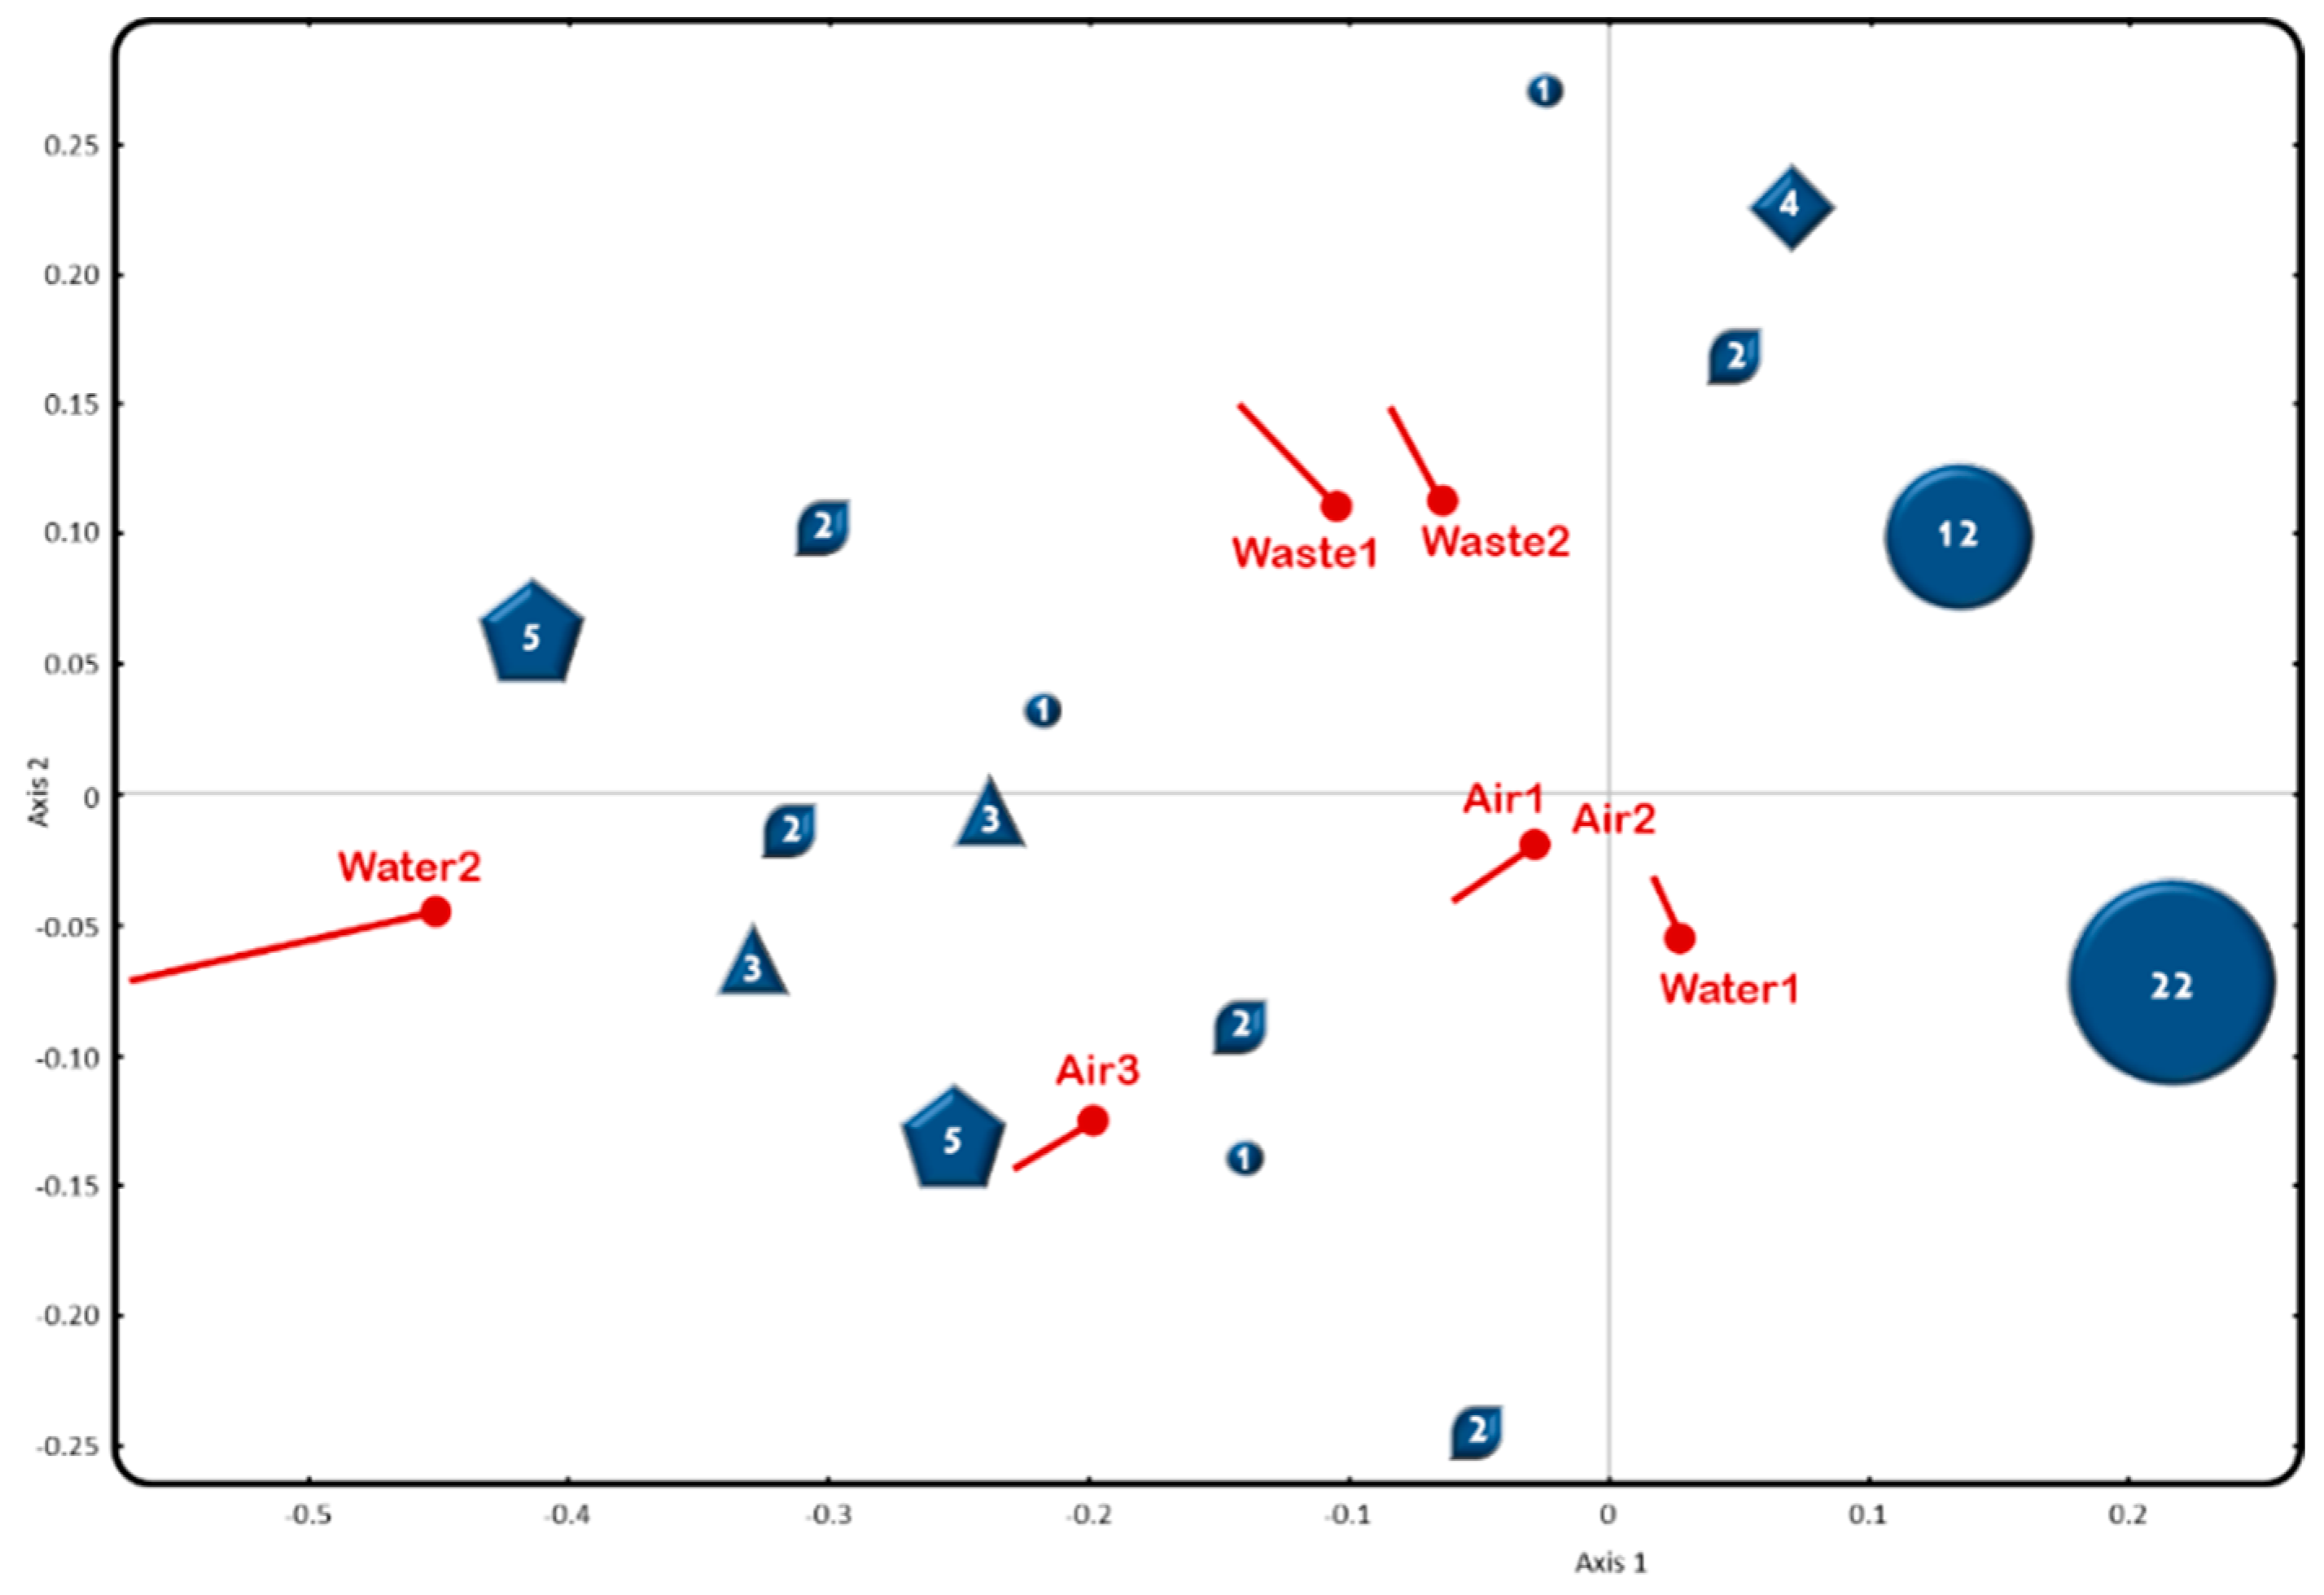
 ), and the direction of the variable should be understood as a continuous series that covers the probability scale; however, to simplify the graphical representation, only the points that predict 0.5, at the origin of the segment, and 0.75, at the end, are taken as representative of the segment (Figure 5i). This is how, if the variable is projected in the direction of the vector, the line will cover probabilities greater than 0.75, and in the opposite direction to the vector, the line will cover probabilities less than 0.5. Furthermore, the length of the vectors refers to their discriminating power; short vectors are useful for more effectively differentiating companies, with better fit and quality of representation, and, on the contrary, long vectors are less useful for discriminating and yield a lower quality of representation.
3. Descriptive Results of the Environmental Commitment of Agricultural and Livestock Companies in Castilla y León
3.1. Panoramic View of Clean Technologies Adoption (RQ1)
3.2. Panoramic View of Firms’ Clean Technologies Adoption according to Resources and Capabilities (RQ2) and the Economic Benefits (RQ3)
4. Cluster Results: Environmental Strategies of Agricultural and Livestock Companies in Castilla y León
4.1. Cluster Analysis by Environmental Elements and Their Relationship with the Business’ Economic–Financial Situation
4.2. Cluster Analysis by Specific Environmental Commitments and Their Relationship with the Economic–Financial Situation
- ➢
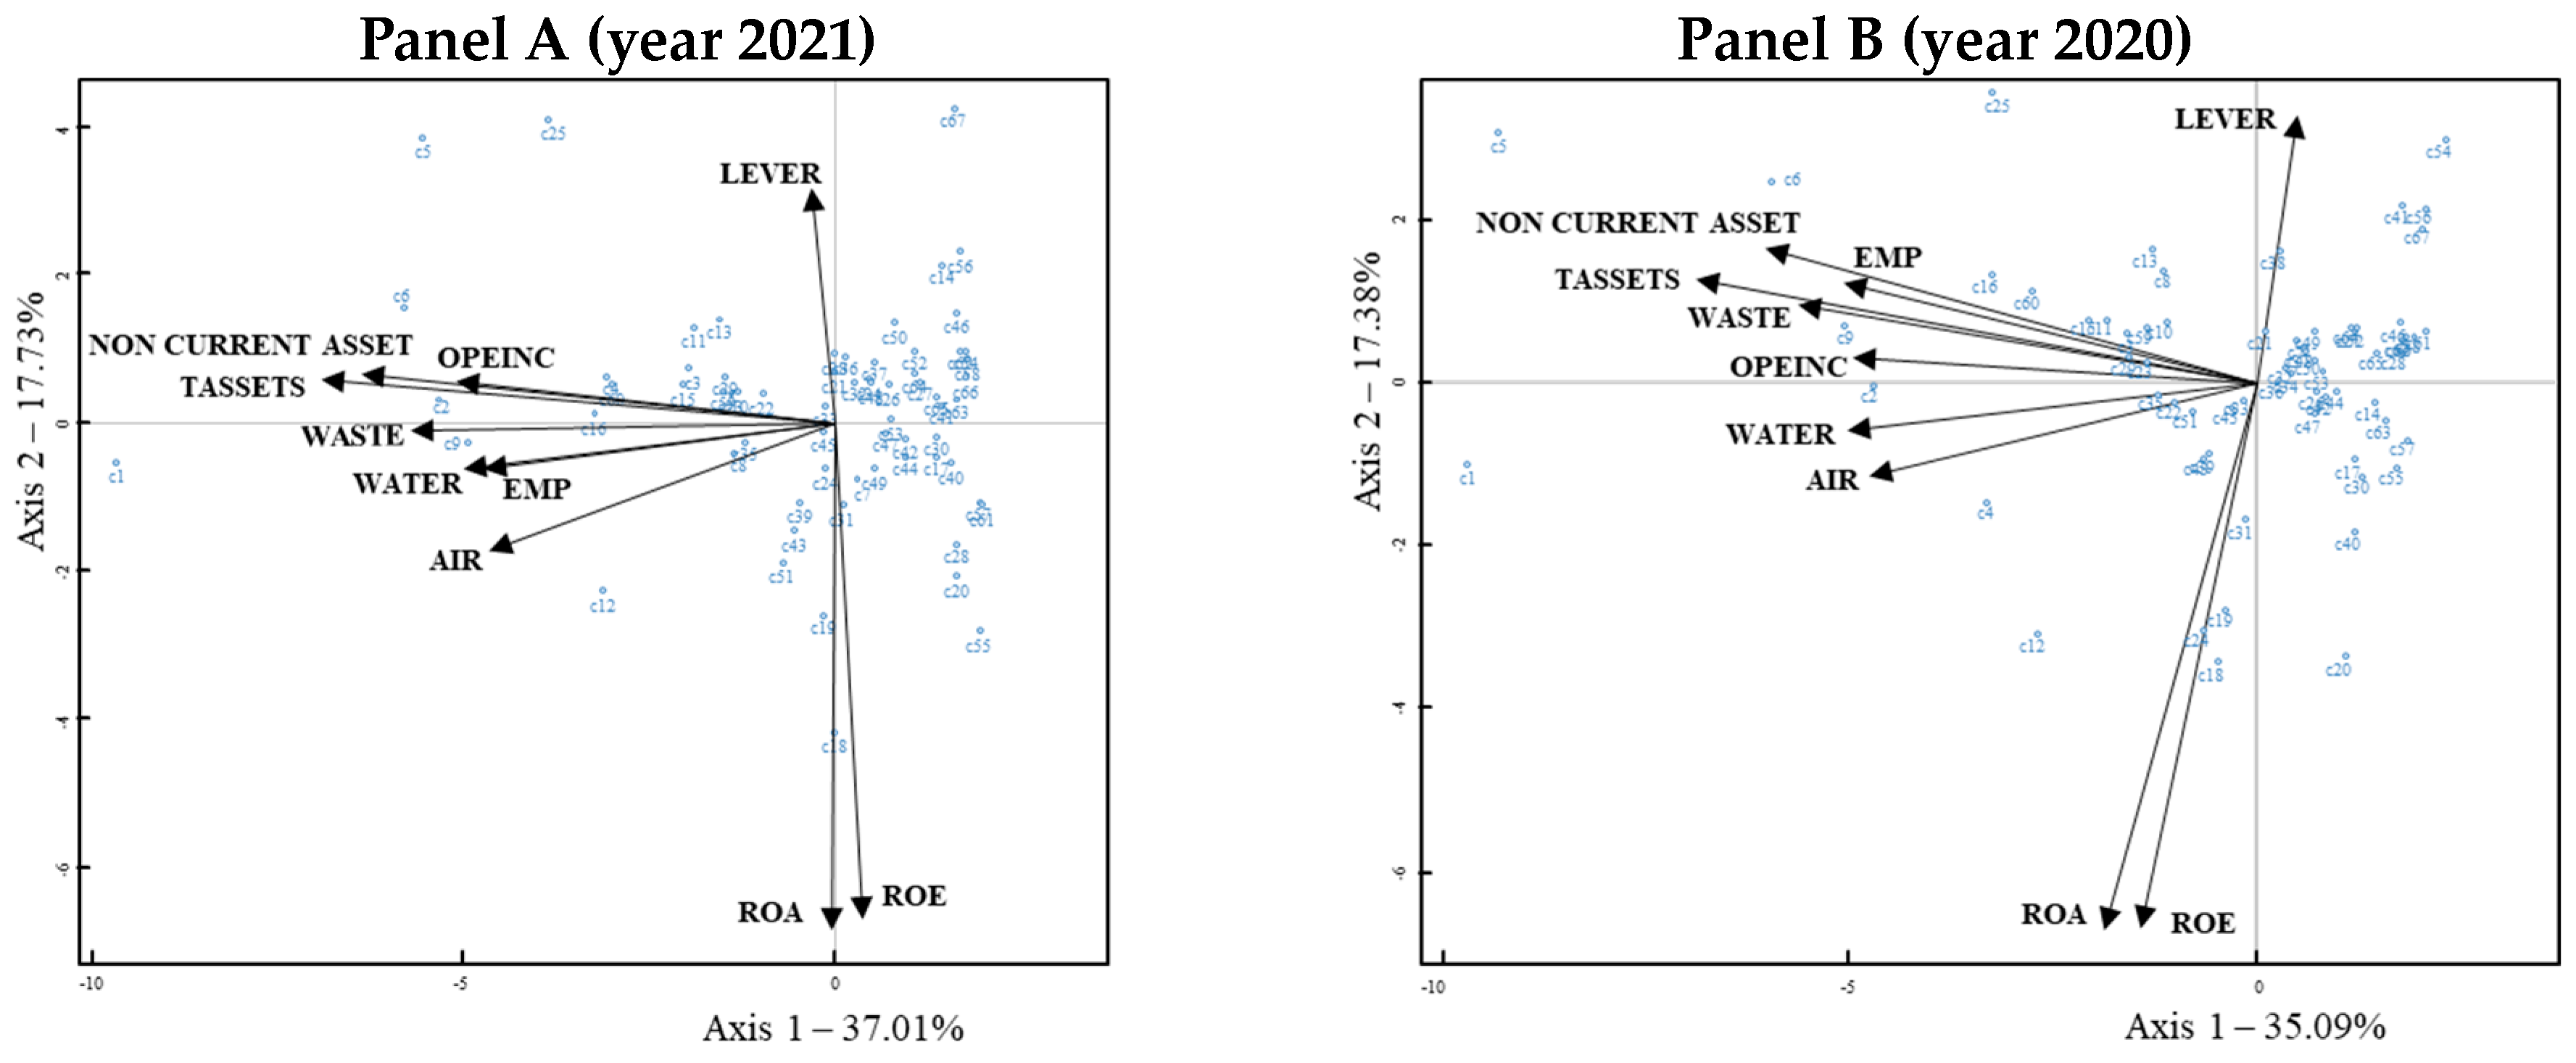
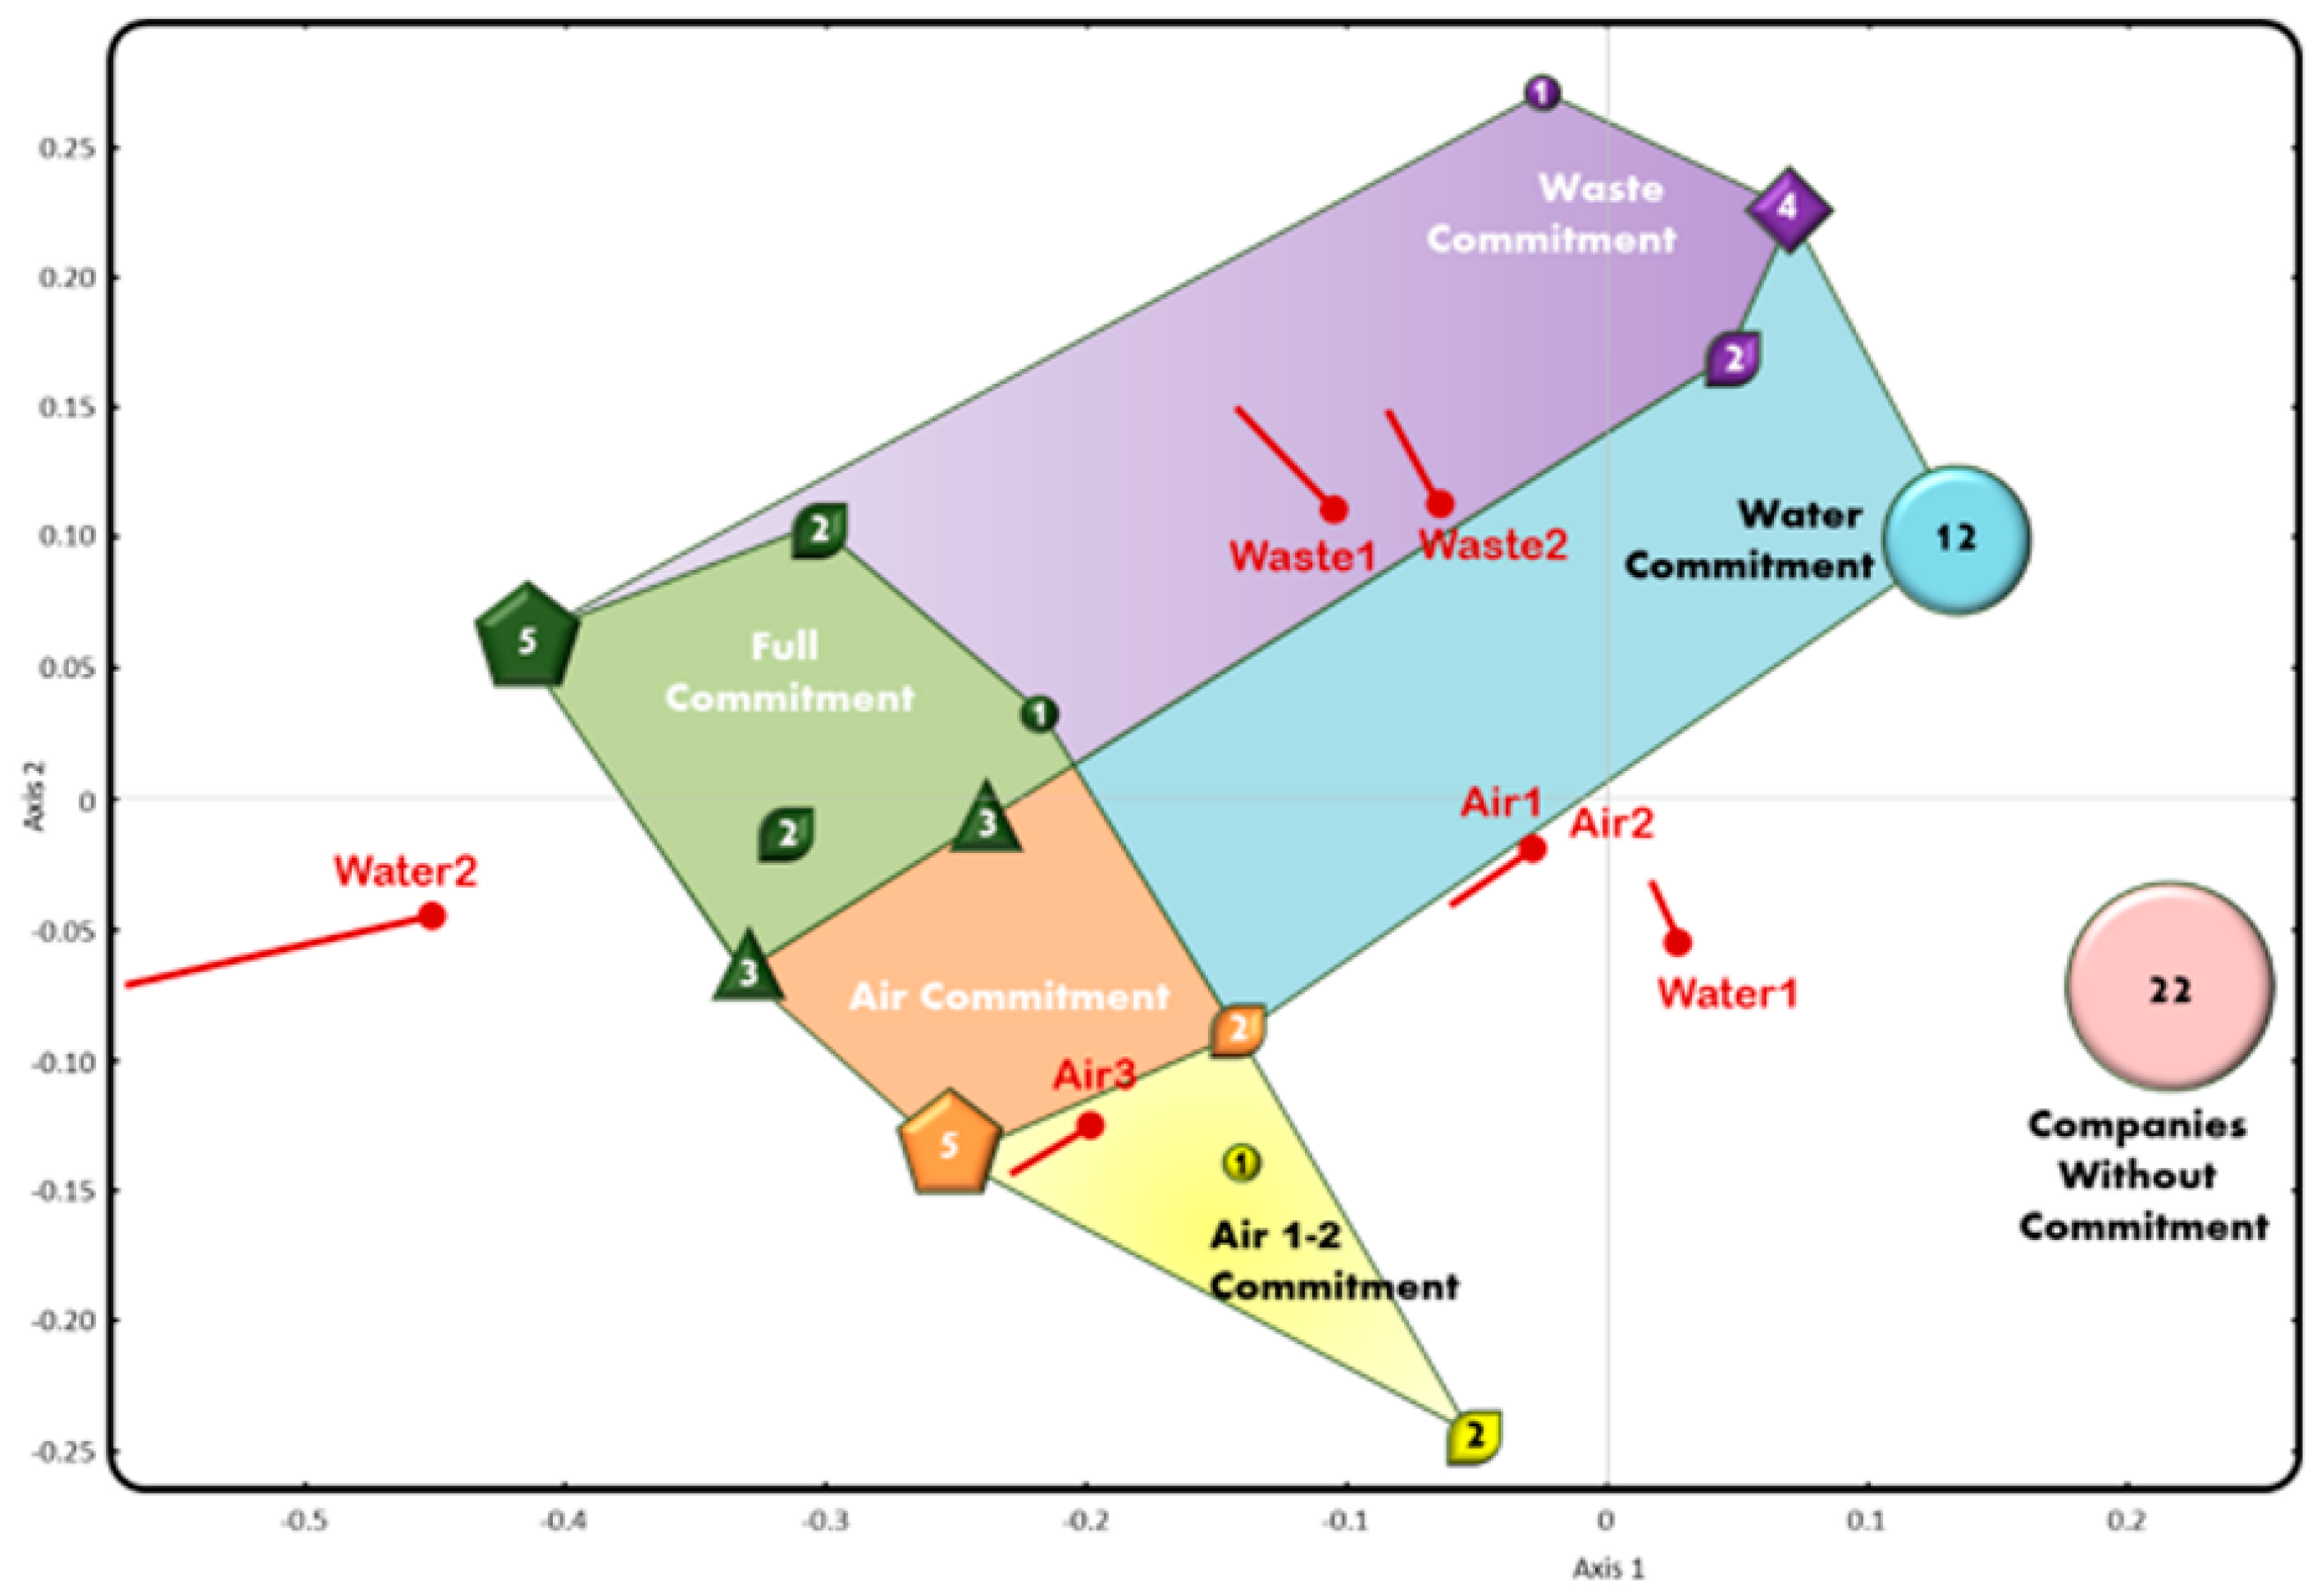
- Full commitment. This cluster is made up of 16 of the 67 companies, which show commitment to all the environmental measures analyzed. These must be considered as the leading Castilian-Leonese companies in mitigating the adverse effects on air, water and ecosystems. As can be seen in Figure 13, they also show values well above the rest of the companies in terms of resources and capabilities represented by total assets, non-current assets and quantity of employees. These firms also obtain higher operating incomes;
- ➢
- Air commitment. This cluster is made up of seven companies that show a significant commitment to everything related to air management and investment in technologies to avoid polluting emissions. In addition, they are characterized by an availability of resources and capacity well above the rest of the companies, with the exception of those belonging to the previous cluster;
- ➢
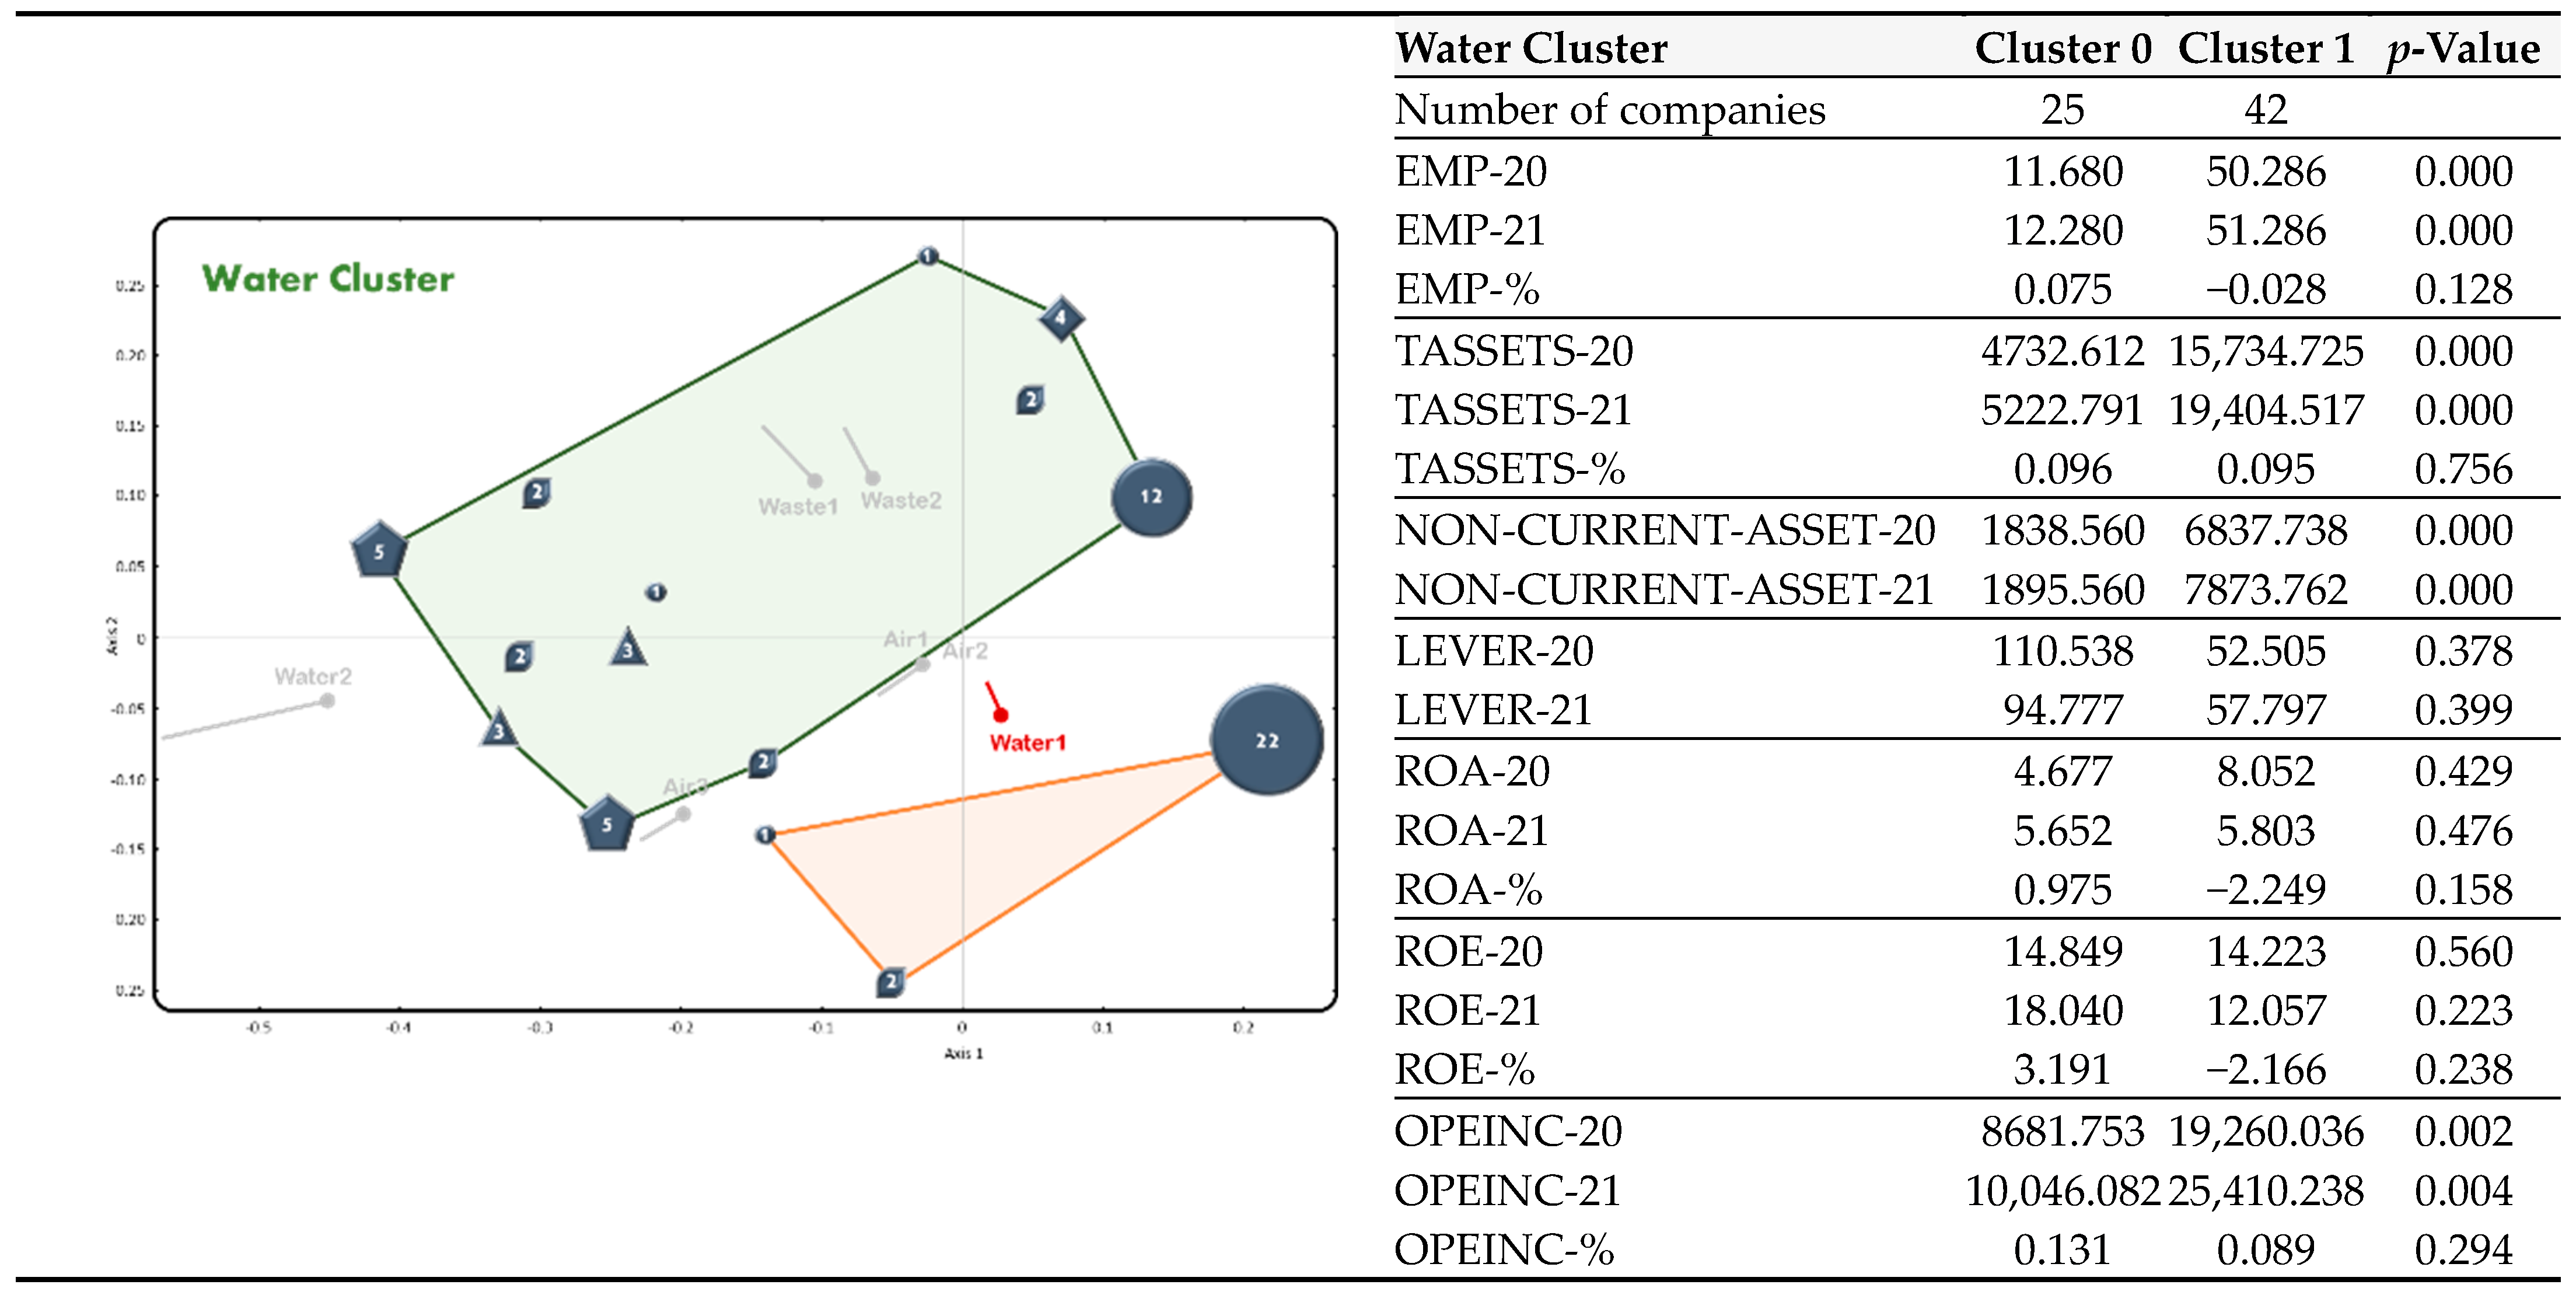
- Water commitment. This cluster is made up of 12 companies, whose commitment is focused on investing in technologies to optimize water management. Regarding their economic–financial condition, they show similar financial values to companies concerned with air management, although the ROE is lower as they are more prone to self-financing and have very low leverage;
- ➢
- Waste commitment. The cluster is made up of seven companies that are particularly concerned with waste and water management. The values of the financial magnitudes considered here are similar to those of the previous cluster. They are also characterized by presenting the lowest economic returns and the lowest leverage;
- ➢
- Air commitment (only Air1 and Air2). This is made up of only three companies that priorities air management. From the economic–financial point of view, they show values well below those of the previous clusters. On the contrary, they present high ROA and ROE values, and are the most leveraged companies in the study;
- ➢
- Companies without commitment. Finally, 22 of the 67 companies in the study do not report on their website any type of commitment to the variables studied. These companies show the lowest values in the magnitudes related to size and investment in tangible and intangible resources. Further, their economic and financial returns are high and they have great leverage.
5. Analysis of Environmental Commitments by Sub-Activity and Their Relationship with the Economic–Financial Situation of the Company
6. Discussion of the Results
7. Conclusions
Limitations and Future Research
Author Contributions
Funding
Institutional Review Board Statement
Data Availability Statement
Conflicts of Interest
References
- Bibi, F.; Rahman, A. An Overview of Climate Change Impacts on Agriculture and Their Mitigation Strategies. Agriculture 2023, 13, 1508. [Google Scholar] [CrossRef]
- Gabriel, A.; Gandorfer, M. Adoption of digital technologies in agriculture—An inventory in a european small-scale farming region. Precis. Agric. 2022, 24, 68–91. [Google Scholar] [CrossRef]
- Ridzuan, N.H.A.M.; Marwan, N.F.; Khalid, N.; Ali, M.H.; Tseng, M.-L. Effects of agriculture, renewable energy, and economic growth on carbon dioxide emissions: Evidence of the environmental Kuznets curve. Resour. Conserv. Recycl. 2020, 160, 104879. [Google Scholar] [CrossRef]
- Passarelli, M.; Bongiorno, G.; Cucino, V.; Cariola, A. Adopting new technologies during the crisis: An empirical analysis of agricultural sector. Technol. Forecast. Soc. Chang. 2023, 186, 122106. [Google Scholar] [CrossRef]
- Scharfy, D.; Boccali, N.; Stucki, M. Clean Technologies in Agriculture—How to Prioritise Measures? Sustainability 2017, 9, 1303. [Google Scholar] [CrossRef]
- Malhi, G.S.; Kaur, M.; Kaushik, P. Impact of Climate Change on Agriculture and Its Mitigation Strategies: A Review. Sustainability 2021, 13, 1318. [Google Scholar] [CrossRef]
- Mariantonietta, F.; Alessia, S.; Francesco, C.; Giustina, P. GHG and cattle farming: CO-assessing the emissions and economic performances in Italy. J. Clean. Prod. 2018, 172, 3704–3712. [Google Scholar] [CrossRef]
- Coderoni, S.; Vanino, S. The farm-by-farm relationship among carbon productivity and economic performance of agriculture. Sci. Total. Environ. 2022, 819, 153103. [Google Scholar] [CrossRef]
- Mielcarek-Bocheńska, P.; Rzeźnik, W. Greenhouse Gas Emissions from Agriculture in EU Countries—State and Perspectives. Atmosphere 2021, 12, 1396. [Google Scholar] [CrossRef]
- Velasco-Muñoz, J.F.; Mendoza, J.M.F.; Aznar-Sánchez, J.A.; Gallego-Schmid, A. Circular economy implementation in the agricultural sector: Definition, strategies and indicators. Resour. Conserv. Recycl. 2021, 170, 105618. [Google Scholar] [CrossRef]
- Bwambale, E.; Abagale, F.K.; Anornu, G.K. Smart irrigation monitoring and control strategies for improving water use efficiency in precision agriculture: A review. Agric. Water Manag. 2021, 260, 107324. [Google Scholar] [CrossRef]
- Singh, A. A review of wastewater irrigation: Environmental implications. Resour. Conserv. Recycl. 2021, 168, 105454. [Google Scholar] [CrossRef]
- Haaker, T.; Ly, P.T.M.; Nguyen-Thanh, N.; Nguyen, H.T.H. Business model innovation through the application of the Internet-of-Things: A comparative analysis. J. Bus. Res. 2021, 126, 126–136. [Google Scholar] [CrossRef]
- Chiarelotto, M.; Restrepo, J.C.P.S.; Lorin, H.E.F.; Damaceno, F.M. Composting organic waste from the broiler production chain: A perspective for the circular economy. J. Clean. Prod. 2021, 329, 129717. [Google Scholar] [CrossRef]
- Casson Moreno, V.; Iervolino, G.; Tugnoli, A.; Cozzani, V. Techno-economic and environmental sustainability of biomass waste conversion based on thermocatalytic reforming. Waste Manag. 2020, 101, 106–115. [Google Scholar] [CrossRef] [PubMed]
- Kircher, M.; Aranda, E.; Athanasios, P.; Radojcic-Rednovnikov, I.; Romantschuk, M.; Ryberg, M.; Schock, G.; Shilev, S.; Stanescu, M.D.; Stankeviciute, J.; et al. Treatment and valorization of bio-waste in the EU. EFB Bioeconomy J. 2023, 3, 100051. [Google Scholar] [CrossRef]
- Kumar, C.M.S.; Singh, S.; Gupta, M.K.; Nimdeo, Y.M.; Raushan, R.; Deorankar, A.V.; Kumar, T.A.; Rout, P.K.; Chanotiya, C.; Pakhale, V.D.; et al. Solar energy: A promising renewable source for meeting energy demand in Indian agriculture applications. Sustain. Energy Technol. Assess. 2023, 55, 102905. [Google Scholar] [CrossRef]
- Sarangi, P.K.; Subudhi, S.; Bhatia, L.; Saha, K.; Mudgil, D.; Shadangi, K.P.; Srivastava, R.K.; Pattnaik, B.; Arya, R.K. Utilization of agricultural waste biomass and recycling toward circular bioeconomy. Environ. Sci. Pollut. Res. 2022, 30, 8526–8539. [Google Scholar] [CrossRef]
- Molina-Maturano, J.; Speelman, S.; De Steur, H. Constraint-based innovations in agriculture and sustainable development: A scoping review. J. Clean. Prod. 2019, 246, 119001. [Google Scholar] [CrossRef]
- Peteraf, M.A. The cornerstones of competitive advantage: A resource-based view. Strat. Manag. J. 1993, 14, 179–191. [Google Scholar] [CrossRef]
- Aibar-Guzmán, B.; Aibar-Guzmán, C.; Piñeiro-Chousa, J.-R.; Hussain, N.; García-Sánchez, I.-M. The benefits of climate tech: Do institutional investors affect these impacts? Technol. Forecast. Soc. Chang. 2023, 192, 122536. [Google Scholar] [CrossRef]
- García-Sánchez, I. The moderating role of board monitoring power in the relationship between environmental conditions and corporate social responsibility. Bus. Ethic. A Eur. Rev. 2019, 29, 114–129. [Google Scholar] [CrossRef]
- García-Sánchez, I.; Gallego-Álvarez, I.; Zafra-Gómez, J. Do independent, female and specialist directors promote eco-innovation and eco-design in agri-food firms? Bus. Strat. Environ. 2020, 30, 1136–1152. [Google Scholar] [CrossRef]
- Instituto Tecnológico Agrario de la Junta de Catilla y Leòn. Plataforma de Dinamización de la Investigación e Inno-Vación Agraria y Agroalimentaria 2021–2027. 2023. Available online: https://www.itacyl.es/documents/20143/342632/Plataforma+Dinamizaci%C3%B3n_v7_Media.pdf/fc553131-1ec2-9611-3e05-e22ae5774c51?t=1625641022319 (accessed on 21 October 2023).
- Hsieh, H.-F.; Shannon, S.E. Three Approaches to Qualitative Content Analysis. Qual. Health Res. 2005, 15, 1277–1288. [Google Scholar] [CrossRef] [PubMed]
- García-Sánchez, I.-M. Debt vs. self-financing innovation projects: An exploratory study of Spanish agri-food SMEs. Span. J. Agric. Res. 2021, 19, e0104. [Google Scholar] [CrossRef]
- Gabriel, K.R. The biplot-graphic display of matrices with application to principal component analysis. Biometrika 1971, 58, 453–467. [Google Scholar] [CrossRef]
- Galindo, M.P.; Cuadras, C. Una Extensión del Método Biplot y su Relación con Otras Técnicas; Publicaciones de Bioestadística y Biomatemática, 17; Universidad de Barcelona: Barcelona, Spain, 1986. [Google Scholar]
- Greenacre, M.J. Biplots in Practice; Fundacion BBVA: Bilbao, Spain, 2010. [Google Scholar]
- Greenacre, M.J. Biplots: El placer de la descomposición de valores singulares. Revis. Interdiscip. Wiley Estadística Comput. 2012, 4, 399–406. [Google Scholar] [CrossRef]
- Gower, J.C.; Hand, D.J. Biplots; CRC Press: Boca Raton, FL, USA, 1995. [Google Scholar]
- Vicente-Villardón, J.L.; Galindo-Villardón, M.P.; Blázquez-Zaballos, A. Logistic biplots. In Multiple Correspondence Analysis and Related Methods; Chapman & Hall: London, UK, 2006; pp. 503–521. [Google Scholar]
- Demey, J.R.; Vicente-Villardón, J.L.; Galindo-Villardón, M.P.; Zambrano, A.Y. Identifying molecular markers associated with classification of genotypes by External Logistic Biplots. Bioinformatics 2008, 24, 2832–2838. [Google Scholar] [CrossRef]
- Gower, J.C. Some distance properties of latent root and vector methods used in multivariate analysis. Biometrika 1966, 53, 325–338. [Google Scholar] [CrossRef]
- Long, J.S. Regression models for categorical and limited dependent variables. Adv. Quant. Tech. Soc. Sci. 1997, 7, 80–81. [Google Scholar]
- Tenenhaus, M.; Young, F.W. An analysis and synthesis of multiple correspondence analysis, optimal scaling, dual scaling, homogeneity analysis and other methods for quantifying categorical multivariate data. Psychometrika 1985, 50, 91–119. [Google Scholar] [CrossRef]
- Vicente-Villardón, J.L. Multbiplot: A Package for Multivariate Analysis Using Biplots. Computer Software. Departa-Mento de Estadística. Universidad de Salamanca. Extraído de 2010. Available online: http://biplot.usal.es/multbiplot (accessed on 1 October 2023).
- Galindo, M.P. An alternative for simultaneous representation: HJ-Biplot. Questiió Quad. D’estadística Sist. Inform. I Investig. Oper. 1986, 10, 12–23. [Google Scholar]




| Item | Variable | Description | Name |
|---|---|---|---|
| Clean technologies (RQ1) | Investments in clean technologies | Dummy variables that represent the acquisition of machinery that reduces carbon dioxide (CO2) emissions and/or greenhouse gas (GHG) emissions and is used in production processes. Also, it refers to the purchase of photovoltaic plants that allow for replacing non-renewable energy sources. | Air1 |
| Carbon dioxide (CO2) and greenhouse gas (GHG) emissions control system | Dummy variables that represent the implementation of a system that facilitates the permanent monitoring of CO2 and GHG emissions in production processes (agricultural and livestock). | Air2 | |
| Energy efficiency | Dummy variables that represent the minimization of the consumption of non-renewable or polluting energy. | Air3 | |
| Investment in clean technologies for water management | Dummy variables that represent the acquisition of machinery, irrigation systems for crops or water supply systems for animals that guarantee the efficient use of water resources. | Water1 | |
| Verification system in water management | Dummy variables that represent the implementation of a system that facilitates the control of water consumed in agricultural or livestock activities, either per planted hectare or per animal. | Water2 | |
| Waste reuse processes | Dummy variables that represent the implementation and development of activities that allow the conversion of waste of vegetable origin into fertilizers for plants or food for animals. | Waste1 | |
| Processes for recycling materials, containers and/or packaging | Dummy variables that represent the implementation and development of activities for the reuse of cardboard, paper, glass, plastic and all kinds of containers and packaging. | Waste2 | |
| Financial information | Resources and capabilities (RQ2) | ||
| Employees | Numerical variable that represents labor resources measured by the quantity of employees. | EMP | |
| Total active | Numerical variables that identify the economic resources controlled by the firm as a result of past events and from which economic benefits are expected to be obtained. | TASSETS | |
| Non-current assets | Numerical variables that identify the economic resources controlled by the company, which are expected to be maintained for more than one year. For example, trademarks, constructions and buildings, machinery and equipment. | NON-CURRENT-ASSET | |
| Leverage | Numerical variable that identifies the leverage positions of the firms by the proportion of debt compared to its own resources. | LEVERAGE | |
| Economic benefits (RQ3) | |||
| Economic profitability | Numerical variable of profitability measured by the ratio that relates net profit and total assets. | ROA | |
| Financial profit | Numerical variable of profitability measured by the ratio that relates the company’s net profit and its own funds. | ROE | |
| Operating income | Numerical variable of other economic benefits measured by the amount obtained by the company as a result of developing its corporate purpose. | OPEINC | |
| Variable | Deviance | p-Value | R2 | % Correct |
|---|---|---|---|---|
| Air1 | 91.442 | 0.000… | 0.996 | 100% |
| Air2 | 91.442 | 0.000… | 0.996 | 100% |
| Air3 | 207.534 | 0.000… | 0.994 | 100% |
| Water1 | 136.687 | 0.000… | 0.992 | 100% |
| Water2 | 9.245 | 0.002… | 0.389 | 95.52% |
| Waste1 | 80.223 | 0.000… | 0.873 | 89.55% |
| Waste2 | 88.154 | 0.000… | 0.896 | 94.03% |
| Cluster Analysis | Full Commitment | Air Commitment | Water Commitment | Waste Commitment | Air Commitment (only Air1 and Air2) | Companies without Commitment |
|---|---|---|---|---|---|---|
| (Companies) | (16) | (7) | (12) | (7) | (3) | (22) |
| Air1 | 100% | 100% | 0% | 0% | 100% | 0% |
| Air2 | 100% | 100% | 0% | 0% | 100% | 0% |
| Air3 | 63% | 71% | 0% | 0% | 0% | 0% |
| Water1 | 100% | 100% | 100% | 100% | 0% | 0% |
| Water2 | 13% | 0% | 0% | 0% | 33% | 0% |
| Waste1 | 81% | 0% | 0% | 43% | 0% | 0% |
| Waste2 | 63% | 0% | 0% | 71% | 33% | 0% |
| EMP-20 | 80.563 | 34.571 | 31.333 | 29.286 | 15.333 | 11.182 |
| EMP-21 | 84.063 | 37.143 | 29.417 | 28.000 | 17.667 | 11.545 |
| EMP-% | −0.038 | 0.012 | −0.035 | −0.029 | 0.096 | 0.073 |
| TASSETS-20 | 22,472.485 | 12,076.743 | 13,208.395 | 8322.964 | 5211.141 | 4667.358 |
| TASSETS-21 | 30,785.235 | 12,425.451 | 14,382.345 | 8979.949 | 4995.842 | 5253.738 |
| TASSETS-% | 0.123 | 0.128 | 0.065 | 0.050 | 0.004 | 0.109 |
| NON-CURRENT-ASSET-20 | 7839.688 | 7966.000 | 6407.083 | 4157.571 | 4399.000 | 1489.409 |
| NON-CURRENT-ASSET-21 | 9887.750 | 8238.571 | 7041.250 | 4332.714 | 4270.667 | 1571.682 |
| LEVER-20 | 60.446 | 89.214 | 55.668 | −7.776 | 157.570 | 104.125 |
| LEVER-21 | 57.607 | 109.297 | 52.899 | 15.129 | 124.453 | 90.730 |
| ROA-20 | 10.399 | 9.330 | 6.404 | 4.235 | 5.122 | 4.616 |
| ROA-21 | 7.659 | 6.094 | 5.946 | 1.026 | 5.288 | 5.701 |
| ROA-% | −2.740 | −3.235 | −0.458 | −3.210 | 0.166 | 1.085 |
| ROE-20 | 22.546 | 26.648 | −3.334 | 12.874 | 17.618 | 14.472 |
| ROE-21 | 16.131 | 15.452 | 3.565 | 13.906 | 14.476 | 18.526 |
| ROE-% | −6.414 | −11.196 | 6.900 | 1.031 | −3.141 | 4.054 |
| OPEINC-20 | 35,224.198 | 13,870.619 | 7914.619 | 7609.229 | 3348.795 | 9408.975 |
| OPEINC-21 | 50,518.046 | 14,767.875 | 8658.481 | 7380.621 | 3650.802 | 10,918.166 |
| OPEINC-% | 0.139 | 0.047 | 0.096 | 0.002 | 0.132 | 0.131 |
| Activity | Agriculture | Livestock | Both | Support |
|---|---|---|---|---|
| Proportion of the sample | 19% | 61% | 7% | 12% |
| Air1 | 54% | 39% | 0% | 38% |
| Air2 | 54% | 39% | 0% | 38% |
| Air3 | 31% | 22% | 0% | 25% |
| Water1 | 77% | 61% | 80% | 38% |
| Water2 | 0% | 7% | 0% | 0% |
| Waste1 | 15% | 32% | 0% | 13% |
| Waste2 | 15% | 27% | 40% | 13% |
| EMP-20 | 75.308 | 29.122 | 21.800 | 15.250 |
| EMP-21 | 80.308 | 29.146 | 20.200 | 15.125 |
| EMP-% | −0.014 | 0.024 | −0.145 | 0.081 |
| TASSETS-20 | 8737.002 | 14,763.642 | 7336.891 | 2949.867 |
| TASSETS-21 | 10,463.915 | 18,144.821 | 7597.095 | 3450.677 |
| TASSETS-% | 0.140 | 0.076 | 0.036 | 0.158 |
| NON-CURRENT-ASSET-20 | 2464.538 | 6673.073 | 3503.800 | 1249.375 |
| NON-CURRENT-ASSET-21 | 3069.385 | 7524.439 | 3730.800 | 1378.625 |
| LEVER-20 | 63.025 | 83.783 | −24.136 | 104.364 |
| LEVER-21 | 72.949 | 77.969 | 7.100 | 77.044 |
| ROA-20 | 7.897 | 7.129 | −0.863 | 8.057 |
| ROA-21 | 7.443 | 5.062 | −1.687 | 11.144 |
| ROA-% | −0.454 | −2.067 | −0.823 | 3.086 |
| ROE-20 | 29.557 | 10.687 | 6.085 | 14.468 |
| ROE-21 | 23.712 | 8.587 | 14.197 | 28.257 |
| ROE-% | −5.845 | −2.100 | 8.112 | 13.789 |
| OPEINC-20 | 7747.227 | 21,606.349 | 3400.215 | 2798.754 |
| OPEINC-21 | 9081.785 | 28,127.679 | 4307.395 | 3193.376 |
| OPEINC-% | 0.098 | 0.094 | 0.180 | 0.124 |
Disclaimer/Publisher’s Note: The statements, opinions and data contained in all publications are solely those of the individual author(s) and contributor(s) and not of MDPI and/or the editor(s). MDPI and/or the editor(s) disclaim responsibility for any injury to people or property resulting from any ideas, methods, instructions or products referred to in the content. |
© 2023 by the authors. Licensee MDPI, Basel, Switzerland. This article is an open access article distributed under the terms and conditions of the Creative Commons Attribution (CC BY) license (https://creativecommons.org/licenses/by/4.0/).
Share and Cite
Enciso-Alfaro, S.-Y.; Amor-Esteban, V.; Azevedo, T.-C.; García-Sánchez, I.-M. Multivariate Analysis of Clean Technologies in Agricultural and Livestock Companies in Castilla y León. Agriculture 2023, 13, 2087. https://doi.org/10.3390/agriculture13112087
Enciso-Alfaro S-Y, Amor-Esteban V, Azevedo T-C, García-Sánchez I-M. Multivariate Analysis of Clean Technologies in Agricultural and Livestock Companies in Castilla y León. Agriculture. 2023; 13(11):2087. https://doi.org/10.3390/agriculture13112087
Chicago/Turabian StyleEnciso-Alfaro, Saudi-Yulieth, Víctor Amor-Esteban, Tânia-Cristina Azevedo, and Isabel-María García-Sánchez. 2023. "Multivariate Analysis of Clean Technologies in Agricultural and Livestock Companies in Castilla y León" Agriculture 13, no. 11: 2087. https://doi.org/10.3390/agriculture13112087
APA StyleEnciso-Alfaro, S.-Y., Amor-Esteban, V., Azevedo, T.-C., & García-Sánchez, I.-M. (2023). Multivariate Analysis of Clean Technologies in Agricultural and Livestock Companies in Castilla y León. Agriculture, 13(11), 2087. https://doi.org/10.3390/agriculture13112087


