Article

LCA-Net: A Lightweight Cross-Stage Aggregated Neural Network for Fine-Grained Recognition of Crop Pests and Diseases

1
School of Artificial Intelligence, Beijing Technology and Business University, Beijing 100048, China
2
National Engineering Research Center for Agri-Product Quality Traceability, Beijing Technology and Business University, Beijing 100048, China
3
College of Food Science and Engineering, Nanjing University of Finance and Economics, Nanjing 210023, China
4
Food Flavor and Nutrition Health Innovation Center, Beijing Technology and Business University, Beijing 100048, China
*
Authors to whom correspondence should be addressed.
Agriculture 2023, 13(11), 2080; https://doi.org/10.3390/agriculture13112080
Submission received: 4 October 2023 / Revised: 29 October 2023 / Accepted: 30 October 2023 / Published: 31 October 2023
(This article belongs to the Special Issue Application of Machine Learning and Data Analysis in Agriculture)

Abstract

:
In the realm of smart agriculture technology’s rapid advancement, the integration of various sensors and Internet of Things (IoT) devices has become prevalent in the agricultural sector. Within this context, the precise identification of pests and diseases using unmanned robotic systems assumes a crucial role in ensuring food security, advancing agricultural production, and maintaining food reserves. Nevertheless, existing recognition models encounter inherent limitations such as suboptimal accuracy and excessive computational efforts when dealing with similar pests and diseases in real agricultural scenarios. Consequently, this research introduces the lightweight cross-layer aggregation neural network (LCA-Net). To address the intricate challenge of fine-grained pest identification in agricultural environments, our approach initially enhances the high-performance large-scale network through lightweight adaptation, concurrently incorporating a channel space attention mechanism. This enhancement culminates in the development of a cross-layer feature aggregation (CFA) module, meticulously engineered for seamless mobile deployment while upholding performance integrity. Furthermore, we devised the Cut-Max module, which optimizes the accuracy of crop pest and disease recognition via maximum response region pruning. Thorough experimentation on comprehensive pests and disease datasets substantiated the exceptional fine-grained performance of LCA-Net, achieving an impressive accuracy rate of 83.8%. Additional ablation experiments validated the proposed approach, showcasing a harmonious balance between performance and model parameters, rendering it suitable for practical applications in smart agricultural supervision.

1. Introduction

Smart agriculture has opened a new era in the field of agricultural management, transforming traditional planting practices into a technologically advanced and efficient system. In the context of modern and information technology’s rapid development, smart agriculture has become an important means to improve agricultural productivity and ensure crop quality. Various agronomy operations have been widely supported by various information equipment and intelligent technologies, such as unmanned robots/drones, multi-typed high-precision sensors, intelligent edge computing nodes, and powerful cloud analysis computing, which has the potential to completely change the way crops are grown [1]. Taking the important task in agricultural production, that is, pest and disease prevention, as an example, these sensors and equipment play a crucial role in field monitoring. They can cover vast farmland and quickly detect traces of pests and diseases using various advanced technologies such as high-definition imaging, thermal infrared scanning, and multispectral analysis. By utilizing advanced image recognition algorithms to analyze captured images, different types of pests and diseases can be automatically identified and classified, providing valuable information to farmers and agronomists, and enabling timely interventions in the production environment of crops. By quickly identifying infected areas or concentrated areas of pests and diseases, farmers can take targeted control measures, such as localized application of insecticides or isolation of affected plants, to contain the spread of pests and diseases and protect the robust growth of crops. This timely intervention improves crop yield and quality and reduces reliance on broad-spectrum insecticides, contributing to environmental protection and sustainable agricultural practices [2].
To solve this vital issue, image analysis and machine learning techniques have successfully maximized efficiency and sustainability in crop pest and disease recognition. Image recognition for agricultural pests and diseases utilizes advanced computer vision and machine learning techniques to automatically identify and classify various types of pests and diseases in agricultural images, as well as evaluate their severity. Due to its strong potential in pest and disease management in agriculture, the development of this emerging field is rapidly advancing. Some traditional approaches including logistic regression, decision tree, ensemble learning, shallow neural network, etc., have been introduced to address all aspects of agricultural production. Although these algorithms can alleviate the current application difficulties to a certain extent, there is still a long way to go before it is easy to automatically use [3]. On the one hand, too many manual feature design and extraction processes are time-consuming and labor-intensive, with low accuracy, which is not conducive to actual intelligent application deployment. On the other hand, these traditional methods can only handle small-scale laboratory scene images but are often helpless when facing real, large-scale complex data.
In the past ten years, deep transfer learning has taken the lead and made significant progress in various fields, such as visual recognition, timing prediction, text analysis, etc. Related technologies are also widely used in smart agricultural pest and disease identification [4]. The main deep learning models used in this field include convolutional neural networks (CNNs) and some Transformer series models, demonstrating high effectiveness in extracting and utilizing complex spatial patterns and features from image data. By utilizing large-scale datasets covering diverse instances of pests and diseases, these models are trained to acquire discriminative features. Subsequently, through rigorous testing using dedicated test datasets, these trained models’ performance and generalization ability are comprehensively evaluated and validated. In particular, with the introduction of various lightweight optimization techniques and efficient decoupling structures, deep learning methods have recently refreshed application records and performance results in various agricultural tasks [5].
However, despite significant progress to date, the field of pest and disease image recognition still faces urgent technical challenges that require further exploration by researchers. One key challenge is to achieve an optimal balance between recognition speed and accuracy, as this directly impacts the practical applicability of these recognition systems. Fundamentally, in complex agricultural scenarios, pest and disease identification is a typical fine-grained identification problem, which is more difficult than image classification tasks in general scenarios [6]. Take tomato leaf mold as an example. It occurs everywhere and can easily damage leaves, stems, flowers, and fruits, resulting in a yield reduction of 20% to 30%. However, many types of fungi and pathogenic bacteria cause the disease. Even different lesions of Cladosporium fulvum have distinguishable visual states depending on the degree of disease. How to distinguish each subcategory of the same crop disease is still a major challenge for existing deep learning technology. Additionally, with massive cameras and IoT devices, extensive practical images of crops are captured. However, samples belonging to the same category may exhibit distinct variations in terms of poses, scales, rotations, viewpoints, and locations. Therefore, it is imperative for a smart agricultural system to improve fine-grained identification capabilities.
It can be seen that Innovative modeling architectures and learning optimizations are needed to improve the fine-grained discriminative ability of the models, while ensuring consistently high levels of accuracy and robustness. To effectively address this challenge, researchers have attempted to optimize the approaches from two aspects: improving the perceptual scale and designing lightweight structures. The former focuses on enhancing complex network structures to obtain abundant feature vectors in the hope of mining more useful fine-grained information. However, this often leads to a surge in model size and parameter volume, which is unsuitable for real agricultural application needs. On the contrary, the latter gains computational speed and lightweight scale through knowledge refinement and parameter compression, but its fine-grained perception capability is often insufficient [7]. Therefore, how to make the model lightweight under the premise of guaranteeing accuracy remains a necessary means to fine-grained crop pest and disease recognition in smart agricultural systems.
To this end, this paper proposes a lightweight cross-stage aggregation neural network, referred to as LCA-Net, through an ingenious modular structure and cross-attention fusion, which is dedicated to the problem of protecting crops and improving the efficiency of agronomists by deploying it for a full range of pest and disease identification and categorization tasks in smart greenhouse greenhouses possessing a warm and humid environment and containing multiple types of crops. The main work and innovations are as follows:
(1)
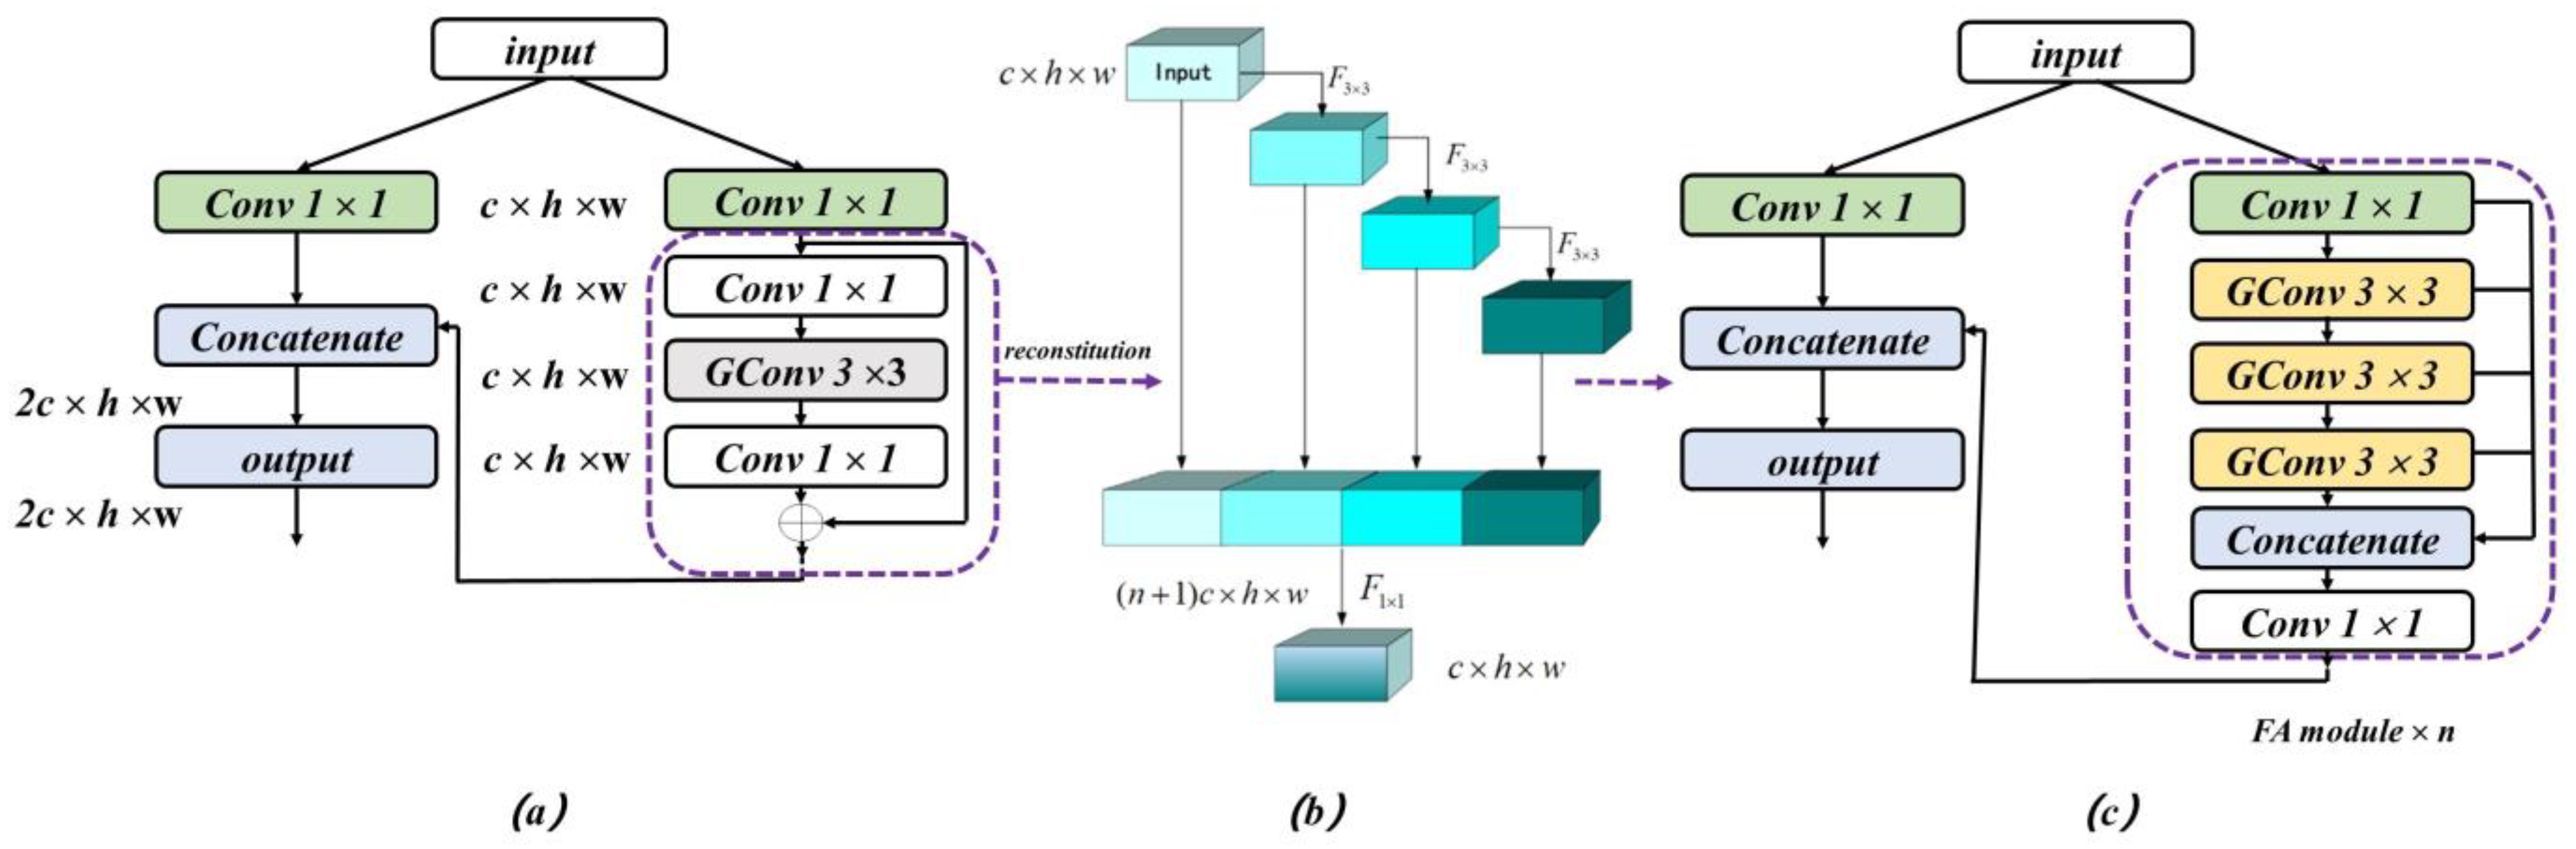
In order to address the practical deployment challenges posed by the excessive number of model parameters and the inadequate real-time performance for mobile applications, we propose a lightweight optimization scheme to rebuild the CSPNet-based backbone network [8]. This scheme involves enhancing the efficiency of large-scale networks and introducing cross-level aggregation modules.
(2)
To overcome the limitations in mining fine-grained features and the subpar identification accuracy in real-world scenarios, we focus on enhancing the network’s feature extraction capability. Our approach includes constructing a pyramid structure with a maximum area response, incorporating a channel spatial attention mechanism, and effective data augmentation preprocessing. Finally, with the supervision of the adjusted loss function, the entire model improves the fine-grained identification accuracy and achieves a good balance between efficiency and parameter scale.
The subsequent sections of this paper are structured as follows: Section 2 provides an introduction to the existing research approaches and their limitations. In Section 3, we elucidate our proposed model’s design principles and implementation procedures. Subsequently, Section 4 showcases compelling empirical findings and an assessment of its performance, accompanied by a comprehensive analytical discourse. Lastly, Section 5 culminates this endeavor by offering a concise conclusion and shedding light on potential avenues for future research endeavors.

2. Related Works

2.1. Deep Learning Image Identification Technologies

With the development of artificial intelligence technologies [9], deep learning algorithms [10] stand out due to their superior ability in handling large datasets and hold great promise in the field of agricultural intelligence [11]. Accurate identification of pests and diseases is crucial when using IoT devices to monitor crop growth in greenhouse environments. This identification process includes not only the detection of pests and diseases [12] but also the automated implementation of necessary treatments and the provision of targeted control recommendations. This multifaceted approach [13] greatly improves the efficiency and effectiveness of agricultural practices.
Image classification represents a pivotal application within computer vision, gaining particular prominence amidst artificial intelligence’s rapid evolution and image research advancements [14]. The study of image classification can be delineated into three distinct phases: firstly, the preprocessing of images; secondly, the extraction of information-rich features; and lastly, the refinement of classification methodologies. It is worth noting that the key to this advancement lies in feature extraction, as feature extraction helps to extract the most representative information from an image, such as texture, shape, and color, which are critical for image classification. In the era preceding the advent of machine learning, conventional feature extraction techniques enjoyed widespread application. These methods were followed by the employment of unsupervised work algorithms that gathered significant attention unsupervised learning for generating feature descriptors and supervised learning for constructing feature classifiers tailored to image classification tasks. Nevertheless, with the integration of machine learning, neural network algorithms garnered significant attention, catalyzing the rapid ascent of deep learning, which supplanted traditional methods. CNNs have garnered widespread adoption and solidified their pivotal role in the field significantly.
In recent years, CNN network modeling has made great strides, resulting in numerous innovative applications in the field of image classification techniques. Researchers have continued to make advances in modeling techniques. The introduction of AlexNet [15] during the 2012 ILSVR competition was a pivotal moment in this progress, marking the rise of deep learning in the field of image classification. Notably, its recognition accuracy was very high, significantly outperforming traditional shallow network methods. In the following years, deep learning has made great strides. For example, ResNet [16] became the preeminent model for relying on higher-order feature encoding. Extracting complex features from images and encoding them improved the discriminative power of the model, allowing for finer differentiation of similar-looking pest species. This advancement improves the accuracy of classification and helps in developing more precise pest management strategies. Another noteworthy model in image classification is the MixDCNN [17]. Designed for network integration, the MixDCNN combines information from multiple neural networks to create a more comprehensive representation of pests. By fusing the outputs from different networks, the model is able to effectively capture both low-level and high-level features, which improves the overall performance of the pest identification system. In addition to Tiwari [18], who utilized dense convolutional neural networks for identification and detection of diseases on leaves, and Kang [19], who developed a Yolo convolutional neural network-based algorithm for detection of small-targeted insect pests, researchers have also developed many excellent models [20] to protect crops by mounting various smart agriculture equipment [21] for remote monitoring, which have made great contributions to the field of pest and disease image classification as well as smart agriculture.
Nevertheless, despite these remarkable achievements, the models mentioned above deal with certain limitations, notably the burden of substantial parameter counts, susceptibility to interference, and relatively lower recognition efficiency. These constraints render them less suitable for practical deployment and limit their applicability within real-world agricultural settings.

2.2. Fine-Grained Visual Classification

The objective of fine-grained image recognition is the precise identification of specific targets within a broader category, which involves distinguishing among numerous subclasses. In the early stages of fine-grained recognition algorithms, a meticulous approach relied on manual labeling to guide the model in identifying critical local image regions. The DECAF model [22] serves as an illustrative example of this approach, effectively minimizing the influence of background elements. However, it significantly emphasizes precise sample labeling throughout model training and testing phases. In the evolutionary trajectory of this field, Huang et al. [23] pioneered the part-stacked CNN model, which directly generates region feature maps by leveraging full convolutional networks (FCN) [24]. Despite the progress achieved using these approaches, challenges persist in accurately pinpointing crucial regions and realizing end-to-end network training, thereby affecting their practical utility. In response to these limitations, Wei et al. [25] introduced the mask-CNN model, a novel approach that demands only two types of information—local annotations and image category labels—during the training process. This transformation effectively converts the localization problem into a segmentation problem.
The results of these approaches underscore their potential to enhance the classification accuracy of fine-grained recognition by incorporating extensive annotation data. Nevertheless, the substantial cost associated with dense region annotation and the challenge of managing vast data volumes presents significant obstacles. These limitations severely restrict the scalability and applicability of strongly supervised fine-grained recognition techniques in real agricultural contexts. Consequently, researchers have turned to weakly supervised learning. For instance, DVAN [26] aims to diversify visual attention for optimal feature extraction. Similarly, RA-CNN [27] progressively refines regional attention, transitioning from coarse to fine by training attention subnetworks. MA-CNN [28] takes a step further by simultaneously localizing multiple regions via feature channels, while MAMC [29] introduces multi-attention multicategory constraints for precise region delineation. DFL [30] introduces a discriminative filter for end-to-end learning of intermediate-level features, eliminating the need for additional attention or boundary annotations. NTS-NET [31] employs a self-supervised mechanism to extract the most informative regions from the original image and integrate them with overall image features. Liang et al. [32] integrated a clustering mechanism to leverage the recognizable portion of the intermediate feature map of convolutional neural networks. They also proposed a Gaussian hybrid layer model for efficiently modeling the distribution of selected features, considered data points, ultimately generating output feature cluster centers through merging. Zhuang et al. [33] designed the attention pairing interaction network (APIN) to capture contrast differences via pairwise interactions between two images. These multifaceted approaches synergistically combine attention mechanisms for autonomous region recognition, higher-order feature encoding for mining complex features, and network integration to enhance model performance. It is worth noting that some network integration approaches increase parameters due to the utilization of multiple parallel CNNs, rendering them less suitable for device-centric agricultural environments.

2.3. Lightweight Modeling Optimization

CNN models have demonstrated significant success in many computer vision (CV) tasks, encompassing image classification, object detection, and image segmentation. However, due to the inherently complex architecture and resource-intensive computation of CNNs, the number of parameters of traditional network models is extremely large. However, the implementation of such huge CNN models is hampered by the limitations of storage capacity and device power consumption. Researchers have designed lightweight CNN architectures specifically for mobile deployment to address the need for mobile real-time interaction. The limitation of this design approach is the streamlining of the model by reducing its parameter count and complexity while upholding the intrinsic accuracy of the CNN model. By integrating these considerations, the objective is to enhance the operational efficiency of CNNs and ensure their compliance with real-time usage on mobile platforms.
SqueezeNet [34], introduced by Forrest et al., played a pioneering role in developing lightweight network architecture design methods, significantly influencing subsequent research. It served as a catalyst, offering valuable design insights to researchers exploring lightweight network architecture schemas. Shortly after, Google presented MobileNet [35], which replaced traditional convolution with depth-separated convolution, substantially reducing parameters and computational complexity. Building upon this foundation, later researchers made further advancements. In 2019, MobileNet-v3 [36] introduced an inverted residual structure, incorporating dimensionality augmentation, channel-by-channel convolution, subsequent dimensionality reduction, and a linear bottleneck layer. In 2017, Kuangyi’s Face++ team proposed ShuffleNet [37], introducing innovative grouped convolution in its model. Subsequently, the team extended this paradigm with ShuffleNet-v2 [38], notable for its use of direct metrics over indirect evaluation metrics. The authors strongly advocated for a comprehensive understanding of network performance beyond relying solely on FLOPs, emphasizing the multifaceted nature underlying differences in FLOPs and processing speeds. ChannelNets [39] introduced the concept of sparse connectivity in input and output dimensions, departing from traditional packet convolution. PeleeNet [40] draws inspiration from DenseNet [41], devising a series of network structure optimization schemes to create a lightweight network well-suited for mobile environments.
Based on the preceding analysis, the deep separable convolution technique has garnered significant attention in designing lightweight network structures. Two predominant modes of network design have emerged [42]. First, efforts to enhance lightweight properties are executed through two distinct strategies. One strategy involves upgrading an existing model using lightweight characteristics. This involves the replacement of the cumbersome convolutional structures in the original network with lightweight modules [43,44]. The second strategy leverages architecture search techniques to construct superior network structures. The limitation of this approach lies in searching for optimal parameters across the integrated network structure and building upon established lightweight modules. Consequently, the exhaustive parameter exploration facilitated by this search forms the foundation for the pursuing of enhanced lightweight models [45]. Additionally, in order to bolster the performance of lightweight networks, certain design approaches incorporate attention mechanisms into the network structure [46].

3. Materials and Methods

This paper is dedicated to addressing the challenges and complexities encountered in fine-grained image recognition methods for agricultural pests and diseases in a smart greenhouse environment. To this end, we synergize cutting-edge deep learning techniques to construct a lightweight cross-level aggregation image recognition model. The structure of the overall framework is shown in Figure 1. The proposed LCA-Net combines a lightweight architecture with the prowess of a high-performance large network, supplemented by integrating a streamlined attention module to uphold its performance and facilitate its adaptability for mobile deployment. Additionally, a feature pyramid module rooted in maximum response region cropping is introduced as a pivotal enhancement strategy, aiming to heighten the accuracy of fine-grained image recognition within the context of crop pests and diseases.

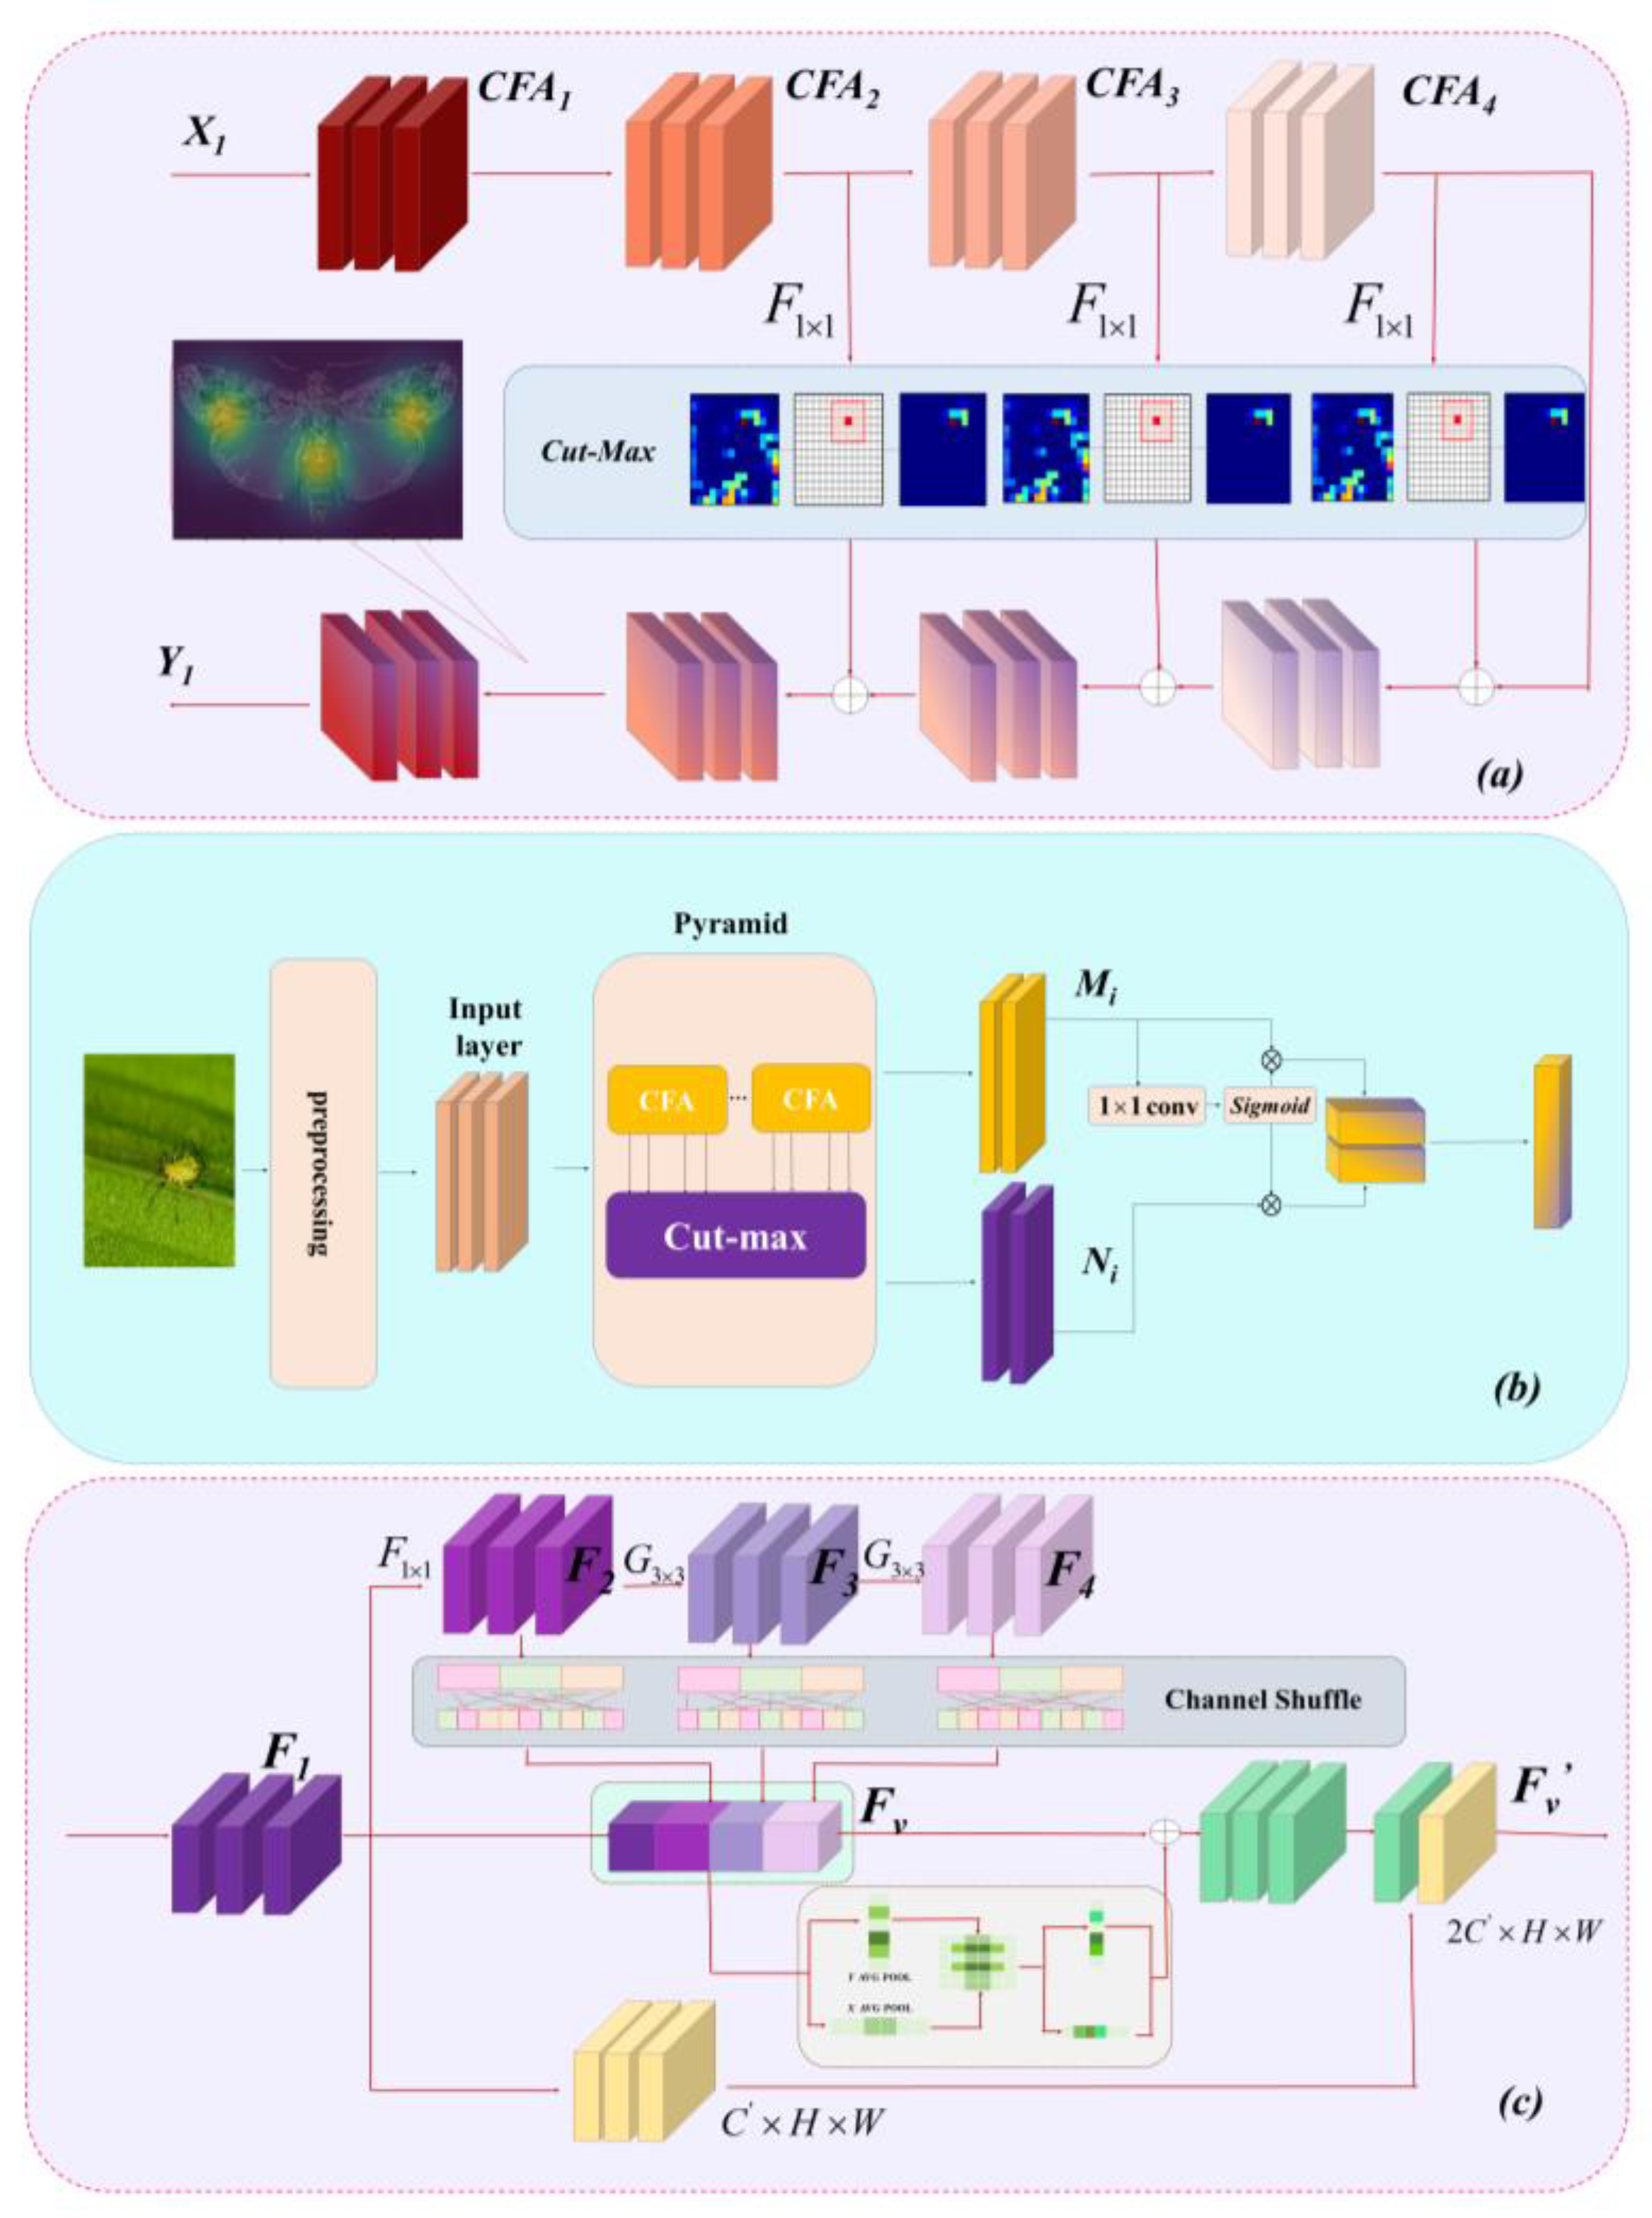
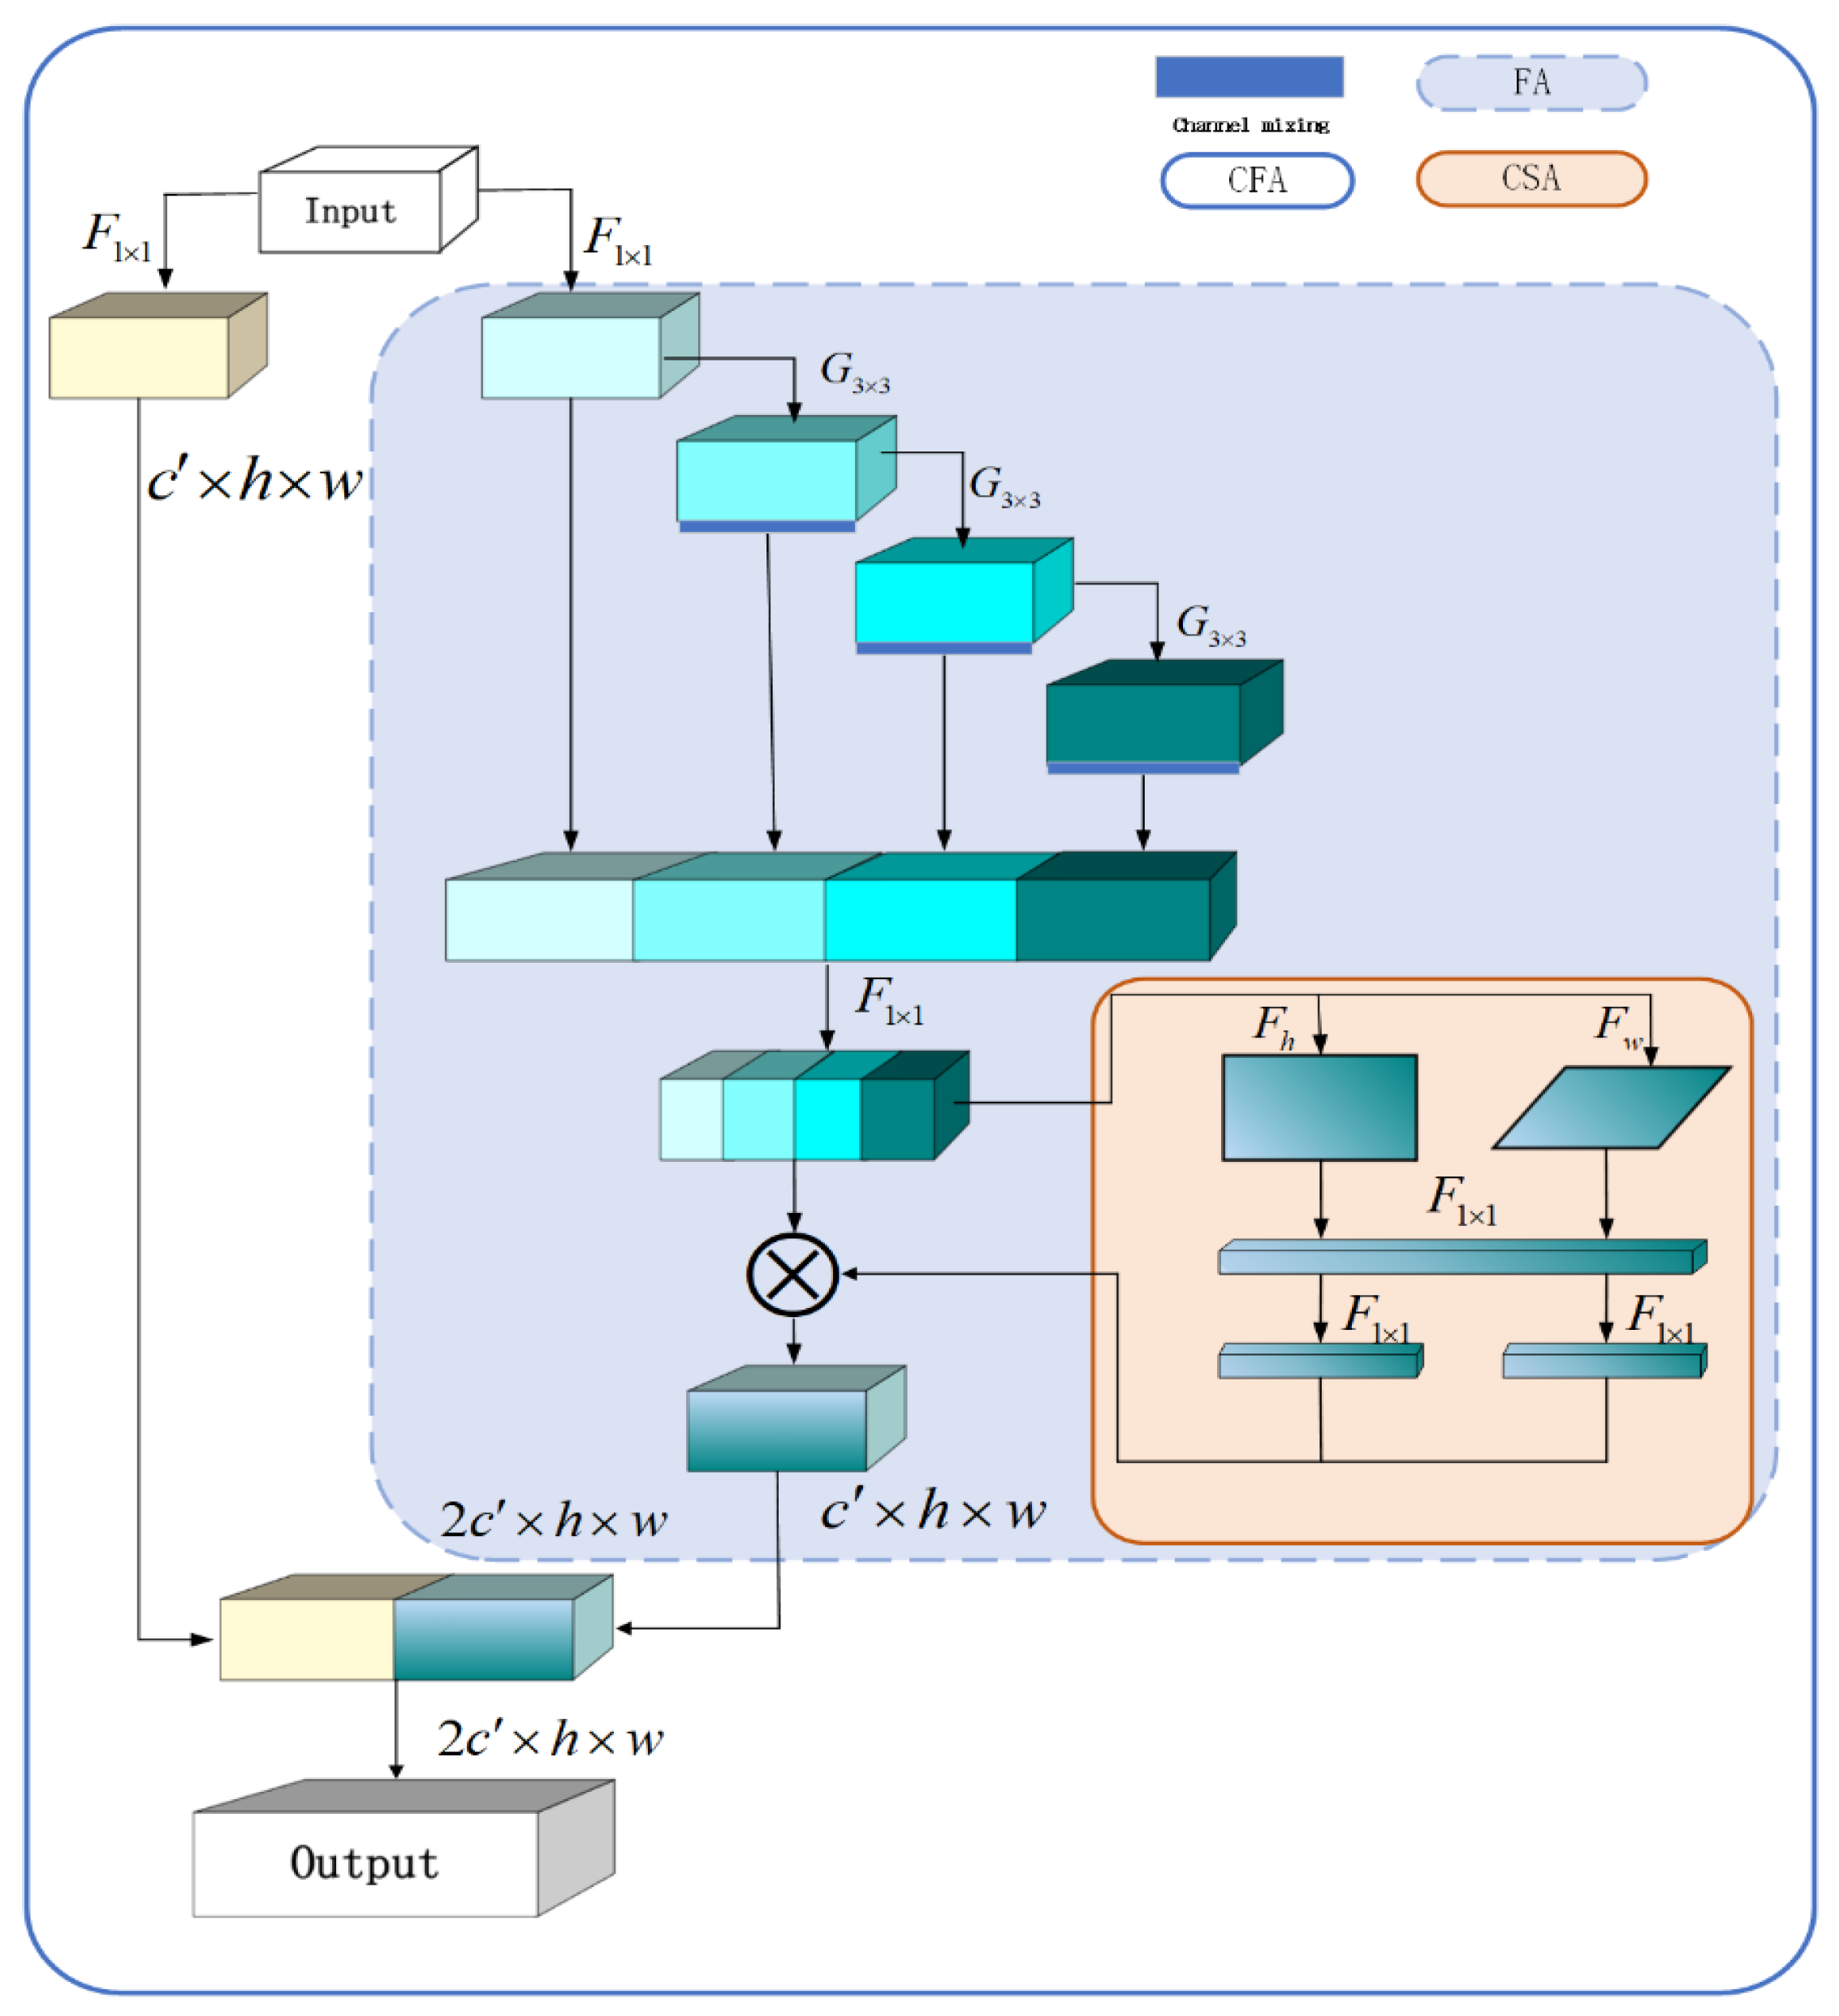
3.1. Lightweight Backbone Network Architecture

CSPNet has demonstrated its capacity as a classical convolutional network model across a spectrum of computer vision tasks. This is attributed to its innovative approach, involving splitting and fusion strategies, which effectively doubles the number of gradient paths. Additionally, it manages to reduce the count of parameters and computations, thereby ameliorating memory usage. By embracing cross-level connectivity strategies, CSPNet integrates seamlessly with various CNN architectures, ultimately elevating network performance. Despite its merits, CSPNet does not deal with certain challenges. The serial residual block structure inherent in the backbone branch of CSPNet enriches the network’s perceptual field gradually. However, the sequential nature of this structure results in suboptimal utilization of model parameters. Furthermore, the element-level “add operation” introduces a certain degree of memory access cost (MAC) occupation. To surmount these limitations, this paper innovatively refines the backbone structure. It introduces a novel lightweight cross-level aggregation image recognition model (LCA-Net) to optimize parameter utilization. Importantly, this optimization is achieved without causing significant augmentation in parameter count or computational complexity. The core objective is to harness the untapped potential of network performance and enhance accuracy levels.
In this paper, the feature aggregation (FA) module is designed to replace the serial residual block structure of CSPNet to enhance the utilization of the mid-level features and reduce the extra MAC occupation caused by the element-level “add operation”. The output of multiple residual blocks is stitched together with the input, and the shortcuts in the residual blocks are removed. And since the convolution of 1 × 1 in the original residual block is mainly used to change the feature dimension and expand or contract the number of channels, and the number of channels in the backbone branches of CSPNet is all the same, the convolution of 1 × 1 is removed. As a result, only the 3 × 3 convolution remains in the residual block to contrast the new FA structure.
As shown in Figure 2, the input x i R c × h × w is stitched together with the input after n times 3 × 3 convolution operation to obtain a set of features of x R ( n + 1 ) × c × h × w , and then the set of features is aggregated and downscaled using 1 × 1 convolution to obtain x o R c × h × w , the output of an FA module. In the subsequent experiments, referring to the residual block structure design of the ResNet family, n is set to 3. During the connection process, feature information is preserved, enabling abstract features with multiple receptive fields to capture visual information across various scales. Preserving information from different levels is especially important because each layer has different receptive fields, so the improved FA module is better at preserving and accumulating feature maps with multiple receptive fields. Therefore, the improved FA module has a better and more diverse feature representation for retaining and accumulating feature maps of multiple receptive fields. Moreover, the number of network parameters and computational effort are reduced because the convolution of 1 × 1 of the network structure is optimally removed.
Based on the FA module design scheme, combined with the CSPNet cross-layer connected network structure, we constructed a novel backbone network called LCA-Net in this study. By increasing the output channels at different stages, LCA-Net improves the ratio between deep-level and shallow-level features. This results in a more effective feature representation achieved with fewer overall layers. Furthermore, the network’s performance is enhanced by implementing the CSPNet cross-layer connected structure. To solve the feature redundancy problem, we change the regular convolution 3 × 3 to group convolution 3 × 3 in each FA module and set the number of groups to 16. We add a channel shuffling module after each 3 × 3 group convolution to disrupt the features so that they are evenly distributed in each group of channels. Secondly, in this paper, the number of channels is reoptimized to 256, 384, 512, 1024 for four different perceptual field stages, retaining more channels in the shallow layer to maintain the model’s ability to mine information in the shallow layer, and reducing the number of channels in the deeper layer to avoid overfitting and redundancy caused by feature redundancy.
The resulting LCA-Net outperforms CSPNet in terms of both accuracy and speed. However, it is essential to acknowledge that the decrease in channel count, parameter quantity, and computational complexity can potentially impact the model’s performance. To counterbalance this inherent tradeoff, this paper introduces a convolutional attention module into the network. This augmentation intends to sustain the model’s performance by addressing the performance degradation concerns associated with these reductions.

3.2. Channel–Spatial Cross-Attention Module

The convolutional attention module serves as a mechanism for region weighting, enabling the accentuation of crucial regions while disregarding extraneous information, thus facilitating a targeted focus on pertinent data. This is achieved by integrating an additional attention weight into feature regions, subsequently multiplied with the original feature map. The outcome is an elevated network emphasis on regions of interest. The convolutional attention module can be seamlessly incorporated anywhere within the network architecture without incurring substantial computational overhead. This module comprises two integral components: the channel attention module and the spatial attention module. The channel attention facet empowers the network to discern the most information-rich channel ensemble autonomously, attributing higher weights to amplify significant channel features while dampening the influence of less relevant ones. Conversely, the spatial attention component intuitively prioritizes informative spatial regions, enhancing the network’s capacity to focus on the most salient areas.
This paper introduces a streamlined channel–spatial attention (CSA) module subsequent to the feature aggregation within the backbone branch to anticipate any potential decline in model performance stemming from channel count reduction. The conventional approach often employs global pooling to encode spatial data for channel attention comprehensively. However, this method has the drawback of compromising location information, as it condenses broad spatial information into channel descriptors. In order to encourage the attention module to capture distant spatial interactions without sacrificing precise location information, the (CSA) mechanism decomposes global pooling into two separate operations: horizontal pooling and vertical pooling. These operations aggregate features along their respective spatial axes, culminating in direction-sensitive feature maps. This strategy empowers the attention module to preserve significant spatial correlations along one axis while retaining meticulous location information along the other. This synergistic approach enhances the network’s ability to identify points of interest precisely.
Following the generation of two feature encoding sets, this paper fuses the two sets and captures the intricate interplay among diverse channels using a sequence of convolution–normalization–activation operations. Subsequently, the features are separated into two encodings, each sharing the original encodings’ dimensions. Further convolution–activation operations are executed to derive the weight coefficients governing the two sets of attention. Ultimately, this yields reweighted feature sets, aligning the original features with spatial and channel attention weighting. The following equations outlines the specific operational sequence.
x h = P h ( x i ) , x w = P w ( x i ) f = δ ( F c ( [ x h , x w ] ) ) x = ( σ ( F h ( f h ) ) + σ ( F w ( f w ) ) ) x i
P h and P w represent the pooling operation to obtain two spatially oriented feature codes, F c represents the convolution and normalization operation after stitching two sets of feature codes, δ represents the activation function, [ f w , f h ] = f represents the feature obtained by splitting the feature, F w and F h represent the convolution operation of two sets of feature codes, and δ represents the Sigmoid activation function.
The final LCA-Net proposed in this paper is obtained by lightening the structure and adding the convolutional attention module, which can extract multilevel perceptual field features to improve network performance and meet the efficient network structure design scheme to satisfy the MAC optimum and achieve the lightening improvement to avoid the redundancy of network features, and also add the convolutional attention module to explore the performance further; the network structure of each stage is shown in Figure 3.
The input samples undergo initial encoding via two distinct convolutional sets. Subsequently, one set of features is employed for cross-level concatenation, while the other set serves for feature extraction within the FA module of the primary branch. Multiple FA modules can be introduced into the network series for a more potent feature extraction capacity. Following the feature extraction phase in the FA module and subsequent cross-level feature merging, downsampling is executed. The input samples traverse through a 4-stage sequential feature extraction structure, with the number of FA modules in each stage being 1, 2, 3, and 1, respectively. After this, the global average pooling layer is employed to compact the features, which are further learned through the fully connected layer to produce outputs, incorporating a nonlinear amalgamation.
Commencing at the attention level, this paper undertakes a comprehensive exploration to mitigate the model accuracy decline attributed to its lightweight nature. Subsequently, this study delves into an extensive analysis of deep, middle, and shallow features, aiming to elevate the model’s classification accuracy further. The intricate agricultural environment, compounded by excessive background interference noise and the inherent resemblance in features across diverse categories, such as shape and color, constitutes the primary factors contributing to the suboptimal accuracy in image recognition tasks pertaining to crop diseases and insect pests. Consequently, building upon the LCA-Net framework introduced earlier, this paper presents a feature pyramid module predicated on maximum response area clipping. This strategic enhancement seeks to tackle the intricate challenge of classifying amidst complex agricultural backgrounds, addressing the difficulty conventional models encounter in discerning subtle variations.

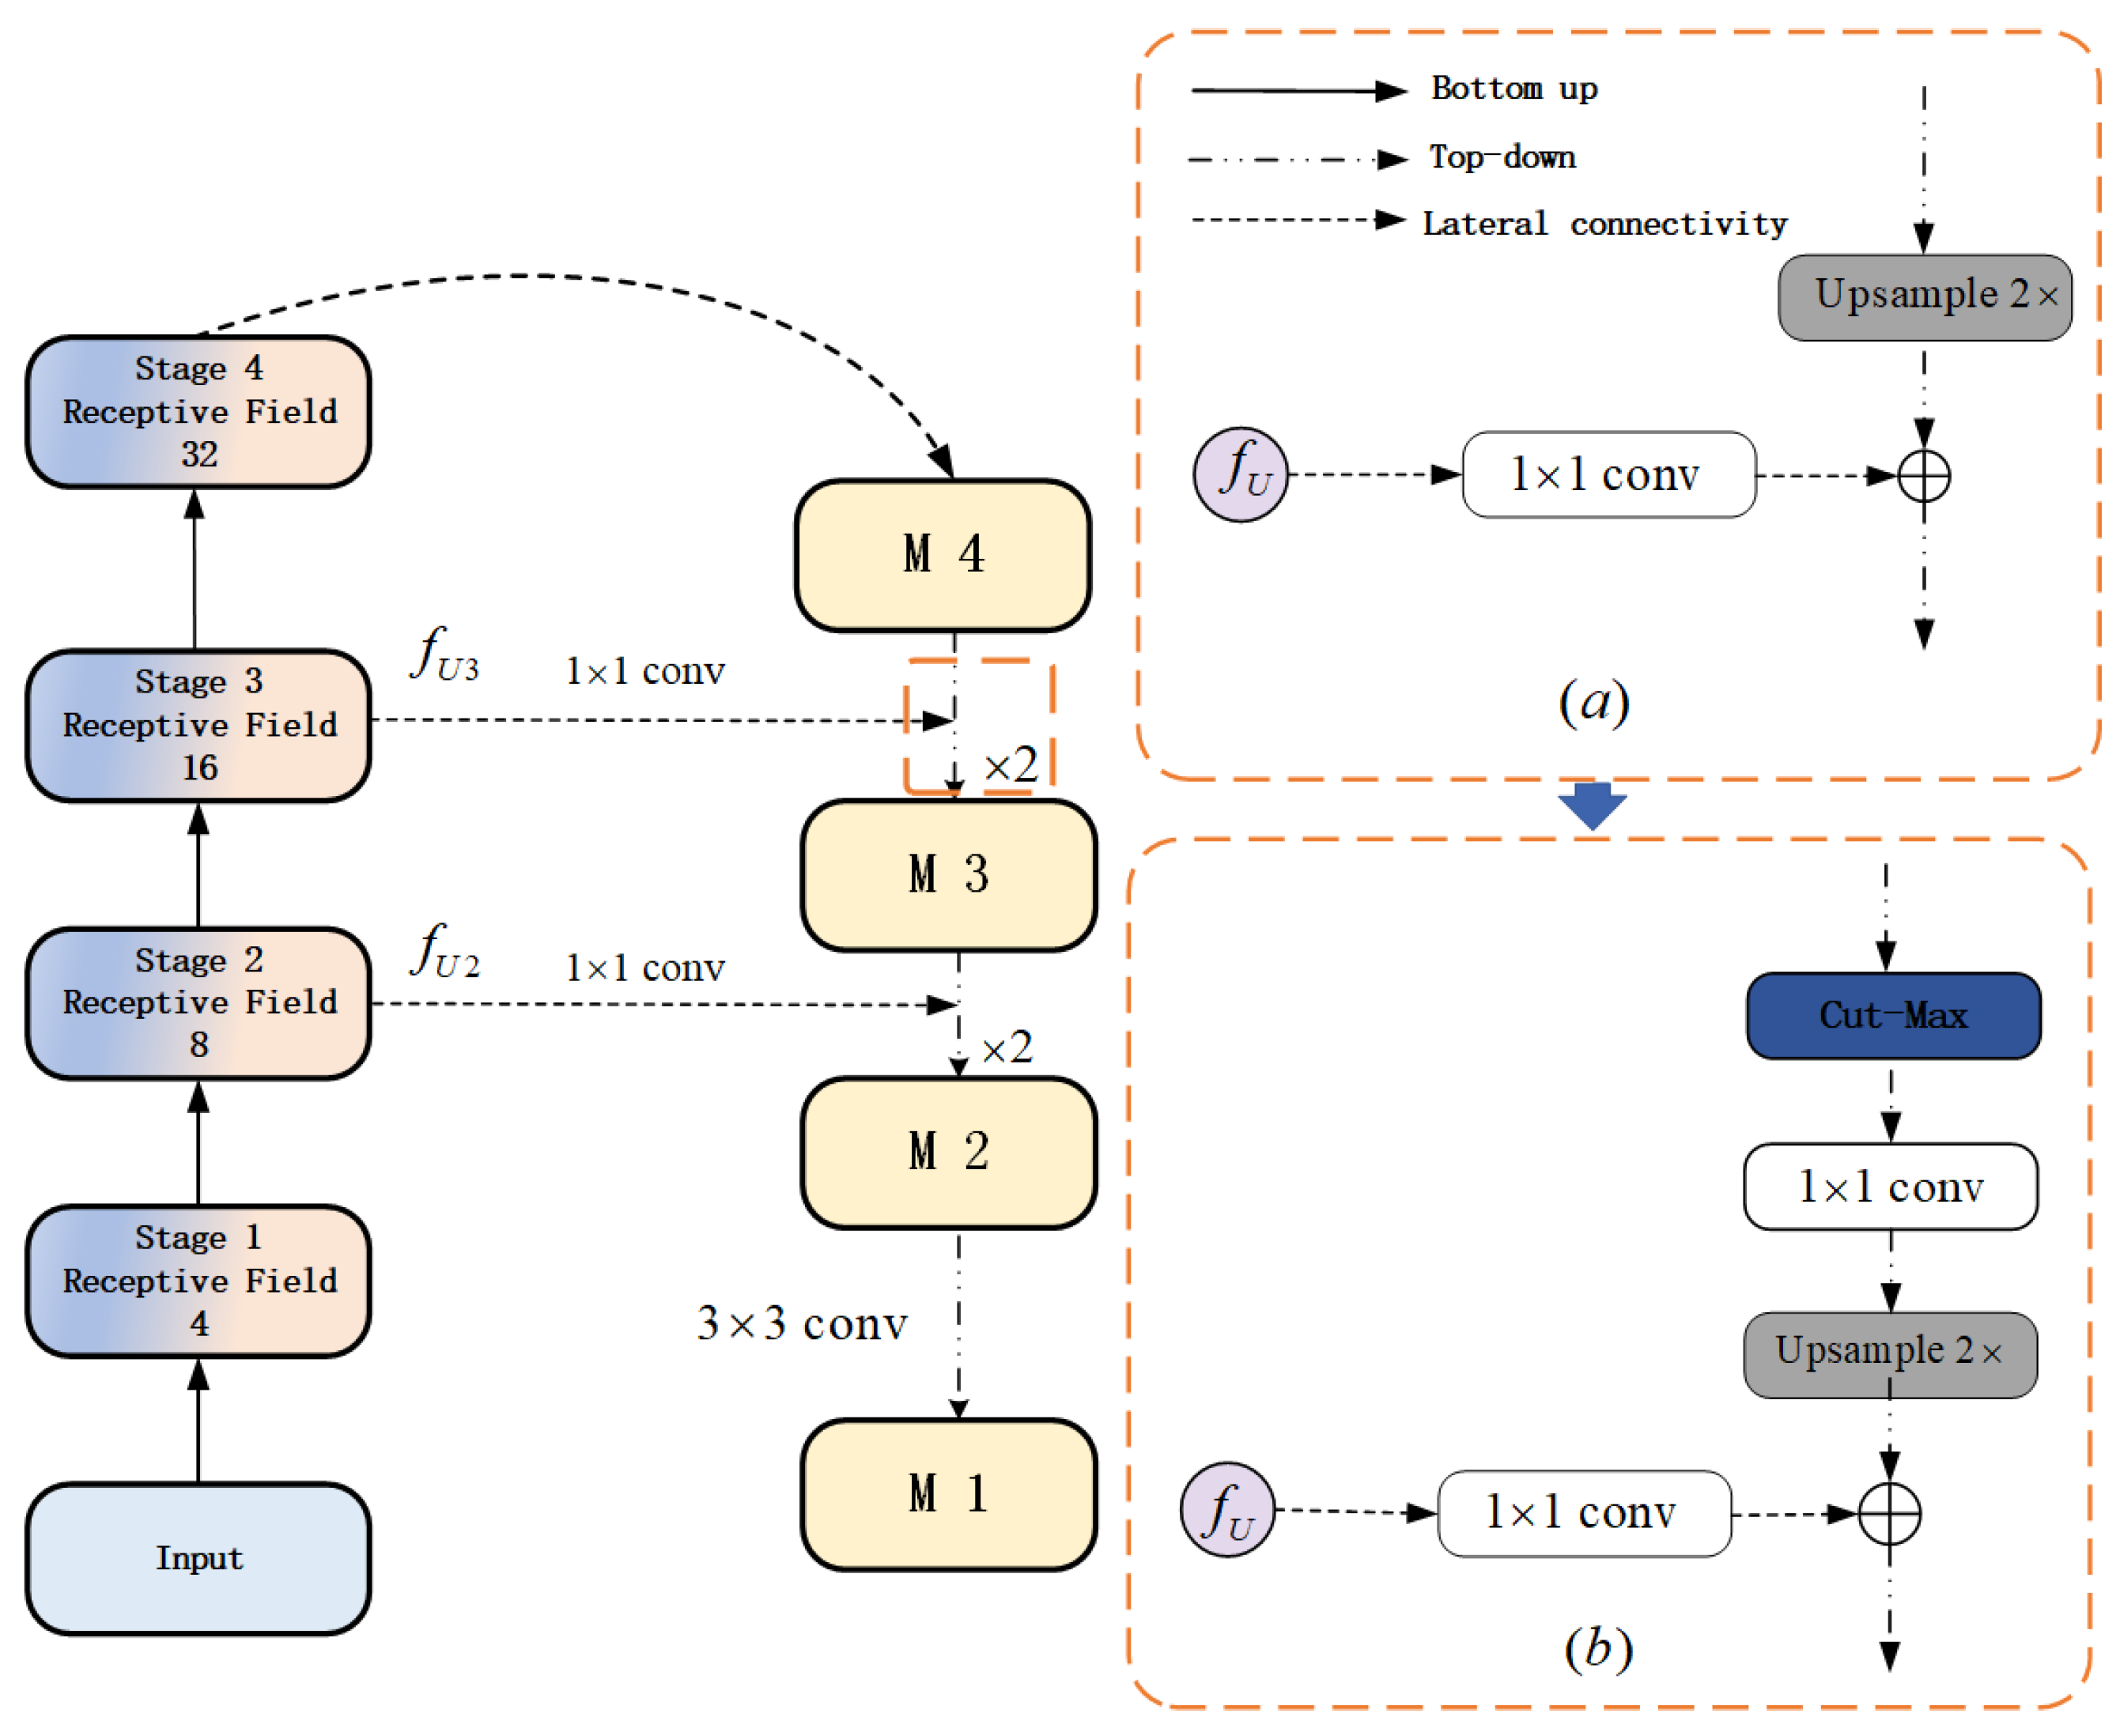
3.3. Maximum Cropping Feature Pyramid Module

Many contemporary networks rely on a single high-level feature for classifying subsequent objects in image classification tasks. However, this approach poses a risk of obscuring small objects with limited pixel information during the downsampling process. In the context of image recognition concerning crop pests and diseases, the intricate background noise inherent in the subjects renders conventional networks inadequate in extracting discriminative image features. To harness the collective benefits of shallow, mid-level, and deep features, this paper embraces the feature pyramid network architecture to extract inherent features from the samples. The feature pyramid structure adeptly retrieves features from images of varying scales, thereby generating multiscale feature representations. This methodology minimizes computational demands while enriching the feature map with substantial spatial information by fusing feature maps with robust low-resolution semantic information and delicate high-resolution semantic information. The feature pyramid module proposed herein is illustrated in Figure 4.
The feature pyramid module proposed in this paper is shown in Figure 4. Since the perceptual field in Stage 1 is too small and the information utilization is low, it is not used in the construction of the feature pyramid, and the rest of the layers are used to construct the feature pyramid. After the input sample pairs pass through Stage 1 and Stage 2 of the dual-stream network, the feature maps f U 2   and with a perceptual field of 8 are obtained, and after Stage 3, the feature maps f U 3 and with a perceptual field of 16 are obtained, and then the samples pass through Stage 4 and the feature maps f U 4 with a perceptual field of 32 are obtained. In this paper, f U 4 are summed up and used as the feature expression of the uniform deep layer extracted using the model M4. Subsequently, M4 is upsampled and combined with f U 3 , which is convolved with 1 × 1 for feature encoding to obtain M3, and the features are fused, as shown on the left in Figure 4. The shallow features are accumulated with the processed deep features. This is carried out because the shallow features provide more accurate location information, while the multiple downsampling and upsampling operations make the localization information of the deep network inaccurate, so they are combined and used. Repeating the above operations, the aggregated network deep features M4, middle features M3, and shallow features M2 are finally obtained so that a deeper feature pyramid is constructed, and more feature information is fused.
During the Cut-Max operation, each feature map retains only the part of the highest response region. After the Cut-Max processing of features, only the region with the highest response is retained for each channel. This part contains the most discriminative part or feature relative to the original map. The improved feature map is filtered using the Cut-Max module for background information. Then, the convolution of all channels using 1 × 1 the upsampling method is chosen as the nearest neighbor interpolation method, and the up-sampled features are combined with the previous layer of features as spatial attention. The traditional feature pyramid unifies all information into aggregated features without other processing, which contains richer semantic information but cannot explore the image features of the samples. In contrast, Cut-Max can be regarded as attaching more weight to the high response region spatially so that the model is not scattered in the region of interest and can be accurate to the discriminable part of the sample. All steps of Cut-Max are operated in the form of a matrix, which does not bring additional performance loss.

3.4. Data Enhancement Preprocessing

In order to prevent network underfitting and avoid network overfitting, this paper uses data enhancement and augmentation techniques in training on all data to improve the quality of the dataset samples and increase network generalization. In the image recognition task, the following six measures are taken in this paper for dataset sample enhancement:
(1)
First, all the sample images are resized to the square to fit the input size of the deep learning network;
(2)
Randomly flip the sample image horizontally and vertically with a probability of 0.5 to increase the diversity of the image and enhance the translation invariance of the image;
(3)
The sample image is cropped into a square image with a randomized region during the training phase. Conversely, during the testing phase, the sample image is cropped into a square image with the center region;
(4)
Randomly rotate all sample images within the range [−15°, 15°] to improve the distortion adaptation of the images;
(5)
The sample image undergoes adjustments in the HSV color space, specifically in the hue H, saturation S, and luminance V parameters. These adjustments are made based on a predetermined offset of 0.3. In other words, the values of H, S, and V are randomly set within the range of [70%, 130%] of the original image. This process aims to generate variations of the sample image under different lighting conditions;
(6)
For data regularization, the sample images undergo additional processing through the utilization of the CutMix method. CutMix involves cropping out a specific region from the image, but instead of replacing it with zero pixels, it is randomly filled with pixel values from the corresponding areas in other training data. The classification results are then distributed based on a predefined ratio. CutMix offers several advantages, including improved training efficiency by eliminating noninformative pixels, enhanced spatial localization ability of the model, and no extra computational overhead during the training and testing processes.

3.5. Loss Function Design

During training, the cross-entropy loss function is employed to minimize the discrepancy between the predicted value and the true value. The formula for this loss function is used as follows:
y ˜ k = 1 ε y ˜ k + ε u
L o s s = k = 1 n y ˜ k s o f t m a x ( y k )
where y ˜ k represents the sample label, ε represents the smoothing factor that signifies the weight ratio, and u corresponds to the fraction expression of each category.
The incorporation of label smoothing operation aims to encourage the probability output obtained from the SoftMax function to align with the correct labels of diverse categories closely. This is achieved by constraining the output discrepancy between positive and negative samples. As a result, the smooth loss function employed within the network enhances its overall generalization capability.
Throughout the training process, distinctive learning rates are assigned to individual modules. The uniform sampling branch is fine-tuned using a learning rate of 0.001, whereas the negative sampling branch’s tail structure, the Cut-Max-based feature pyramid structure, the higher-order feature encoding module, the discriminant filter structure, and each module’s classifier are trained from scratch with a learning rate of 0.1. All network parameters are optimized using an SGD optimizer with corresponding momentum and weight decay values set to 0.9 and 0.005. The training duration spans 100 epochs, employing a cosine annealing learning rate reduction algorithm with restarts. The learning rate is adjusted to 50% of its initial value from the preceding cycle after each restart. The cosine annealing step is defined as 2, and each stage’s base cycle length is set to 10 cycles. Consequently, the learning rate is reset at the 41st and 61st cycles for improved optimization.

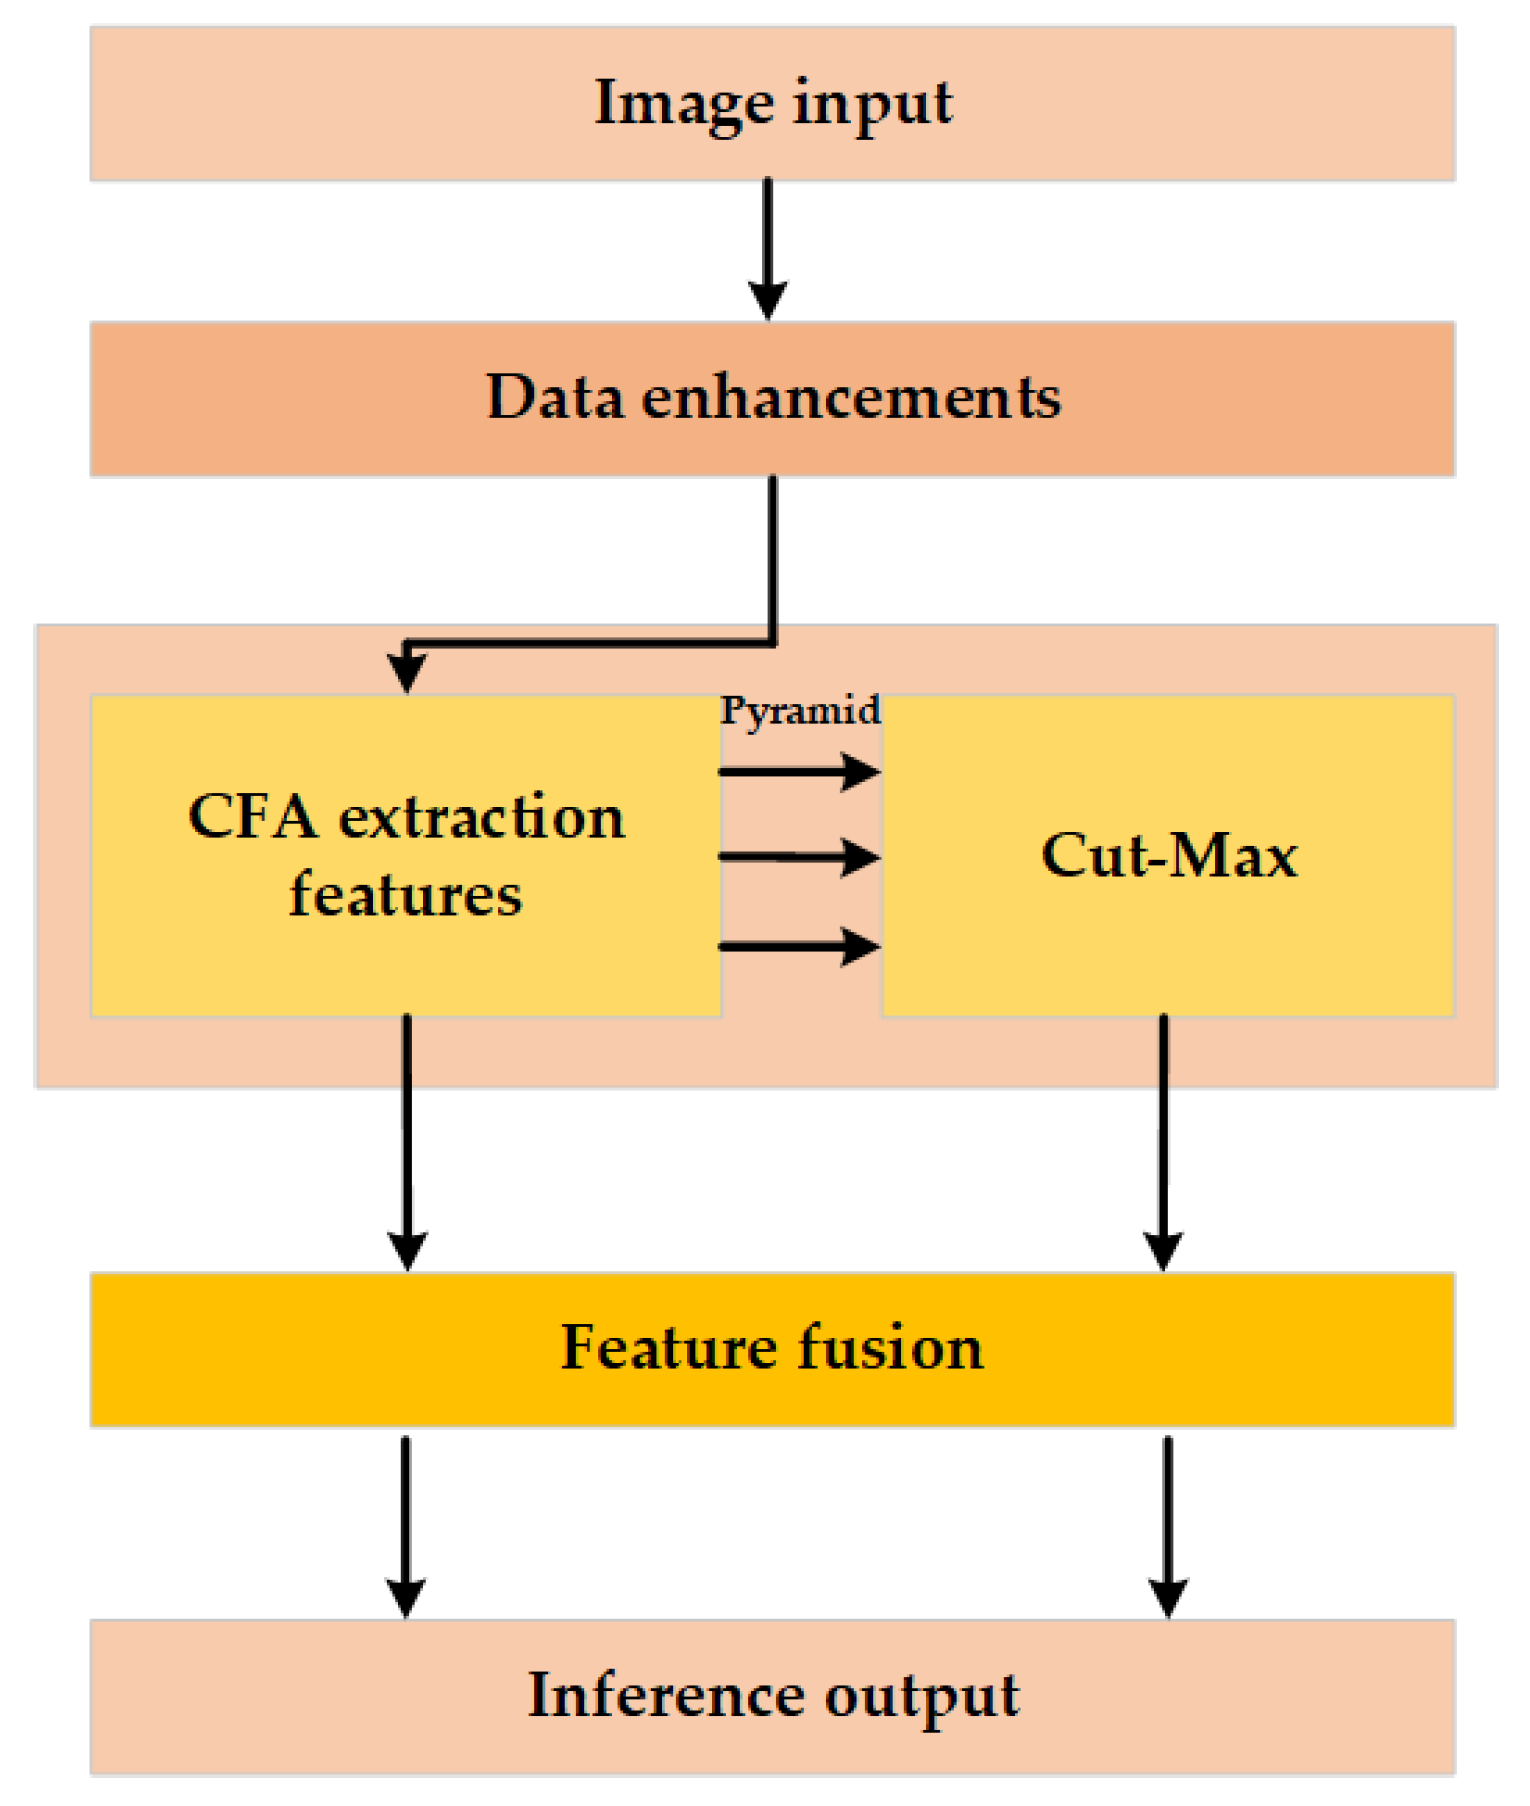
3.6. LCA-Net Process Illustration

In order to make the reader understand the algorithm flow more intuitively, we drew a simple flowchart of the LCA-Net process, as shown in Figure 5.
The first step of LCA-Net is to obtain the dataset images as input. Next, to improve the image quality and enhance the information contained in it, we introduce a data enhancement step. This step includes processes such as rotation, brightness adjustment, blurring, etc., to extend the diversity and usability of the input images. This helps in model training and improve robustness. After that, the data-enhanced image enters the backbone network to extract multilevel image features, which continues through the backbone and branching and enters the Cut-Max module to crop the regions with high response values of the target features, and only the part of the region with the highest response value is retained in each feature map, which is then fused with the shallow, medium, and deep features for the final inference classification of the target. In addition to this, we provided the LCA-Net pseudo-code, as shown in Algorithm 1.
Algorithm 1: LCA-Net Process
1: input: X , G , C , τ
                     X # Input feature atlas
                     G # CFA
                     C # Cut-max
                     τ # Response Score Threshold
2: X e n X # Data Enhancement
3: for b k in X e n do # Extract features
4:          F G b k
5: return F
6: for f k in F do # Find the region of maximum response for each feature map
7:          C k C f k
8:         for d in C k do #Judging Response Scores
9:               if d . s c o r e > τ then
10:                      C h i g h C d
11:                      F c u t F C h i g h # Weighting of areas of key concern.
12:             end
13:       end
14:     return F c u t
15: end

4. Results and Discussion

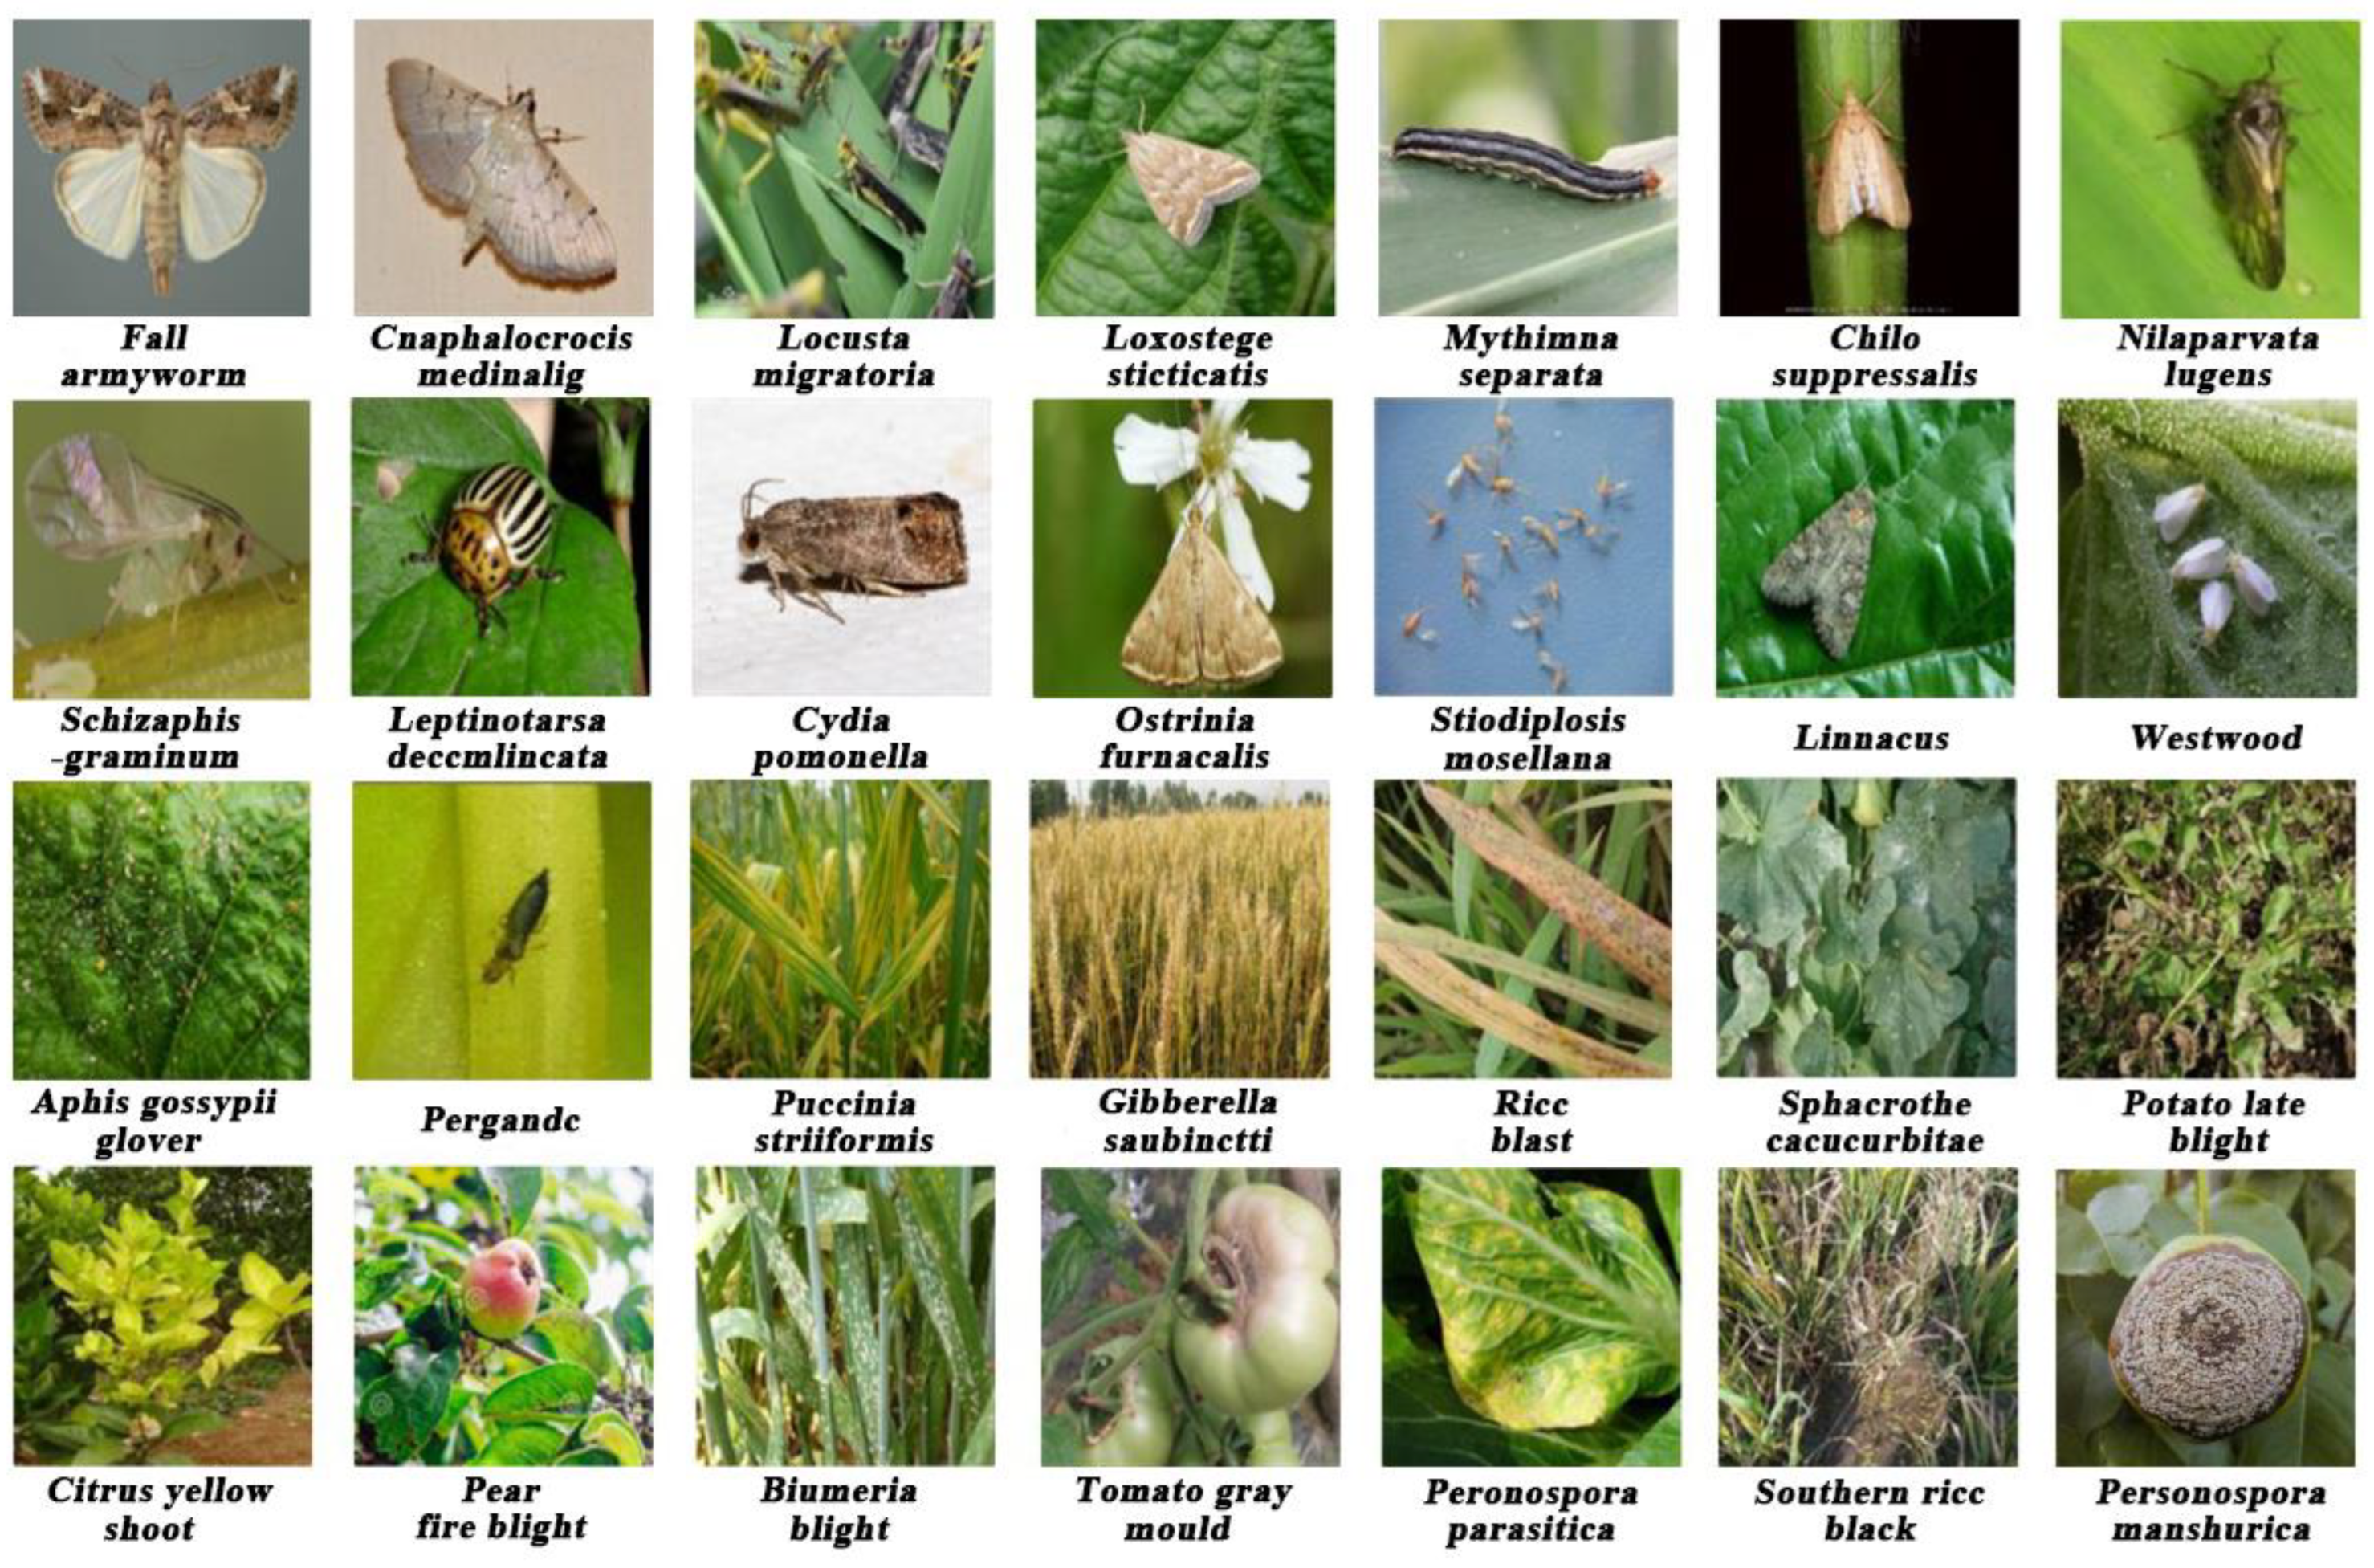
4.1. Experimental Dataset and Settings

This paper focuses on images describing agricultural pests and diseases. In deep learning, the quality and scope of the dataset are important prerequisites for building robust experimental models. This is especially important for complex, fine-grained pest and disease scenarios, so obtaining a suitable dataset is imperative. We obtained the “List of Crop Grade I Pests and Diseases” developed by the Ministry of Agriculture and Rural Affairs of China and the “List of Crop Grade II Pests and Diseases” developed by Beijing Municipality by means of web crawling, and at the same time, combined with the actual scenarios for modeling, we actually captured the data of pests and diseases in greenhouse environments, and acquired challenging images from the IP102 dataset [47]. Through the above methods, 16 pests and 11 diseases, totaling 28 different categories, such as fall armyworm, ricc blast, etc., were finally captured and 36,556 sample images were compiled. In this study, we divided the dataset into two parts, which accounted for 80% and 20% of the training and test sets, respectively, to fulfill the training and inference requirements. We divided the dataset carefully to facilitate the training and inference process. The dataset portion of the presentation is shown in Figure 6.
This study harnesses Ubuntu 20.04 LTS as the foundational system to construct a server platform encompassing dual-core Intel Xeon E5-2690 [email protected] GHz × 48-core processors, 128 GB of RAM, and 2 × 2 TB SSDs, alongside 7 NVIDIA Tesla P40 GPUs, and a computational cache of 168 GB. All code presented herein relies upon the PyTorch 1.7.1 deep learning framework. The uniform sampling branch employs the pretrained LCA-Net model, initially trained on the ImageNet dataset, while the remaining modules employ the “He” initialization method to initialize model parameters.

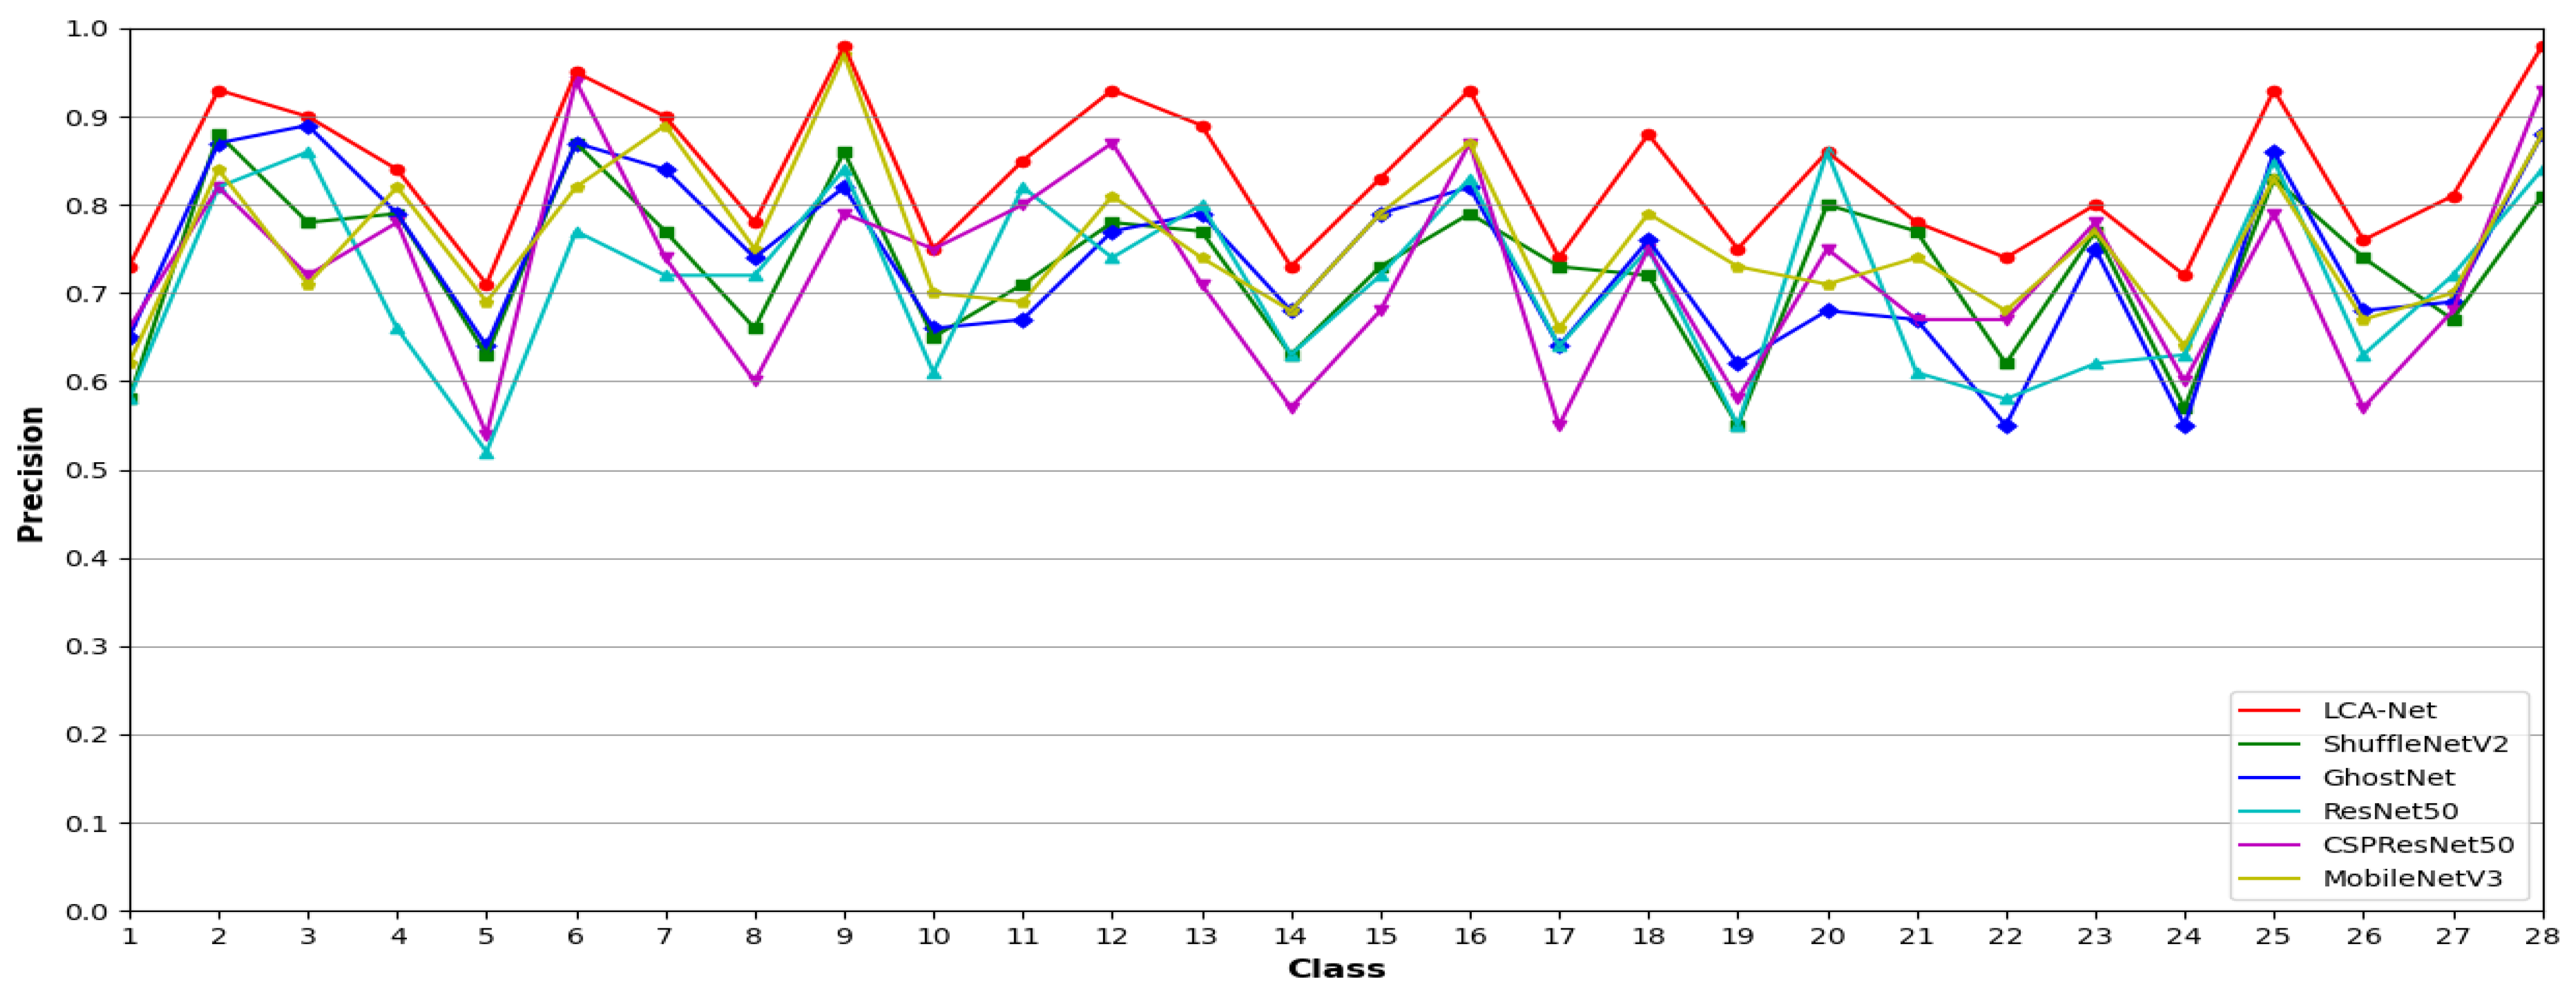
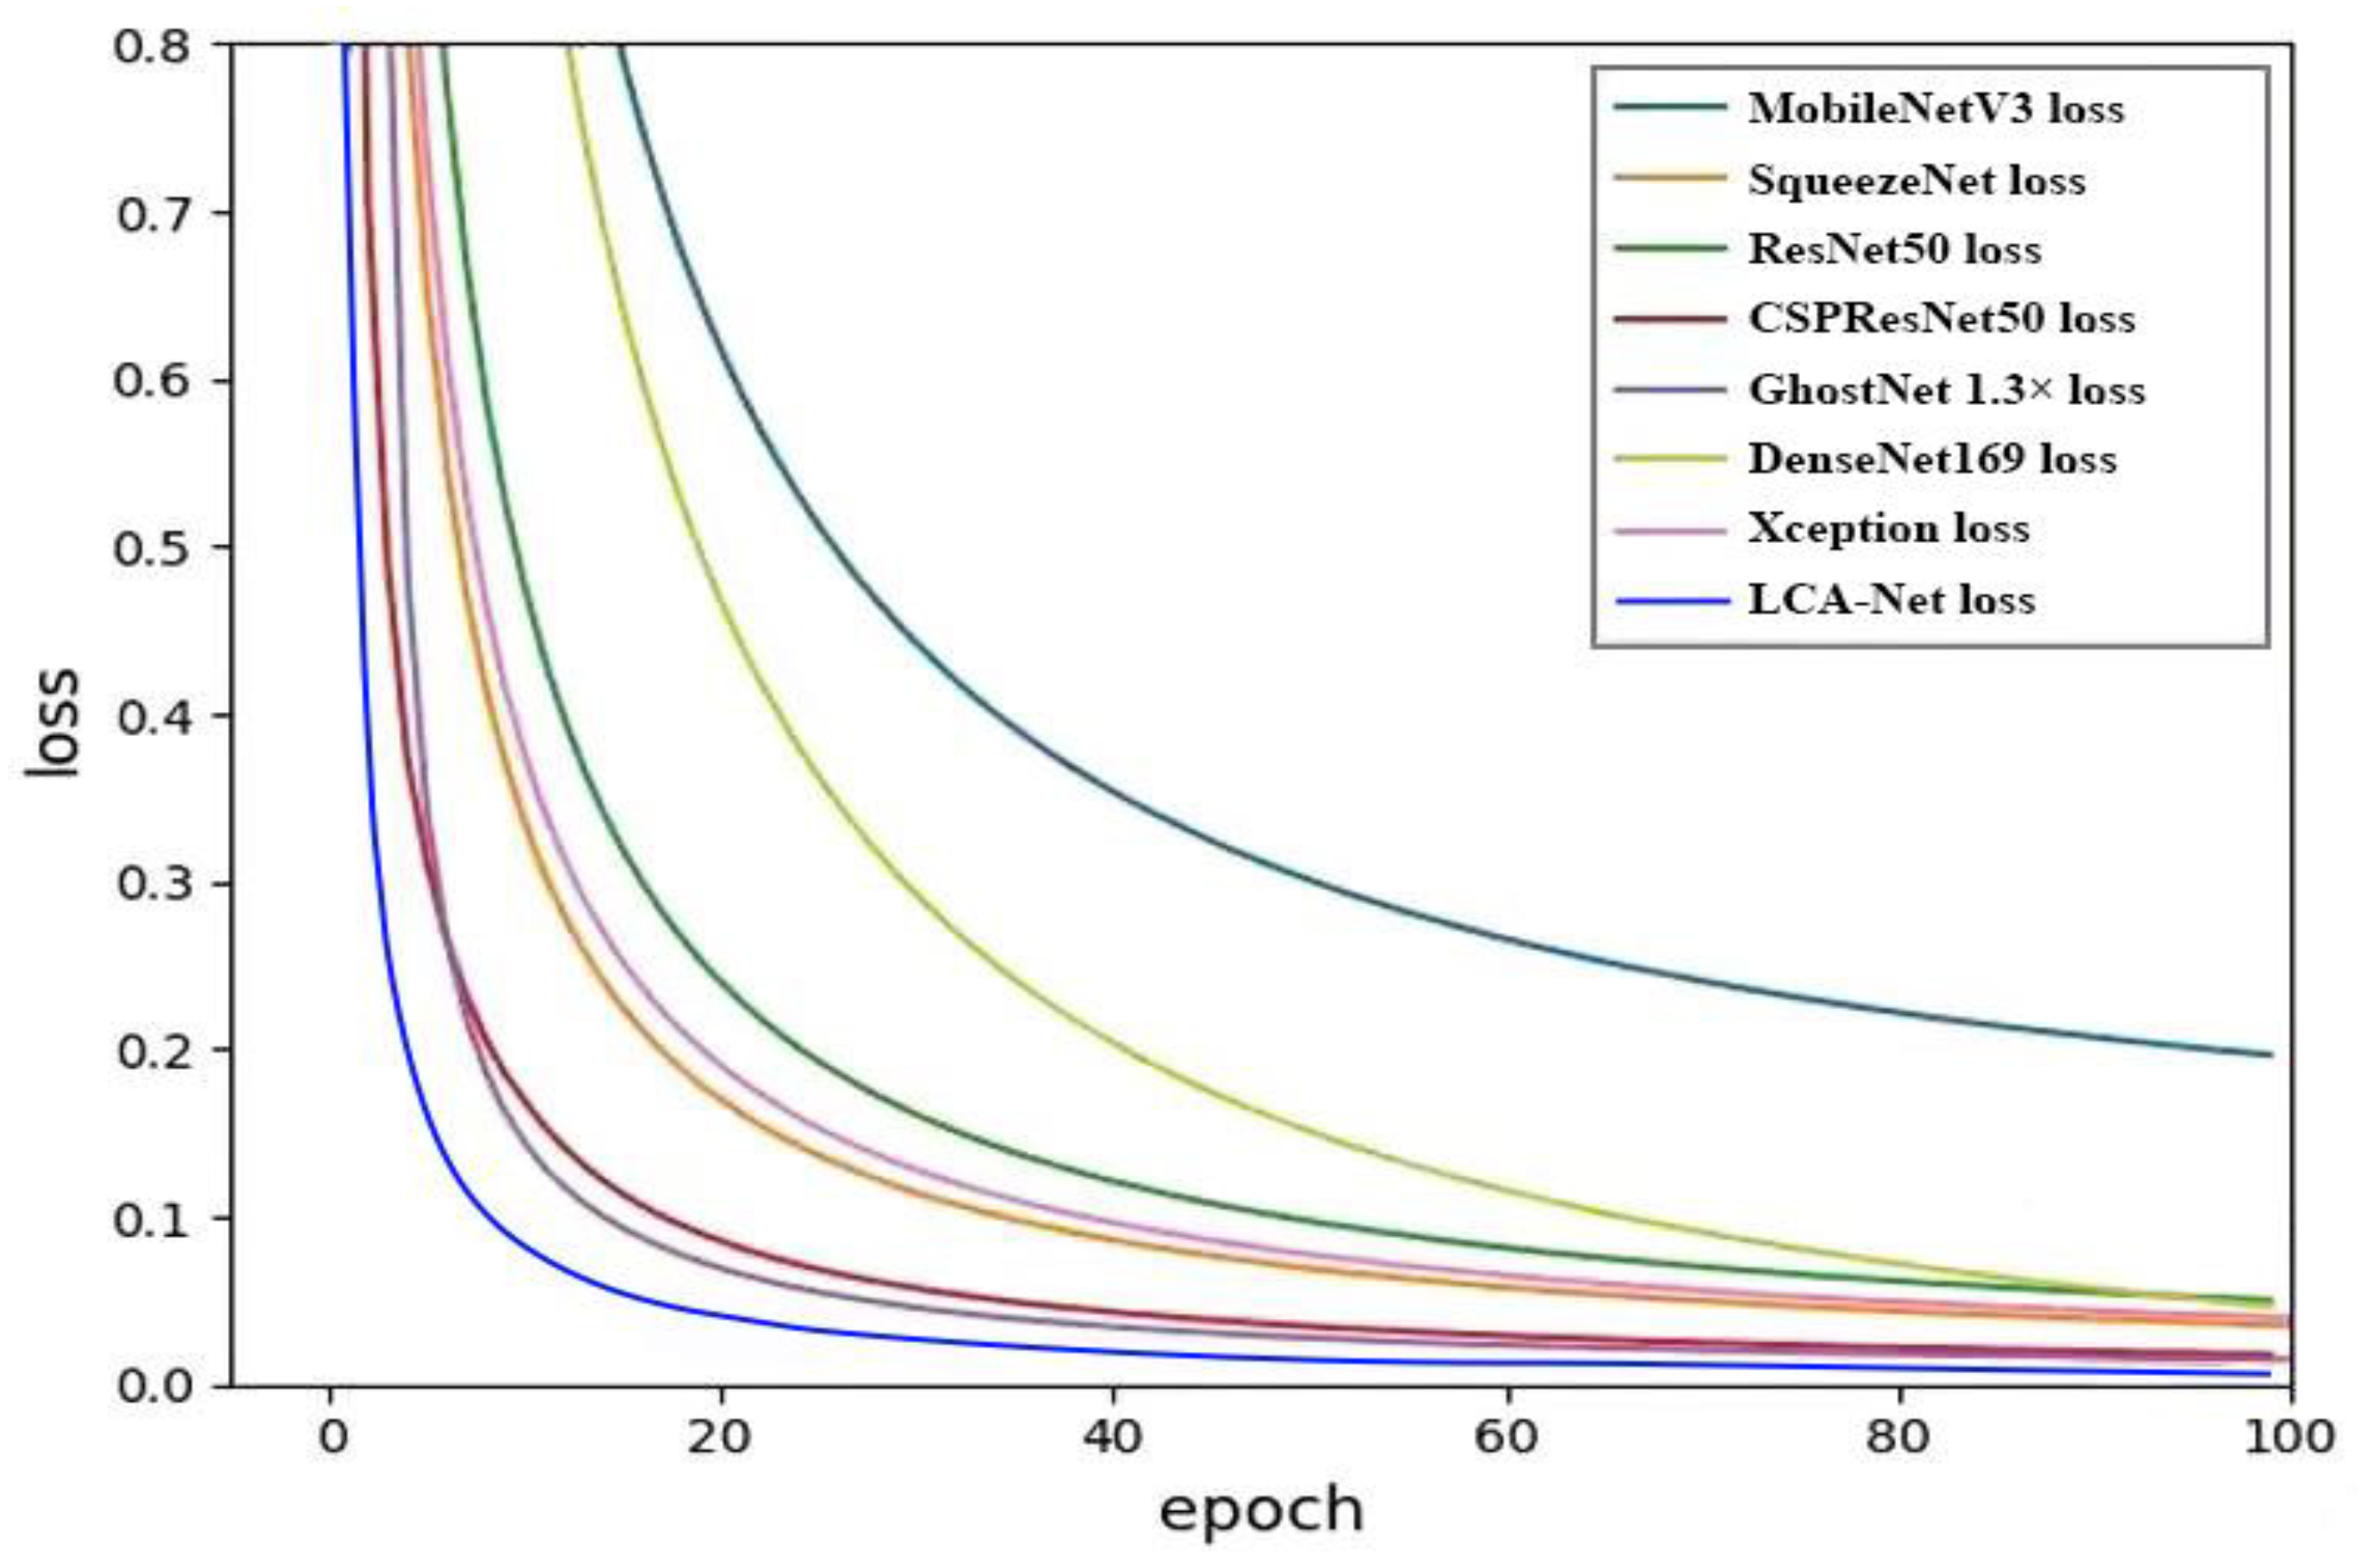
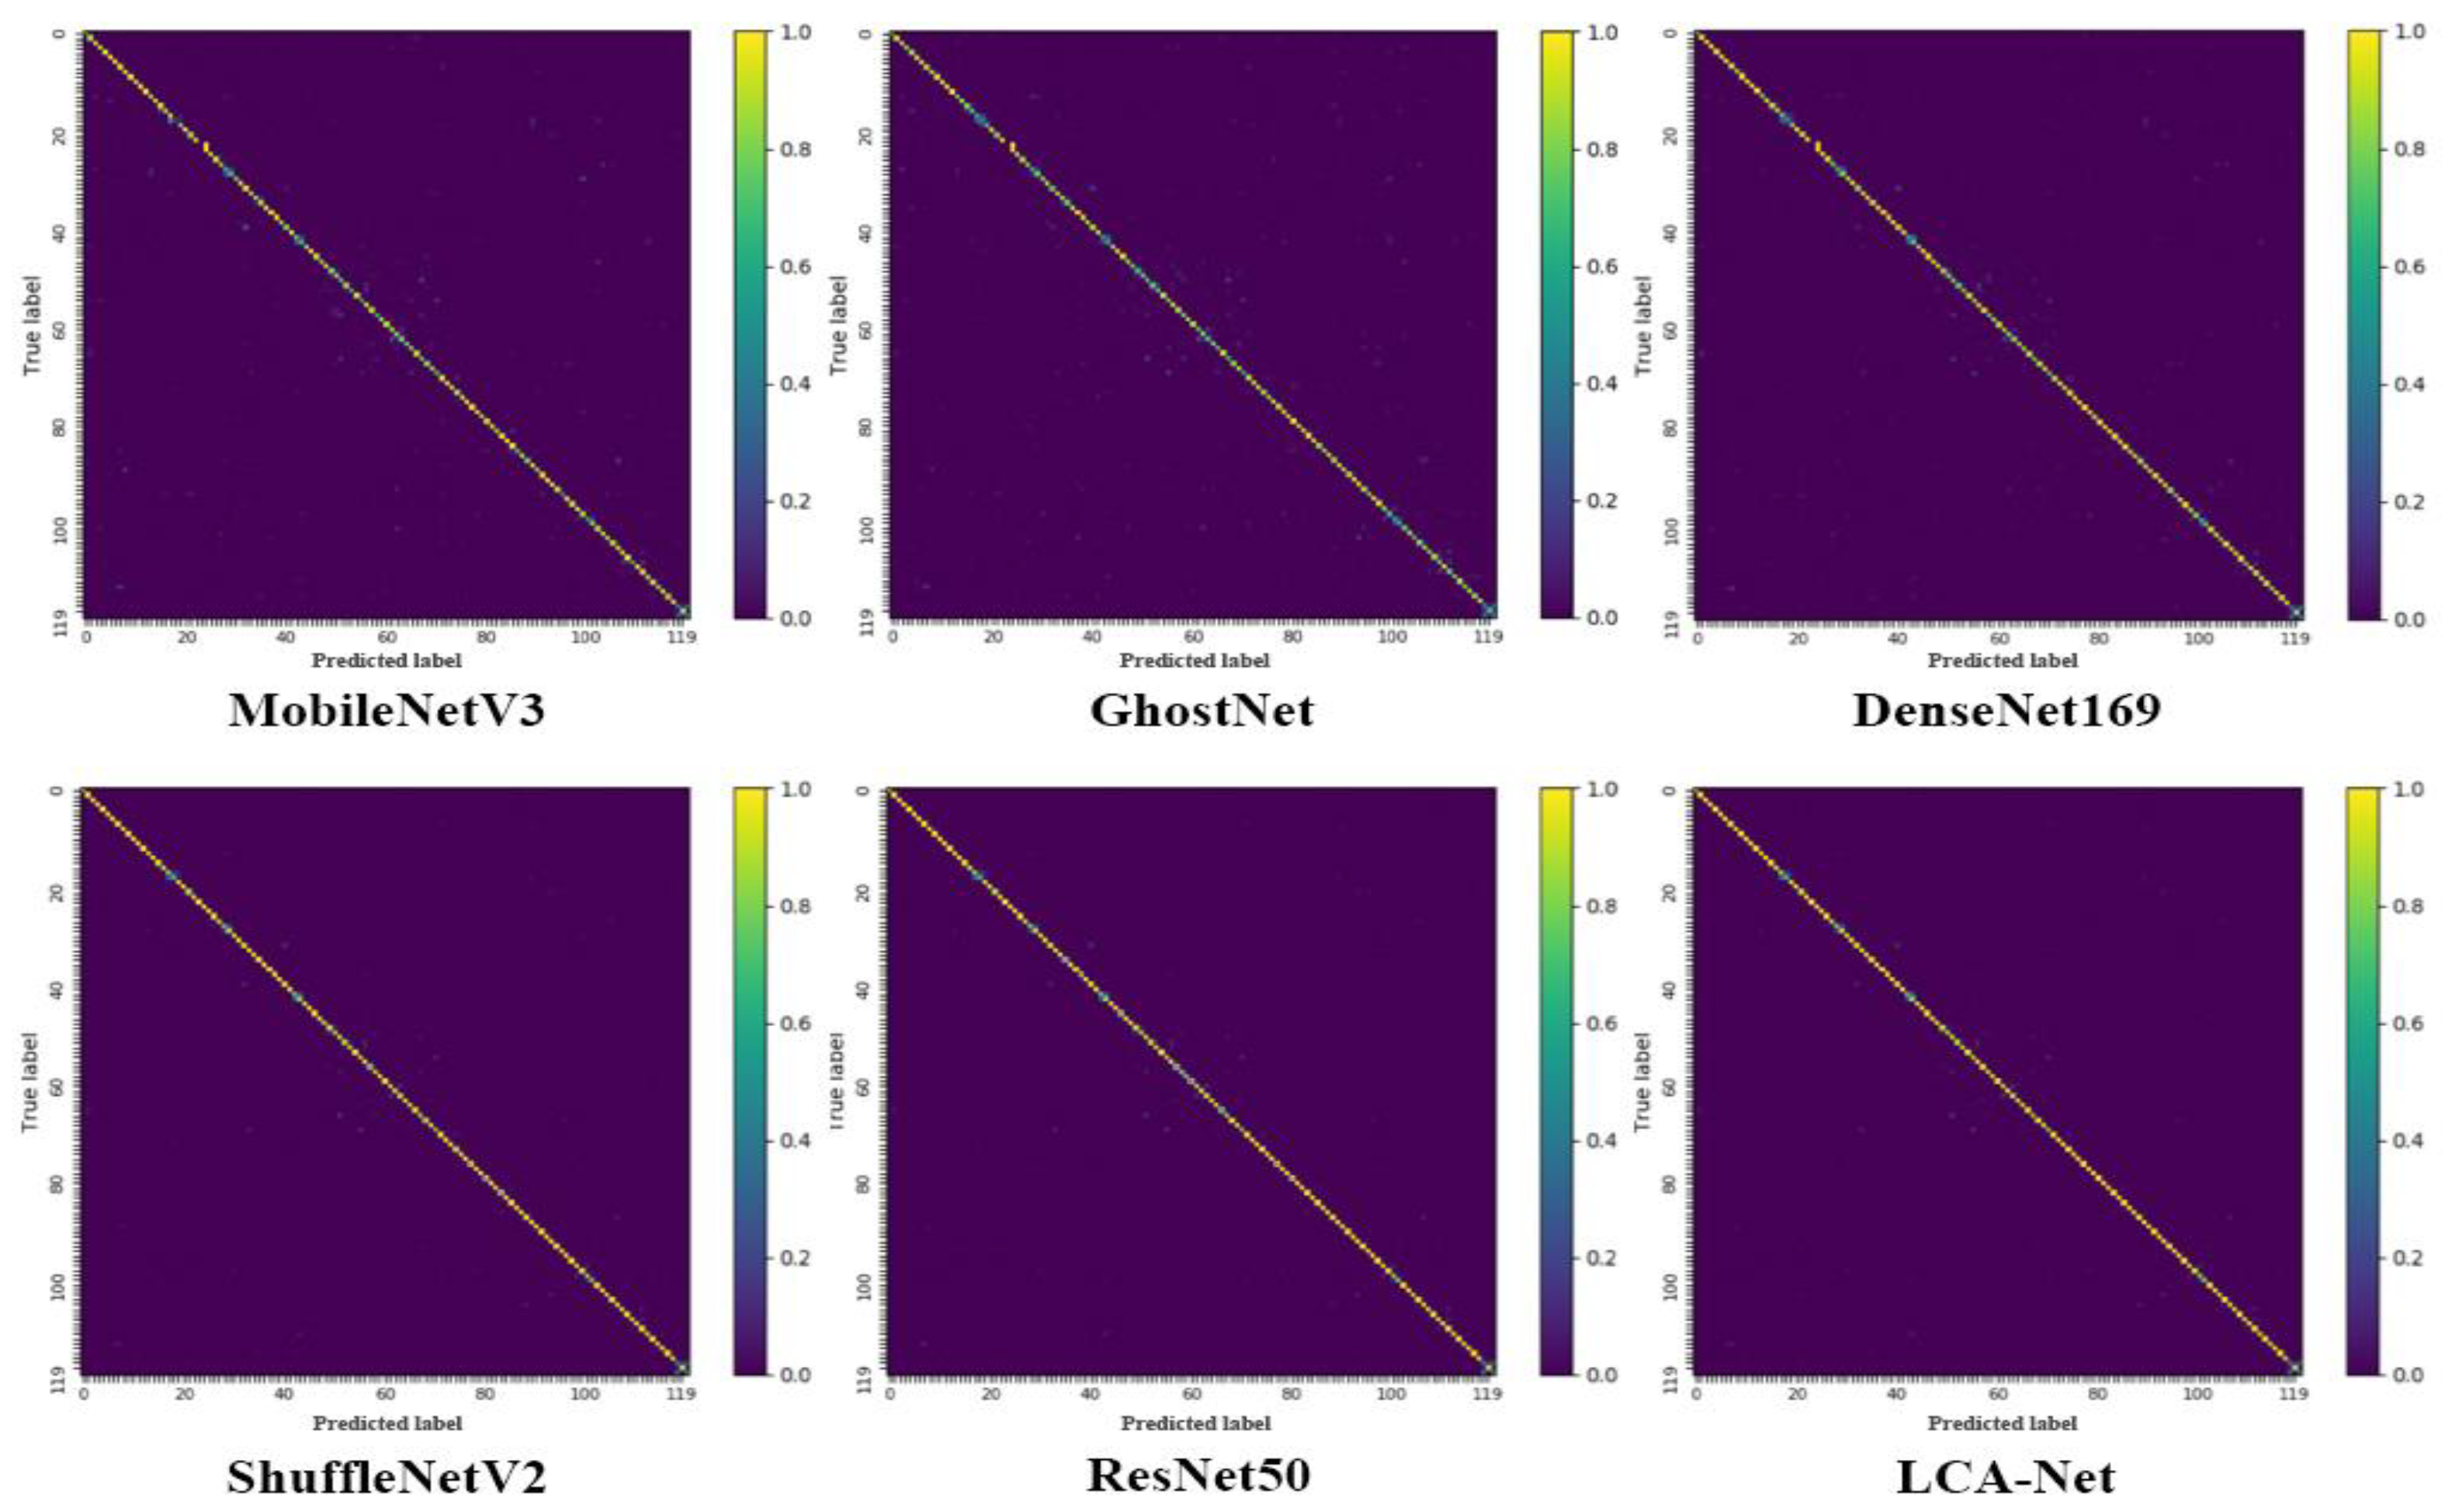
4.2. Comparative Experimental Results

To validate the classification efficacy of the introduced LCA-Net in the context of the pest dataset, a series of pertinent experiments were conducted. The assessment criterion for model performance was established as accuracy. The following sections detail the experimental results of various lightweight models and traditional methods and compare them with the methods presented in this study. Table 1 presents a comparative overview of accuracy among all the methods employed for a more comprehensible illustration.
Upon inspection of the aforementioned table, it can be seen that although the lightweight models MobileNetV3, SqueezeNet, and ShuffleNetV2 have obvious advantages in terms of model parameters and recognition speed, their accuracies often fall short of the requirements of practical applications. For example, GhostNet 1.3×, which is recognized as the best lightweight model, has an accuracy rate of only 71.8%. This highlights the great limitations of the traditional lightweight model, which is affected by the model size and computational volume, when facing pest and disease images of complex scenes, thus hindering the extraction of discriminative features. Among the traditional image classification networks, ResNet50 achieves an accuracy of 73.2%, but due to its large number of layers and parameters, it may take longer to train compared to shallower models, which may not be suitable for application scenarios that require fast training or iteration; DenseNet169 achieves the highest accuracy of 76.9%. However, the embedded feature reuse in the DenseNet architecture reduces the speed of operation. Compared to CSPResNet50, the accuracy is slightly improved by 1.6%, but this improvement requires an additional 57.5% of processing time. This situation again justifies the choice of CSPResNet50 as the augmented model in this study. The novel LCA-Net outlined in this paper refines the structure and parameter optimization of CSPResNet50. The introduction of a lightweight convolutional attention module can substantially improve the parameter performance without compromising network performance. Compared to CSPResNet50, LCA-Net reduces the number of parameters by 27.8%, significantly improves the time efficiency by 79.9%, and achieves 83.8% accuracy. This result highlights the ability of the deep ensemble structure to improve model recognition accuracy. In addition, to better represent the advantages of the LCA-Net model, we visualized the classification accuracy of the model for 28 types of pests and diseases, as shown in Figure 7.
As shown in the figure above, we visualize the accuracy performance of the six models in 28 categories of pests and diseases, which are Fall-A, Cnaphalo-C-M, SchizaphisG, Aphis-G, Citrus-Y, Leptinotarsa-D, Pergandc, Pear-F-B, Locustamigratoria, Cydia-P, Puccinia-S, Blumeria-G, Loxostege-S, Ostrinia-F, Gibberella-S, Tomato-G-M, Mythimna-S, Sitodiplosis-M, Ricc-B. Peronospora-P, Chilo-S, Linnaeus, Sphaero-C, Southern-R-B, Nilaparvata-l, Westwood, Potato-L, Peronospora-M. It can be seen that in class 12 of the dataset, ShuffleNetV2’s accuracy reaches 78.7% and MobileNetV3’s accuracy is 80. 9%, which is enough to show that ShuffleNetV2 performs poorly when facing certain complex real-world scenarios due to the limitations of model size and computation. CSPResNet50 introduces the cross-stage partial structure based on ResNet50 to verify the model’s performance and representation capability, and its accuracy reaches 88.2%, while the accuracy of LCA-Net reaches 92.3%, which shows that the fusion technique effectively suppresses the intraclass variation of the same subclass of different images in the sample. After adopting the fusion method with complementary feature information, the classification accuracy of LCA-Net model in 28 classes reaches 98.5%. Throughout the classification process, LCA-Net outperforms the comparison models in each class of data with its powerful feature mining and generalization capabilities and is the best among all models in terms of accuracy and stability. In order to demonstrate the effectiveness of the lightweight structure, we conducted an experimental analysis of the model’s parameters and computational speed, as shown in Figure 8.
Illustrated in Figure 8, the LCA-Net proposed in this study attains commendable performance across various metrics. Remarkably, while exhibiting a mere 1.8% increment in parameter count relative to ShuffleNetV2, a notable 17.5% enhancement in accuracy is achieved. In contrast, when compared to ResNet50, parameters are significantly reduced by 75.6%, recognition time is trimmed by 28.6%, and accuracy experiences a commendable 14.4% uptick. The incorporation of lightweight modules, in tandem with the feature pyramid module, contributes to these outcomes. Compared with MobileNet V3, although the model witnesses a 35.3% surge in parameter volume and a 54.4% rise in time consumption, accuracy enjoys a notable 19% boost. This substantiates the efficacy of the feature pyramid module and the convolutional feature aggregation (CFA) module, centered around maximum response area clipping, both introduced in this study. Furthermore, the lightweight attention module’s effectiveness is underscored. The combination of these three modules collectively empowers the model to extract features efficiently, elevate recognition accuracy, and achieve parameter reduction, all while satisfying the requirements of mobile deployment and practical applications.
In addition, we visualized the loss curves of the model, as shown in Figure 9. The loss function serves to gauge the correspondence between the model’s predicted output and the actual value, manifesting as a nonnegative quantity. Typically, loss functions incorporate L1 or L2 regularization terms. A small loss function value corresponds to a more favorable model training outcome. Consequently, a more skillful model is characterized by a heightened fit. Notably, a swift descent in the loss function underscores the model’s robust learning capacity.
Upon scrutinizing and dissecting the graphs of the loss functions, a noticeable trend emerges in the classification model’s loss function values: a gradual descent that ultimately stabilizes after roughly 90 epochs. During this phase, the predicted values converge more closely to the actual values. Noteworthy patterns emerge when comparing these loss functions. ResNet50 and DenseNet169 exhibit a gradual decline in their loss functions, while the LCA-Net model demonstrates the swiftest rate of decrease, ultimately settling at approximately 0.0084. In contrast, Xception and CSPResNet50 undergo a slower decrease in loss function, ultimately plateauing around 0.0186. The LCA-Net model enhances the CSPNet module, combines the feature pyramid module grounded in maximum region clipping, and leverages the capacity of the lightweight convolutional attention enhancement model to elevate feature extraction capabilities. Consequently, this fusion model excels in feature extraction, resulting in improved classification of crop images and heightened accuracy. This leads to a comprehensive examination of the confusion matrix.
The background, shape, and other factors of the images contained in each category cause the model to misclassify them into other categories, reducing the overall accuracy of the model. To better analyze which categories the model classifies incorrectly, carry out the confusion matrix analysis. The confusion matrix of the final test result is provided, and the confusion matrices of LCA-Net and the five contrasting models are calculated, respectively. The confusion matrix compares the real category with the predicted category, which describes the individual classification accuracy for each model. The network’s performance can be directly evaluated by analyzing the confusion matrix, which can help analyze which similar categories the model misclassifies, to adjust the model and optimize its classification performance. It can be seen from Figure 10 that the five models, MobileNetV3, GhostNet, ShuffleNetV2, ResNet50, and DenseNet169, have low prediction and real correlation, which indicates that the network is not easy to judge the similarity category, resulting in low detection accuracy. The LCA-Net model can classify similar objects with accurate judgment, good classification can be performed, so the prediction and the actual correlation are relatively high, thereby improving the model recognition accuracy.
As shown in Table 2, in order to further test the generalization ability and generalizability of the models, we divided the dataset into different ratios for training and testing the models: Xception and SqueezeNet have 68.1% and 70.2% accuracy when the ratio of the number of training images to the number of testing images is 8:2, and when the ratio is adjusted to 6:4, due to the lighter model’s fewer parameters and shallower network structure, it is unable to capture the complex data distribution when the overall proportion of the training dataset decreases, and its accuracy decreases by 3.5% and 3.8%, respectively. Large algorithmic models with numerous parameters and complex structures require a large amount of data to properly tune these parameters, and when the training set is small, the model may have difficulty in finding suitable parameters, which leads to poor model performance. The accuracy comparison between DenseNet169 and CSPResNet50 with a training set to test set ratio of 6:4 decreased by 2.2% and 2.4%, respectively, compared to a ratio of 8:2. While LCA-Net in the dataset division ratio of 7:3 and 6:4, the accuracy only decreased by 0.6% and 1.3%; this is enough to show that the cross-level aggregation network maintains the lightweight structured at the same time through the attention mechanism of the original features of the attention weighting, to complete the original features of the recalibration, so as to make the characteristics of the object in the image is more prominent, and to enhance the expressive ability of the network, as well as based on the Cut-Max-based feature fusion mechanism to fuse features at different levels, so that the feature mining and generalization ability of the model is further enhanced, which is far better than the performance of the comparison models executed on different dataset division ratios.

4.3. Experimental Analysis and Discussion

Meanwhile, this paper conducts ablation experiments on LCA-Net to prove the effectiveness of each module. The experimental results are shown in Table 3. The backbone network proposed in this paper, LCA-Net, achieves an accuracy of 83.8% on the pest and disease dataset. When integrating the feature pyramid module alone to extract multigranularity features, the model demonstrates an accuracy of 78.1%. This improvement is 1.2% higher compared to the original unmodified network, underscoring the significance of multilevel features in recognition. Shallow features, containing richer semantic information, prove to be beneficial for image classification tasks. Building upon this foundation, the efficacy of the combined Cut-Max method and feature pyramid module is validated. Experimental results highlight that the Cut-Max operation reduces the impact of background noise, leading to an enhanced performance. In contrast to solely adding the feature pyramid module, incorporating Cut-Max results in an increase of 2.1%, resulting in an accuracy of 80.2%.
Similarly, adding the FA module alone yields an accuracy of 77.2%. By combining the feature pyramid, Cut-Max, and FA modules, the model attains an accuracy of 83.8%. This attests to the potency of the proposed method, which synergizes multilayer semantic insights from shallow, middle, and deep features to enhance feature extraction. The results reaffirm the rationale and effectiveness of the devised model structure. This paper also conducts a comparative experiment to explore the optimal window size setting for the Cut-Max module. The Cut-Max module enhances the features by cropping the maximum response regions, effectively removing background noise interference in the feature maps. However, when the window size is set to 2 × 2, the accuracy achieved is only 78.2%, indicating that if the cropping window is too small, and some useful information might be lost, leading to a decrease in performance. To address this, increasing the window size results in improved accuracy, reaching the optimal accuracy of 83.8% when the window size was set to 5 × 5. However, further increasing the window size leads to slightly decreased accuracy. This suggests that when the window size becomes too large, useful information from high-response regions and background noise is included in the window, making it challenging to extract distinctive local features. By setting the window size to 5 × 5, the Cut-Max operation on features at each layer, followed by convolutional aggregation of the information within all channels, minimizes model bias caused by background factors and enhances the model’s ability to capture relevant information.
In addition, we performed attention visualization of three insect pests and three disease pictures to analyze the effect of the LCA-Net structure. The visualization results are shown in Figure 11. Our model, along with fusing the different stages of the shallow middle stage, can identify features such as a specific pest’s tail, trunk, and head. This demonstrates that fusing different feature layers and maximum response region cropping facilitates global object learning. In addition, the fusion of different layers of features can compensate for neglected but effective distinguishing features in a particular stage. These results demonstrate the model’s ability to detect targets of various scales accurately, with particularly impressive performance in detecting fine-grained objects. It reveals the application potential of the LCA-Net model in other research fields, such as agricultural logistics or environmental forecast. Meanwhile, it inspires the improvement of related technologies in smart agricultural production management.

5. Conclusions

Smart agriculture has transformed traditional planting practices into an efficient and technologically advanced system. It improves agricultural productivity and crop quality using unmanned robots/drones, high-precision sensors, intelligent edge computing nodes, and cloud analysis computing. These technologies have the potential to revolutionize crop cultivation. Image analysis and machine learning techniques play a vital role in automatic identification and classification of pests and diseases in agricultural images, facilitating efficient pest and disease management in agriculture.
This paper provides insights into the challenges posed by complex model structures and excessive parameter counts that hinder deployment feasibility. The complex agricultural image classification environment leads to unsatisfactory recognition accuracy and too many parameters. In order to address these challenges, this study utilizes the capabilities of deep learning techniques and introduces an innovative underlying network known as the horizontally aggregated image recognition model (LCA-Net). This network enhances the existing CSPNet architecture by incorporating a feature aggregation (FA) module and a lightweight convolutional attention module, as well as a feature fusion structure based on the Cut-Max module, which improves the network’s emphasis on regions of interest by adding additional weights to the original feature map, and also improves the ratio of deeper and shallower features by adding different stages of the output channels in order to connect the structure across layers, which enables the network to achieve more efficient feature representation with fewer layers, realizing a harmonious balance between accuracy and efficiency. In a low-error environment, LCA-Net significantly outperforms all similar methods and becomes the best choice for real image recognition scenarios.
Although LCA-Net is good enough, it still suffers from limitations inherent to fine-grained classification models, such as the scarcity of fine-grained classification data, which makes it difficult for the model to adequately learn and generalize features. Going forward, our research efforts will focus on generating rich training data through methods such as generative adversarial networks (GANs). We will also investigate LCA-Net-based detection algorithms to make the model capable of tasks such as target localization and bounding box regression and extend the application of related techniques to different domains. This commitment aims to utilize its potential to contribute to various global environments.

Author Contributions

Conceptualization, J.K.; methodology, J.K. and X.J.; software, Y.X.; validation, Y.X.; formal analysis, Y.X. and Y.C.; investigation, C.D.; resources, C.D.; data curation, Y.X.; writing—original draft preparation, J.K.; writing—review and editing, X.J. and Y.C.; visualization, C.D. and Y.B.; supervision, X.J.; project administration, Y.B.; funding acquisition, X.J. All authors have read and agreed to the published version of the manuscript.

Funding

This work was supported in part by the National Key Research and Development Program of China (No. 2021YFD2100605), National Natural Science Foundation of China (No. 62006008, 62173007, 62203020), Open project of China Food Flavor and Nutrition Health Innovation Center of Beijing Technology and Business University (No. CFC2023B-031), and Project of Beijing Municipal University Teacher Team Construction Support Plan (No. BPHR20220104).

Institutional Review Board Statement

Not applicable.

Data Availability Statement

The data can be made available by contacting the corresponding authors.

Conflicts of Interest

The authors declare no conflict of interest.

References

  1. Zheng, Y.-Y.; Kong, J.-L.; Jin, X.-B.; Wang, X.-Y.; Su, T.-L.; Zuo, M. CropDeep: The Crop Vision Dataset for Deep-Learning-Based Classification and Detection in Precision Agriculture. Sensors 2019, 19, 1058. [Google Scholar] [CrossRef]
  2. Kong, J.; Wang, H.; Yang, C.; Jin, X.; Zuo, M.; Zhang, X. Fine-grained pests & diseases recognition via Spatial Feature-enhanced attention architecture with high-order pooling representation for precision agriculture practice. Agriculture 2022, 2022, 1592804. [Google Scholar]
  3. Jin, X.-B.; Wang, Z.-Y.; Kong, J.-L.; Bai, Y.-T.; Su, T.-L.; Ma, H.-J.; Chakrabarti, P. Deep Spatio-Temporal Graph Network with Self-Optimization for Air Quality Prediction. Entropy 2023, 25, 247. [Google Scholar] [CrossRef]
  4. Kong, J.; Wang, H.; Yang, C.; Jin, X.; Zuo, M.; Zhang, X. A spatial feature-enhanced attention neural network with high-order pooling representation for application in pest and disease recognition. Agriculture 2022, 12, 500. [Google Scholar] [CrossRef]
  5. Jin, X.-B.; Wang, Z.-Y.; Gong, W.-T.; Kong, J.-L.; Bai, Y.-T.; Su, T.-L.; Ma, H.-J.; Chakrabarti, P. Variational Bayesian Network with Information Interpretability Filtering for Air Quality Forecasting. Mathematics 2023, 11, 837. [Google Scholar] [CrossRef]
  6. Kong, J.L.; Wang, H.X.; Wang, X.Y.; Jin, X.B.; Fang, X.; Lin, S. Multi-stream hybrid architecture based on cross-level fusion strategy for fine-grained crop species recognition in precision agriculture. Comput. Electron. Agric. 2021, 185, 106134. [Google Scholar] [CrossRef]
  7. Ye, M.; Ruiwen, N.; Chang, Z. A lightweight model of VGG-16 for remote sensing image classification. IEEE J. Sel. Top. Appl. Earth Obs. Remote Sens. 2021, 14, 6916–6922. [Google Scholar] [CrossRef]
  8. Wang, C.Y.; Liao, H.Y.M.; Wu, Y.H.; Chen, P.Y.; Hsieh, J.W.; Yeh, I.H. CSPNet: A new backbone that can enhance learning capability of CNN. In Proceedings of the IEEE/CVF Conference on Computer Vision and Pattern Recognition Workshops, Seattle, WA, USA, 14–19 June 2020; pp. 390–391. [Google Scholar]
  9. Wei, D.; Chen, J.; Luo, T. Classification of crop pests based on multi-scale feature fusion. Comput. Electron. Agric. 2022, 194, 106736. [Google Scholar] [CrossRef]
  10. Xing, S.; Lee, H.J. Crop pests and diseases recognition using DANet with TLDP. Comput. Electron. Agric. 2022, 199, 107144. [Google Scholar] [CrossRef]
  11. Lin, T.L.; Chang, H.Y.; Chen, K.H. The pest and disease identification in the growth of sweet peppers using faster R-CNN and mask R-CNN. J. Internet Technol. 2020, 21, 605–614. [Google Scholar]
  12. Akhal, E.H.; Yahya, A.B.; Moussa, N. A novel approach for image-based olive leaf diseases classification using a deep hybrid model. Ecol. Inform. 2023, 77, 102276. [Google Scholar] [CrossRef]
  13. Singh, A.K.; Sreenivasu, S.V.N.; Mahalaxmi, U. Hybrid feature-based disease detection in plant leaf using convolutional neural network, bayesian optimized SVM, and random forest classifier. J. Food Qual. 2022, 2022, 2845320. [Google Scholar] [CrossRef]
  14. Kong, J.-L.; Fan, X.-M.; Jin, X.-B.; Su, T.-L.; Bai, Y.-T.; Ma, H.-J.; Zuo, M. BMAE-Net: A Data-Driven Weather Prediction Network for Smart Agriculture. Agronomy 2023, 13, 625. [Google Scholar] [CrossRef]
  15. Krizhevsky, A.; Sutskever, I.; Hinton, G.E. Imagenet classification with deep convolutional neural networks. Adv. Neural Inf. Process. Syst. 2012, 25, 1097–1105. [Google Scholar] [CrossRef]
  16. He, K.; Zhang, X.; Ren, S. Deep residual learning for image recognition. In Proceedings of the IEEE Conference on Computer Vision and Pattern Recognition, Providence, RI, USA, 16–21 June 2016; pp. 770–778. [Google Scholar]
  17. Ge, Z.; Bewley, A.; Mccool, C. Fine-grained classification via mixture of deep convolutional neural networks. In Proceedings of the 2016 IEEE Winter Conference on Applications of Computer Vision (WACV), Lake Placid, NY, USA, 7–10 March 2016; pp. 1–6. [Google Scholar]
  18. Tiwari, V.; Joshi, R.C.; Dutta, M.K. Dense convolutional neural networks based multiclass plant disease detection and classification using leaf images. Ecol. Inform. 2021, 63, 101289. [Google Scholar] [CrossRef]
  19. Kang, G.; Hou, L.; Zhao, Z. Research on the Application of Convolutional Neural Network Based on YOLO Algorithm in Pest Small Target Detection. In Proceedings of the Asia-Pacific Conference on Communications Technology and Computer Science (ACCTCS), Shenyang, China, 24–26 February 2023; pp. 131–135. [Google Scholar]
  20. Li, Y.; Wang, H.; Dang, L.M. Crop pest recognition in natural scenes using convolutional neural networks. Comput. Electron. Agric. 2020, 169, 105174. [Google Scholar] [CrossRef]
  21. Istiak, M.A.; Syeed, M.M.M.; Hossain, M.S. Adoption of Unmanned Aerial Vehicle (UAV) imagery in agricultural management: A systematic literature review. Ecol. Inform. 2023. [Google Scholar] [CrossRef]
  22. Donahue, J.; Jia, Y.; Vinyals, O. Decaf: A deep convolutional activation feature for generic visual recognition. In Proceedings of the International Conference on Machine Learning, PMLR, Bejing, China, 21–26 June 2014; pp. 647–655. [Google Scholar]
  23. Huang, S.; Xu, Z.; Tao, D. Part-stacked cnn for fine-grained visual categorization. In Proceedings of the IEEE Conference on Computer Vision and Pattern Recognition, Las Vegas, NV, USA, 27–30 June 2016; pp. 1173–1182. [Google Scholar]
  24. Long, J.; Shelhamer, E.; Darrell, T. Fully convolutional networks for semantic segmentation. In Proceedings of the IEEE Conference on Computer Vision and Pattern Recognition, Boston, MA, USA, 7–12 June 2015; pp. 3431–3440. [Google Scholar]
  25. Wei, X.S.; Xie, C.W.; Wu, J. Mask-CNN: Localizing parts and selecting descriptors for fine-grained bird species categorization. Pattern Recognit. 2018, 76, 704–714. [Google Scholar] [CrossRef]
  26. Zhao, B.; Wu, X.; Feng, J. Diversified visual attention networks for fine-grained object classification. IEEE Trans. Multimed. 2017, 19, 1245–1256. [Google Scholar] [CrossRef]
  27. Fu, J.; Zheng, H.; Mei, T. Look closer to see better: Recurrent attention convolutional neural network for fine-grained image recognition. In Proceedings of the IEEE Conference on Computer Vision and Pattern Recognition, Honolulu, HI, USA, 21–26 July 2017; pp. 4438–4446. [Google Scholar]
  28. Zheng, H.; Fu, J.; Mei, T. Learning multi-attention convolutional neural network for fine-grained image recognition. In Proceedings of the IEEE International Conference on Computer Vision, Venice, Italy, 22–29 October 2017; pp. 5209–5217. [Google Scholar]
  29. Sun, M.; Yuan, Y.; Zhou, F. Multi-attention multi-class constraint for fine-grained image recognition. In Proceedings of the European Conference on Computer Vision (ECCV), Munich, Germany, 8–14 September 2018; pp. 805–821. [Google Scholar]
  30. Wang, Y.; Morariu, V.I.; Davis, L.S. Learning a discriminative filter bank within a cnn for fine-grained recognition. In Proceedings of the IEEE Conference on Computer Vision and Pattern Recognition, Salt Lake City, UT, USA, 18–23 June 2018; pp. 4148–4157. [Google Scholar]
  31. Yang, Z.; Luo, T.; Wang, D. Learning to navigate for fine-grained classification. In Proceedings of the European Conference on Computer Vision (ECCV), Munich, Germany, 8–14 September 2018; pp. 420–435. [Google Scholar]
  32. Liang, J.; Guo, J.; Liu, X. Fine-grained image classification with Gaussian mixture layer. IEEE Access 2018, 6, 53356–53367. [Google Scholar] [CrossRef]
  33. Zhuang, P.; Wang, Y.; Qiao, Y. Learning Attentive Pairwise Interaction for Fine-Grained Classification. In Proceedings of the AAAI Conference on Artificial Intelligence, New York, NY, USA, 7–12 February 2020; pp. 13130–13137. [Google Scholar]
  34. Iandola, F.N.; Hanm, S.; Moskewicz, M.W. SqueezeNet: AlexNet-level accuracy with 50x fewer parameters and <0.5 MB model size. arXiv 2016, arXiv:1602.07360. [Google Scholar]
  35. Howard, A.G.; Zhu, M.; Chen, B. Mobilenets: Efficient convolutional neural networks for mobile vision applications. arXiv 2017, arXiv:1704.04861. [Google Scholar]
  36. Sandler, M.; Howard, A.; Zhu, M. Searching for MobileNetV3. In Proceedings of the IEEE Conference on Computer Vision and Pattern Recognition, Long Beach, CA, USA, 15–20 June 2019; pp. 1314–1324. [Google Scholar]
  37. Zhang, X.; Zhou, X.; Lin, M. Shufflenet: An extremely efficient convolutional neural network for mobile devices. In Proceedings of the IEEE Conference on Computer Vision and Pattern Recognition, Salt Lake City, UT, USA, 18–23 June 2018; pp. 6848–6856. [Google Scholar]
  38. Ma, N.; Zhang, X.; Zheng, H.T. Shufflenet v2: Practical guidelines for efficient cnn architecture design. In Proceedings of the European Conference on Computer Vision (ECCV), Salt Lake City, UT, USA, 18–23 June 2018; pp. 116–131. [Google Scholar]
  39. Gao, H.; Wang, Z.; Cai, L. Channelnets: Compact and efficient convolutional neural networks via channel-wise convolutions. Adv. Neural Inf. Process. Syst. 2018, 43, 2570–2581. [Google Scholar] [CrossRef]
  40. Wang, R.J.; Li, X.; Ling, C.X. Pelee: A real-time object detection system on mobile devices. arXiv 2018, arXiv:1804.06882. [Google Scholar]
  41. Huang, G.; Liu, Z.; Van Der Maaten, L.; Weinberger, K.Q. Densely connected convolutional networks. In Proceedings of the IEEE Conference on Computer Vision and Pattern Recognition, Honolulu, HI, USA, 21–26 July 2017; pp. 4700–4708. [Google Scholar]
  42. Voulodimos, A.; Doulamis, N.; Doulamis, A.; Protopapadakis, E. Deep learning for computer vision: A brief review. Comput. Intell. Neurosci. 2018, 2018, 7068349. [Google Scholar] [CrossRef] [PubMed]
  43. Kong, J.; Fan, X.; Jin, X.; Lin, S.; Zuo, M. A Variational Bayesian Inference-Based En-Decoder Framework for Traffic Flow Prediction. IEEE Trans. Intell. Transp. Syst. 2023. [Google Scholar] [CrossRef]
  44. Lu, J.; Tan, L.; Jiang, H. Review on Convolutional Neural Network (CNN) Applied to Plant Leaf Disease Classification. Agriculture 2021, 11, 707. [Google Scholar] [CrossRef]
  45. Jin, X.; Zhang, J.; Kong, J.; Su, T.; Bai, Y. A Reversible Automatic Selection Normalization (RASN) Deep Network for Predicting in the Smart Agriculture System. Agronomy 2022, 12, 591. [Google Scholar] [CrossRef]
  46. Mishra, P.; Polder, G.; Vilfan, N. Close range spectral imaging for disease detection in plants using autonomous platforms: A review on recent studies. Curr. Robot. Rep. 2020, 1, 43–48. [Google Scholar] [CrossRef]
  47. Wu, X.; Zhan, C.; Lai, Y.K. Ip102: A large-scale benchmark dataset for insect pest recognition. In Proceedings of the IEEE/CVF Conference on Computer Vision and Pattern Recognition, Long Beach, CA, USA, 15–20 June 2019; pp. 8787–8796. [Google Scholar]
  48. Chollet, F. Xception: Deep Learning with Depthwise Separable Convolutions. In Proceedings of the IEEE Conference on Computer Vision and Pattern Recognition, Honolulu, HI, USA, 21–26 July 2017; pp. 1800–1807. [Google Scholar]
  49. Han, K.; Wang, Y.; Tian, Q. GhostNet: More Features from Cheap Operations. In Proceedings of the Conference on Computer Vision and Pattern Recognition, Long Beach, CA, USA, 15–20 June 2019; pp. 1577–1586. [Google Scholar]
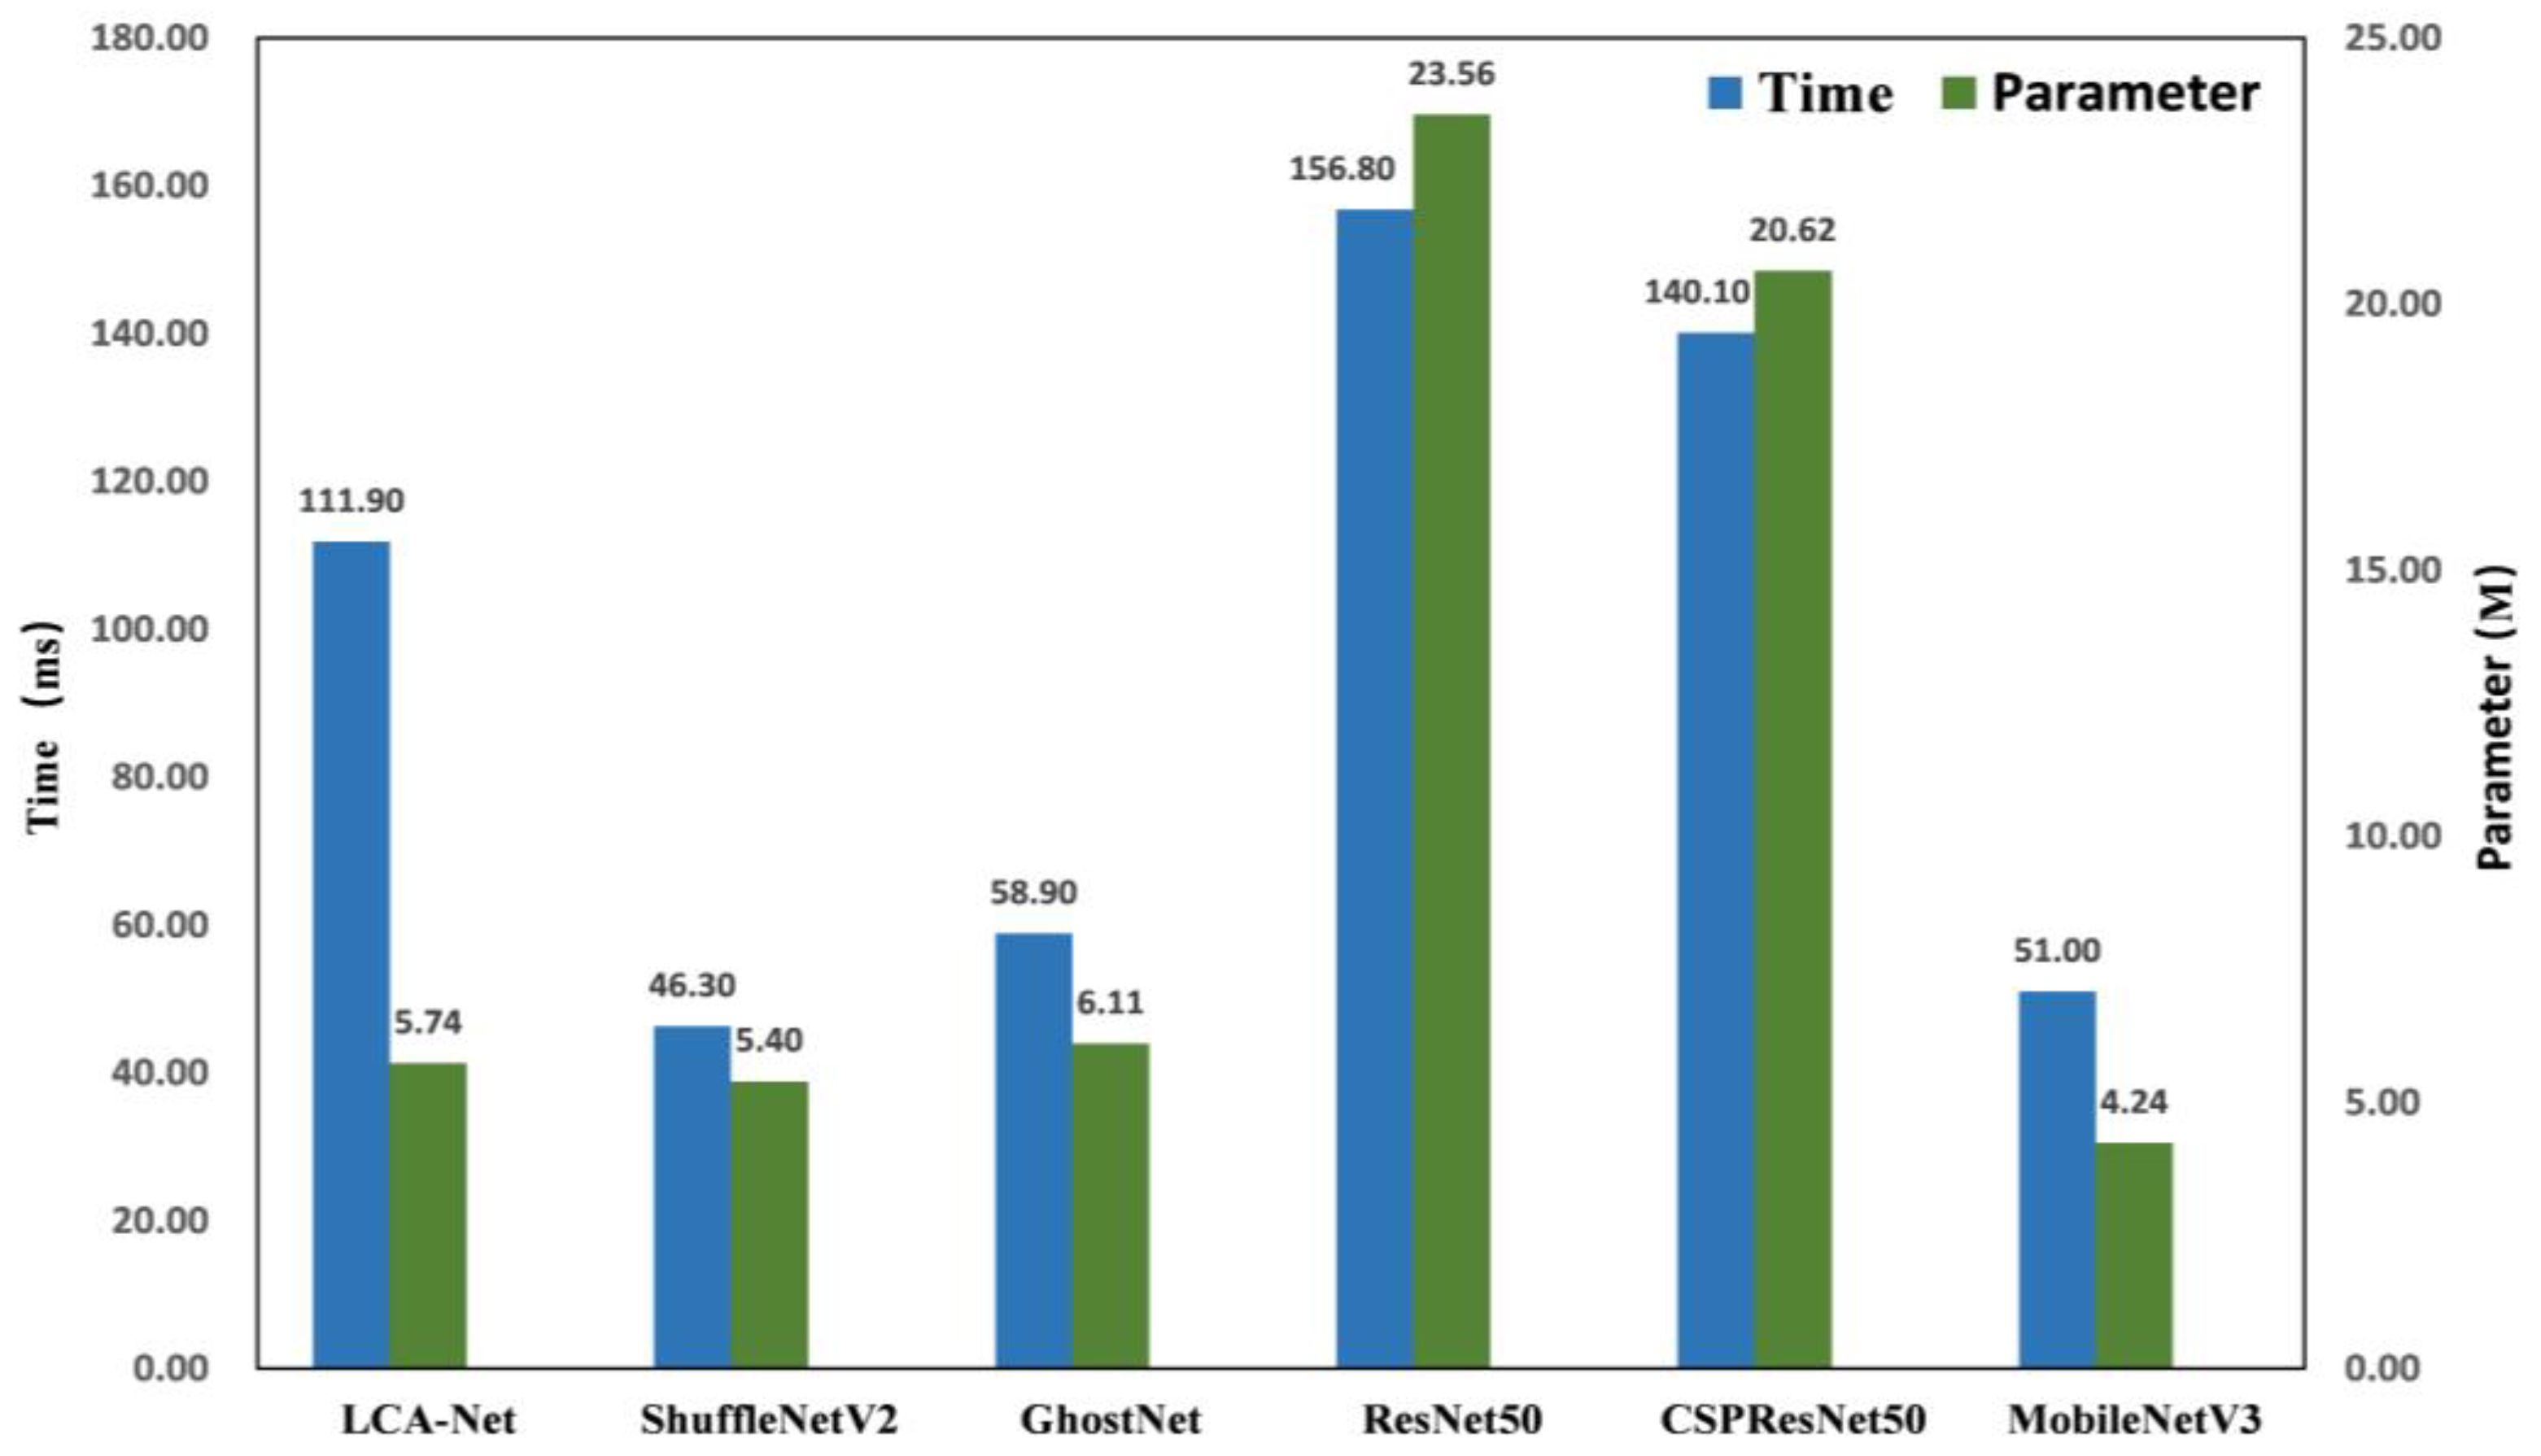
Figure 1. (a) Pyramid structure with maximum region response; (b) lightweight cross-stage aggregated neural network; (c) cross-stage feature aggregation module.
Agriculture 13 02080 g001
Figure 2. (a) CSPNet; (b) feature aggregation module; (c) integrated mainstream FA module.
Agriculture 13 02080 g002
Figure 3. Cross-stage feature aggregation module.
Agriculture 13 02080 g003
Figure 4. Pyramid structure with maximum region response; (a) original fusion structure; (b) fusion structure after adding Cut-Max.
Agriculture 13 02080 g004
Figure 5. LCA-Net flowchart.
Agriculture 13 02080 g005
Figure 6. Collected image samples of pest and disease dataset.
Agriculture 13 02080 g006
Figure 7. Multicategory comparison chart.
Agriculture 13 02080 g007
Figure 8. Comparison chart of parameter vs. computing time.
Agriculture 13 02080 g008
Figure 9. Comparison chart of loss convergence curves.
Agriculture 13 02080 g009
Figure 10. Confusion matrix maps.
Agriculture 13 02080 g010
Figure 11. Visualization comparison of different stage attentions.
Agriculture 13 02080 g011
Table 1. Performance contrast of different models.
ModelsAccuracy Rate (%)Number of Parameters (M)Time (ms)
MobileNetV3 1.0× [36]64.84.2451.0
ShuffleNetV2 2.0× [38]66.35.446.3
Xception [48]68.15.6150.9
SqueezeNet [34]70.25.8153.6
GhostNet 1.3× [49]71.86.1158.9
ResNet50 [16]73.223.56156.8
CSPResNet50 [8]75.320.62140.1
DenseNet169 [41]76.912.53220.7
LCA-Net83.85.74111.9
Table 2. Comparison results with different data settings.
ModelsTrain:Test
8:2 (Acc %)7:3 (Acc %)6:4 (Acc %)
MobileNetV3 1.0× [36]64.8%63.161.2
ShuffleNetV2 2.0× [38]66.3%64.262.4
Xception [48]68.166.964.6
SqueezeNet [34]70.268.666.4
GhostNet 1.3× [49]71.870.469.2
ResNet50 [16]73.270.367.8
CSPResNet50 [8]75.374.172.9
DenseNet169 [41]76.975.574.7
LCA-Net83.883.282.5
Table 3. LCA-Net ablation comparison experiment; “√” means that the module has been added.
FACSAFeature PyramidCut-MaxAcc (%)
77.2
77.9
78.1
80.2
81.5
82.3
83.8
Disclaimer/Publisher’s Note: The statements, opinions and data contained in all publications are solely those of the individual author(s) and contributor(s) and not of MDPI and/or the editor(s). MDPI and/or the editor(s) disclaim responsibility for any injury to people or property resulting from any ideas, methods, instructions or products referred to in the content.

