Abstract
Background and aim: Soil structure is an important indicator of the quality of soil, but detecting the early signs of soil degradation from soil structure is difficult. Developing precise instruments able to diagnose soil structure quickly is therefore critical to improve management practices. Here, the objective is to develop an instrument analysing the roughness of surfaces resulting from the fracture of soil cores, and to test the instrument’s ability to detect changes in soil structure cause by crop type and tillage. We have designed and constructed a 3D laser profilometer suitable for analysing standard soil cores. The 3D soil profiles were first assembled into a 3D surface using image analysis before roughness indicators could be computed. The method was tested by analysing how soil surface roughness was affected by crop varieties (barley and bean) and tillage (conventional tillage and no tillage). Results showed the method is precise and could reliably detect an influence of crop type and tillage on the roughness indicator. It was also observed that tillage reduced the difference in soil structure between the different cultures. Also, the soil in which barley grew had significantly lower roughness, irrespective of the tillage method. This could indicate that the roughness indicator is affected by biopores created by the root system. In conclusion, roughness indicators obtained from the fracture of soil cores can be easily obtained by laser profilometry and could offer a reliable method for assessing the effect of crop types and soil management on soil quality.
1. Introduction
Crop productivity is largely dependent on the quality of soils (soil structure, in particular), because of the multitude of services the soil must provide to a growing plant. Soil must retain water and dissolved mineral elements, it must enable aeration, maintain a diverse microbiome, and oppose minimal resistance to the elongation of roots [1,2]. The formation of soil structure, however, is a very slow process and agriculture itself can degrade the quality of soil at a greater rate than it can naturally regenerate [3,4,5]. It has been shown, for example, that soil management cause changes in soil density, porosity, surface roughness, soil organic matter, and microbial diversity [6,7,8,9]. Degraded soils, in turn, have lower water absorption and storage capacity, nutrient availability, and generally reduce the yield of the crop [2,10,11]. As a consequence, soils with similar mineralogy and climatic characteristics, subjected to different uses and management practices, may present different levels of degradation. This is notably the case for land subjected to tillage, which is known to cause significant soil degradation [12,13,14].
In conventional tillage, the soil is turned over by a plough to mix the top layer of soil (about 20 cm) and make it loose and a suitable surface for planting. This process involves revolving the surface layers of the soil to reduce compaction, incorporate correctives and fertilisers, and increase pore spaces, thus increasing hydraulic conductivity and storage of water and air [15]. This management helps the control of pests and pathogens that are present in the soil, and enhanced root growth. However, repeated use of tillage can lead to soil degradation, making it more susceptible to erosion, and preventing the formation of mechanical processes just below the surface layers moved by the equipment, which directly impairs the crop root development, resulting in losses in productivity [16].
No-tillage systems came out in the 1980s and are now mainly used in crops like soybean, corn, and wheat. They were shown to improve crop productivity and to help minimise the impact of agriculture on the environment by reducing soil erosion and leaching [17]. No-tillage is defined as a method of cultivation without inverting the soil layers, in which seeds are introduced directly. Minimal soil disturbance, achieved through the absence of ploughing or harrowing, aims to preserve the soil structure and a beneficial habitat for soil microbiome, an important characteristic of fertile soils. No-tillage management systems were originally developed as a water and soil conservation measure, but farmers have since adopted them to increase soil organic matter and reduce fuel and labour costs, reducing the time required for field operations [18]. In these cases, it has been observed that, together with the use of cover crops and input of crop residues, the system reduces run-off, increases infiltration, and reduces the risk of soil erosion [19,20].
Soil structure is typically assessed using its mechanical properties. A soil block is broken by hand, and the shape, porosity, and presence of roots are used to rate the quality of the soil [21,22,23]. However, such assessments lack precision (a one-digit score is obtained) and are subjective. Laboratory techniques such as aggregate stability [19,24] or a range of other mechanical tests [25,26] can provide information on the soil quality, but these measurements are more fastidious and cannot be easily adapted to field conditions. It has been proposed that to analyse soil structure, one could analyse the morphology of the surface of the soil after it has been fractured. It is well known that the topography of the surface resulting from a fracture reveals the properties of a material as well as the stress causing the fracture. This knowledge is commonly used in material sciences to diagnose the cause of failure of structures [27,28,29]. Here, the goal of this work is to propose a precise optical technique using 3D laser profilometry and image processing to obtain measurements of the roughness of soil surfaces resulting from the fracture of soil cores. The study also aims to assess the suitability of the roughness indicator obtained using this technique to detect changes in soil structure due the effect of crop type or tillage.
2. Material and Methods
2.1. Soil Samples Removal from the Field
Soil samples were taken from a no-tillage trial at the Grieves House field, the James Hutton Institute, Invergowrie, UK (Figure 1), in 2019. The soil is classified as a Dystric-Fluvic Cambisol by the classification of the Food and Agriculture Organisation (FAO). The trial included plots growing barley, bean, and control plots (bare soil), with no soil management taking place. There were four treatments; namely, plough bean, no-tillage bean, plough barley, no-tillage barley. Each treatment was replicated four times. A total of 3 soil samples were taken for each plant × management replicate, so that there were 12 samples of each treatment; 4 samples were collected in each control plot (labelled as NPA, NPB, and NPC in Figure 1) so that the total amount of samples collected was 57 samples. The plough used for tillage was the conventional one; that is, a mouldboard plough that inverted the soil to a depth of 20 cm. Meanwhile, the no-tillage method was used for sowing in a crack that was approximately 2–3 cm deep. For the control treatment, there were three replicates, and 3 soil samples were extracted from each replicate, totalling 9 samples. Barley and bean crops were sown in spring.
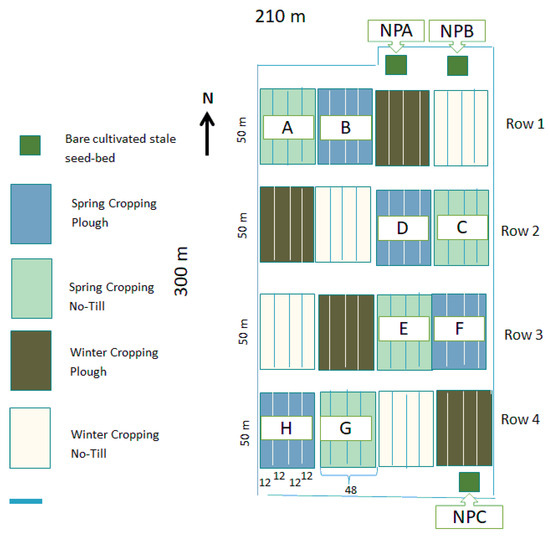
Figure 1.
Experimental design of the field trial. Samples were collected from plots A–HG where both spring beans and spring barley were grown. Light blue shaded areas represent the no-tillage treatment, dark blue shaded areas represent the ploughed treatment. Control plots are indicated in green labelled as NPA, NPB, and NPC (no crop, and no tillage).
The approach used to characterise the surface of fractured soil was based on the so-called core-break method. Soil samples of constant volume (no weights taken) were obtained using two Polyvinyl Chloride (PVC) cylinders, each 5 cm in diameter and 5 cm in height. They were connected by an adhesive tape, making a total of 10 cm in height. The cylinder was buried in the soil with a hammer and the sample was carefully removed using a shovel, in order to prevent any structural changes. Figure 2 shows the PVC samples that were embedded in the soil. The samples were then wrapped in plastic film and taken to the laboratory. When the samples arrived at the laboratory, they were opened and the adhesive tape that joined the two parts of the cylinder was removed. This fractured the soil sample into two approximately equal volumes, and created a surface where measurement of roughness is possible. The surface measurements were therefore that of a soil at a depth of 5 cm.
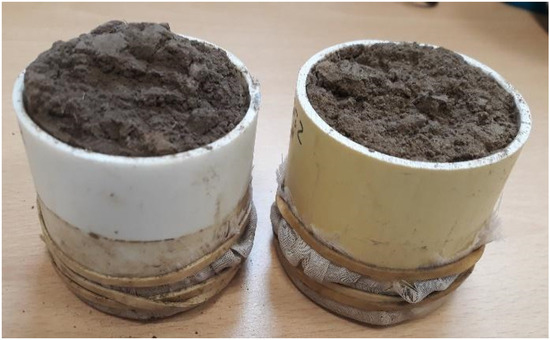
Figure 2.
Soil samples with two coupled cylinders, which were used to access roughness at a depth of 5 cm.
2.2. Construction of Optical System
The system was built to identify the roughness conditions in the soil samples, adapting the system constructed to measure the crusts [21]. A Thorlabs CPS532 point laser, operating at 532 nm and with a power of 4.5 mW, was used. To transform the point beam into a line beam, the laser line forming optics consisted of short focus (f = 50 mm) plano-convex cylindrical lens (LJ1695RM, Thorlabs, Hemel Hempstead, UK) coupled to a long focus (f = 400 mm) cylindrical lens (LJ1363RM, Thorlabs, UK). The images were captured using a Web camera, LifeCam HD 3000, Microsoft, made in China, connected to a computer. A Green Filter MF525-39, Thorlabs, was installed in front of the webcam to facilitate viewing of the laser line. For greater accuracy in sample scanning, a three-axis translation coordinates table with a path of 50 mm and a tube slider stepper motor controller were used, both connected to a CC controller enclosure LNR502/M, all from THORLABS. The optical setup is shown in Figure 3, which also presents how the sample is arranged on the table.
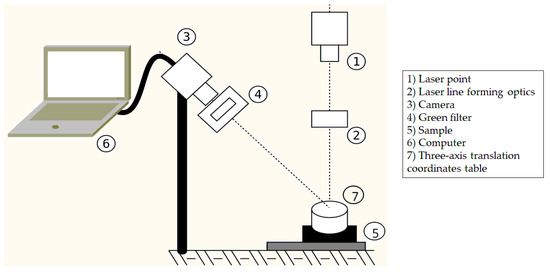
Figure 3.
Optical sensor setup with the sample arranged on the three-axis translation coordinates table, composed by: (1) Laser point, (2) Laser line forming optics, (3) Camera, (4) Green filter, (5) Soil sample, (6) Computer, (7) Three-axis translation coordinates table.
2.3. Sample Scanning
The images captured by the camera were programmed to be saved every one second, while the translation coordinate table moved at a speed of 1 mm/s, resulting in a sequence of 50 images, completing the total scanning of the sample surface. The first 15 and last 15 images were discarded, as the soil sample has a circular section. In this case, 20 images were used, one every 1 mm, for a total scanning distance of 20 mm per soil sample. For the setup calibration, an object with known coordinates was used, i.e., a wooden trapeze with dimensions equivalent to 4.5 of the larger bases, 1.0 of the smaller bases, and 1.8 of height.
2.4. Image Analysis
Images were processed using a method adapted from [21]. The images were first processed in the ImageJ programme with 64 bits Java 8 [30]. This process included cropping a Region Of Interest (ROI) of the images at the same position and size (167 × 60 pixels) shown in Figure 4a, with the ROI presented in Figure 4b. Subsequently, these images were decomposed into Red Green Blue (RGB) channels, with the ‘Green’ channel used, due to its better efficiency in reproducing the profile. Images were then segmented using a thresholding method to separate the laser line segmented from the background. A fixed threshold was used with a value of 240 (Figure 4c), so green (G) values greater than 240 are painted in white, and lower in black.
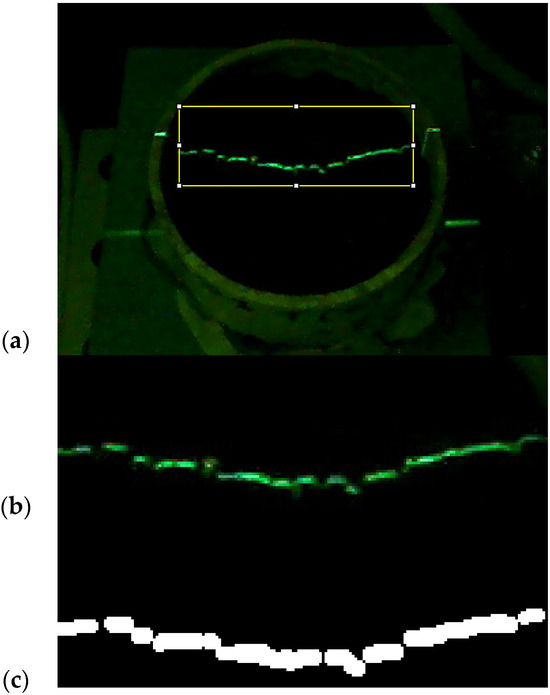
Figure 4.
Image of (a) the soil sample with the projected laser line and its processing, which involves cropping the delimitated area of the original image using an ROI (yellow) into (b) a new image, and (c) then obtaining a binary (black and white) image using a threshold.
The reconstruction of the soil surface was based on the technique described by [31] using the Octave software version 8.3.0; a point cloud is extracted from each binary image (Figure 4c) and curve fitting is then applied to obtain a smooth representation of the profile and to eliminate the outliers, i.e., the isolated data points that affect excessively the smoothness of the obtained profile. This process generates a series of curves whose coordinates x, y, z are subsequently scaled using reference objects of known coordinates (Figure 5) before the method is applied to soil samples.
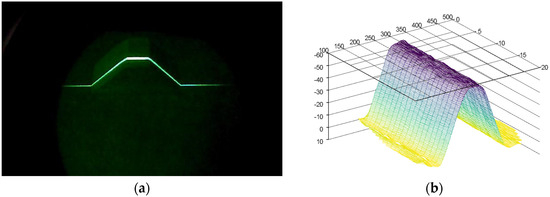
Figure 5.
Calibration process using a wooden trapeze of known dimensions. (a) A series of profiles were acquired. (b) The 3D surface reconstruction was obtained, and the scale of the pixel was then adjusted to so that the size in x (mm), y (mm), z (mm) matched that of the real object.
The mean roughness was calculated using the model proposed by [32]. The algorithm fits a plane from the point clouds contained within a radius r of the position of interest. The roughness is determined as the mean vertical distance between the plane and the points within the radius r. This calculation is performed for each of the points in the cloud and the final roughness value is the mean of all roughness values calculated on each point. The semivariogram geostatistic tool [24] was used, which relates the semivariance with the value of the distance increments. A semivariogram is a geostatistical tool that relates semivariance γ with the value of the distance increments, as shown in Equation (1):
where:
- N (h): Total number of pairs of samples at a distance (h);
- Z (x): Vertical value in the horizontal position (x);
- Z (z + h): Vertical value in the horizontal position (x + h).
In addition to the semivariogram, k-means clustering was used to identify clusters of points with similar roughness values. A modified version of the k-means algorithm was employed to cluster the variogram curves into two distinct groups where a custom metric for measuring the dissimilarity between two variogram curves was devised. This metric computes the sum of squared differences between corresponding points along the domain.
2.5. Statistical Analysis
Data were log transformed to address a positive skew in mean roughness and semivariogram measurements. Because the data were not balanced, a two-stage approach was then used to assess the effect of crop and management approaches. The four treatments and control were compared using a one-way analysis of variance (ANOVA) to assess the difference between the cropped and control areas. A two-way analysis of variance of the cropped data (with a blocking effect for row and fixed effects for crop type and management practice) was used to disentangle the effects of these treatments. Residuals were checked for possible patterns from the row–column experimental structure.
3. Results and Discussion
3.1. Calibration of the System
To calibrate the method, we first reconstructed the 3D surface of a trapezoidal object of dimension (4.5 cm for the base and 1.0 cm for the top surface) and placed on the motorised stage. The object was scanned and reconstructed using the pipeline (Figure 5). We then determined the scaling factor so that the dimensions of the reconstructed trapeze matched the dimensions of the real object.
3.2. Roughness Characterisation
Following calibration, the method was applied to the soil samples. The 3D reconstruction method could be used successfully to obtain a distribution of points describing the surface of the soil (Figure 6a). Image processing could then be used to build 3D surfaces from the fractured soil samples (Figure 6b), which was the base for computations of roughness statistics (Figure 6c,d). Using a clustering approach, it was also possible to determine regions of different roughness (Figure 6d,e).
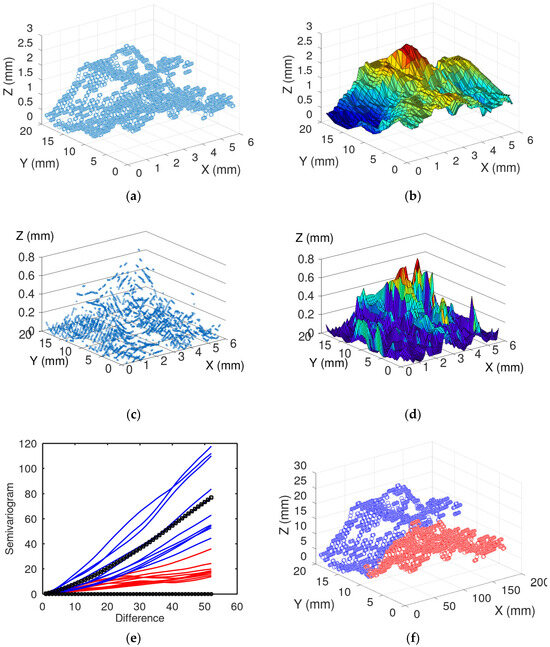
Figure 6.
The roughness variation in the no-tillage barley is illustrated by: (a) Extracted cloud of points following analysis of image data with axes x and y the position, and z a surface height, (b) 3D plot of the surface, by rendering the cloud of points (c) and the calculated roughness in axes z, (d) 3D graph of the roughness variation, (e) Semivariogram, (f) Curves with low values of the roughness variation in red, and the curves with substantial variation in blue. The red line and circles represent the curves with low roughness variation while the blue represent high roughness.
The roughness of surfaces can be determined using several other types of devices. The methods employed can be simple manual methods, e.g., pin method [25,26]; or sophisticated, e.g., using atomic force microscopy to detect nanometric topography [26]. The methods are typically divided into contact and non-contact methods. The contact methods are generally cheap and easy to use in the field, but they have low precision and destroy the surface that is being analysed. Soil is also a soft material and contact with a stylus can strongly affect the result of the analysis. Non-contact methods have high accuracy and data reliability and do not destroy the surface, but they are expensive and require training to use in the field [31,33,34]. The contactless methods are often based on optical principles that have the advantage of performing measurements very rapidly. Furthermore, optical techniques allow the use of computer vision for subsequent analysis of the data, thus decreasing operator subjectivity [31,34]. The method we propose is similar in design to commercially available profilometers but can be easily adapted to the size of samples. It can also easily be reproduced at a low cost using simple commercially available optics. Results hence indicate that such techniques could easily be used in the precise and fast analysis of soil structure.
Soil structure is a property related to the arrangement and binding of soil particles. Therefore, it cannot be assessed directly from the appearance of the undisturbed soil surface. Usually, a block of soil is manually broken and the appearance of structures is used to grade the quality of the soil. To make the method more repeatable and automatic, we chose to combine surface roughness measurements with techniques of soil sampling and analysis called core-break. The core-break method is commonly used for the measurement of root systems [35,36]. The fracture of the soil core reveals the presence of roots and pores which can be counted for analysis of root length density. However, the surface revealed by the fracture of the soil aggregates is also representative of the cohesion forces within the particles that compose the soil [27,28,29]. This concept has been explored extensively in soil sciences, with detailed mechanical analysis of both the mechanics of fracture [37,38] and the effect of soil structure and management on the roughness of the surface [31,34,39,40]. The use of the core-break method to apply the analysis of fracture surfaces has limitations. It relies on an operator to break the core which can introduce subjectivity. Also, soil structures can form at a range of scales, and it is possible that the method may lead to highly variable surface roughness in different types of soils. Therefore, for surface roughness to be adopted as a measurement of soil structure, large scale testing and validation of the technique must be performed.
3.3. Effect of Tillage and Crop Type on Surface Roughness
The data were not balanced because the control area only had one management treatment (no till). A two-stage approach was therefore necessary. First, we verified if there was significant variation between the plots using a one-way ANOVA and looked at whether that was due to the no-plant treatment. The analysis was then restricted to the balanced dataset (crop and management plots only) which allowed for a two-way ANOVA to be used on the mean roughness and semivariance data to separate the effects of the crop and the management factors.
The results of the ANOVA on the roughness of the soil samples obtained from the four treatments and control (Figure 7), showed that bean plants had a higher average roughness than barley plants, both in no-tillage and in plough tillage. This behaviour may be due to the root system of bean crop which often has deeper and thicker roots than barley, which had shallower and thinner roots [14,41]. The effect of the root system on the roughness prevailed in no-tillage treatment but was less important when tillage was applied, indicating that the disruption created by tillage modifies the soil structure more profoundly than the root system.
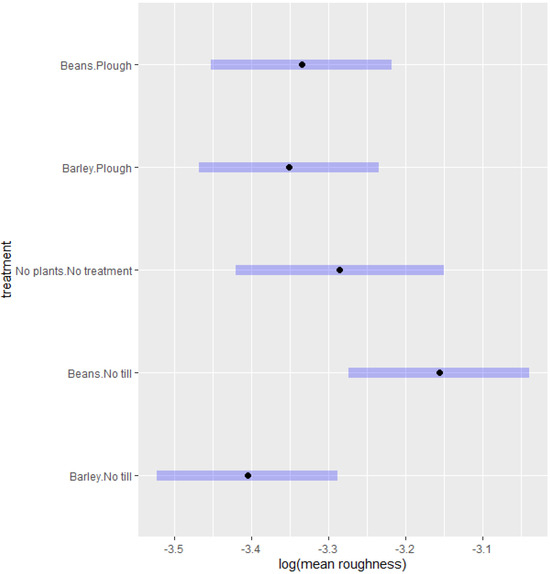
Figure 7.
Effect of the different treatments on soil roughness. The mean roughness is represented by the black dots, and the 95% confidence interval of the mean by the blue bars.
A two-way ANOVA was then used to identify the effects of individual factors (crop and management) and interaction between them. The analysis looked at each treatment combination, rather them looking at the main effects of management and crop, because where there were no plants there had been no tillage, and it therefore could not separate out the effect of ploughing. However, there was a statistically significant interaction between the effect of cropping and that of management (F4,52 = 2.60, p = 0.047). We also performed a two-way ANOVA on the semivariance data and found no significant effect of the factors (F4,52 = 0.77, p = 0.55). In other studies, however, semivariance was a useful measure to identify the presence of crust [21]; the semivariance worked as an indicator of the presence of crust.
Although the calculation of semivariance and determination of clusters could be successfully implemented as a visual assessment (Figure 6e,f), it was not sensitive enough to differentiate treatments, such as calculating mean roughness. Therefore, the semivariance metric may be suitable to identify only specific surface features. It is also possible that the distance used to calculate the semivariance is an important factor to capture differences between soil structures, and that this parameter could be adapted to better describe variations in surface roughness in our experiment.
Interestingly, the control areas, which were neither sown nor tilled, displayed mean roughness values higher than those of the no-tillage barley, but lower than those of the no-tillage bean. It is worth observing also that there was no machine traffic in the control area, and that, comparing the two different management systems, the no-tillage system had less machine traffic than the conventional tillage [18]. Thus, the traffic of machines could increase soil compaction, which would consequently decrease the roughness measurements.
In no-tillage treatments with crops, the bean cover resulted in higher mean surface roughness than with barley cover. Bean root systems, in particular, are known to develop tap roots with large diameters [42] which contrast with the seminal roots of barley roots which are about 0.5 mm and do not usually exceed 1 mm [43]. It is possible, therefore, that the macropores formed by the root systems can affect the formation of soil structure in no-tillage systems.
The control area had a higher mean roughness than the areas with crops at the conventional tillage. And even though ploughing loosened up the soil, some degree of compaction was still present because of the traffic of machines on the area, which may have affected the barley and bean root systems differently. It is also worth observing that the ploughing activity practically extinguishes the difference in culture, which explains the difference when comparing the control area with the plough and no-tillage areas.
Overall, the study confirms that soil management, and tillage in particular, has an overwhelming effect on soil structure. This was the case, for example, in studies on the effect of no-tillage management in the humid pampas of Northern Argentina on surface water run-off [40,44]. They found that this management led to the formation of a soil structure called “platy”, which made the soil more compact. This structure was only observed on the no-tillage system. However, [19] found that the soil structural properties, as an example the mean roughness, were usually reduced under no-tillage treatment, compared to conventional cropping systems, when studying the water retention. The absence of tillage usually results in an increase in the soil bulk density and reduced porosity. Other studies have shown that the soil structure in no-tillage soil experiments can be considerably improved (more macropores and aggregates) with the introduction of crops with strong and deep roots that can mitigate the effects of soil compaction [12,17]. In this study, we confirmed these observations and also showed that bean plants are good candidate crops to improve soil structure in a no-tillage soil management system.
4. Conclusions
We have assessed the use of laser profilometry as a tool to characterise soil structure. The roughness of soil surface resulting from the fracture of soil cores is indicative of the bounds and aggregate structure of a soil, and it can be captured efficiently, contact-free, by scanning a laser line on that soil surface. This was successively applied to soil samples collected on a no-tillage field experiment where it was found that tillage strongly affects soil structure, and that, in cases where no tillage is applied, bean crops are most capable of improving the soil structure because of the size of their root systems. There is potential, therefore, to deploy the technology more broadly to improve the assessment of soil structure.
Author Contributions
Conceptualisation, B.M.M. and R.A.B.J.; Methodology, B.B.B., Y.L., L.X.D. and B.M.M.; Software, B.B.B., F.P.R. and E.R.; Validation, B.B.B., F.P.R., Y.L. and E.R.; Formal Analysis, B.B.B., F.P.R., K.P. and E.R.; Investigation, B.B.B., B.M.M. and L.X.D.; Resources, B.M.M., L.X.D. and R.A.B.J.; Data Curation, B.B.B., F.P.R. and K.P.; Writing—Original Draft Preparation, B.B.B.; Writing—Review and Editing, R.A.B.J., F.P.R., K.P. and L.X.D.; Visualisation, B.B.B.; Supervision, B.M.M., L.X.D. and R.A.B.J.; Project Administration, B.M.M.; Funding Acquisition, B.B.B., B.M.M. and R.A.B.J. All authors have read and agreed to the published version of the manuscript.
Funding
CAPES (Foundation Coordination for the Improvement of Higher Education Personnel) and CNPq (National Council for Scientific and Technological Development) (203832/2018-3).
Institutional Review Board Statement
Not applicable.
Data Availability Statement
Data from this study are not publicly available.
Acknowledgments
We wish to acknowledge the financial support for this study provided by the CAPES, CNPq, The James Hutton Institute, and Federal University of Lavras.
Conflicts of Interest
The authors declare no conflict of interest.
References
- Smith, S.; De Smet, I. Root system architecture: Insights from Arabidopsis and cereal crops. Philos. Trans. R. Soc. B Biol. Sci. 2012, 367, 1441–1452. [Google Scholar] [CrossRef] [PubMed]
- Wang, X.; Zhou, B.; Sun, X.; Yue, Y.; Ma, W.; Zhao, M. Soil Tillage Management Affects Maize Grain Yield by Regulating Spatial Distribution Coordination of Roots, Soil Moisture and Nitrogen Status. PLoS ONE 2015, 10, e0129231. [Google Scholar] [CrossRef] [PubMed]
- Villamil, M.B.; Nafziger, E.D. Corn residue, tillage, and nitrogen rate effects on soil carbon and nutrient stocks in Illinois. Geoderma 2015, 253-254, 61–66. [Google Scholar] [CrossRef]
- Wacławowicz, R.; Giemza, M.; Pytlarz, E.; Wenda-Piesik, A. The Impact of Cultivation Systems on Weed Suppression and the Canopy Architecture of Spring Barley. Agriculture 2023, 13, 1747. [Google Scholar] [CrossRef]
- Gomiero, T. Soil Degradation, Land Scarcity and Food Security: Reviewing a Complex Challenge. Sustainability 2016, 8, 281. [Google Scholar] [CrossRef]
- Pimentel, D.; Burgess, M. Soil Erosion Threatens Food Production. Agriculture 2013, 3, 443–463. [Google Scholar] [CrossRef]
- DeLong, C.; Cruse, R.; Wiener, J. The Soil Degradation Paradox: Compromising Our Resources When We Need Them the Most. Sustainability 2015, 7, 866–879. [Google Scholar] [CrossRef]
- Wingeyer, A.B.; Amado, T.J.C.; Pérez-Bidegain, M.; Studdert, G.A.; Perdomo Varela, C.H.; Garcia, F.O.; Karlen, D.L. Soil Quality Impacts of Current South American Agricultural Practices. Sustainability 2015, 7, 2213–2242. [Google Scholar] [CrossRef]
- Lal, R. Restoring Soil Quality to Mitigate Soil Degradation. Sustainability 2015, 7, 5875–5895. [Google Scholar] [CrossRef]
- Bindraban, P.S.; van der Velde, M.; Ye, L.; van den Berg, M.; Materechera, S.; Kiba, D.I.; Tamene, L.; Ragnarsdóttir, K.V.; Jongschaap, R.; Hoogmoed, M.; et al. Assessing the impact of soil degradation on food production. Curr. Opin. Environ. Sustain. 2012, 4, 478–488. [Google Scholar] [CrossRef]
- Smith, P.; House, J.I.; Bustamante, M.; Sobocká, J.; Harper, R.; Pan, G.; West, P.C.; Clark, J.M.; Adhya, T.; Rumpel, C.; et al. Global change pressures on soils from land use and management. Glob. Chang. Biol. 2016, 22, 1008–1028. [Google Scholar] [CrossRef] [PubMed]
- Blanco-Canqui, H.; Wienhold, B.J.; Jin, V.L.; Schmer, M.R.; Kibet, L.C. Long-term tillage impact on soil hydraulic properties. Soil Tillage Res. 2017, 170, 38–42. [Google Scholar] [CrossRef]
- Yang, Y.; Hu, Z.; Gu, F.; Wang, J.; Ding, Q. Effects of Tillage Methods on Crop Root Growth Trend Based on 3D Modeling Technology. Agriculture 2022, 12, 1411. [Google Scholar] [CrossRef]
- Newton, A.C.; Valentine, T.A.; McKenzie, B.M.; George, T.S.; Guy, D.C.; Hackett, C.A. Identifying Spring Barley Cultivars with Differential Response to Tillage. Agronomy 2020, 10, 686. [Google Scholar] [CrossRef]
- Bottinelli, N.; Angers, D.A.; Hallaire, V.; Michot, D.; Le Guillou, C.; Cluzeau, D.; Heddadj, D.; Menasseri-Aubry, S. Tillage and fertilization practices affect soil aggregate stability in a Humic Cambisol of Northwest France. Soil Tillage Res. 2017, 170, 14–17. [Google Scholar] [CrossRef]
- Boizard, H.; Yoon, S.W.; Leonard, J.; Lheureux, S.; Cousin, I.; Roger-Estrade, J.; Richard, G. Using a morphological approach to evaluate the effect of traffic and weather conditions on the structure of a loamy soil in reduced tillage. Soil Tillage Res. 2013, 127, 34–44. [Google Scholar] [CrossRef]
- Townsend, T.J.; Ramsden, S.J.; Wilson, P. How do we cultivate in England? Tillage practices in crop production systems. Soil Use Manag. 2016, 32, 106–117. [Google Scholar] [CrossRef] [PubMed]
- Maharjan, G.R.; Prescher, A.-K.; Nendel, C.; Ewert, F.; Mboh, C.M.; Gaiser, T.; Seidel, S.J. Approaches to model the impact of tillage implements on soil physical and nutrient properties in different agro-ecosystem models. Soil Tillage Res. 2018, 180, 210–221. [Google Scholar] [CrossRef]
- Skaalsveen, K.; Ingram, J.; Clarke, L.E. The effect of no-till farming on the soil functions of water purification and retention in north-western Europe: A literature review. Soil Tillage Res. 2019, 189, 98–109. [Google Scholar] [CrossRef]
- Arvidsson, J.; Westlin, A.; Sörensson, F. Working depth in non-inversion tillage—Effects on soil physical properties and crop yield in Swedish field experiments. Soil Tillage Res. 2013, 126, 259–266. [Google Scholar] [CrossRef]
- Barreto, B.B.; Siqueira, R.H.d.S.; Rivera, F.P.; Braga, R.A.; Ferreira, M.M.; Horgan, G. Development of an optical technique for characterizing presence of soil surface crusts. Comput. Electron. Agric. 2019, 167, 105050. [Google Scholar] [CrossRef]
- Souza, E.S.; Antonino, A.C.D.; Heck, R.J.; Montenegro, S.M.G.L.; Lima, J.R.S.; Sampaio, E.V.S.B.; Angulo-Jaramillo, R.; Vauclin, M. Effect of crusting on the physical and hydraulic properties of a soil cropped with Castor beans (Ricinus communis L.) in the northeastern region of Brazil. Soil Tillage Res. 2014, 141, 55–61. [Google Scholar] [CrossRef]
- Zielinski, M.; Sánchez, M.; Romero, E.; Atique, A. Precise observation of soil surface curling. Geoderma 2014, 226–227, 85–93. [Google Scholar] [CrossRef]
- Thomaz, E.L.; Fidalski, J. Interrill erodibility of different sandy soils increases along a catena in the Caiuá Sandstone Formation. Rev. Bras. Cienc. Solo 2020, 44, e0190064. [Google Scholar] [CrossRef]
- Jester, W.; Klik, A. Soil Surface Roughness Measurement—Methods, Applicability, and Surface Representation. Catena 2005, 64, 174–192. [Google Scholar] [CrossRef]
- García Moreno, R.; Díaz Álvarez, M.C.; Tarquis, A.M.; Paz González, A.; Saa Requejo, A. Shadow analysis of soil surface roughness compared to the chain set method and direct measurement of micro-relief. Biogeosciences 2010, 7, 2477–2487. [Google Scholar] [CrossRef]
- Xu, J.-J.; Tang, C.-S.; Cheng, Q.; Xu, Q.-L.; Inyang, H.I.; Lin, Z.-Y.; Shi, B. Investigation on desiccation cracking behavior of clayey soils with a perspective of fracture mechanics: A review. J. Soils Sediments 2022, 22, 859–888. [Google Scholar] [CrossRef]
- Sun, X.; Li, X.; Zheng, B.; He, J.; Mao, T. Study on the progressive fracturing in soil and rock mixture under uniaxial compression conditions by CT scanning. Eng. Geol. 2020, 279, 105884. [Google Scholar] [CrossRef]
- Sun, P.; Peng, J.; Chen, L.; Lu, Q.; Igwe, O. An experimental study of the mechanical characteristics of fractured loess in western China. Bull. Eng. Geol. Environ. 2016, 75, 1639–1647. [Google Scholar] [CrossRef]
- Rasband, W.S. Image J; National Institutes of Healf: Bethesda, MD, USA, 2004. [Google Scholar]
- Barreto, B.B.; Ribeiro, E.; Rivera, F.P.; Junior, R.A.B.; Cândido, B.; McKenzie, B. Optical and portable equipment for characterizing soil roughness. Smart Agric. Technol. 2023, 3, 100062. [Google Scholar] [CrossRef]
- Giardeau, D.M. CloudCompare (Version 2.10) [GPL Software]. 2019. Available online: http://www.cloudcompare.org (accessed on 26 October 2023).
- Conte, O.; Levien, R.; Trein, C.R.; Cepik, C.T.C.; Debiasi, H. Demanda de tração em haste sulcadora na integração lavoura-pecuária com diferentes pressões de pastejo e sua relação com o estado de compactação do solo. Máquinas E Mec. Agrícola 2007, 27, 1. [Google Scholar] [CrossRef]
- McKenzie, B.M.; Braga, R.A.; Coelho, D.E.C.; Krol, M.; Horgan, G.W. Moiré as a low-cost, robust, optical-technique to quantify soil surface condition. Soil Tillage Res. 2016, 158, 147–155. [Google Scholar] [CrossRef]
- Chen, G.; Weil, R.R. Penetration of cover crop roots through compacted soils. Plant Soil 2010, 331, 31–43. [Google Scholar] [CrossRef]
- Bennie, A.T.P.; Taylor, H.M.; Georgen, P.G. An Assessment of the Core-Break Method for Estimating Rooting Density of Different Crops in the Field. 9300 (Republic of South Africa). Soil Tillage Res. 1987, 9, 347–353. [Google Scholar] [CrossRef]
- Young, I.M.; Crawford, J.W. The Analysis of Fracture Profiles of Soil Ushg Fractal Geometry. Soil Tillage Res. 1992, 30, 291–295. [Google Scholar] [CrossRef]
- Hallett, P.D.; Dexter, A.R.; Seville, J.P.K. The Application of Fracture Mechanics to Crack Propagation in Dry Soil. Eur. J. Soil Sci. 1995, 46, 591–599. [Google Scholar] [CrossRef]
- Martinez-Agirre, A.; Álvarez-Mozos, J.; Giménez, R. Evaluation of surface roughness parameters in agricultural soils with different tillage conditions using a laser profile meter. Soil Tillage Res. 2016, 161, 19–30. [Google Scholar] [CrossRef]
- Sasal, M.C.; Boizard, H.; Andriulo, A.E.; Wilson, M.G.; Léonard, J. Platy structure development under no-tillage in the northern humid Pampas of Argentina and its impact on runoff. Soil Tillage Res. 2017, 173, 33–41. [Google Scholar] [CrossRef]
- Haling, R.E.; Brown, L.K.; Bengough, A.G.; Valentine, T.A.; White, P.J.; Young, I.M.; George, T.S. Root hair length and rhizosheath mass depend on soil porosity, strength and water content in barley genotypes. Planta 2014, 239, 643–651. [Google Scholar] [CrossRef]
- Kumar, A.; Saini, K.S.; Rolaniya, L.K.; Singh, L.K.; Kaushik, P. Root System Architecture and Symbiotic Parameters of Summer Mung Bean (Vigna radiata) under Different Conservation Agriculture Practices. Sustainability 2022, 14, 3901. [Google Scholar] [CrossRef]
- Hackett, C. A study of the root system of barley. i. effects of nutrition on two varieties. New Phytol. 1968, 67, 287–299. [Google Scholar] [CrossRef]
- Boizard, H.; Peigné, J.; Sasal, M.C.; de Fátima Guimarães, M.; Piron, D.; Tomis, V.; Vian, J.F.; Cadoux, S.; Ralisch, R.; Tavares Filho, J.; et al. Developments in the “Profil Cultural” Method for an Improved Assessment of Soil Structure under No-Till. Soil Tillage Res. 2017, 173, 92–103. [Google Scholar] [CrossRef]
Disclaimer/Publisher’s Note: The statements, opinions and data contained in all publications are solely those of the individual author(s) and contributor(s) and not of MDPI and/or the editor(s). MDPI and/or the editor(s) disclaim responsibility for any injury to people or property resulting from any ideas, methods, instructions or products referred to in the content. |
© 2023 by the authors. Licensee MDPI, Basel, Switzerland. This article is an open access article distributed under the terms and conditions of the Creative Commons Attribution (CC BY) license (https://creativecommons.org/licenses/by/4.0/).