Abstract
The selection of red clover (Trifolium pratense L.) populations adapted to extreme environmental conditions is of great importance due to continuing climate change. The plant material analyzed with simple sequence repeat (SSR) markers included two parent populations, P1 (cultivar ‘Reichersberger’) and P3 (cultivar ‘Croatia’) and their reselections, which were created after one cycle of selection under cold temperature conditions. The reselections PS1 and PS3 were produced by intercrossing 38 surviving plants of parent populations P1 and P3, respectively. A total of 48 plants from each cultivar and each reselection were randomly selected for SSR analysis. Sixteen SSR primer pairs were selected, taking into account the presence of loci on all seven pairs of red clover chromosomes. An increase in the average frequency of alleles from the initial populations to the populations after one cycle of selection was observed, followed by a decrease in the number of alleles. Out of a total of 16 loci, the Waples neutrality test revealed significant frequency changes at 12 loci from P1 to PS1 and 9 loci from P3 to PS3 populations. The genetic diversity in the studied populations did not change significantly after selection, leaving enough genetic variability as a prerequisite for the success of future selection.
1. Introduction
Visible signs of climate change are more evident recently [1] and have a significant impact on everyday life, especially on agriculture and food production [2]. Therefore, the creation of crop cultivars adapted to extreme climatic conditions is of great importance for sustainable agriculture in stress environments [3,4,5,6,7,8].
One of the key issues limiting the adaptation and survival of the majority of fodder crops is their tolerance to cold or freezing [9]. Regions with low winter temperatures frequently have germplasm with higher resistance to cold stress [10]. Crop tolerance to low temperatures can be increased through a number of processes, including an increase in the amount of water-soluble carbohydrates or stress response proteins [11].
Taylor [12] states that most clover breeding programs are primarily concerned with persistence (longevity), due to its association with general adaptability and yield, and that increasing persistence is generally achieved by focusing on abiotic stress. Breeding for persistence, for more than a century, has resulted in modern cultivars being expected to last three to four years.
Because of its short lifespan, red clover is difficult to maintain over a long period of years, which is necessary for certain breeding methods, resulting in only a few of them being used in red clover today [13]. The most common of these is mass selection, which has been extensively used in selection for disease resistance and persistence in red clover [13]. Still, recurrent selection is recommended for complex traits such as resistance to cold conditions [14].
The main goal of red clover selection is to change the frequency of alleles in the desired direction, to fix favorable alleles, and to increase the proportion of superior genotypes in the outbred population [15]. The duration of selection in the population, as well as the effectiveness of the selection method itself, depends on the number of genes that act on the trait under selection [15]. By understanding the changes in genetic composition and identifying genes that are preferentially selected in specific contexts, breeders can target performance-related traits and take advantage of polymorphisms in these genes during selection [16]. The changes in allele frequency and gene diversity in the surviving populations of red clover were tested with single nucleotide polymorphisms (SNPs), and a greater difference was found between the surviving populations than between the surviving and original populations [17].
Red clover (Trifolium pratense L.) is a diploid and highly heterozygous species due to its gametophytic self-incompatibility system, and selection can relatively easily increase the proportion of plants with the trait of interest [18]. In addition to the diploid, by doubling the number of chromosomes using colchicine, a tetraploid red clover was also developed [19] (as cited in reference [18]). The occurrence of inbreeding depression is possible with a greater narrowing of the population or due to its isolation from random mating with other populations [20]. The question is how extreme one can go with the selection of red clover, while maintaining a sufficiently large genetic variability in the obtained material. Amplified fragment length polymorphism (AFLP) markers showed that the two surviving populations of Swedish red clover had higher genetic diversity than the initial populations [21]. AFPLs were also used to test the surviving populations of the white clover cultivar Norstar, which were reported to have sufficient genetic diversity to serve as a basis for future selection [22]. Grljušić et al. [23] studied the change in genetic variability in red clover during selection under low temperature stress conditions using randomly amplified polymorphic DNA (RAPD) markers and the results showed a narrowing of genetic variability. The main limitation of RAPD markers is their dominant character, which makes it impossible to distinguish homozygotes from heterozygotes. This makes it difficult to estimate the allele frequency, because a more accurate estimate requires the analysis of a large number of individuals, and a low reproducibility of the marker profiles [24,25]. Microsatellite or simple sequence repeat (SSR) markers, most commonly used for plant genotyping, are more informative than other molecular markers because a number of different alleles can exist at a given SSR locus [26]. SSRs have proven to be a useful tool for assessing the genetic diversity of red clover [27,28,29,30,31,32]. However, despite a large number of available SSR markers distributed throughout the red clover genome [33,34,35], only a limited number of them have been used in these studies. More recently, single nucleotide polymorphism (SNP) markers have been used in several studies reporting genetic diversity and marker–trait association in red clover populations [36,37,38]. According to Singh et al. [39], SNP markers should preferably be used to determine population structure, whereas SSRs are more efficient for diversity analysis. Although numerous studies have used molecular markers to examine red clover populations, most of them have focused on genetic diversity within and among populations, whereas studies on the effects of selection on the genetic parameters of populations are still lacking.
The aim of this study was to assess the change in allele frequency and genetic diversity of red clover breeding populations after selection under cold conditions in a hilly-mountain region.
2. Materials and Methods
2.1. Plant Material
Two parent populations of red clover (cultivars) and their reselections (breeding populations), created by one cycle of selection under low temperature conditions, were included in the analysis (Table 1). The cultivar ‘Reichersberger’ is an Austrian cultivar introduced to the Croatian regions a long time ago and essentially became domesticated, while cultivar ‘Croatia’ is a domestic cultivar created by the Bc Institute in Zagreb for the Croatian growing conditions.

Table 1.
Four red clover populations included in the SSR analysis.
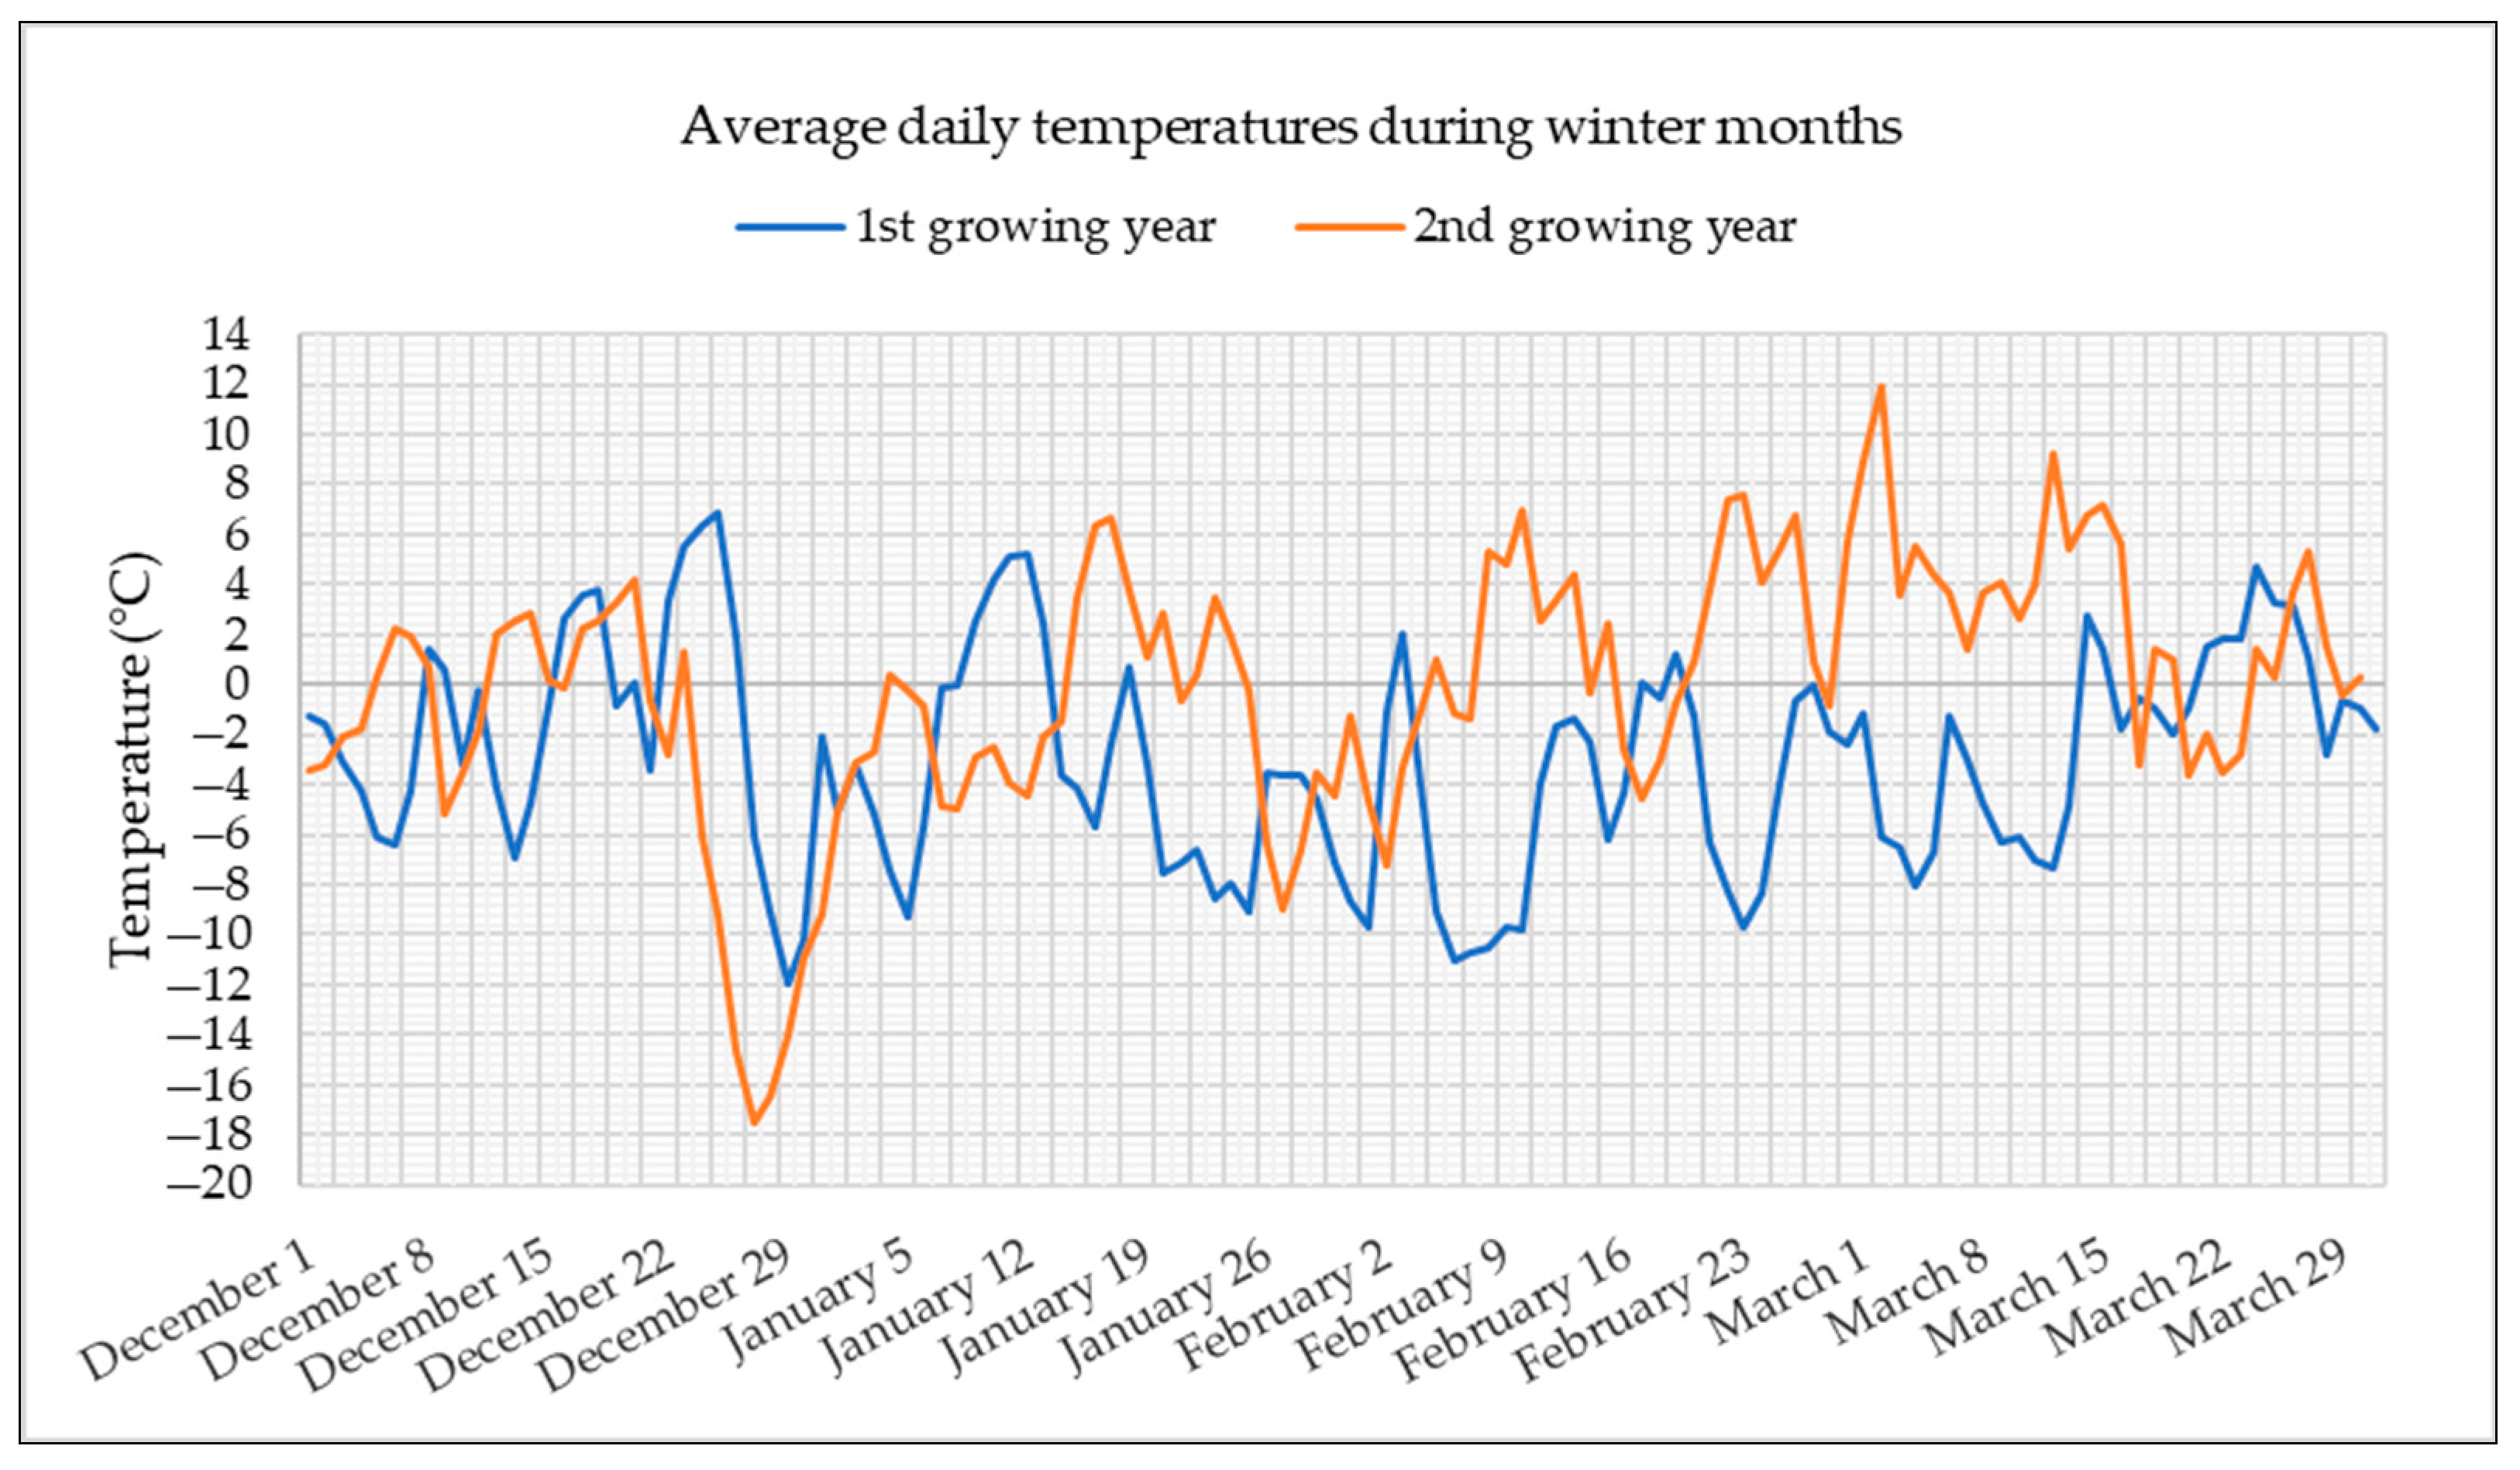
Reselections PS1 and PS3 were produced by intercrossing 38 plants of parent populations P1 and P3, respectively, which survived under low temperature conditions in the upland of Medvednica, near Zagreb. The temperature graph, with average daily temperatures during winter months in two growing years, is shown in Figure 1.
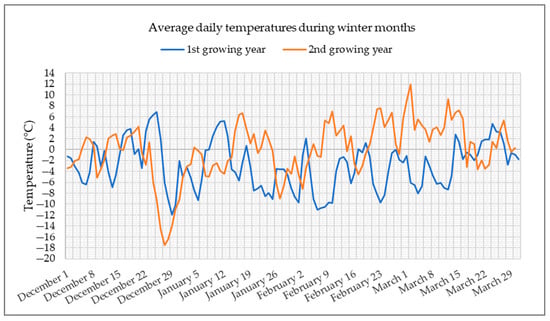
Figure 1.
Average daily temperatures in winter months during two years of red clover growing in the upland of Medvednica (data provided by the Croatian Meteorological and Hydrological Service).
The graph shows that the first growing year was extremely cold. During almost the entire winter, average daily temperatures were below 0 °C, with the lowest reaching −12 °C in December. Although a lower temperature was recorded in December of the second year, down to −18 °C, the rest of the winter was much milder compared to the first year.
2.2. DNA Isolation and SSR Amplification
The leaves of 48 randomly selected plants from both cultivars and their reselections were sampled for SSR analysis. The total number of sampled genotypes for the analysis of the four populations was 192. Immediately after sampling, the plant material was stored at −80 °C until further processing. Plant leaf samples were dried in a lyophilizer (Christ beta 1–8 LD, Martin Christ, Osterode am Harz, Germany). After drying, 40 mg of the dried sample was ground into a fine powder using an oscillatory mill (Retsch MM400, Retsch, Haan, Germany). A total of 20 mg of dry powder from each sample was weighed and placed in separate tubes. Isolation of genomic DNA was performed using the commercial kit “DNeasy Plant Mini Kit” from Qiagen (Hilden, Germany), following the manufacturer’s recommendations.
The quality of the isolated DNA was checked in a 0.8% agarose gel in 0.5× TBE buffer (100 mM Tris, 83 mM boric acid, 2 mM Na2EDTA). The electrophoresis was followed by staining of the agarose gel in a 0.5 mL/L ethidium bromide solution. The UV visualization and imaging of DNA fragments in the gel was performed using a gel imaging and analysis system (GelDoc XR, BioRad, Hercules, CA, USA).
The quantity of isolated genomic DNA was checked with a fluorimeter (VersaFluor, Biorad). Based on the data on the DNA concentration of each sample obtained with a fluorimeter, working solutions of genomic DNA samples with a concentration of 5 ng/μL were prepared.
Thirty SSR markers were initially selected from the study of Sato et al. [34] based on their informativeness (number of alleles and polymorphism information content values). After primer screening on 5 random plants of the 2 cultivars (‘Reichersberger’ and ‘Croatia’), the 16 stable, repeatable, and most informative SSRs were finally selected, taking into account the presence of marker loci on all seven chromosomes of red clover (Table 2). PCR reactions were performed according to the adapted protocol of Dias et al. [31]. The reaction mixture of a total volume of 10 μL per sample contained 1× PCR buffer (50 mM KCl, 10 mM Tris-HCl; 1.5 mM MgCl2; Sigma-Aldrich, Burlington, MA, USA), 0.2 mM of each deoxynucleotide (dATP, dCTP, dGTP, dTTP) (Applied Biosystems, Foster City, CA, USA), and 0.8 μM of each SSR primer (forward and reverse) of which the forward primer was labeled with fluorescent dye (6-FAM-blue dye, Ned-yellow and VIC-green dye, Applied Biosystem), 5 μL genomic DNA (5 ng μL−1), and 0.5 U Taq DNA polymerase (Sigma-Aldrich). The PCR reaction was performed in a Thermal Cycler Verity (Applied Biosystems, USA) according to the following program: initial denaturation for 5 min at 95 °C, 8 cycles of 30 s at 95 °C, 30 s at 62 °C, and 30 s at 72 °C, where the annealing temperature was reduced by 1 °C with each cycle, then 28 cycles of 30 s at 95 °C, 30 s at 55 °C, and 30 s at 72 °C. This was followed by a final elongation lasting 5 min at 72 °C.
Table 2.
Primer name, chromosome (linkage group, LG), complete sequence, repetitive sequence (SSR motif), and length in base pairs for the 16 SSR loci [34].
Electrophoretic separation and visualization of PCR products was performed using a four-capillary genetic analyzer (Genetic Analyzer 3130; Applied Biosystems, USA). After electrophoresis, SSR fragments were scored using the Gene-Mapper software package, version 4.0 (Applied Biosystems).
2.3. Data Analysis
2.3.1. Waples Neutrality Test
Waples [40] proposed a test of temporal variation in allele frequency for individual loci, which tests the null hypothesis that the observed difference in allele frequency between two samples taken at different times is solely the result of sampling error and t generations of genetic drift. The test statistic is distributed as chi-square and is calculated as follows:
where x – y is the difference in the frequency of an allele between two time-separated samples (P1 and PS1 and P3 and PS3 populations), and var (x – y) denotes the variance of this difference, and is calculated according to plan II of the Waples model as follows:
According to this plan, the total size of the population (census size) is not a factor, provided that it is at least twice the effective size of the population (Ne), and the genotyped individuals are not part of the reproducing population, and, therefore, the samples and Ne are mutually exclusive. P is the frequency of an allele in the gamete set, which precedes the initial generation (generations P1 and P3) and is calculated as the average of allele frequencies from populations P1 and PS1 and P3 and PS3, while S0 and St represent the number of genotyped individuals in two temporally separated samples (P1 in relation to PS1 and P3 in relation to PS3), and t represents the number of generations of reproduction shared by those two samples. Assuming that one cycle of selection is equivalent to one generation, the effective population size (Ne) is equal to the number of intercrossed plants after one cycle of selection (Ne = N = 38).
The neutrality test was performed for each individual allele A at a particular locus with the estimated frequency P and the frequency of all other (non-A) alleles at that locus 1 − P, with one degree of freedom. A statistically significant neutrality test means that the observed differences in allele frequencies between populations are greater than expected, only due to the effects of genetic drift and sampling error. Since migration is excluded due to the applied spatial isolation during the intercrossing of selected plants, and mutations are negligible due to the small number of selection cycles, a statistically significant test indicates the selection non-neutrality of the respective locus [41].
2.3.2. H-W Test, Observed and Expected Heterozygosity
The agreement of observed genotype frequencies with those expected under Hardy–Weinberg equilibrium conditions was tested for 16 SSR loci in populations P1, PS1, P3, and PS3 using the likelihood ratio test (G2 test). The test statistic for the i-th locus with k alleles and m possible genotypes has the expression:
and can be approximated by the chi-square distribution with k(k − 1)/2 degrees of freedom [42], where Oi and Ei are the observed and expected number of the i-th genotype in the population. Wright’s fixation index FIS [43], which is equal to Cockerham’s within-population inbreeding coefficient [42], was used as a measure of the deviation of genotype frequencies from the Hardy–Weinberg equilibrium. The fixation index was calculated for the i-th locus using the following formula:
where Hl is observed heterozygosity, and Dl is genetic diversity or expected heterozygosity under conditions of Hardy–Weinberg equilibrium. The observed heterozygosity was estimated according to Weir [42] as follows:
For locus l, alleles I and j, the sample size n, and the observed number of heterozygotes nlij. The mean observed heterozygosity per locus for m loci was calculated as follows:
The expected heterozygosity or gene diversity is the probability that two randomly chosen alleles at a locus in the population will be different and was estimated for locus l according to Nei [44] as follows:
where xi is the frequency of the i-th allele at locus l. The mean expected heterozygosity per locus for m loci was calculated as follows:
Shannon’s index [45] is an information statistic index which serves as a measure of gene diversity and it is calculated as follows:
where xi is frequency of the i-th allele at the locus. The mean value of Shannon’s index per locus for m loci was calculated as follows:
POPGENE v. 1.32 software [46] was used to calculate SSR allele frequencies, expected and observed heterozygosity, and Shannon’s index (l) as well to perform Hardy–Weinberg test. Microsoft Excel v. 16.0 t-test was used for comparisons of mean numbers of alleles per locus, H, D, and la values between populations.
3. Results
3.1. Allele Frequencies and Waples Neutrality Test
An analysis of four red clover populations using 16 SSR loci yielded a total of 224 alleles with an average number of 14 alleles per locus. The number of alleles across populations varied from 7 at the RCS2010 to 23 at the RCS1285 locus (Table S1). The total number of alleles per population ranged from 148 in PS3 to 182 in P3 (Table 3). One cycle of selection under low temperature conditions reduced the number of alleles in both P1 and P3 populations, but the change was more pronounced from P3 to PS3 than from P1 to PS1. After selection, the PS1 population had 6 alleles fewer than its predecessor P1 population, while PS3 had as many as 34 alleles fewer than P3 (Table 3). As a result, an increase in mean allele frequency was observed from the initial populations (P1 and P3) to the selected populations (PS1 and PS3).
Table 3.
Number and mean frequency of alleles per red clover population: P1 (cultivar ‘Reichersberger’), PS1 (reselection from P1), P3 (cultivar ‘Croatia’), and PS3 (reselection from P3).
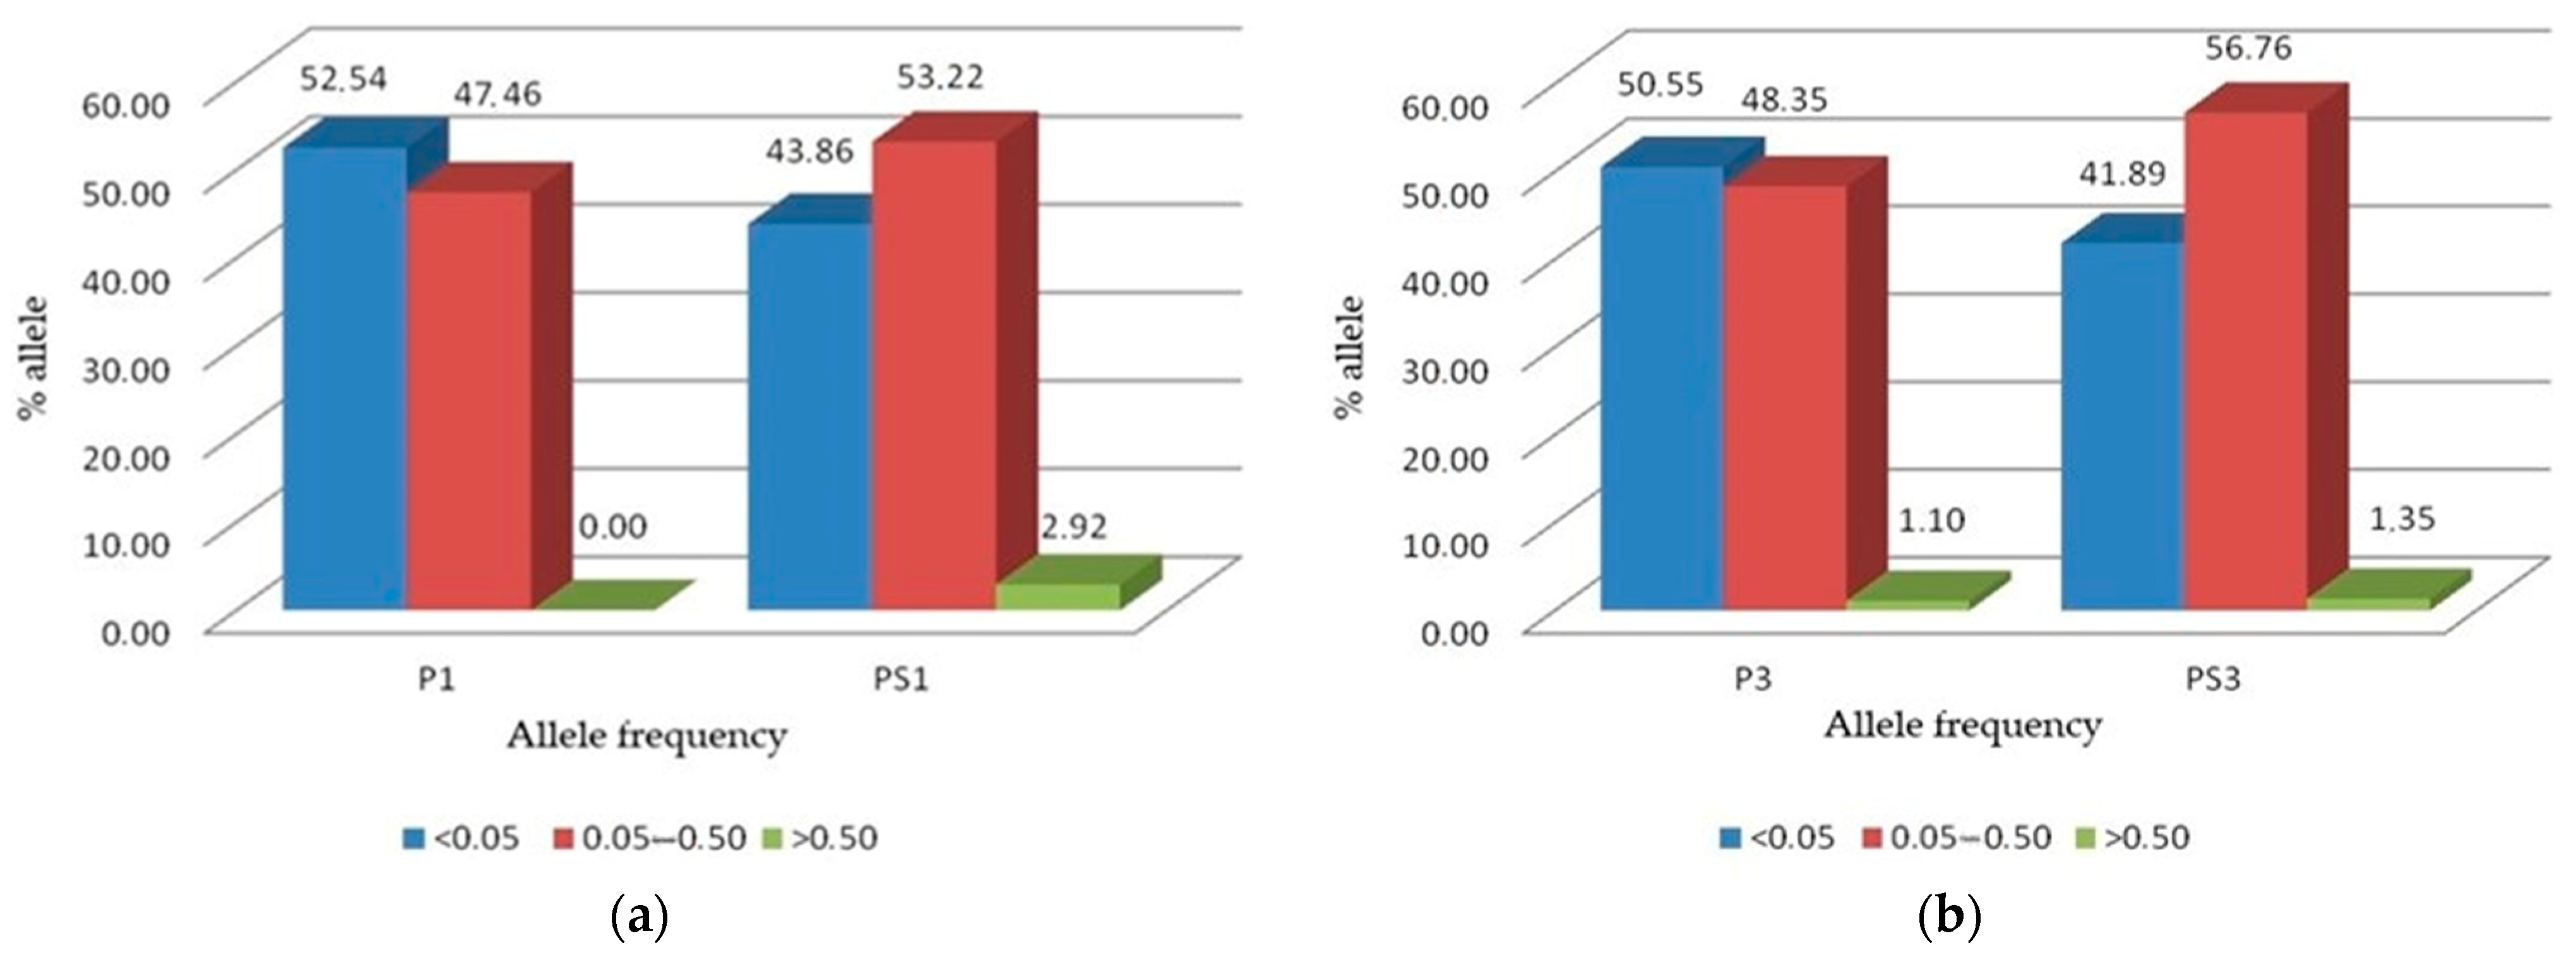
In the parental P1 and P3 red clover populations, most alleles were rare alleles with frequencies less than 0.05 (Figure 2a,b). In both populations, more than 50% of the alleles belonged to this class. Alleles with moderate frequency between 0.05 and 0.50 were represented by more than 40% in both populations, while alleles with high frequency (above 0.50) were absent in the P1 population and accounted for only 1.1% in the P3 population. After selection, the proportion of alleles with low frequency (<0.05) decreased by 8.68% from P1 to PS1 and by 8.66% from P3 to PS3. At the same time, selection increased the proportion of alleles with moderate frequencies (0.05–0.50) by 5.76% from P1 to PS1 and by 8.41 from P3 to PS3.
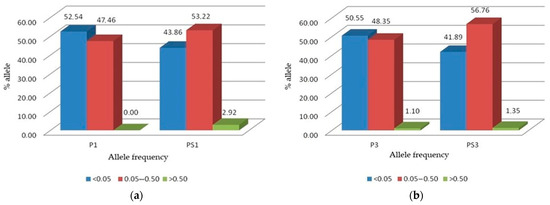
Figure 2.
Rare (<0.05), moderate (0.05–0.50), and high (>0.50) frequency allele distribution: (a) For the red clover populations P1 (cultivar ‘Reichersberger’) and PS1 (reselection from P1); (b) For the populations P3 (cultivar ‘Croatia’) and PS3 (reselection from P3).
The percentage of high frequency alleles also increased in both populations accounting for 2.92% in PS1 and 1.35% in PS3.
The compatibility of the observed changes in allele frequencies between populations P1 and PS1, and P3 and PS3 with genetic drift was determined by conducting neutrality tests according to Waples [28] for the assumed effective population size Ne = N = 38.
The change in allele frequency between populations P1 and PS1 was significant at 12 SSR loci (Table 4). The number of alleles with a significant test varied between loci. At loci RCS-3709 and RCS-2010, only 1 allele out of 15 and 6 alleles, respectively, showed a significant change in frequency, while, at locus RCS-097, a significant change in frequency was observed in 4 out of 9 alleles (Table S1). Out of a total of 27 alleles with significant frequency changes across all non-neutral loci, 18 alleles decreased in frequency, while 9 alleles increased in frequency after selection.
Table 4.
Number of loci/alleles where the neutrality test was significant from red clover population P1 (cultivar ‘Reichersberger’) to PS1 (reselection from P1) and from P3 (cultivar ‘Croatia’) to PS3 (reselection from P3).
In the second case, from P3 to PS3, nine SRR loci were selectively non-neutral (Table 4), and the number of alleles that showed a significant change in frequency varied slightly less between loci, compared to the previous pair of populations (Table S1). Six non-neutral loci had only one allele with a significant change in frequency, and the RCS-1411 locus had the largest number of alleles with a significant change in frequency (three of a total of twenty-one alleles). Also, out of a total of 13 alleles with significant frequency changes across all non-neutral loci, 6 alleles decreased and 7 alleles increased in frequency.
3.2. Genetic Diversity Measures and Hardy–Weinberg Test
Table 5 shows the means and ranges of the diversity measures in the four red clover populations. The means of all four diversity measures (number of alleles per locus, observed and expected heterozygosity, and Shannon’s index) decreased from P1 to PS1, but the t-test revealed no significant differences. Similarly, no significant differences were found between P3 and PS3 for the same measures. The ranges of the four diversity measures were also similar in the initial populations (P1 and P2) and the selected populations (PS1 and PS3).
Table 5.
Mean, min., and max. number of alleles per locus for the individual populations: P1 (cultivar ‘Reichersberger’), PS1 (reselection from P1), P3 (cultivar ‘Croatia’), and PS3 (reselection from P3), observed heterozygosity (Hl), expected heterozygosity (Dl), and Shannon index (I) with associated t-test.
At the RCS-0907 locus, the large difference in the range of observed (0.170) and expected (0.760) heterozygosity (Table S2) resulted in a very high inbreeding coefficient/fixation index (0.77) and it was the only locus that had a significant G2 test in the P1 population (Table 6), which indicates a large deficit of heterozygotes at that locus.
Table 6.
Inbreeding coefficient/fixation index (FIS) and the G2 test significance (P) for four red clover populations: P1 (cultivar ‘Reichersberger’), PS1 (reselection from P1), P3 (cultivar ‘Croatia’), and PS3 (reselection from P3).
As in the P1 population, the RCS-0907 locus was the only locus that significantly deviated from the H–W equilibrium in the PS1 population with a corresponding inbreeding coefficient of 0.57. In the P3 population, significant deviations from the H–W proportions were observed for loci RCS-0907 and RCS-3095, with corresponding inbreeding coefficients of 0.23 and 0.29, respectively. The same two loci, RCS-0907 and RCS-3095, showed a significant departure from the H–W equilibrium also in PS3, with corresponding inbreeding coefficients of 0.48 and 0.15, respectively.
4. Discussion
In the present study, four red clover populations were analyzed with 16 SSR markers selected based on their quality and polymorphism. The number of markers was limited, but it is comparable to the number of markers reported in most previous studies of SSR-based diversity in red clover, which used 14 [32,47], 15 [29], or fewer markers [28,30,31]. Although the number of markers was limited in a present study, there was a total of 224 alleles, with a mean of 14 alleles per locus across two red clover cultivars and their respective reselections. The observed mean number of alleles per locus is similar to that reported by Radinović et al. [32], who found 13 alleles per locus in a collection of 46 accessions including cultivars as well as local populations originating from 17 different countries. Comparably lower diversity was reported by Dias et al. [31], who observed 11.1 alleles per locus in a set of 57 red clover accessions from the U.S. core collection and a population from Southern Brazil analyzed with seven SSR markers. The relatively low mean number of alleles detected in their study was likely the result of sampling only one plant per accession. The same authors analyzed a subset of the core collection that included three accessions (one each from Turkey, Denmark, and Greece) represented by 11 plants per accession and found 9 alleles per locus, which was not much lower compared to the mean number of alleles found in the entire set (55 accessions). This indicates the presence of high within-population diversity and suggests that a larger sample size might affect the estimated diversity level of the germplasm studied. In the present study, in which only two cultivars and their two reselections were genotyped, and in the study by Radinović et al. [32], who genotyped 43 accessions, a similar mean number of alleles per locus (14 and 13, respectively) was observed. To some extent, this could be the result of possible differences in within-population diversity between the two studies, or the type and number of SSRs used. However, it is more likely that this is due to differences in the number of individuals analyzed per population, which was 48 in the present study and only 1 plant per population in the study by Radinović et al. [32]. The observed difference is consistent with the results reported by Dias et al. [31], indicating the power of larger population size in detecting less frequent alleles. This is also supported by the distribution of allele frequencies in the present study, where more than 50% of alleles belonged to rare alleles (frequency < 0.05), whereas no alleles with frequencies below 0.05 were detected in the study by Radinović et al. [32]. A considerably higher mean number of alleles per locus compared to our study was reported by Fernández-Otero et al. [47], who found 20 alleles per locus in 13 local populations from northwestern Spain and 4 European commercial cultivars analyzed with 12 SSR markers, with the most polymorphic locus having as many as 57 alleles. The mean number of alleles per locus for the individual populations in the present study ranged from 9.25 (PS3) to 11.38 (P3). A much wider range of mean number of alleles per locus was reported by Berzina et al. [30], who found between 11.3 (cultivar ‘Arija’) and 19.2 (cultivar ‘Priekuli’) SSR alleles per locus in a set of seven red clover cultivars from the Latvian Gene Bank analyzed with six SSR markers. On the other hand, a lower diversity was reported for Ukrainian red clover cultivars [28], with a range from 4.1 (cultivar ‘Polis’) to 5.9 (cultivar ‘Ternopil’s’ka’) SSR alleles per locus.
The process of adaptation implies changes in the allele frequency of a population over time in response to changes in the environment. The allele frequencies of the two original populations P1 and P3, and the two “surviving” populations created from the original populations by selection under cold conditions, PS1 (selection from P1) and PS3 (selection from P3), were measured. During selection, there was an increase in the allele frequency, which was more pronounced in the P3 → PS3 population and slightly lower in the P1 → PS1 population. In general, low (<0.05) or moderate (0.05–0.50) frequency alleles predominated in the populations. A shift in the frequency distribution was also recorded. In the initial populations (P1 and P3), there were more than 50% of alleles of low frequency, while the other alleles, almost all, were of moderate frequency. In populations after selection, the proportion of alleles of moderate frequency increased. In these populations, the share of high frequency alleles also increased. The extreme selection pressure to which the parent populations were subjected produced phenotypes that were able to survive cold environmental conditions. This seems to be visible in the distribution of alleles, where the increased representation of moderate and high frequency alleles, in the population after selection, possibly indicates the inclusion of genes involved in resistance to this abiotic stress.
The Waples neutrality test revealed significant frequency changes at 12 of 16 loci in P1 → PS1 and 9 loci in P3 → PS3 populations. At these loci, the change in allele frequency was greater than expected due to the action of genetic drift alone, so these loci can be considered selectively non-neutral. The allele frequencies of the non-neutral loci (the loci under selection) should change more drastically over time than the neutral loci [16]. Although these results provide guidelines related to the change in allele frequency due to the action of selection, as well as the significance of this change, several generations (cycles of selection) are needed to determine the consistency of the change and the regularity of the non-neutrality status of a particular locus.
The values of the observed heterozygosity (Hl) ranged from 0.705 in the PS1 population to 0.723 in the PS3 population. The expected heterozygosity (Dl) ranged from 0.762 in the PS3 population to 0.796 in the P1 population. The high level of heterozygosity is consistent with the nature of red clover as an extremely heterogeneous and heterozygous species. Similar results for expected heterozygosity were reported by Dias et al. [31] and Dugar and Popov [28]. In the present study, the differences in genetic diversity (in terms of number of alleles per locus, observed and expected heterozygosity, and Shannon index) between the cultivars and their reselections were not significant, and the material obtained through cold stress selection can be considered sufficiently diverse for future breeding efforts.
In the present study, most of the SSR markers were in the H–W equilibrium. Only one marker (RCS-0907) showed a significant deviation across all populations, while RCS-3095 showed significant deviations from the H–W equilibrium only in the P3 and PS3 populations. Dias et al. [31] and Berzina et al. [30] also reported that the majority of SSR loci were in the H–W equilibrium in the populations of red clover they studied. Similar to our study, they found several SSR loci with significant deviation from the H–W equilibrium and found some inconsistency in their significance across populations. Consistent with our study, Dias et al. [31] reported that the loci that deviated significantly from the H–W expectation had excesses of homozygosity (positive fixation index). The authors suggested that one reason for the excess of homozygosity in these loci might be the presence of null alleles, and, consequently, heterozygous plants carrying a null allele were scored as homozygous for the readable alleles. On the other hand, according to Osterman et al. [48], heterozygote deficiency in plants with a self-incompatibility system, such as red clover, strongly suggests that the loci may have fitness values in the form of homozygote advantage or they are linked to such loci. However, positive assortative mating within populations due to genotypic differences in flowering time could be another reason for an excess of homozygosity. In this case, loci that consistently show an excess of homozygosity in all populations (such as the SSR locus RCS-0907 in the present study) may be considered as potential markers for genes controlling flowering time in red clover.
5. Conclusions
In the present study, SSR markers were used to estimate genetic diversity parameters in two red clover cultivars and their reselections created by intercrossing plants that survived for two years in cold stress environments. In the two reselections, an increase in mean allele frequency, associated with an increased proportion of moderate and high frequency alleles, was observed, possibly indicating the inclusion of genes for resistance to cold stress. Selection did not affect genetic diversity parameters in the populations, implying that red clover can likely withstand strong selection pressure without losing its genetic diversity. This could shorten the time to achieve the desired breeding goals. The majority of SSR markers were in the H–W equilibrium, while, at two loci, an excess of homozygosity was observed. Additional studies with larger numbers of markers targeting different genomic regions are needed to support our results.
Supplementary Materials
The following supporting information can be downloaded at: https://www.mdpi.com/article/10.3390/agriculture13102019/s1, Table S1: Allele frequencies at 16 SSR loci in red clover populations P1 (cultivar ‘Reichersberger’), PS1 (reselection from P1), P3 (cultivar ‘Croatia’) and PS3 (reselection from P3), allele size in base pairs (bp), allele frequency change (ΔP), from P1 to PS1 and from P3 to PS3, after one cycle of selection, and Waples neutrality test (χ2).; Table S2: Number of alleles per locus, observed heterozygosity (Hl), expected heterozygosity (Dl), Shannon diversity index (l) total and mean* number of alleles per locus for the individual red clover populations: P1 (cultivar ‘Reichersberger’), PS1 (reselection from P1), P3 (cultivar ‘Croatia’) and PS3 (reselection from P3).
Author Contributions
Conceptualization, J.P. and S.B.; methodology, S.B. and H.Š.; formal analysis, J.P. and Z.K.; investigation, J.P.; resources, S.B. and H.Š.; data curation, S.B.; writing—original draft preparation, J.P.; writing—review and editing, A.M., A.V., S.B. and H.Š.; visualization, J.P. and A.M.; supervision, S.B.; project administration, S.B.; funding acquisition, S.B. All authors have read and agreed to the published version of the manuscript.
Funding
This research was funded by the Ministry of Science, Education and Sports, Republic of Croatia, grant number 178-1780691-0686.
Institutional Review Board Statement
Not applicable.
Data Availability Statement
The original contributions generated for this study are included in the article/Supplementary Material. The genotypic data analyzed in this study are available from the corresponding author upon reasonable request.
Conflicts of Interest
The authors declare no conflict of interest.
References
- IPCC. Summary for Policymakers. In Climate Change 2023: Synthesis Report; Core Writing Team, Lee, H., Romero, J., Eds.; Contribution of Working Groups I, II and III to the Sixth Assessment Report of the Intergovernmental Panel on Climate Change; IPCC: Geneva, Switzerland, 2023; pp. 1–34. [Google Scholar]
- Porter, J.R.; Challinor, A.J.; Henriksen, C.B.; Howden, S.M.; Martre, P.; Smith, P. Invited review: Intergovernmental Panel on Climate Change, agriculture, and food—A case of shifting cultivation and history. Glob. Chang. Biol. 2019, 25, 2518–2529. [Google Scholar] [CrossRef] [PubMed]
- Parween, A.; Singh, V.; Bajpai, M. Abiotic Stress and Red Clover: A Less Explored Area of Research. Adv. Res. 2020, 21, 1–5. [Google Scholar] [CrossRef]
- Xu, Y.; Qin, F.; Chu, C.; Varshney, R.K. Abiotic stress tolerance: Genetics, genomics, and breeding. Crop J. 2023, 11, 969–974. [Google Scholar] [CrossRef]
- Sustek-Sánchez, F.; Rognli, O.A.; Rostoks, N.; Sõmera, M.; Jaškūnė, K.; Kovi, M.R.; Statkevičiūtė, G.; Sarmiento, C. Improving abiotic stress tolerance of forage grasses—Prospects of using genome editing. Front. Plant Sci. 2023, 14, 1127532. [Google Scholar] [CrossRef] [PubMed]
- Roberts, D.P.; Mattoo, A.K. Sustainable Agriculture—Enhancing Environmental Benefits, Food Nutritional Quality and Building Crop Resilience to Abiotic and Biotic Stresses. Agriculture 2018, 8, 8. [Google Scholar] [CrossRef]
- Hossain, A.; Skalicky, M.; Brestic, M.; Maitra, S.; Ashraful Alam, M.; Syed, M.A.; Hossain, J.; Sarkar, S.; Saha, S.; Bhadra, P.; et al. Consequences and Mitigation Strategies of Abiotic Stresses in Wheat (Triticum aestivum L.) under the Changing Climate. Agronomy 2021, 11, 241. [Google Scholar] [CrossRef]
- Li, W.; Zheng, C.; Zhou, J.; Zhang, Z.; Zhou, G.; Xie, X. Characterization of a naturally occurring early-flowering rice mutant resulting from a novel variation in the Ghd7 locus. Czech J. Genet. Plant Breed. 2021, 57, 166–169. [Google Scholar] [CrossRef]
- Adhikari, L.; Baral, R.; Paudel, D.; Min, D.; Makaju, S.O.; Poudel, H.P.; Acharya, J.P.; Missaoui, A.M. Cold stress in plants: Strategies to improve cold tolerance in forage species. Plant Stress 2022, 4, 100081. [Google Scholar] [CrossRef]
- Sanghera, G.S.; Wani, S.H.; Hussain, W.; Singh, N.B. Engineering cold stress tolerance in crop plants. Curr. Genom. 2011, 12, 30–43. [Google Scholar] [CrossRef]
- Casler, M.D.; van Santen, E. Breeding Objectives in Forages. In Fodder Crops and Amenity Grasses. Handbook of Plant Breeding; Boller, B., Posselt, U.K., Veronesi, F., Eds.; Springer: New York, NY, USA, 2010; Volume 5, pp. 115–136. [Google Scholar]
- Taylor, N.L. A Century of Clover Breeding Developments in the United States. Crop Sci. 2008, 48, 1–13. [Google Scholar] [CrossRef]
- Riday, H. Progress Made in Improving Red Clover (Trifolium pratense L.) through Breeding. Int. J. Plant Breed. 2010, 4, 22–29. [Google Scholar]
- Bertrand, A.; Bipfubusa, M.; Castonguay, Y.; Rocher, S.; Szopinska-Morawska, A.; Papadopoulos, Y.; Renaut, J. A Proteome Analysis of Freezing Tolerance in Red Clover (Trifolium pratense L.). BMC Plant Biol. 2016, 16, 65. [Google Scholar] [CrossRef] [PubMed]
- Beljo, J. Oplemenjivanje Bilja; Sveučilište u Mostaru: Mostar, Bosnia, 2006; p. 169. [Google Scholar]
- Verwimp, C.; Ruttink, T.; Muylle, H.; Glabeke, S.V.; Cnops, G.; Quataert, P.; Honnay, O.; Roldán-Ruiz, I. Temporal Changes in Genetic Diversity and Forage Yield of Perennial Ryegrass in Monoculture and in Combination with Red Clover in Swards. PLoS ONE 2018, 13, e0206571. [Google Scholar] [CrossRef] [PubMed]
- Ergon, Å.; Skøt, L.; Sæther, V.E.; Rognli, O.A. Allele Frequency Changes Provide Evidence for Selection and Identification of Candidate Loci for Survival in Red Clover (Trifolium pratense L.). Front. Plant. Sci. 2019, 10, 718. [Google Scholar] [CrossRef]
- Taylor, N.L.; Quesenberry, K.H. Breeding Methodology. In Red Clover Science; Kluwer Academic Publishers: Dordrecht, The Netherlands, 1996; Volume 28, pp. 141–160. [Google Scholar]
- Sjodin, J.; Ellerstrom, A. Autopolyploid forage crops. In Svalöf 1886–1986. Research and Results in Plant Breeding; Olsson, G., Ed.; LTs Förla: Stockholm, Sweden, 1986; pp. 102–113. [Google Scholar]
- Petrauskas, G.; Norkevičienė, E.; Baistruk-Hlodan, L. Genetic Differentiation of Red Clover (Trifolium pratense L.) Cultivars and Their Wild Relatives. Agriculture 2023, 13, 1008. [Google Scholar] [CrossRef]
- Collins, R.P.; Helgadóttir, Á.; Frankow-Lindberg, B.E.; Skøt, L.; Jones, C.; Skøt, K.P. Temporal Changes in Population Genetic Diversity and Structure in Red and White Clover Grown in Three Contrasting Environments in Northern Europe. Ann. Bot. 2012, 110, 1341–1350. [Google Scholar] [CrossRef]
- Göransson, M.; Kristjánsdóttir, T.A.; Dalmannsdottir, S.; Helgadottir, A. Genetic Shift in White Clover (Trifolium repens) after Natural Selection in a Marginal Area. Icel. Agric. Sci. 2012, 25, 41–50. [Google Scholar]
- Grljusic, S.; Bolaric, S.; Popovic, S.; Cupic, T.; Tucak, M.; Kozumplik, V. Assessment of Morphological and RAPD Variation among and within Red Clover Cultivars after Natural Selection. Die Bodencultur. 2005, 56, 183–188. [Google Scholar]
- Amiteye, S. Basic concepts and methodologies of DNA marker systems in plant molecular breeding. Heliyon 2021, 7, e08093. [Google Scholar] [CrossRef]
- Choudhury, A.; Deb, S.; Kharbyngar, B.; Rajpal, V.R.; Rao, S.R. Dissecting the plant genome: Through new generation molecular markers. Genet. Resour. Crop. Evol. 2022, 69, 2661–2698. [Google Scholar] [CrossRef]
- Vieira, M.L.C.; Santini, L.; Diniz, A.L.; Munhoz, C.d.F. Microsatellite Markers: What They Mean and Why They Are so Useful. Genet. Mol. Biol. 2016, 39, 312–328. [Google Scholar] [CrossRef]
- Gupta, M.; Sharma, V.; Singh, S.K.; Chahota, R.K.; Sharma, T.R. Analysis of Genetic Diversity and Structure in a Genebank Collection of Red Clover (Trifolium pratense L.) Using SSR Markers. Plant Genet. Resour. 2017, 15, 376–379. [Google Scholar] [CrossRef]
- Dugar, Y.N.; Popov, V.N. Genetic Structure and Diversity of Ukrainian Red Clover Cultivars Revealed by Microsatellite Markers. Open J. Genet. 2013, 3, 235–242. [Google Scholar] [CrossRef]
- Ahsyee, S.R.; Vasiljević, S.; Ćalić, I.; Zorić, M.; Karagić, Đ.; Šurlan-Momirović, G. Genetic Diversity in Red Clover (Trifolium pratense L.) Using SSR Markers. Genetika 2014, 46, 949–961. [Google Scholar] [CrossRef]
- Berzina, I.; Zhuk, A.; Veinberga, I.; Rashal, I.; Rungis, D. Genetic Fingerprinting of Latvian Red Clover (Trifolium pratense L.) Varieties Using Simple Sequence Repeat (SSR) Markers: Comparisons over Time and Space. Latv. J. Agron. 2008, 11, 28–32. [Google Scholar]
- Dias, P.M.B.; Julier, B.; Sampoux, J.-P.; Barre, P.; Dall’Agnol, M. Genetic Diversity in Red Clover (Trifolium pratense L.) Revealed by Morphological and Microsatellite (SSR) Markers. Euphytica 2008, 160, 189–205. [Google Scholar] [CrossRef]
- Radinović, I.; Vasiljević, S.; Branković, G.; Salem-Ahsyee, R.; Momirović, U.; Perović, D.; Surlan-Momirović, G. Molecular characterization of red clover genotypes utilizing microsatellite markers. Chilean J. Agric. Res. 2017, 77, 41–47. [Google Scholar] [CrossRef]
- Kolliker, R.; Enkerli, J.; Widmer, F. Characterization of novel microsatellite loci for red clover (Trifolium pratense L.) from enriched genomic libraries. Mol. Ecol. Notes 2006, 6, 50–53. [Google Scholar] [CrossRef]
- Sato, S.; Isobe, S.; Asamizu, E.; Ohmido, N.; Kataoka, R.; Nakamura, Y.; Kaneko, T.; Sakurai, N.; Okumura, K.; Klimenko, I.; et al. Comprehensive Structural Analysis of the Genome of Red Clover (Trifolium pratense L.). DNA Res. 2005, 12, 301–364. [Google Scholar] [CrossRef]
- Istvanek, J.; Dluhosova, J.; Dluhos, P.; Patkova, L.; Nedelnik, J.; Repkova, J. Gene Classification and Mining of Molecular Markers Useful in Red Clover (Trifolium pratense) Breeding. Front. Plant Sci. 2017, 8, 367. [Google Scholar] [CrossRef]
- Jones, C.; De Vega, J.; Lloyd, D.; Hegarty, M.; Ayling, S.; Powell, W.; Skøt, L. Population structure and genetic diversity in red clover (Trifolium pratense L.) germplasm. Sci. Rep. 2020, 10, 8364. [Google Scholar] [CrossRef] [PubMed]
- Nay, M.M.; Grieder, C.; Frey, L.A.; Amdahl, H.; Radovic, J.; Jaluvka, L.; Palme, A.; Skøt, L.; Ruttink, T.; Kölliker, R. Multilocation trials and population-based genotyping reveal high diversity and adaptation to breeding environments in a large collection of red clover. Front. Plant Sci. 2023, 14, 1128823. [Google Scholar] [CrossRef] [PubMed]
- Zanotto, S.; Ruttink, T.; Pegard, M.; Skøt, L.; Grieder, C.; Kölliker, R.; Ergon, Å. A genome-wide association study of freezing tolerance in red clover (Trifolium pratense L.) germplasm of European origin. Front. Plant Sci. 2023, 14, 1189662. [Google Scholar] [CrossRef] [PubMed]
- Singh, N.; Choudhury, D.R.; Singh, A.K.; Kumar, S.; Srinivasan, K.; Tyagi, R.K.; Singh, N.K.; Singh, R. Comparison of SSR and SNP Markers in Estimation of Genetic Diversity and Population Structure of Indian Rice Varieties. PLoS ONE 2013, 8, e84136. [Google Scholar] [CrossRef] [PubMed]
- Waples, R.S. Temporal Variation in Allele Frequencies: Testing the Right Hypothesis. Evolution 1989, 43, 1236–1251. [Google Scholar] [CrossRef]
- Šarčević, H. Genetske Promjene u M3 Sintetičkoj Populaciji Kukuruza (Zea mays L.) Izloženoj Rekurentnoj Selekciji. Ph.D. Thesis, University of Zagreb, Zagreb, Croatia, 2003. [Google Scholar]
- Weir, B.S. Diversity. In Genetic Data Analysis II: Methods for Discrete Population Genetic Data; Sinauer Associates, Inc.: Sunderland, MA, USA, 1996; pp. 141–160. [Google Scholar]
- Hartl, D.L.; Clark, A.G. Principles of Population Genetics, 3rd ed.; Sinauer Associates: Sunderland, MA, USA, 1997; p. 118. [Google Scholar]
- Nei, M. Analysis of Gene Diversity in Subdivided Populations. Proc. Natl. Acad. Sci. USA 1973, 70, 3321–3323. [Google Scholar] [CrossRef]
- Shannon, C.; Weaver, W. The Mathematical Theory of Communication; University of Illinois Press: Urbana, IL, USA, 1949; p. 87. [Google Scholar]
- Yeh, F.C.; Boyle, T.J.B. Population Genetic Analysis of Co-Dominant and Dominant Markers and Quantitative Traits. Belg. J. Bot. 1997, 129, 157. [Google Scholar]
- Fernández-Otero, C.I.; Ramos-Cabrer, A.M.; López-Díaz, J.E.; Pereira-Lorenzo, S. Evaluating the Diversity of Ecotypes of Red Clover (Trifolium pratense L.) from Northwestern Spain by Phenotypic Traits and Microsatellites. Agronomy 2021, 11, 2275. [Google Scholar] [CrossRef]
- Osterman, J.; Hammenhag, C.; Ortiz, R.; Geleta, M. Insights Into the Genetic Diversity of Nordic Red Clover (Trifolium pratense) Revealed by SeqSNP-Based Genic Markers. Front. Plant Sci. 2021, 12, 748750. [Google Scholar] [CrossRef]
Disclaimer/Publisher’s Note: The statements, opinions and data contained in all publications are solely those of the individual author(s) and contributor(s) and not of MDPI and/or the editor(s). MDPI and/or the editor(s) disclaim responsibility for any injury to people or property resulting from any ideas, methods, instructions or products referred to in the content. |
© 2023 by the authors. Licensee MDPI, Basel, Switzerland. This article is an open access article distributed under the terms and conditions of the Creative Commons Attribution (CC BY) license (https://creativecommons.org/licenses/by/4.0/).