Article

Influence of Incremental Short Term Salt Stress at the Seedling Stage on Root Plasticity, Shoot Thermal Profile and Ion Homeostasis in Contrasting Wheat Genotypes

Division of Plant Physiology, ICAR-Indian Agricultural Research Institute, New Delhi 110012, India
*
Author to whom correspondence should be addressed.
Agriculture 2023, 13(10), 1946; https://doi.org/10.3390/agriculture13101946
Submission received: 1 August 2023 / Revised: 1 September 2023 / Accepted: 12 September 2023 / Published: 6 October 2023
(This article belongs to the Special Issue New Insights into Crop Response and Tolerance to Salinity Stress)

Abstract

:
Understanding the component traits determining salt stress tolerance is a major breeding target in wheat. The lack of genetic resources suited to salt-affected regions and the complexity of the traits involved impede progress in breeding salt-tolerant wheat varieties. This study was conducted with four bread wheats, namely (Triticum aestivum) Kharchia-65 (K-65), BT-Schomburgk (BTS), HD-2687, and HD-3298. Treatments were imposed on plants with varying electrical conductivity (control, 5 dS m−1, 10 dS m−1, and 15 dS m−1) with a combination of three different salts NaCl, CaCl2·2H2O, and Na2SO4. We evaluated variations in root system architecture, canopy temperature (depicted as a thermal image), reactive oxygen species (ROS) homeostasis, and leaf stomatal density in response to incremental doses of salt stress in a hydroponic experiment. As the plants were sampled after short-term exposure to stress (within 3 weeks of stress imposition), the plants were expected to be in a quiescent state. Due to the osmotic effect, the growth of the plants was compromised, and the associated decrease in stomatal conductance increased the canopy temperature. ROS accumulation and antioxidant enzyme activity did not follow a definite pattern. The antioxidant system’s tolerance to ROS comes into action much later in the tolerance mechanism. That could probably be the reason behind the varied response in ROS accumulation and antioxidant enzymes after short-term exposure to salt stress. Thermal images could effectively differentiate between salt-tolerant (K65) and sensitive (HD2687) genotypes. The variation in Na+/K+ ratio also suggested a genotypic variation in salt tolerance. The genotypes of K-65 maintained a better root system, while HD2687 showed severe reduction in root biomass and other root traits under salt stress. The PCA data also point out genotypic variation in lateral and main root traits in response to different salt stress levels. For salt tolerance in wheat, the main contributing root traits were total root length, total surface area, total root volume, tips, and other main, lateral root traits. The idea of differential control of RSA dynamics is novel and can be further explored to understand natural variation in salt stress tolerance.

1. Introduction

Wheat (Triticum aestivum L.) is a staple food crop for approximately 35% of the global population [1]. It is cultivated in numerous countries worldwide to fulfil the food requirements of their populations. Nonetheless, the yield per hectare of wheat must catch up to its potential due to various factors. One of the most prevalent factors is soil salinity [2]. Salt stress, a major abiotic stress, significantly hampers crop growth and productivity on a global scale. By 2050, over half of arable land will experience increased salinization, reducing agricultural potential [3]. Salt stress has been shown to have detrimental effects on the growth and development of crops. It disrupts various physio-biochemical processes, such as chlorophyll synthesis, photosynthesis, dark respiration, and ion homeostasis [4].
Additionally, salt stresses negatively impact metabolism, especially the nitrogen and carbon assimilation pathways; ultimately, growth and yield are reduced [5,6]. The suppression of photosynthesis increases the generation of reactive oxygen species (ROS) and stimulates antioxidant enzymes that detoxify ROS. Plastids and peroxisomes produce a large proportion of total ROS in photosynthetically active plant parts. Enzymatic and non-enzymatic antioxidants scavenge the excess ROS. The problem of salt stress is becoming increasingly prevalent globally, especially in arid and semi-arid regions [2,3,4,5]. This is due to the persistent use of water with high salt content for irrigation [7]. Improper agricultural practices have continuously accumulated excessive toxic salts in the soil, transforming once-productive lands into saline wastelands.
In India, the wheat crops cultivated in regions with elevated salt stress levels suffer a yield loss of ~4.1 MT, amounting to USD 0.76 billion annually. management strategies, including leaching and drainage, cost approximately USD 27.3 billion yearly [8]. Considering the associated monetary burden, developing tolerant genotypes is an economical strategy to combat soil salinization. The lack of genetic resources suited to salt-affected regions and the intricacy of the traits involved impede progress in breeding salt-tolerant varieties. Identification and understanding of the mechanisms of salt stress tolerance of tolerant genetic resources will enable researchers to create practical breeding plans. Major breeding groups employ the well-known “Kharchia local”, a wheat landrace that evolved naturally in the saline-sodic regions of India [9,10,11,12]. Many salt-tolerant bread wheat genotypes, including KRL99, KRL3-4, KRL1-4, KRL19, KRL210, KRL283, and KRL213, were created via traditional breeding using kharchia as the donor parent. KRL283, KRL213, and KRL210 cover over 2.4 lakh hectares in India and claim high breeder seed indents [13].
Salt stress restricts plant growth by raising the osmotic potential of the soil and lowering root water uptake as a result. If sodium ions (Na+) are not compartmentalized at the cellular or intercellular level, the buildup of Na+ in the shoot eventually threatens plant growth by lowering the rate of photosynthesis. Salt stress slows organ growth to variable degrees, changing plant morphology and altering the root–shoot ratio [14]. These salt-induced morphological alterations in plants are expected to impact how well they operate in saline environments. The influence of soil sodicity and salt stress on Na+ and potassium (K+) ion homeostasis, growth retardation, accumulation of compatible solutes, changes in reactive oxygen species (ROS) homeostasis, etc. are well documented [15]. The influence of hostile soil conditions regarding salt stress on root traits is rarely documented [4]. Root system architecture can influence plant water and ion status and determine crop fitness in response to salt stress. In the present study, we have analyzed the variation in wheat root system architecture, canopy temperature (depicted as a thermal image), and leaf stomatal density in response to incremental doses of salt stress in a hydroponic experiment.

2. Materials and Methods

2.1. Plant Material and Growth

The study was conducted with four bread wheat (Triticum aestivum) strains: Kharchia-65 (K-65), BT-Schomburgk (BTS), HD-2687, and HD-3298 [11]. The seeds of the genotypes were maintained at the Division of Plant Physiology, ICAR-IARI, New Delhi, and grown in a pot (30 cm tall and 15 cm in diameter) under hydroponic conditions with modified Hoagland solution [16] at the National Phytotron Facility, ICAR-IARI, New Delhi for 30 days (Supplementary Figure S1) in November 2021. Treatments with varying electrical conductivity (Control, 5 dS m−1, 10 dS m−1, 15 dS m−1) were imposed on seven-day-old plants, using a combination of three different salts, NaCl, CaCl2.2H2O, and Na2SO4, and the plants were maintained in a suitable [13] microenvironment condition in a glasshouse. Various physio-biochemical parameters were recorded from plant samples harvested at 30 days. All the samples were collected and analyzed in triplicate.

2.2. Plant Height and Biomass

Thirty-day-old seedlings were harvested and sampled in polythene bags in ice. After samples were brought to the laboratory, plant height and fresh and dry biomass were recorded using a standard ruler and weighing scale.

2.3. Chlorophyll Content (CCM)

The fast, non-destructive measurement of chlorophyll content was measured via Optical Science CCM-200 plus Chlorophyll Content Meter (CCM). The measurements were taken from at least ten of the uppermost expanded leaves from plants receiving each treatment.

2.4. Relative Water Content (RWC) and Membrane Stability Index (MSI)

Thirty-day-old seedlings were harvested, and the leaf relative water content (RWC) was measured [17]. The membrane stability index (MSI) was computed and calculated following the earlier procedure [18].

2.5. Shoot Thermography

The seedling thermographic images were recorded from each hydroponic tray via an infrared thermal camera (Fluke TiX660 model Infrared camera, Everett, Washington, DC, USA using a 640 × 480 pixel resolution within a waveband of 8–14 μm. Images were examined using the software package SmartView 4.3TM Researcher Pro (Fluke Thermography, Plymouth, MN, USA) and exported to MS Word for further analysis [19].

2.6. Stomatal Density

Fully expanded leaves from thirty-day-old seedlings were sampled. A drop of instant glue was applied to the middle portion of each sampled leaf, spread evenly, and allowed to air-dry for ~60 s. The imprint of the leaf was carefully removed and kept on a glass slide [20]. The slides were observed under a light microscope. Stomatal density was calculated using ×100 magnifications and a 0.5 mm × 0.5 mm mask [21].

2.7. Analysis of Root Traits

The root traits of seedlings were documented by scanning the roots of representative plants using a root scanner (Epson, Expression 11,000XL, and Graphic Art Model). Three replicates were scanned for each treatment. The obtained images were subsequently analyzed using Win-RHIZO Regular software by Regent Instruments, Canada. This software was used to calculate various root parameters. Based on the root diameter, the roots were classified into two categories: main roots (MR, diameter > 0.5 mm) and lateral roots (LR, diameter ≤ 0.5 mm). Different traits, including root length, volume, surface area, and diameter, were extracted and recorded [22].

2.8. Localization of Reactive Oxygen Species

Physiologically active second leaves from seedlings were used for tissue localization of hydrogen peroxide (H2O2) and superoxide radicals (O2, SORs) [23]. To estimate SORs, leaf fragments measuring 1 cm in length were promptly immersed in a solution of 6 mM NBT prepared in sodium citrate buffer (pH 7.5). The leaf fragments were infiltrated into the buffer for 10 min at 60 kPa using a vacuum pump, followed by an incubation period of 10 min at room temperature. Following the incubation, the samples were submerged in 80% ethanol and subjected to heat in a boiling water bath until the chlorophyll present in the tissue was removed. After cooling down, the samples were dipped in 20% glycerol and were meticulously placed onto glass slides for mounting. The presence of O2 was indicated by the formation of a dark blue color. To detect H2O2, leaf segments were promptly immersed in a DAB (3, 3′-Diaminobenzidine) solution with a concentration of 1 mg/mL and a pH of 3.8. This was carried out in a 35 mm Petri dish using tweezers. The dipped samples were subjected to vacuum infiltration at a pressure of 60 KPa for 10 min and then exposed to room temperature in an illuminated incubator for 10 min. Once the incubation was complete, the chlorophyll pigments were removed by transferring the samples into 80% ethanol and subjecting them to heat in a boiling water bath. After cooling, the samples were dipped in 20% glycerol and mounted on glass slides. The appearance of a brown-coloured product confirmed the presence of H2O2. The slides were examined, and images were captured using a stereo microscope (EVOS XL Core). The intensity of staining was quantified by using ImageJ 1.53k, Wayne rasband and contributors, National intitutes of Health, USA, Java 1.8.0_172 (64-bit).

2.9. Superoxide Radicals (SOR) Content

To quantify superoxide radical content, the capacity of the radicals to reduce nitroblue tetrazolium chloride (NBT) was measured by determining the absorption of the end product at 540 nm. One gram of leaf tissue was homogenized in 10 mL of pre-cooled phosphate buffer (0.2 M, pH 7.2). The homogenate was then centrifuged in a Sigma refrigerated centrifuge (model 3K 30, Osterode, Germany) at 10,000× g for 10 min, and the resulting supernatant was immediately used to estimate superoxide radical content. The reaction mixture consisted of 0.25 mL of the supernatant, 0.075 mM NBT, 25 mM Na2CO3, 0.1 mM EDTA, 13.33 mM L-methionine, and water to bring the total volume to 3 mL. The reaction mixture was incubated at 30 °C for 10 min, and the absorbance was measured at 540 nm. The superoxide radical content was calculated based on its extinction coefficient [24], which was determined to be 12.8 Mm−1 cm−1.

2.10. Estimation of Na+/K+ Ratio

After 30 days of salt treatment, leaves, and roots were sampled from hydroponically grown plants and were oven-dried and powdered. To determine the Na+ and K+ contents, a plant sample weighing 0.5 g was digested using a di-acid mixture consisting of 20 mL of HNO3 and HClO4 acid at a ratio of 9:4. The digestion process was carried out in a Turbotherm digestion unit from Gerhardt analytical systems via the established procedure outlined earlier [11]. After digestion, the material was allowed to cool and then diluted with distilled water before being filtered through Whatman No. 42 filter paper. The resulting solution was adjusted to a final volume of 50 mL and stored in an amber-coloured bottle. A flame photometer (Systronics FF128, Systronics India Limited, Gujarat, India) was utilized to estimate the K+ and Na+ content of the standard solutions as well as the leaf, stem, and root samples.

2.11. Biochemical Parameters

The weighed amount of leaf samples (1 g) was frozen in liquid nitrogen to prevent proteolytic activity. The frozen leaf samples were ground with 10 mL of extraction buffer [12]. The SOD, CAT, GR, and POX extraction buffer contained 0.1 M phosphate buffer (pH 7.5) with 0.5 mM EDTA. For APX, the extraction buffer contained 0.1 M phosphate buffer (pH 7.5) with 0.5 mM EDTA and 1 mM ascorbic acid. The homogenate was passed through four layers of cheesecloth to remove solid particles. The filtrate was then centrifuged for 20 min at 15,000× g. The supernatant obtained after centrifugation was used as the enzyme extract for further analysis.

2.12. Assay of Lipid Peroxidation

To determine the lipid peroxidation via the thiobarbituric acid reactive substances method [25], 0.5 g of leaf sample was homogenized with 10 mL of 0.1% trichloro-acetic acid (TCA) solution. The homogenate was centrifuged at 15,000× g for 15 min. Then, 1 mL of supernatant was added to 4 mL of 0.5% thiobarbituric acid (TBA) prepared in 20% TCA. The mixture was incubated at 95 °C for 30 min and centrifuged at 10,000× g for 10 min. The supernatant was used for absorbance at a wavelength of 532 nm using a UV-Vis spectrophotometer (Analytikjena, Jena, Germany).

2.13. Assay of Super Oxide Dismutase Activity

The total SOD activity was determined by measuring the inhibition of the enzyme’s photochemical reduction of nitroblue tetrazolium (NBT) in accordance with the method described by [26]. To a reaction mixture of 3 mL, the following components were added: 13.33 mM methionine, 75 µM nitroblue tetrazolium chloride (NBT), 0.1 mM EDTA, 50 mM phosphate buffer (pH 7.8), 50 mM sodium carbonate, and 0.05 to 0.1 mL enzyme extract. Water was added to adjust the final volume to 3.0 mL. The reaction was initiated by adding 0.1 mL of 2 mM riboflavin, and the reaction tubes were placed under two 15 W fluorescent lamps for 15 min. A complete reaction mixture without the enzyme, which resulted in maximum colour development, served as the control. The reaction was stopped by switching off the light and placing the tubes in the dark. A non-irradiated complete reaction mixture served as a blank. The absorbance of the reaction mixture was recorded at 560 nm. One unit of enzyme activity was defined as the amount of enzyme that reduced the absorbance reading to 50% compared to tubes lacking the enzyme.

2.14. Assay of Ascorbate Peroxidase Activity

To determine APX activity, a 3 mL reaction mixture was prepared with the following components: 50 mM potassium phosphate buffer (pH 7.0) (1.5 mL of 100 mM), 0.5 mM ascorbic acid (0.5 mL of 3.0 mM), 0.1 mM EDTA (0.1 mL of 3.0 mM), 0.1 mM H2O2 (0.1 mL of 3.0 mM), 0.1 mL enzyme extract, and 0.7 mL water (to reach a final volume of 3.0 mL). The reaction was initiated by adding 0.2 mL H2O2. The decrease in absorbance at 290 nm was recorded for 30 s using a UV-visible spectrophotometer (model Specord Bio-200, AnalytikJena, Jena, Germany). APX activity was expressed by calculating the decrease in ascorbic acid content, which was determined by comparing the absorbance values with a standard curve constructed using known ascorbic acid concentrations. The method for calculating catalase activity based on the decrease in ascorbic acid content was described by [27].

2.15. Assay of Catalase Activity

Catalase activity was determined by measuring the decrease in H2O2 concentration using the method described by [28]. In a reaction mixture of 3 mL, 0.5 mL of 75 mM H2O2 and 1.5 mL of 0.1 M phosphate buffer (pH 7) were combined in cuvettes. The reaction was initiated by adding 50 µL of diluted enzyme extract. The decrease in absorbance at 240 nm was monitored for 1 min using a UV-visible spectrophotometer (model Specord Bio-200, AnalytikJena, Germany). Enzyme activity was determined by calculating the amount of H2O2 decomposed. The initial and final concentrations of H2O2 were determined by comparing the absorbance values with a standard curve constructed using known concentrations of H2O2.

2.16. Glutathione Reductase (GR)

The reaction mixture for the assay contained the following components: 66.67 mM potassium phosphate buffer (pH 7.5) and 0.33 mM EDTA, prepared by combining 1 mL of 0.2 M buffer containing 1 mM EDTA, 0.5 mM DTNB in 0.01 M potassium phosphate buffer (pH 7.5) (0.5 mL of 3.0 mM), 66.67 µM NADPH (0.1 mL of 2.0 mM), 666.67 µM GSSG (oxidized glutathione) (0.1 mL of 20 mM), 0.1 mL enzyme extract, and distilled water to make up a final volume of 3.0 mL. The reaction was initiated by adding 0.1 mL of 20.0 mM GSSG. The increase in absorbance at 412 nm was recorded using a spectrophotometer. The activity of the enzyme is expressed as the total absorbance (∆A412 nm) per mg protein per minute, following the method described by [29].

2.17. Salt-Tolerance Index (STI)

Salt-tolerance index (STI) is calculated as the ratio of the value of the salt-treated plants/value observed in control.

2.18. Statistical Analysis

To test the level of significance among control and treatments, two-way ANOVA and Duncan’s multiple range test (DMRT) were performed using R-program version 4.2.0. Principal component analysis (PCA) was carried out using the “FactoMineR”, “factoextra”, and “CorrPlot” package used to createCorrplot in R program version 4.2.0. Graphs were created with GraphPad Prism version 9.0.0 software.

3. Results

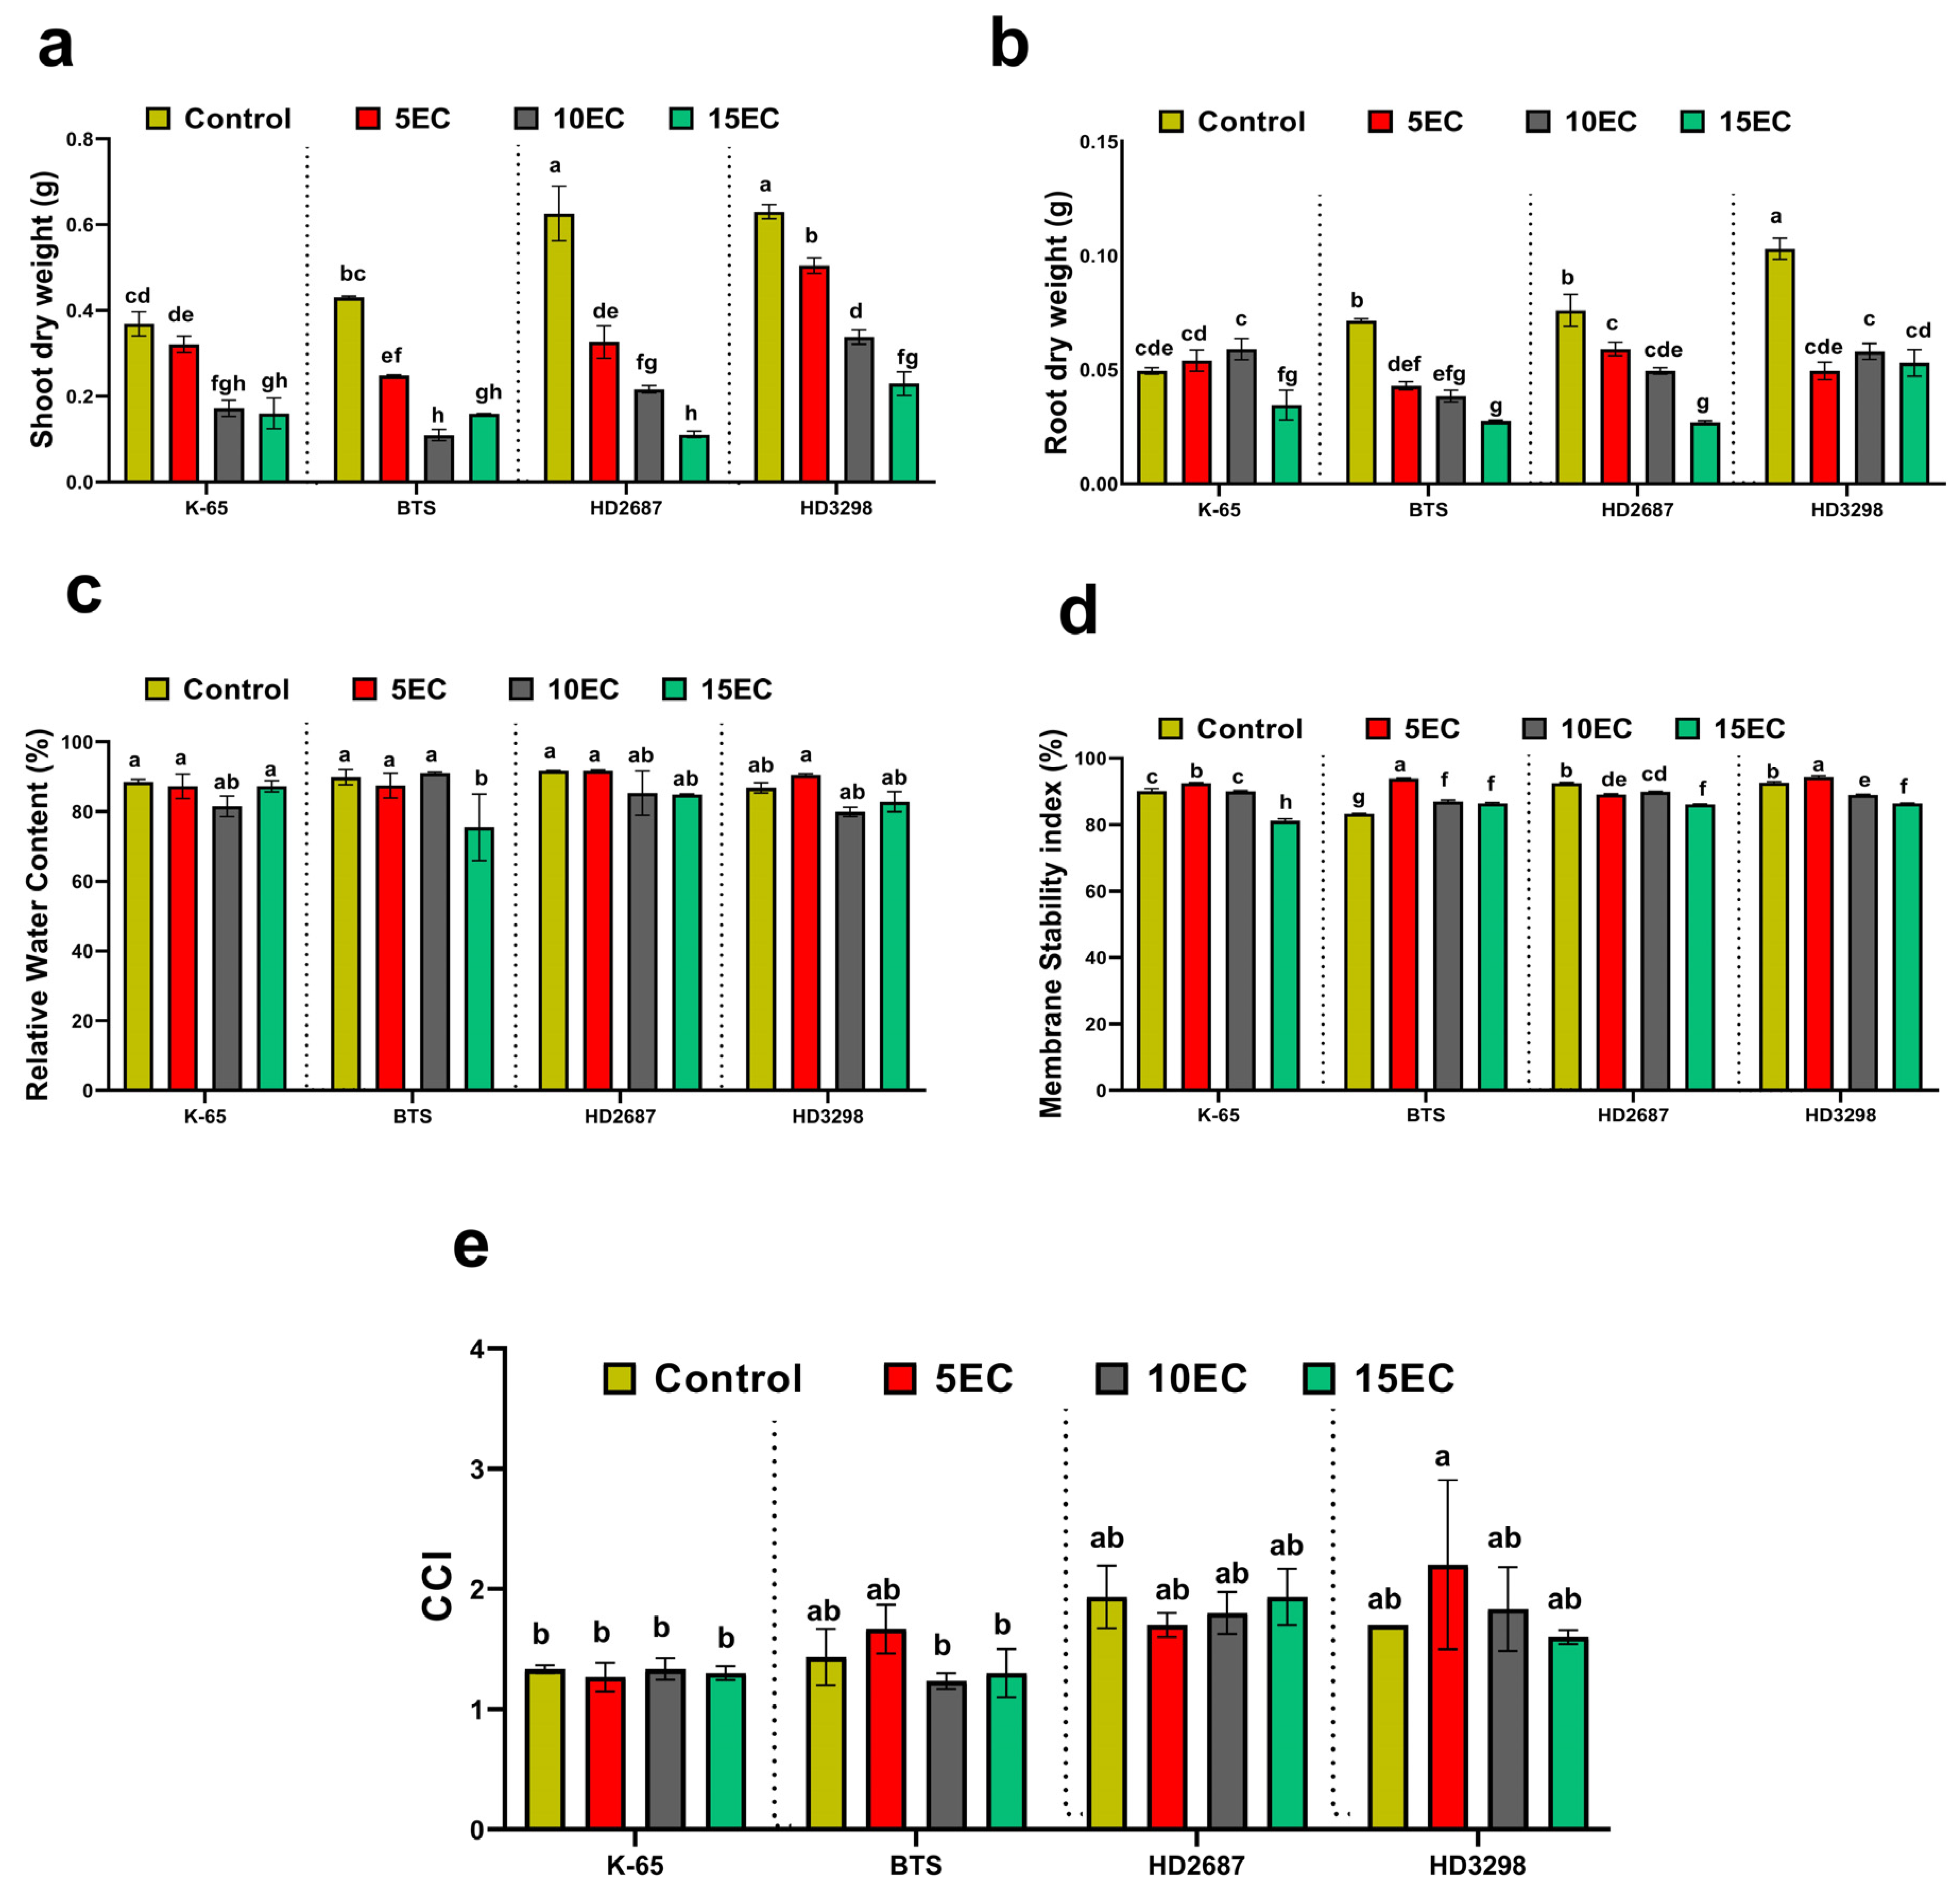
3.1. Biomass, Relative Water Content (RWC), Membrane Stability Index (MSI), Chlorophyll Content Index (CCM)
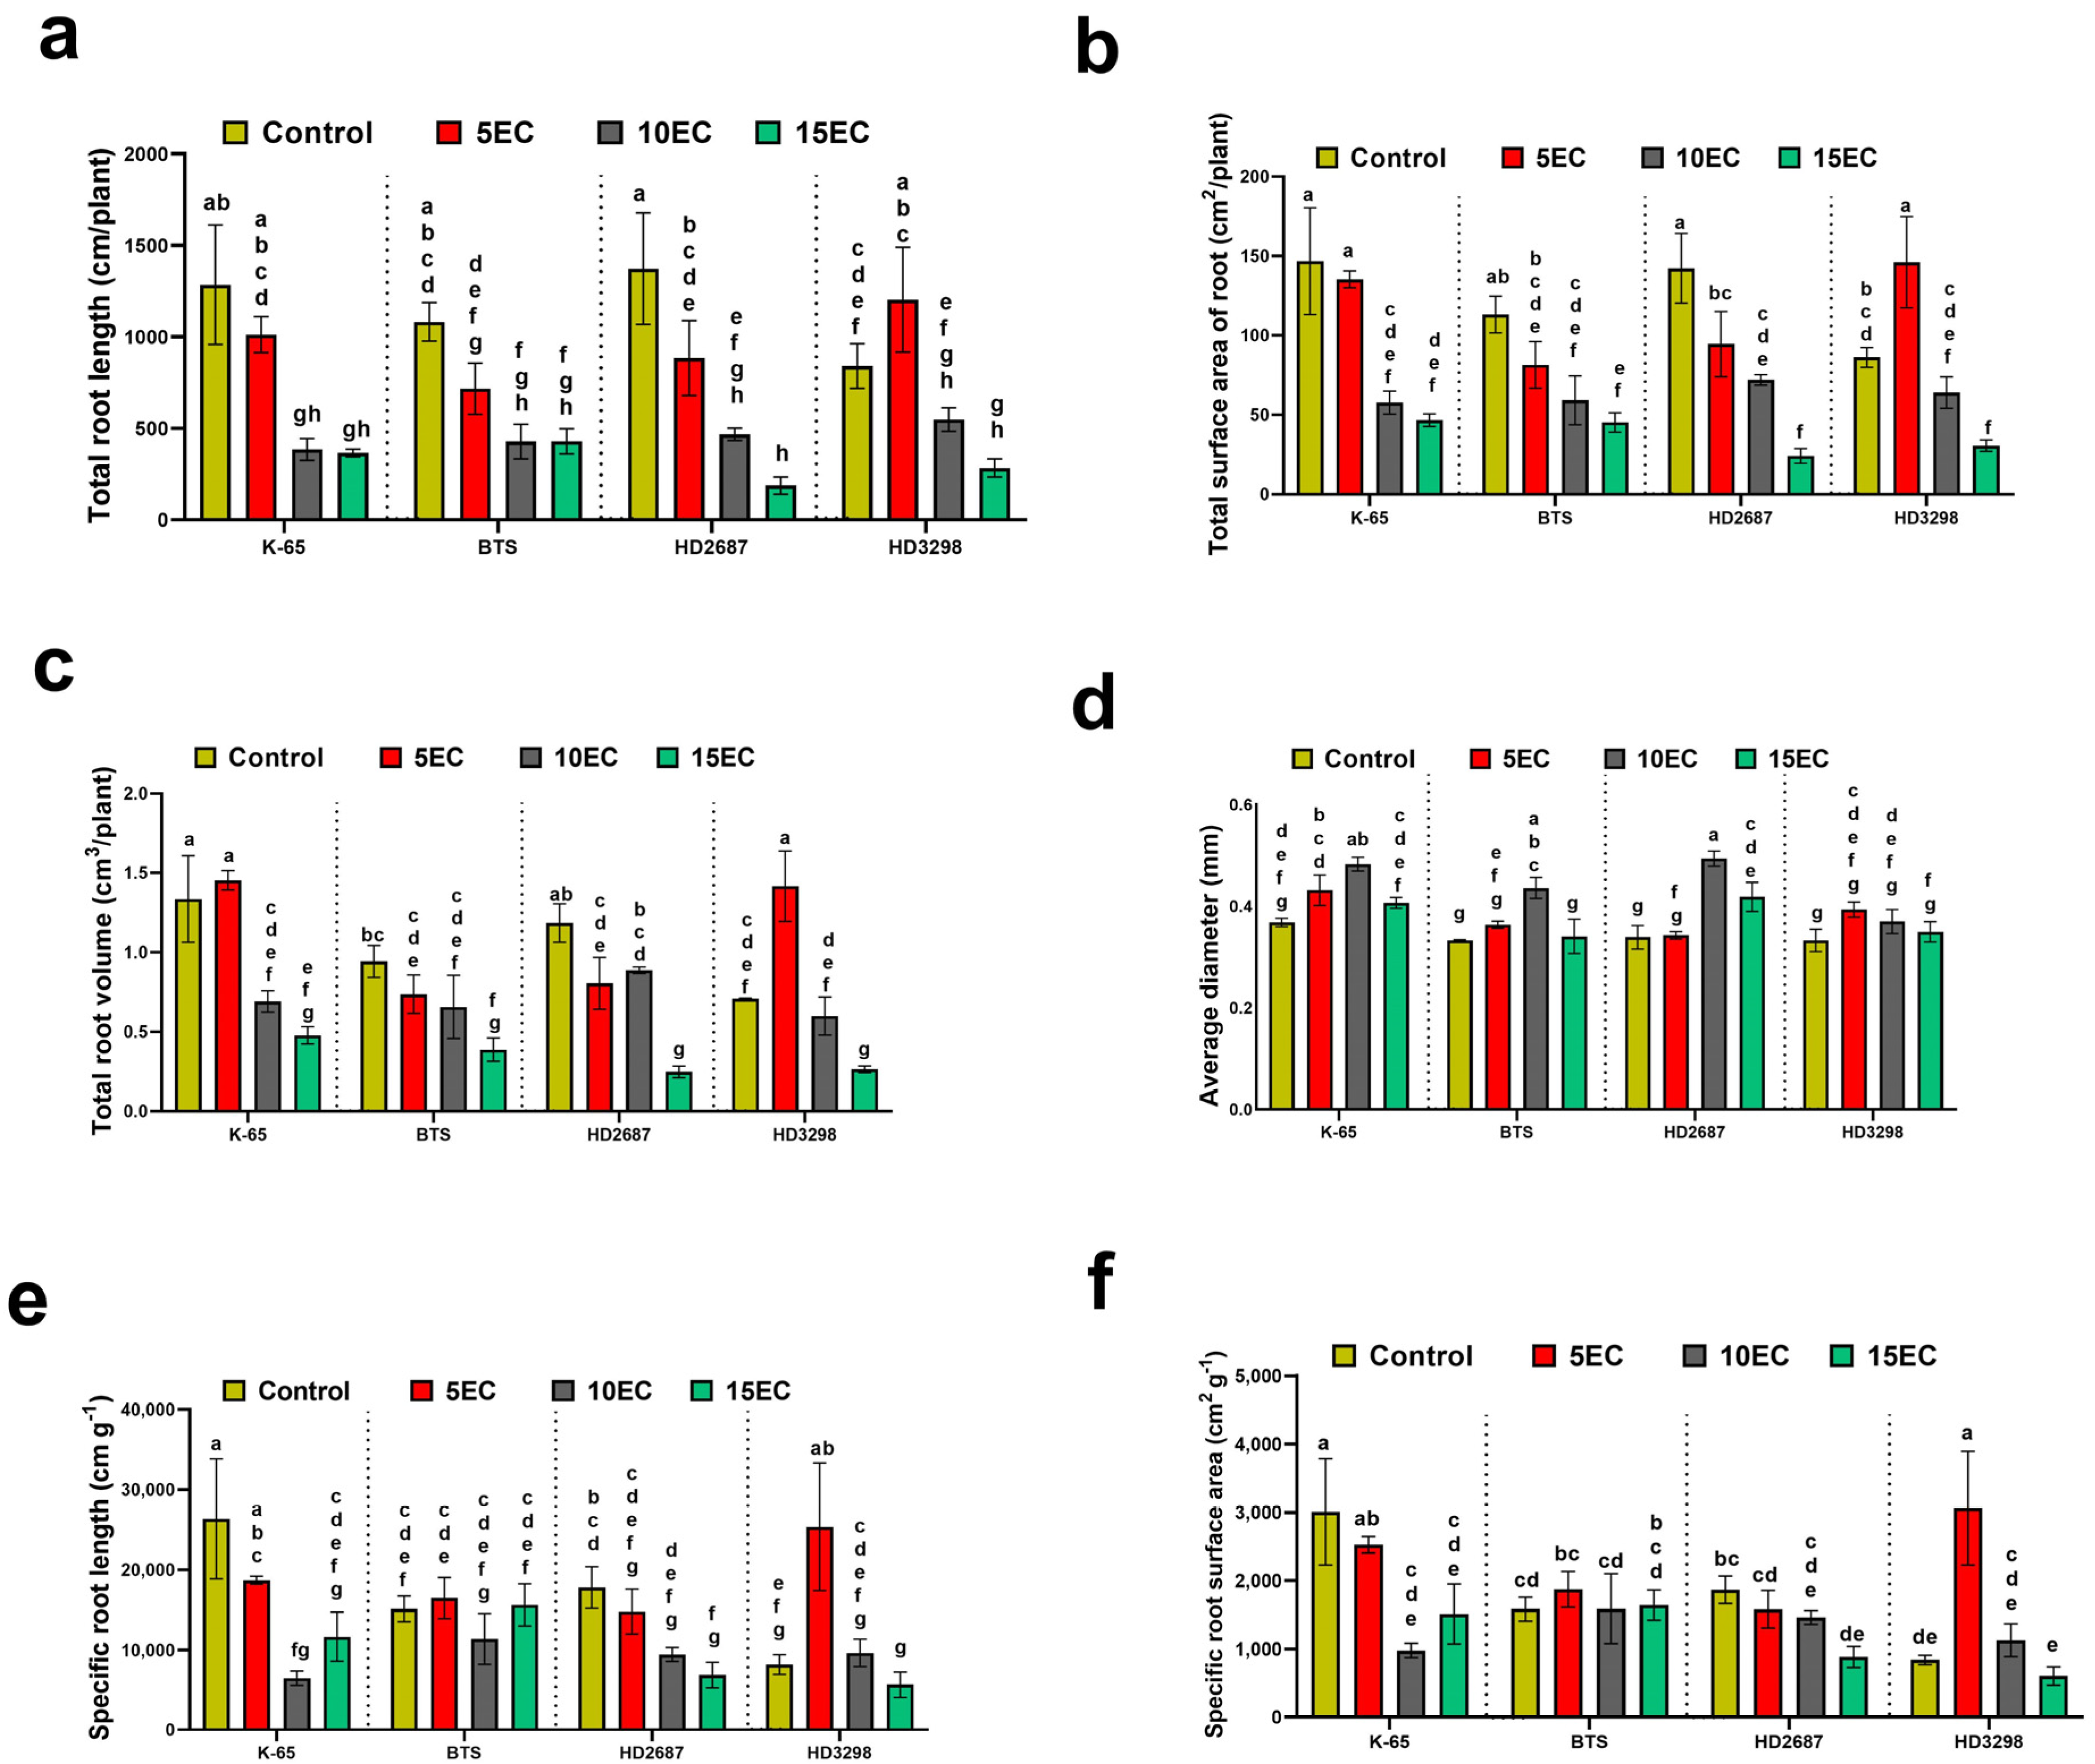
The effects of different levels of salt stress on biomass, RWC, MSI, and CCM are given in Figure 1. Biomass was significantly affected by increasing the level of saline stress (Figure 1a,b). Regarding shoot dry weight (SDW), the known saline-sensitive genotype HD2687 was significantly reduced by a salt concentration of 15 dS m−1 (−82%), as was BTS (−63%). Genotype HD3298 showed a significantly higher mean value (0.299) compared to other genotypes. In root dry weight (RDW), a trend similar to SDW is seen. At 15 dS m−1, HD3298 showed the highest RDW with mean of 0.053 among all genotypes. The sensitive genotype HD2687 showed a reduction in RDW (−64%) compared to its control. The known tolerant variety K-65 performed well at 10 dS m−1 and 15 dS m−1 salt stress levels in comparison to sensitive genotype. At 10 dS m−1, K-65 showed a noticeably higher mean value (0.059) than control and other treatments. The RWC and MSI of all four genotypes were significantly affected by salt stress treatment (Figure 1c,d). In HD2687, there was −6.23% and −7.61% reduction of RWC at 10 dS m−1 and 15 dS m−1, respectively. Among all the genotypes, the highest magnitude of reduction was recorded in BTS, at 15 dS m−1 with a mean value of 74.6%. At 5 dS m−1, the RWC was on par with control in all four genotypes. At 15 dS m−1 there was significant electrolyte leakage (−6%) noted in MSI in all four genotypes. CCM was recorded from all genotypes; in K-65, CCM was similar in all treatments (Figure 1e).

3.2. Root Traits

The effect of salt stress on different root traits such as total root length (TRL), total root surface area (TSA), total root volume (TRV), average diameter (AD), specific root length (SSL), and specific root surface area (SSA) was significant (Figure 2, Supplementary Figure S2). There was a large influence of EC on the root traits of all the genotypes. HD2687 showed a significant reduction in TRL (−87%), TSA (−83%), TRV (−79%), SSL (−61%), and SSA (−52.6%) as compared to control. The average diameter (AD) of HD2687 root with 10 dS m−1 was the highest (~0.4937) among all genotypes. The fraction (%) of RL, RV, and RSA in different root diameter classes were also retrieved (Supplementary Figures S3–S6). The contribution of different diameter classes towards root length was altered by salt stress in K-65, while in other genotypes the differences were not prominent, suggesting an adaptive phenotype of K-65. The contribution of different diameter classes to RSA and RV was altered by salt stress in all the genotypes.

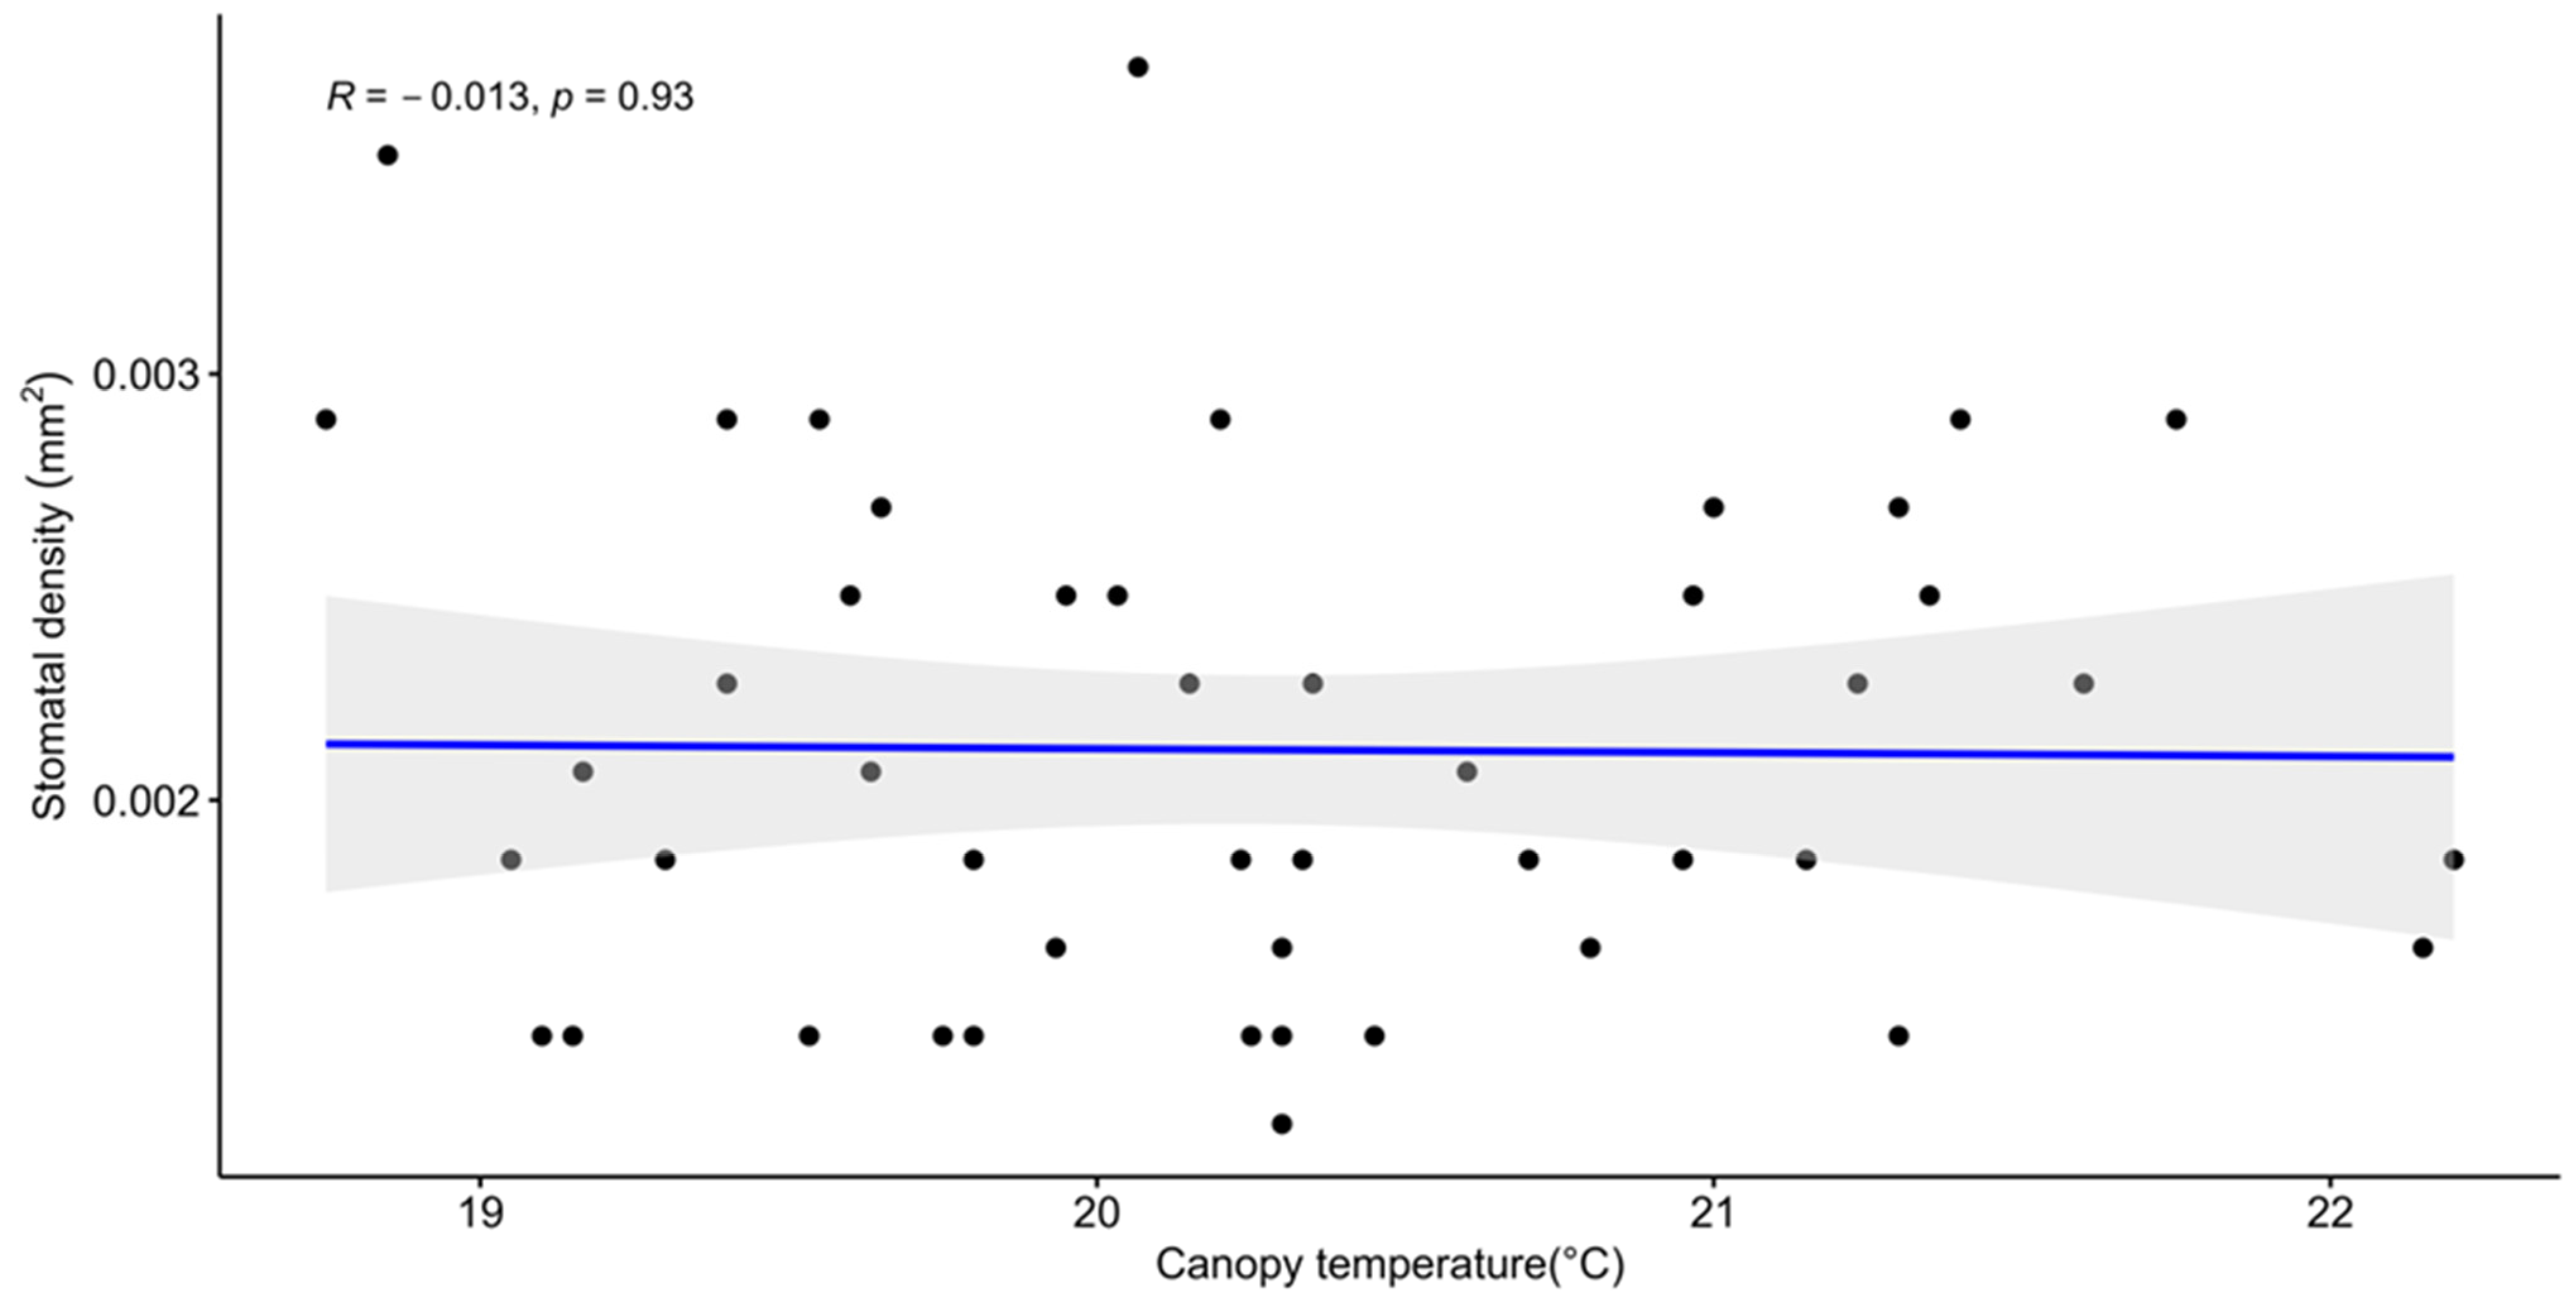
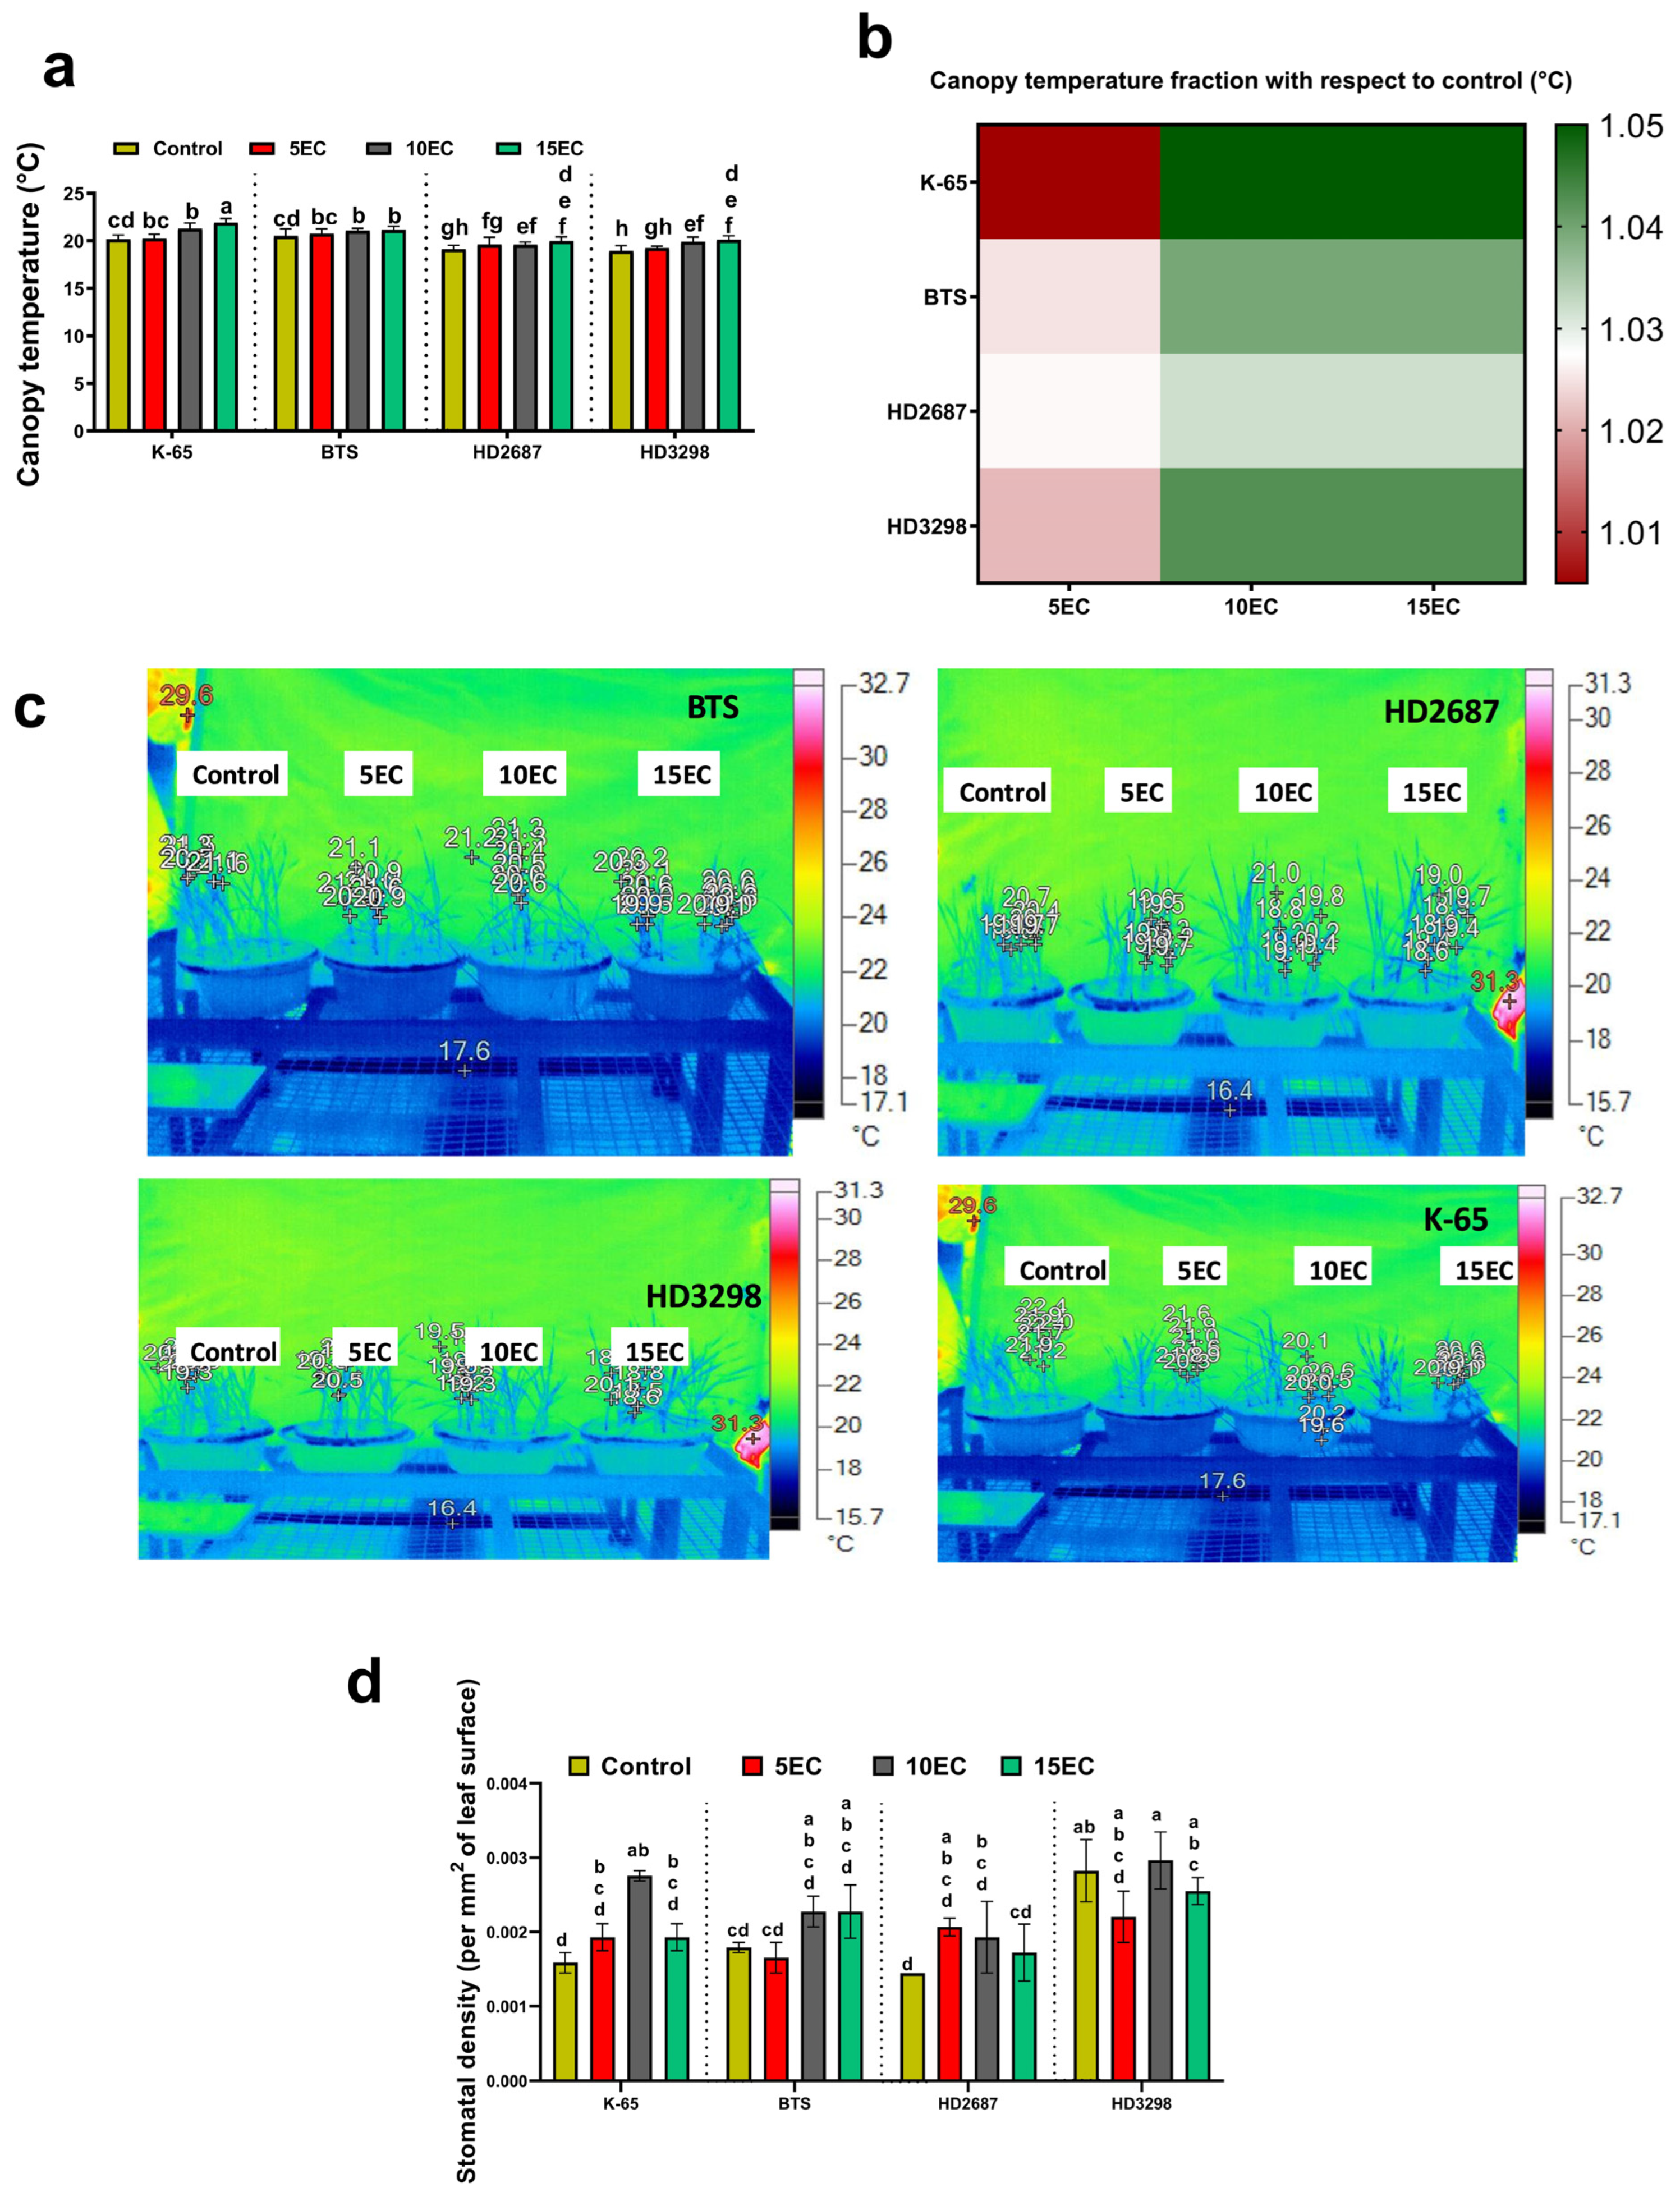
3.3. Shoot Thermal Image and Stomatal Density

The canopy temperature (CT) and stomatal density of genotypes were recorded at different levels of treatment (Figure 3). At 15 dS m−1, K-65 showed the highest canopy temperature among all genotypes with a mean value of 21.9 °C and a 9.13% CT increase over control, and HD2687 and HD3298 showed a canopy temperature of 19.98 °C (4.5% increase) and 20.11 °C (5.96%), respectively. At 10 dS m−1, K-65 and BTS showed the same temperature (~21 °C), and HD2687 and HD3298 showed the same CT (~19.61 °C). HD3298 leaves showed higher stomatal density at 10 dS m−1 with a mean value of 0.029622 per mm2 of leaf surface. HD2687 leaves showed a 15% increase in stomata over control at 15 dS m−1. K-65 and HD2687 showed the least stomatal density with a mean value of ~0.014467 per mm2 of leaf surface area incontrol compared other genotypes.

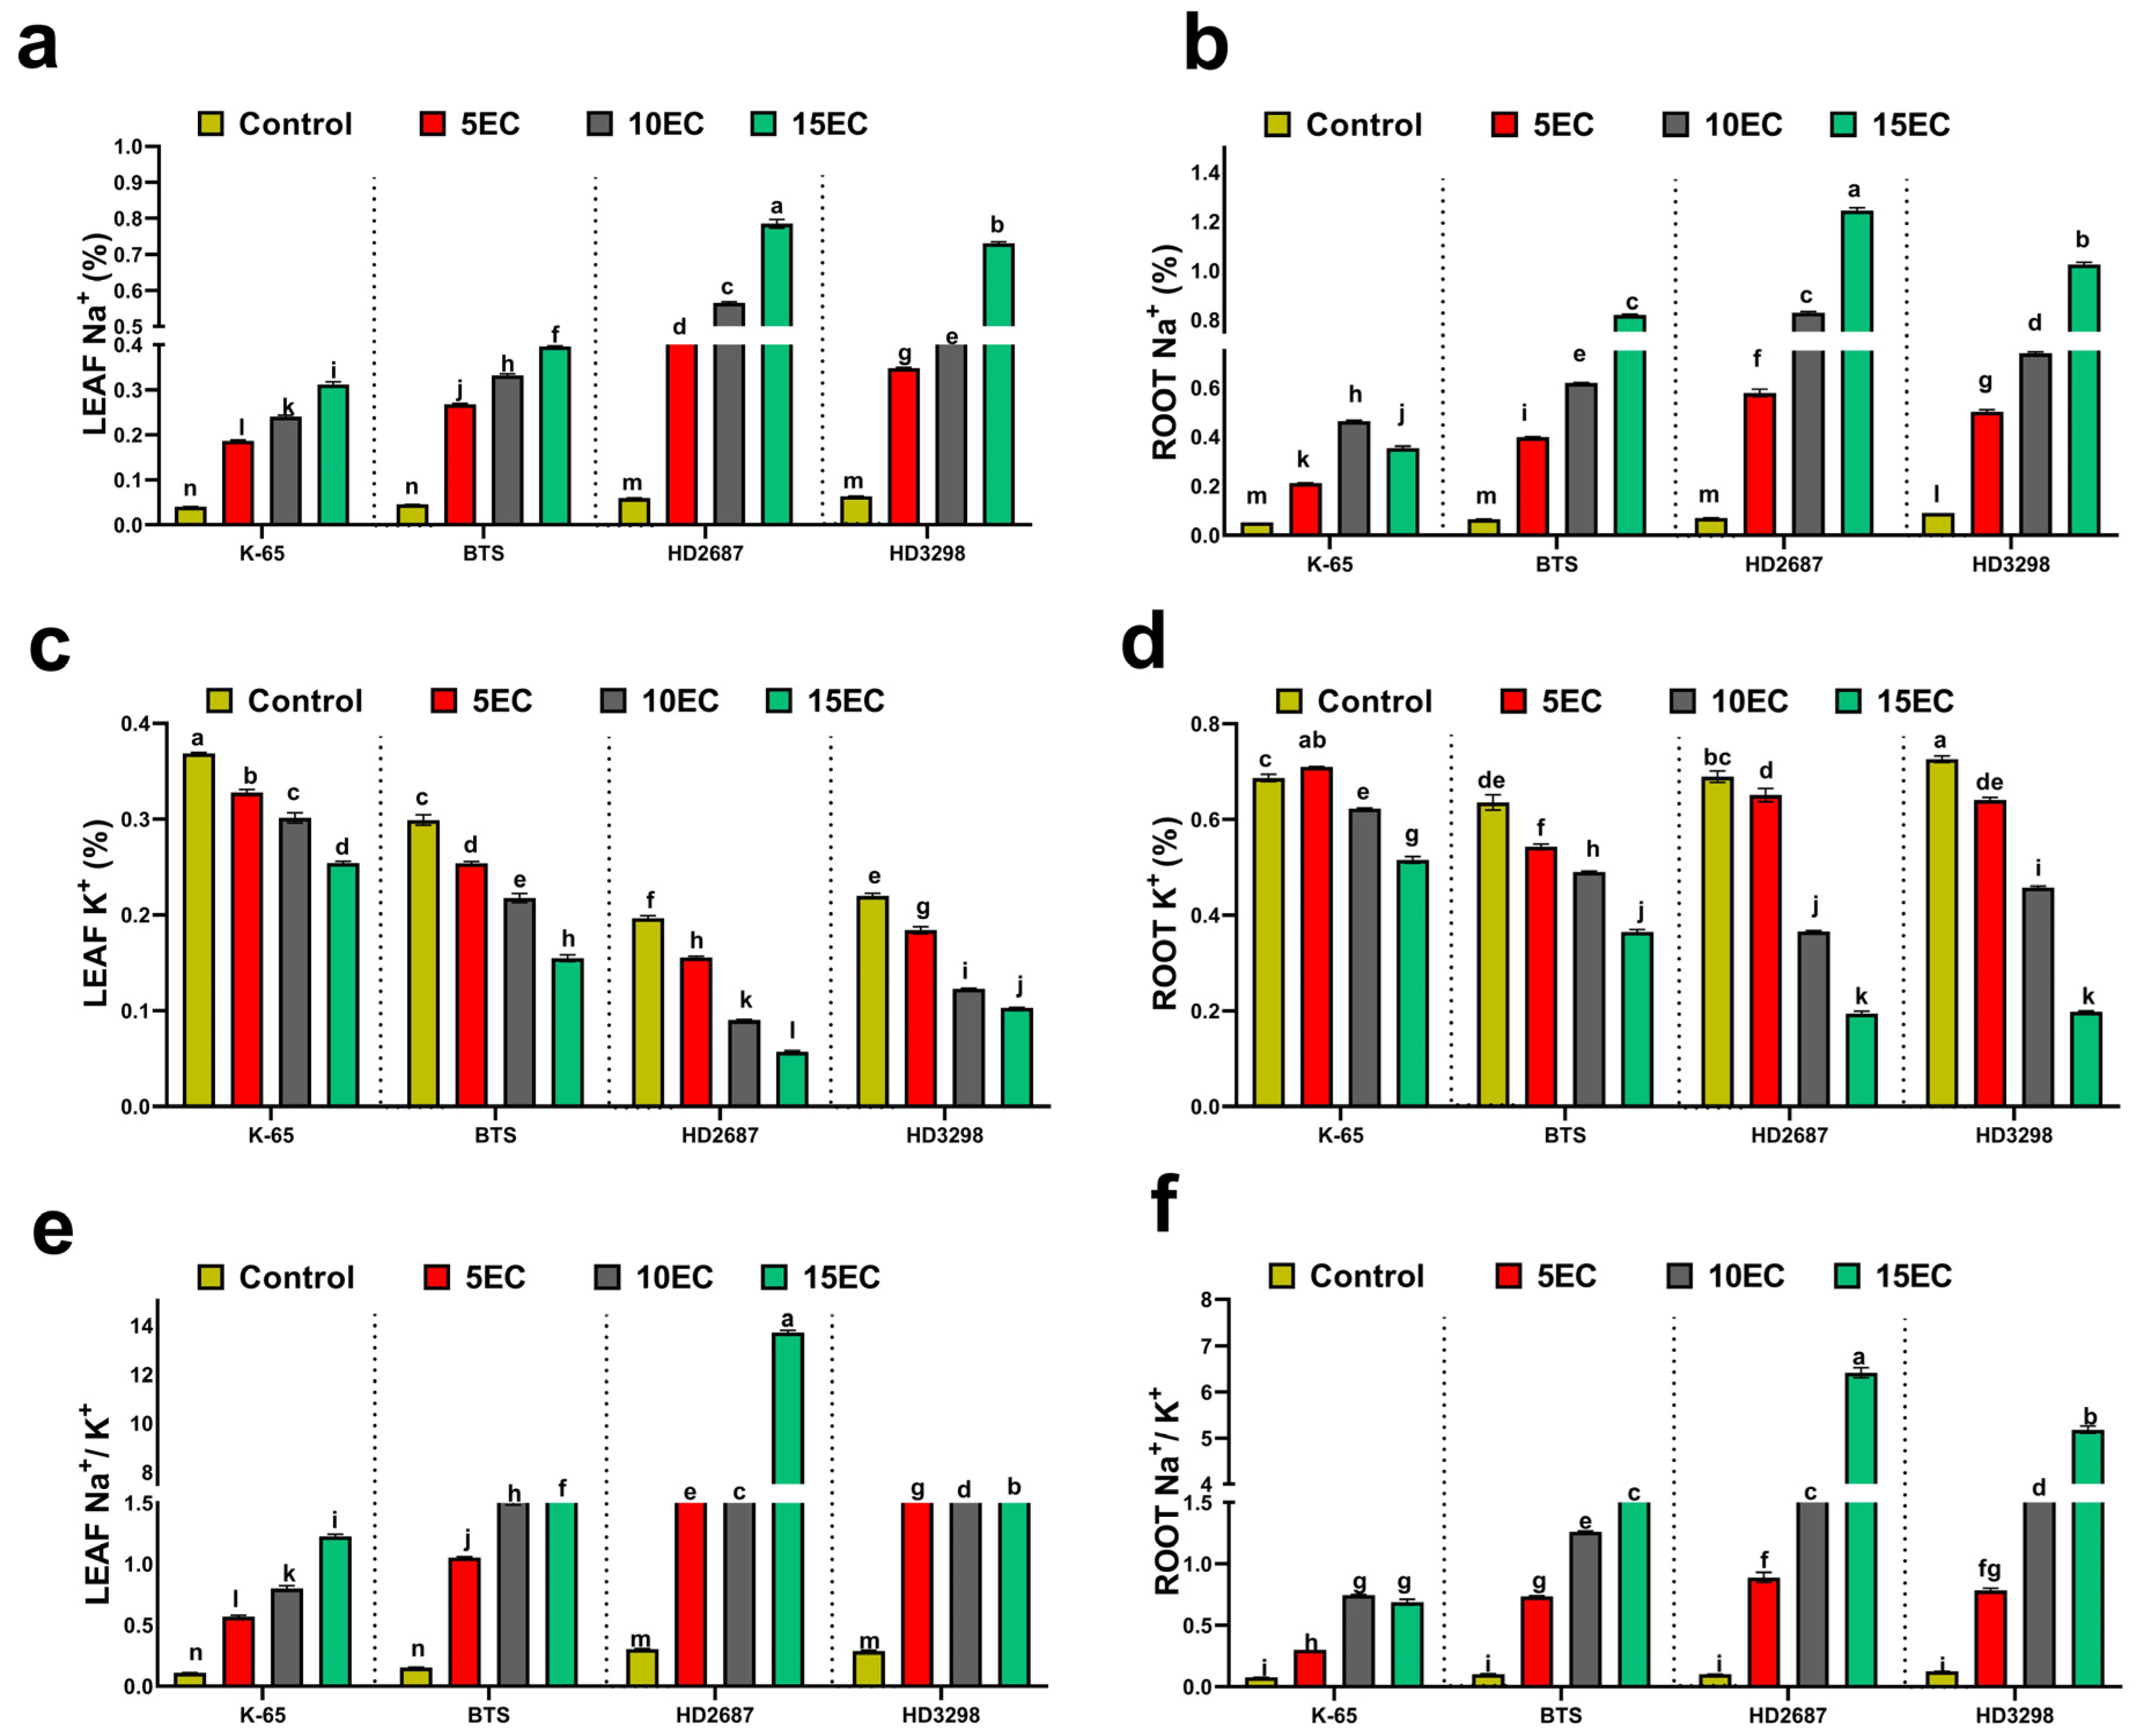
3.4. Tissue Na+ and K+ Content

In terms of leaf and root Na+ and K+ content, the genotypes showed significant variation at all treatment levels (Figure 4). In HD2687, leaf and root Na+ content was higher (0.79477% and 1.2291%), manifesting in a 12-fold increase in leaf Na+ content and a 20-fold increase in root Na+ content over control. The tolerant genotype K-65 showed significantly low leaf Na+ content as well as root Na+ content at all treatment levels compared to other genotypes (Figure 4a,b). The K+ content of leaves and roots also showed significant variation among treatment levels and genotypes. K-65 showed a significantly higher K+ content irrespective of treatment intensity. At 15 dS m−1, K-65 leaves and roots showed a 1.45- and 1.35-fold decrease compared to control, respectively, a higher significance than other genotypes at 15 dS m−1. Among all genotypes, HD2687 had the lowest K+ level in the leaves and roots, with mean values of 0.057% and 0.194%, respectively, at 15 dS m−1. (Figure 4c,d). The Na+/K+ ratios were also calculated for leaf and root tissues (Figure 4e,f). Among all genotypes, HD2687 showed a significantly higher Na+/K+ ratio in leaves as well as roots, which were 45.5 and 63.3 times higher, respectively, than control. The overall trend in K+ content in leaf and root tissue was K-65 > BTS > HD3298 > HD2687, and the reverse trend was followed in the case of leaf and root Na+ content.

3.5. Oxidative Stress Status of Tissues

To measure the oxidative status of tissue, SORs were measured spectrophotometrically and via histochemical study using NBT (Supplementary Figure S3). A higher quantity of SORs was observed in HD2687 and HD3298 control leaf tissue (Supplementary Figure S3a,b). At 5 dS m−1, HD3298 leaves showed significantly higher levels of SORs than other EC treatments; this is 7.44% higher than control (Supplementary Figure S3a). At 15 dS m−1, HD2687 showed the lowest levels of SORs among all genotypes, with a mean of 33.53. At 5 dS m−1, SOR levels were higher in the leaves of all genotypes except HD3298. The root SOR levels of HD2687 at 15 dS m−1 were significantly lower than those of other genotypes at other EC levels, with a mean of 0.7825 (Supplementary Figure S3b). At 5 dS m−1, K-65, BTS, and HD2687 showed significantly higher SOR levels than their controls. In the histochemical study, the stain was quantified and represented on a percentage basis (Supplementary Figure S3c,d). The relative magnitude of staining in leaf tissue showed significant variation among genotypes and treatments; these results match spectrophotometrically measured SOR accumulation. At 10 dS m−1, BTS showed a faint staining compared to its control. In root tissue, the percentage of staining was statistically similar in the K-65, BTS, and HD2687 genotypes irrespective of EC levels, but not in HD398.
Another oxidative stress indicator is the amount of H2O2 generated by the plant in response to different EC levels. Histochemical staining of H2O2 with DAB in leaf and root tissues was quantified and given as a percentage basis (Supplementary Figure S3e,f). The highest amount of staining in leaf tissue was observed in BTS and K-65 at 15 dS m−1 and 10 dS m−1 with a mean of 93.97 and 93.77, respectively. At 10 dS m−1 and 15 dS m−1, HD2687 showed the same level of staining with a mean of ~56 (Supplementary Figure S3e). Regarding root tissues, K-65 and HD2687 showed the highest intensity of DAB staining at 10 dS m−1 and 15 dS m−1 with a mean of 75.19 and 80.26, respectively (Supplementary Figure S3f). Oxidative stress generated under high salt stress induces phytotoxic reactions such as lipid peroxidation measured from malondialdehyde content (MDA) or thiobarbituric acid reactive substances (TBARS). Surprisingly, the TBARS content was higher in control treatment in both leaf and root tissue.

3.6. Antioxidant Enzymes Activity

Antioxidant enzyme activity at increasing levels of salt stress was measured in leaf and root tissue and is denoted here in terms of dry weight (Supplementary Figure S4a–h). SOD activity was lower in salt-stressed plants irrespective of genotype, treatment, or tissue type (Supplementary Figure S4a,b). At 15 dS m−1, the leaf SOD activity in K-65 was lower compared with other EC levels. A significant reduction in SOD activity was observed at 15 dS m−1 in all genotypes. A similar trend was also followed for SOD activity in all root tissues except HD3298. At 15 dS m−1, HD2687 showed low SOD activity (a reduction of −72% compared to control). Leaf and root APX (Supplementary Figure S4c,d) showed a significant reduction among all genotypes irrespective of treatment. The highest APX activity was observed in the K-65 control, followed by HD3298. Increasing the level of stress induced a decreasing trend in APX, especially at the 10 dS m−1 and 15 dS m−1 levels. In root tissues, a decreasing trend in APX was observed irrespective of the EC level in all genotypes (Supplementary Figure S4d), and there was not much significant difference among treatments.
Leaf and root CAT (Supplementary Figure S4e,f) activity was higher in controls compared to stress-treated plants. The HD2687 control showed significantly higher activity with a mean value of 6839.72, while at 15 dS m−1, HD2687 showed the least CAT activity (mean: 574.54) (Supplementary Figure S4e). In the root, the highest CAT activity was observed in HD3298 control and K-65 at 15 dS m−1 with a mean of 130.80 and 134.52, respectively. The least amount of CAT activity was observed in HD2687 at 15 dS m−1 with a reduction of −53% compared to its control (Supplementary Figure S4f). Glutathione reductase (GR) was measured in leaf and root tissues (Supplementary Figure S4g,h). In the leaf tissue, the highest GR activity was recorded in HD3298 at 5 dS m−1, followed by its control. The lowest GR activity was observed in BTS and HD2687 leaves at 15 dS m−1 (Supplementary Figure S4g) with mean values of 55.90 and 44.97, respectively. In the root tissue, the highest GR was recorded in the HD3298 control with a mean of 12.55 (Supplementary Figure S4h). The roots of HD2687 and BTS showed decreasing GR activity with increasing EC levels. At 15 dS m−1, they showed −66.28% and −43.02% reduction, respectively, in GR, as compared to their respective controls.

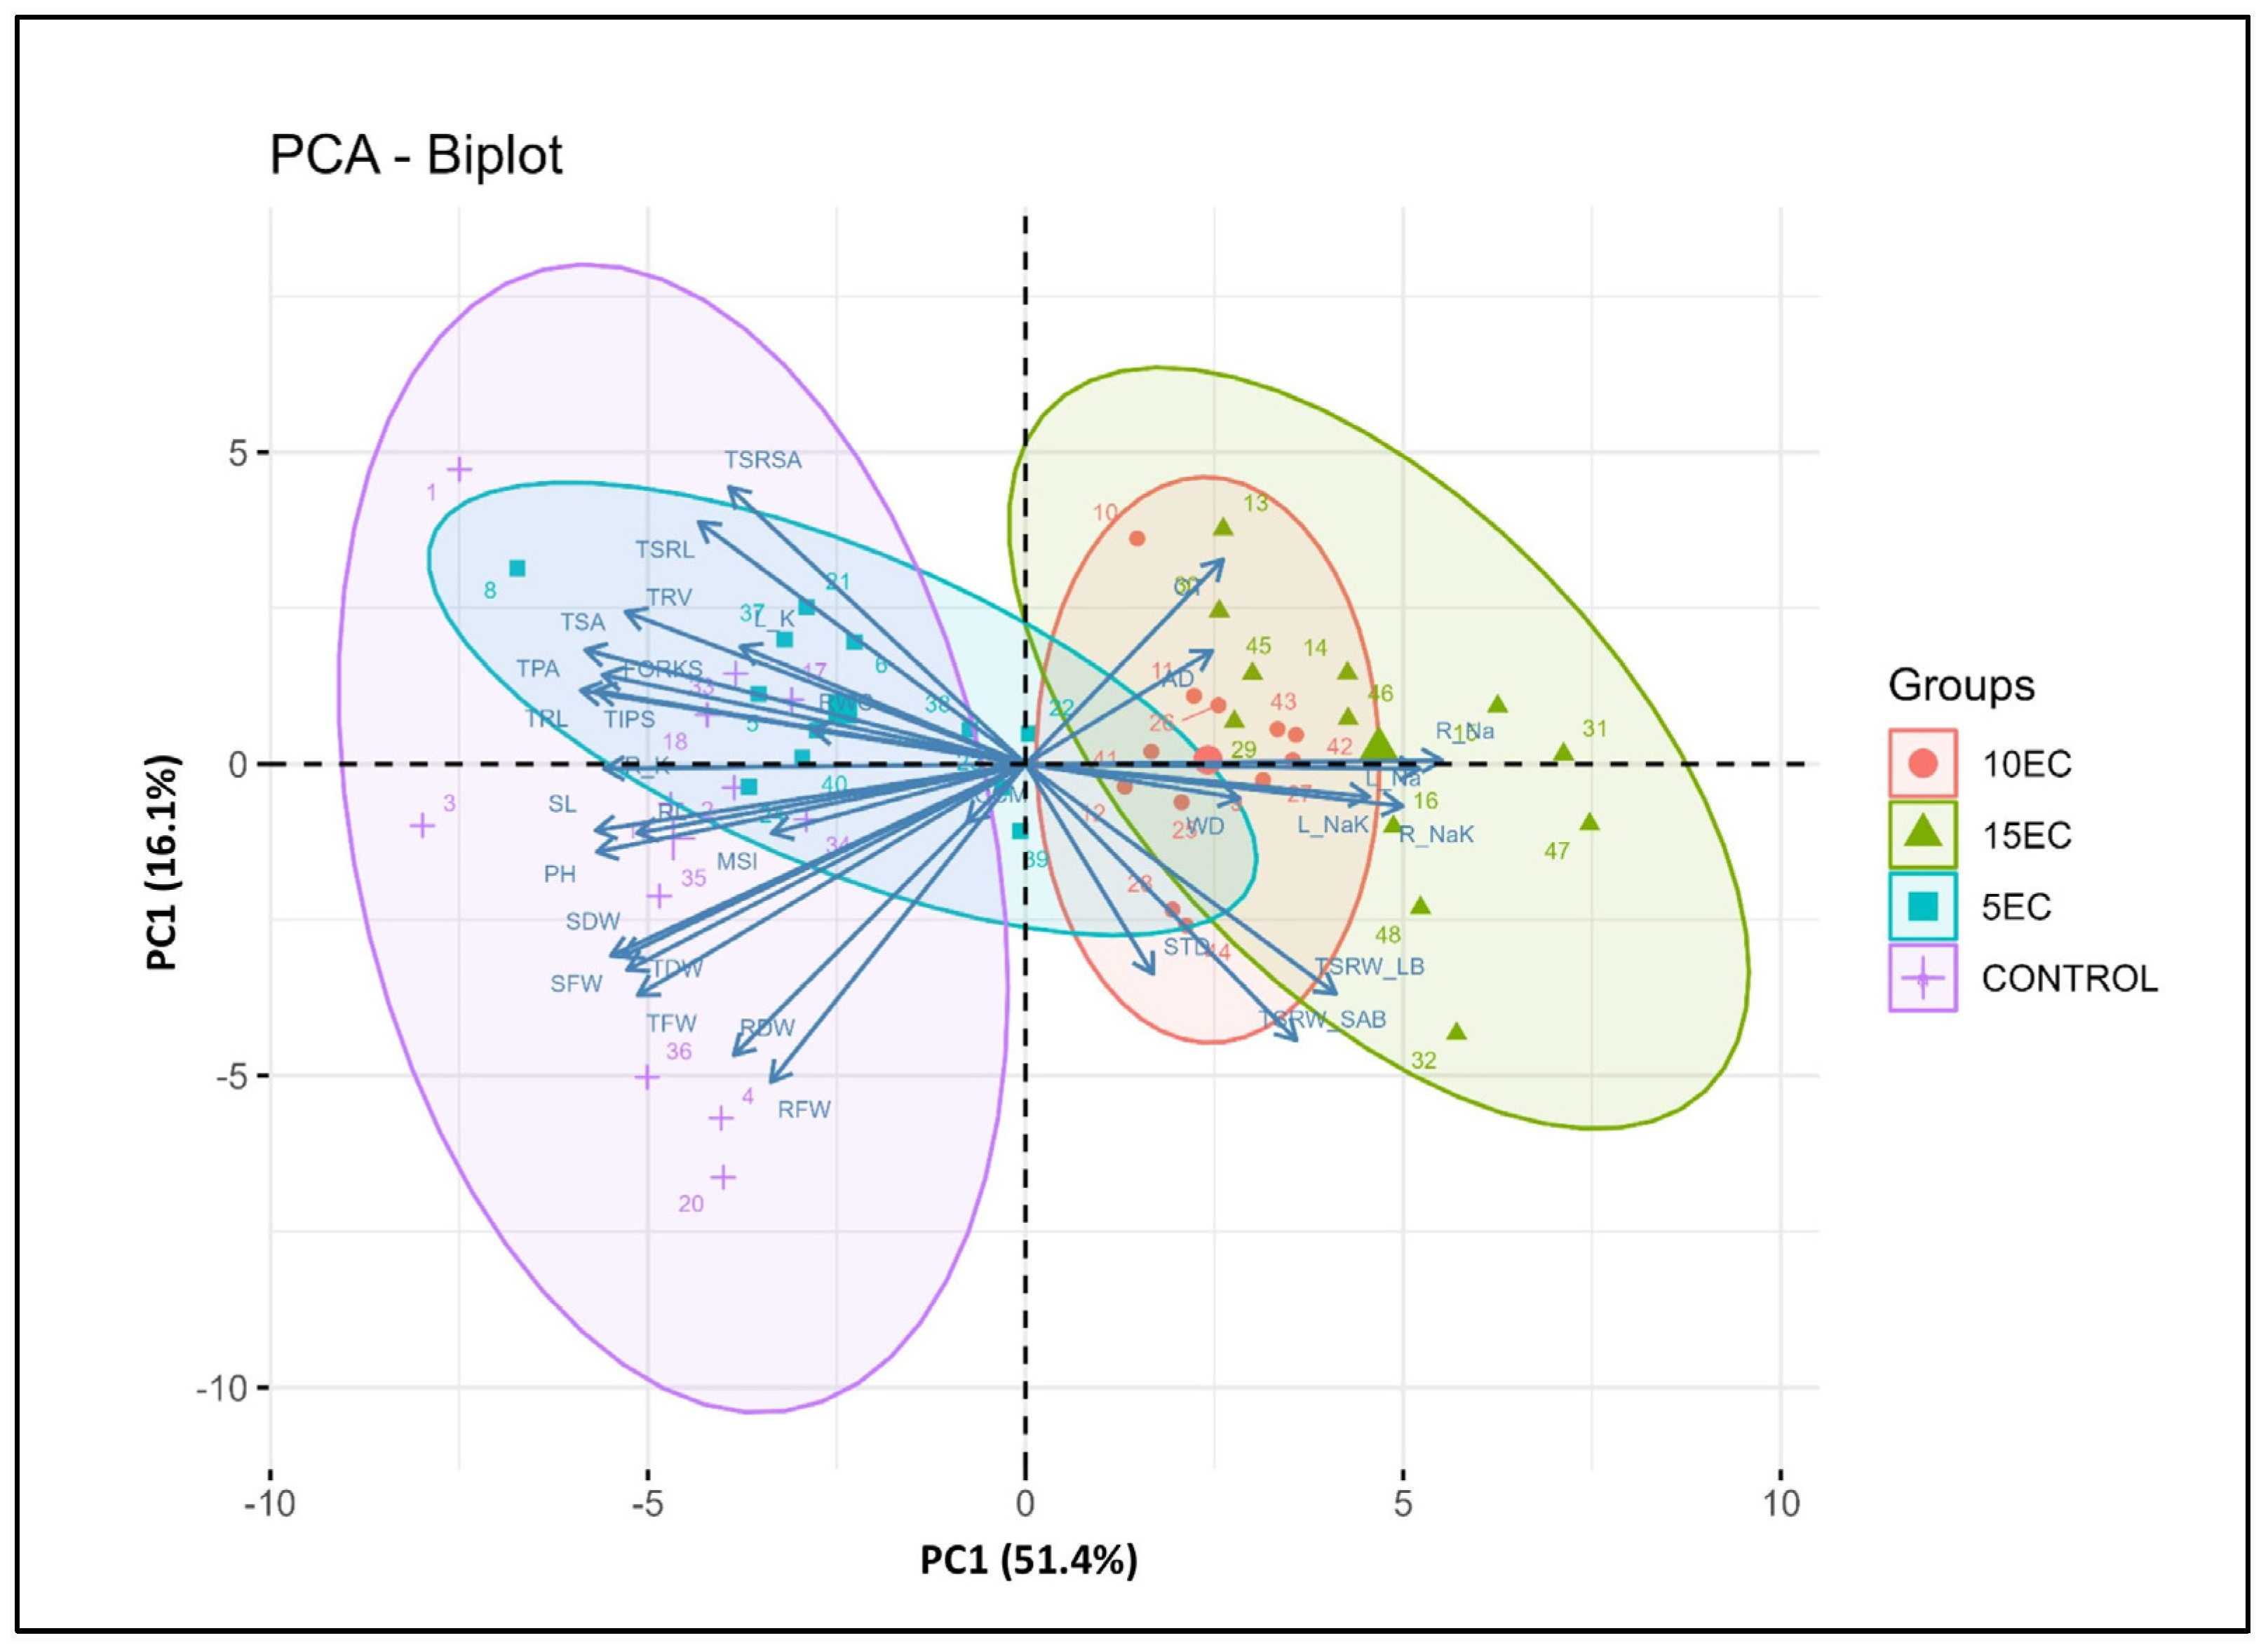
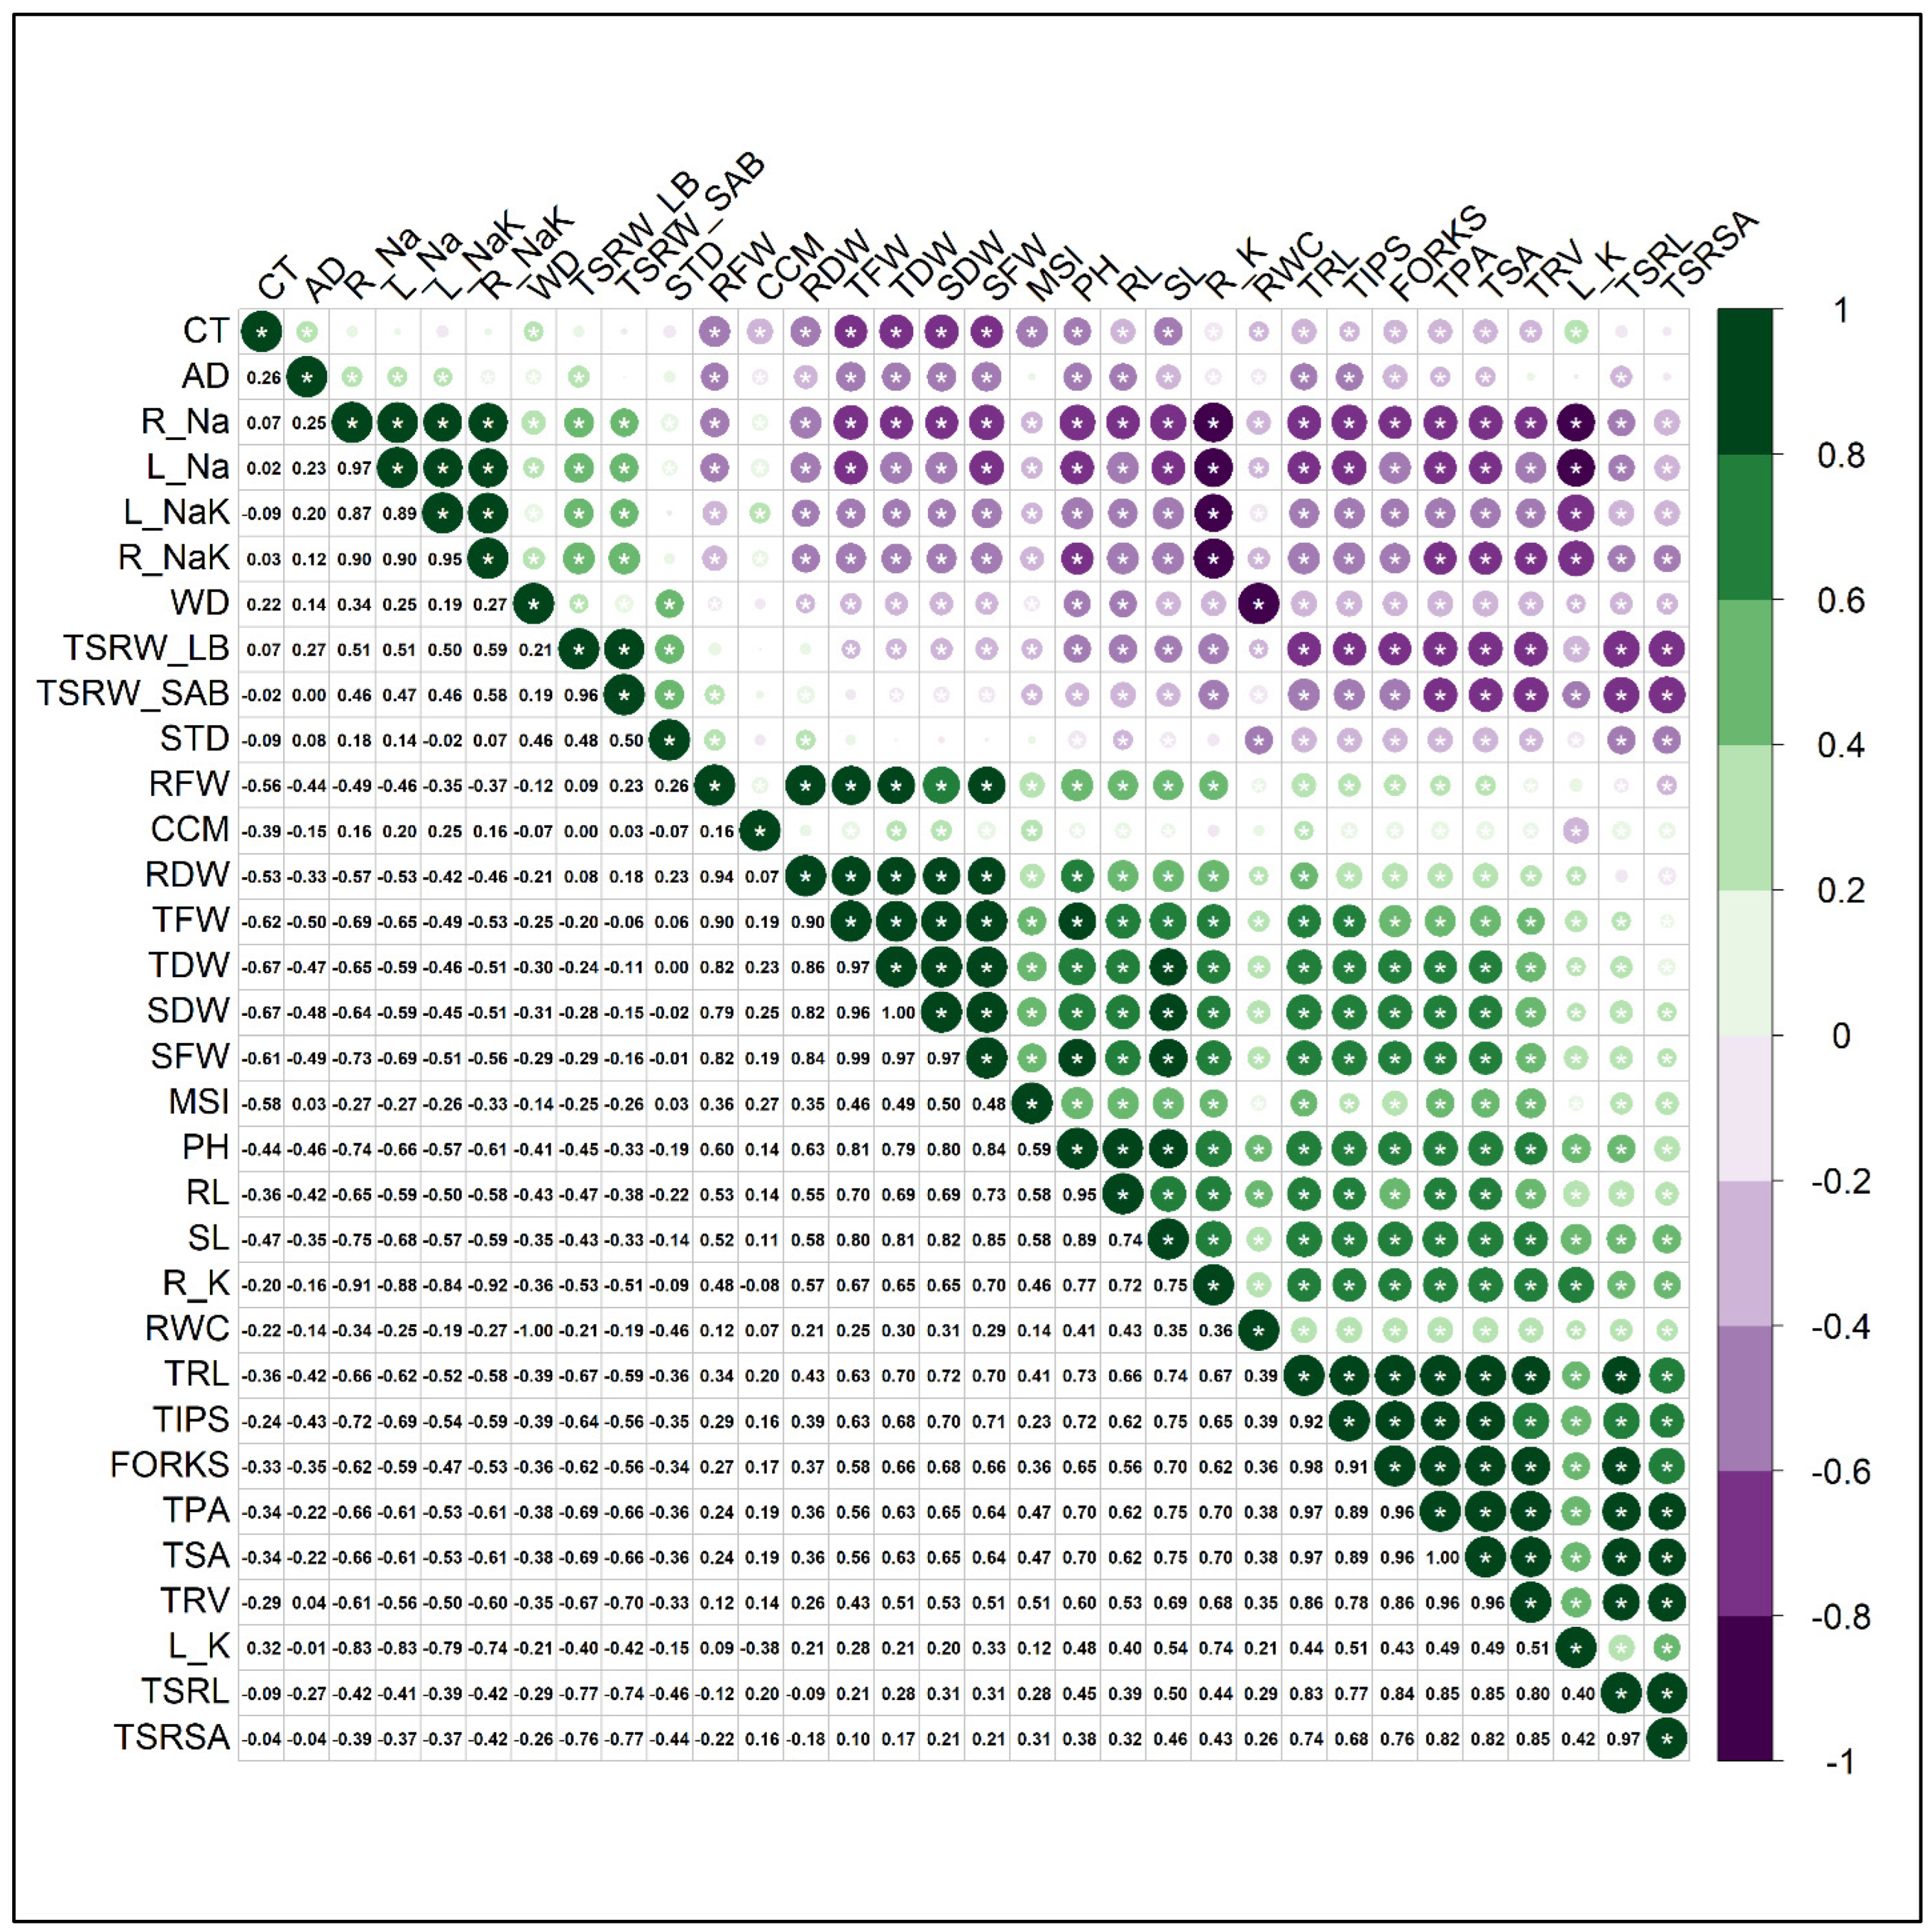
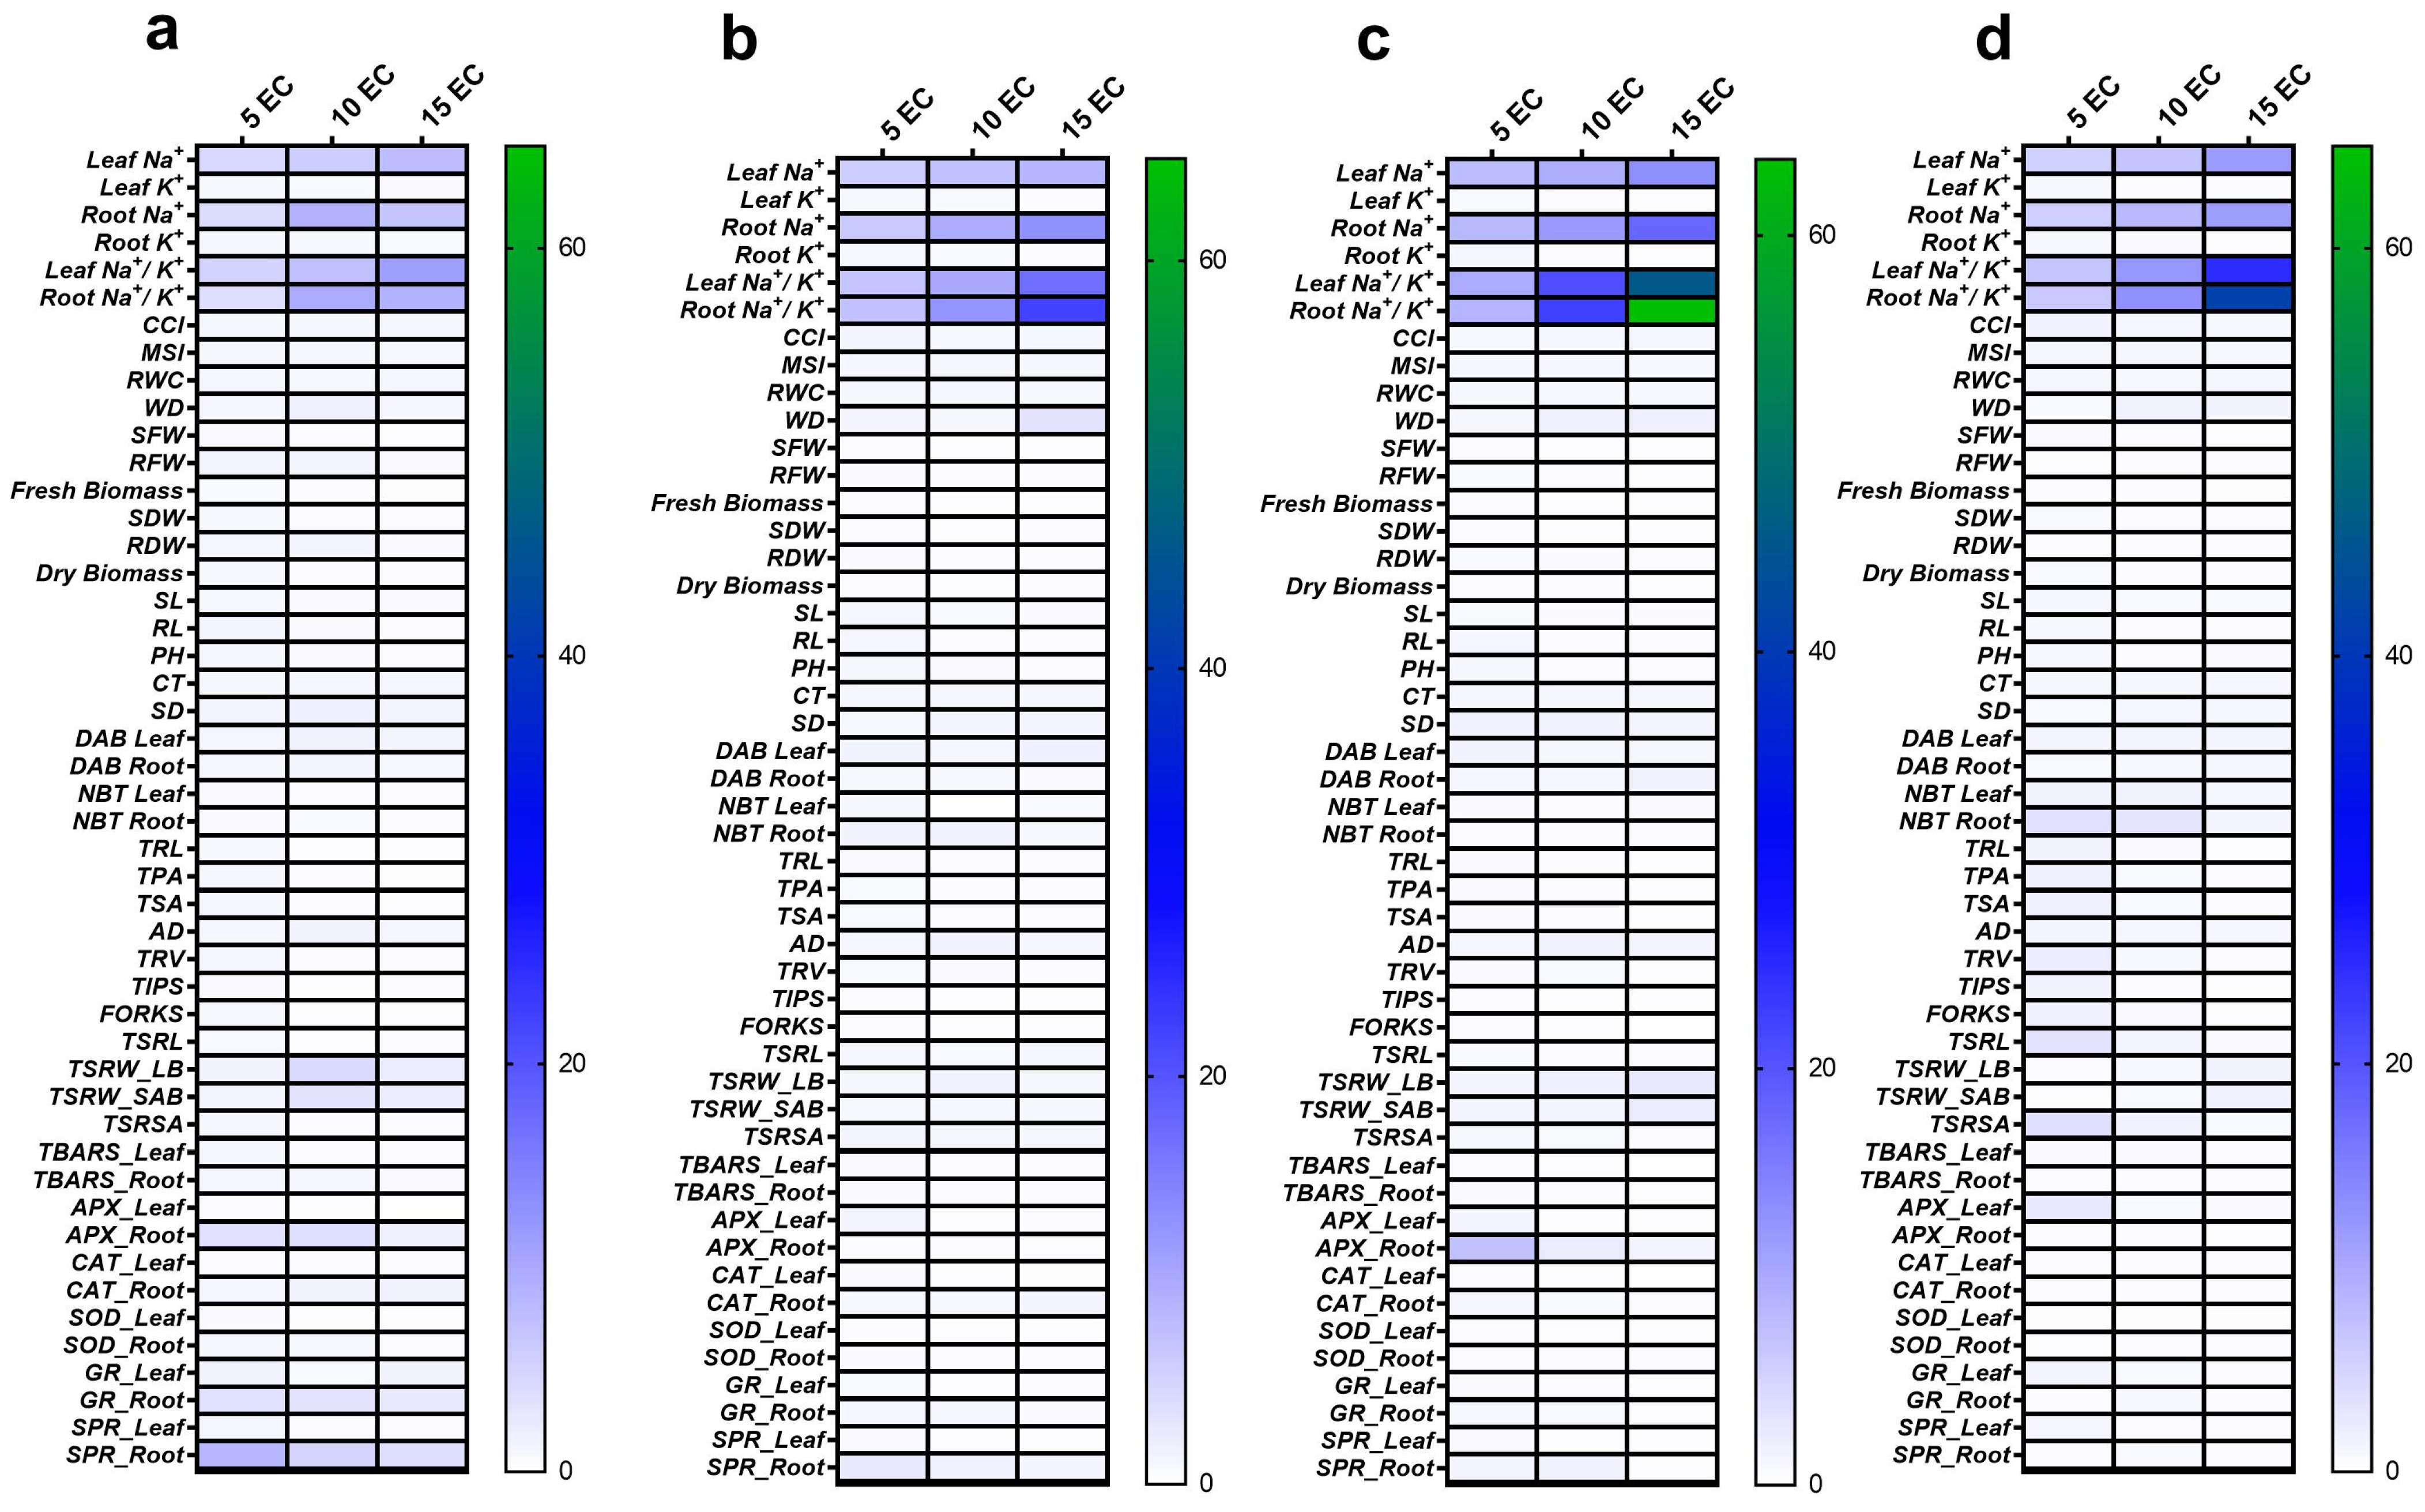
3.7. Correlation of Different Traits, STI and Principal Component Analysis (PCA)

Correlation between ROS content, antioxidant enzyme activity, ion content, canopy temperature, and different physiological parameters in wheat genotypes was analyzed. A general trend of positive correlation was observed among traits. A strong positive association was found between the activity of SOD in the shoot with the activity of SOD in the root (r = 0.86); CAT activity in the shoot (r = 0.87); superoxide radicals in the shoot (r = 0.75); shoot dry weight (SDW) (r = 0.87); TBARS in the shoot (r = 0.86); relative water content (RWC) (r = 0.30); and TBARS in the root (r = 0.79). A highly significant negative correlation was observed between RWC and WD (r = −1.00). Tissue ionic concentration was negatively correlated with most of the other traits. Leaf sodium was negatively correlated with CAT in the root (r = −0.49), APX in the shoot (r = −0.48), SOD in the shoot (r = −0.70), SOD in the root (r = −0.61), SPR in the shoot (r = −0.56), CAT in the shoot (r = −0.59), SDW (r = −0.59), TBARS in the shoot (r = −0.56), root dry weight (RDW) (r = −0.53), GR in the shoot (r = −0.40), TBARS in the root (r = −0.46), MSI (r = −0.27), and GR in the root (r = −0.20). Stomatal density (ST) was negatively correlated with RWC, while Na+ content of shoots and roots was negatively correlated with respective K+ ion contents. Root K+ ion contents were positively correlated with robustness of antioxidant system; root Na+ content was negatively correlated with antioxidant activity (Figure 5). Canopy temperature and ST were weakly negatively correlated (Figure 5 and Figure 6).
Genotypic variation in STI for plant growth parameters is visible in the heat maps (Figure 7a–d); for example, K-65 showed higher STI for biomass and root traits in comparison to other genotypes, while genotype HD2687 showed very high values of leaf Na+/K+ ratio and root Na+/K+ ratio, which is a the trait negatively correlated with salt tolerance.
Using principal component analysis (PCA), the important contributing traits from the analyzed array of variables were determined. In PCA, unsupervised linear transformation de-entangles the large set of variables to a smaller set of variables called “principal components”. The following PCA biplot was created using only PC1 and PC2 because they had the largest variance among all the PCs. Positively correlated variables (biomass, root traits, antioxidant enzyme activity) are grouped together, while negatively correlated variables are located on the opposite side of the plot origin (Na+ content, Na+/K+ ratio). A 2D biplot of treatments and variables is shown in Figure 8. Control and 5 dS m−1 are grouped together and placed opposite the overlapping cluster of 10 dS m−1 and 15 dS m−1.

4. Discussion

One of the main abiotic factors limiting agricultural productivity is high soil salt stress. To ensure survival in saline conditions, halophytes have evolved structural and functional adaptations [30]. Most crop plants are glycophytes, which lack the morphological components necessary for salt excretion and are therefore unable to survive severe salt stress. On the contrary, the natural variation in salt stress tolerance among and within species of glycophytes is evident. The genetic factors governing salt tolerance in glycophytes can be identified based on this natural variation [31,32]. Three primary processes for salt tolerance in agricultural plants were described by [14]: (1) regulating salt intake; (2) minimizing damage from accumulated toxic ions; and (3) tolerance to osmotic stress. Most studies on salt tolerance have focused on the first two aspects, i.e., how to prevent salt from entering the plant or how to lessen its effects once it is taken up [33]. Tolerance to ROS and the antioxidant system come into play much later in the tolerance mechanism. That could probably be the reason behind the varied response in ROS accumulation and antioxidant enzymes after short-term exposure to salt stress. Regardless of the crop’s capacity to avoid/exclude salt, the osmotic effect of salt stress mostly limits the growth of salt-stressed crop plants. Salts in the soil cause the osmotic effect, which can be characterized as a water-stress impact [34] as they make it difficult for roots to get water from the soil. The first reaction of a plant to salt stress occurs within seconds to hours upon exposure to salt stress. Exposure to salt stress results in the initiation of a quiescent state, which is followed by growth recovery, albeit at lower growth rates than observed under control conditions. In the present study, the samplings of the plants were taken over a short span of time (within 3 weeks of stress), and the plants were expected to be in the quiescent state; furthermore, the salt stress solutions were replenished to designated levels frequently. Due to the osmotic effect, growth rates and stomatal conductance were decreased [14,15,31]. IR thermal imaging can “visualize” the differences in leaf temperature caused by variations in transpiration rates; hence, it might be used to evaluate the tolerance to osmotic stress in cereal crops [33]. Osmotic stress causes a decrease in transpiration rate and the subsequent leaf latent heat flux, which raises the surface temperature and, in turn, increases the temperature differential between salt-treated and control seedlings [33]. There was a negative connection between increased leaf temperature and salt tolerance, proving that IR thermography can be used to evaluate genotypic variation for osmotic stress tolerance [33,35]. In the current study, we could also successfully use thermal images to differentiate salt-tolerant (K-65) and sensitive (HD2687) genotypes.
The onset of quiescence is attributed to the “osmotic” effect of salt stress, which occurs independently from Na+ accumulation in the photosynthetic tissues. As a result of increased ABA levels brought on by salt stress, DELLA proteins are stabilized in an ABI1-dependent manner [36], whereas brassinosteroid signalling is suppressed to increase growth quiescence further [37]. Lower cell cycle activity is caused by stress-induced regulation of the gibberellin and brassinosteroid signalling pathways, which may explain a decrease in meristem growth during the quiescent phase [38]. The acquisition and balance of vital nutrients including K+, Ca2+, and magnesium (Mg2+) are adversely affected by an excess of Na+ [39]. Na+ and K+ have comparable physiochemical properties, which causes Na+ to substitute for K+ at K+’s normal binding sites and disrupt cellular biochemistry [40]. The variation in the Na+/K+ ratio presented in the study also suggests a genotypic variation in salt tolerance depicted as changes in ion homeostasis.
Over an extended period, an increase of sodium ions (Na+) in the shoot will have detrimental effects on plant growth and development, leading to a decrease in the photosynthesis rate. This above-optimal Na+ is not properly compartmentalized at the cellular or intercellular level; this accumulation can lead to significant consequences. Salt stress affects the growth of specific plant organs to different degrees, resulting in modifications to overall plant phenology, including shifts in the root-to-shoot ratio. These changes in plant phenology induced by salt stress are likely to influence the overall performance of a plant when subjected to saline conditions. [31]. We found significant variation in plant root length, root surface area, root surface area, and dry weight, which also suggests the osmotic impact of salt stress in the current study. The genotypic variation found in these traits further validates the utility of using these for screening germplasm.
Higher levels of salt were found to be harmful for root growth, but much less salt stress was found to promote MR and LR [41,42]. Many plant hormones (auxin, ethylene, ABA, JA, and brassinosteroids) have an impact on how root system architecture (RSA) develops in saline stress conditions [4]. Because fewer cells are involved in cell division during salt stress, the size of the MR meristem is reduced [38]. The images presented in Supplementary Figure S2 clearly depict the impact of incremental salt stress on RSA in wheat. Genotype K-65 maintains a better root system, while HD2687 shows severe reduction in root biomass and other root traits. The degree of salt stress also affects how lateral root primordium (LRP) develops. Higher levels of salt stress inhibited the production of LRs from LRP [43], whereas 50 mM NaCl increased the proportion of LRP that transformed into LRs [42]. In the present study, 5 dS m−1 did not stimulate root growth; however, in the majority of root traits, plants from control and 5 dS m−1 performed on par with each other. The fraction of root length, root surface area, and root volume contributed by different diameter classes was also analyzed. In root length, the contribution of LR (diameter ≤ 0.5 mm) was decreased in saline conditions in all genotypes except HD3298. A general shift towards a higher contribution of MR towards root traits can be seen (Supplementary Figures S3–S6). The cyclin B1 (CYCB1), a cell cycle marker, is downregulated when LRs are inactive, suggesting that lateral root meristem activity is suppressed. Studies in rice reveal that LR production and emergence play a significant role in sodium exclusion, since Na+ was found to leak through LR branching sites, indicating that plants with fewer LRs would benefit from more effective Na+ exclusion [44,45,46]. Together, the findings imply that the most effective method for compartmentalizing and excluding salt in the root stele may be RSA with a few longer LRs. Our data also point out genotypic variation in LR and MR traits in response to different salt stress levels. The idea of differential control of RSA dynamics is novel [4,47] and should be further explored by identifying molecular regulators in strategies and natural variation.
Wu et al., 2019 [48] found that the STI of shoot fresh weight was a reliable screening criterion for the evaluation of salt tolerance in inbred Brassica napus lines. We found that STI of biomass, root traits, and Na+/K+ ratio of leaves and roots were significantly different in salt-tolerant and sensitive wheat genotypes. A thorough investigation of multi-index results would more accurately describe a plant’s tolerance to salt. However, assessing numerous traits consumes effort and time, particularly when carried out on a large scale. Principal component analysis (PCA) was used to reduce the dimensionality of the data and discover potential correlations between the observed features, using an experimental dataset made up of 18 maize cultivars and 18 distinct factors [49]. The PCA analysis of 13 morphological and physiological characteristics could effectively identify salt-tolerant tomato germplasm [50,51]. The first and second principal components of PCA were utilized in this work to find the most significant selection traits for salt tolerance. Multivariate analysis techniques such as PCA-biplot make it easier to identify and choose the primary characters by combining traits and objects in two dimensions and minimizing overlapping variations [52]. According to the PCA, the attributes root Na+, Na+/K+-ratio, shoot K+, shoot Na+, SDW, RSA, TRL, etc. made a greater contribution to characterizing the variation between the treatments.

5. Conclusions

Identifying salt-tolerant cultivars and donor lines is the most important strategy for lowering soil salinity in the face of climate change. A complete comprehension of the underlying physiological characteristics is necessary for genotype selection. The differing responses of wheat genotypes that are salt-tolerant and -sensitive were examined in this study using a total of 33 traits. The results revealed that the four wheat genotypes responded to salt stress in relatively different ways. The plants’ ability to maintain growth was hampered by the osmotic impact of salt stress, and the resulting decrease in stomatal conductance raised the canopy temperature. The ability to distinguish between salt-tolerant (K-65) and -sensitive (HD2687) genotypes using thermal imaging was successful. While HD2687 showed a significant drop in root biomass and other root characteristics during salt stress, genotype K-65 retained a comparatively better root system. In addition, the genotypic heterogeneity in lateral and main root features in response to various salt stress levels is highlighted via the PCA. Total root length, total surface area, total root volume, tips, and other main lateral root features are the primary root traits that contribute most to salt tolerance in wheat. The attributes root Na+, Na+/K+-ratio, shot K+, shoot Na+, SDW, RSA, TRL, etc. made a significant contribution to the variation across the treatments, according to the PCA. The results of PCA analysis can be used to identify sensitive and tolerant wheat germplasm at the seedling stage. This work also supports the practical use of PCA analysis and STI to identify wheat genotype variability and its potential application to other crops to test salt tolerance.

Supplementary Materials

The following supporting information can be downloaded at: https://www.mdpi.com/article/10.3390/agriculture13101946/s1, Figure S1: Effect of salt stress (C: control, 5 dS m−1, 10 dS m−1, and 15 dS m−1) on total root length (a), total root surface area (b), total root volume (c) average root diameter (d) total specific root length (e) total specific root surface area (f) of wheat genotypes Kharchia 65 (K-65), B.T. Schomburgk (BTS), HD2687, and HD3298. Salt stress was imposed for 4 weeks via a mix of salts added to 7-day-old hydroponically grown wheat seedlings. Significant differences (p < 0.05) between treatment mean values are specified with different letters. Values are means (±SE) of 3 biological replicates; Figure S2: Effect of salt stress (C: control, 5 dS m−1, 10 dS m−1, and 15 dS m−1) on root growth of wheat genotypes Kharchia 65 (K-65), B.T. Schomburgk (BTS), HD2687, and HD3298. Salt stress was imposed for 4 weeks via a mix of salts added to 7-day-old hydroponically grown wheat seedlings; Figure S3: Effect of salt stress (C: control, 5 dS m−1, 10 dS m−1, and 15 dS m−1) on superoxide radical (SOR) content of leaf and root (a, b) Tissue localization of SOR in leaf and root (c, d) Hydrogen peroxide content visualized via DAB staining in leaf and root (e, f) and lipid peroxidation in leaf and root tissues (g, h) of wheat genotypes Kharchia 65 (K-65), B.T. Schomburgk (BTS), HD2687, and HD3298. Salt stress was imposed for 4 weeks via a mix of salts added to 7-day-old hydroponically grown wheat seedlings. Significant differences (p < 0.05) between treatment mean values are specified with different letters. Values are means (±SE) of 3 biological replicates. Figure S4: Effect of salt stress (C: control, 5 dS m−1, 10 dS m−1, and 15 dS m−1) on Superoxide dismutase activity in leaf and root (a, b) catalase activity in leaf and root (c, d) ascorbate peroxidase activity in leaf and root (e, f) and glutathione reductase activity in leaf and root tissues (g, h) of wheat genotypes Kharchia 65 (K-65), B.T. Schomburgk (BTS), HD2687, and HD3298. Salt stress was imposed for 4 weeks as mix of salts to 7 days old wheat seedlings grown under hydroponics. Significant differences (p < 0.05) between treatment mean values are specified with different letters. Values are means (±SE) of 3 biological replicates. Figure S5: Effect of salt stress (C: control, 5 dS m−1, 10 dS m−1, and 15 dS m−1) on Fraction (%) of root length in different diameter classes of wheat genotypes Kharchia 65 (K-65), B.T. Schomburgk (BTS), HD2687, and HD3298. Salt stress was imposed for 4 weeks via a mix of salts added to 7-day-old hydroponically grown wheat seedlings; Figure S6: Effect of salt stress (C: control, 5 dS m−1, 10 dS m−1 and 15 dS m−1) on Fraction (%) of root surface area in different diameter classes of wheat genotypes Kharchia 65 (K-65), B.T. Schomburgk (BTS), HD2687, and HD3298. Salt stress was imposed for 4 weeks via a mix of salts added to 7-day-old hydroponically grown wheat seedlings; Figure S7: Effect of salt stress (C: control, 5 dS m−1, 10 dS m−1, and 15 dS m−1) on fraction (%) of root volume in different diameter classes of wheat genotypes Kharchia 65 (K-65), B.T. Schomburgk (BTS), HD2687, and HD3298. Salt stress was imposed for 4 weeks via a mix of salts added to 7-day-old hydroponically grown wheat seedlings. Table S1: Two-way ANOVA results of measured traits of wheat genotypes Kharchia 65 (K-65), B.T. Schomburgk (BTS), HD2687, and HD3298 grown under hydroponics in control or salt stress conditions (C: control, 5 dS m−1, 10 dS m−1, and 15 dS m−1). CT (Canopy temperature, °C), AD (Average diameter of root,), R Na+ (Root Na+ content, %), L Na+ (Leaf Na+, %), L Na+/K+ (Leaf Na+/K+, %), R Na+/K+ (Root Na+/K+, %), WD (Water deficit, %), TSRW_LB (Total specific root weight length basis), TSRW_LB (Total specific root weight surface area basis), STD (Stomatal density), RFW (Root fresh weight, g), CCM (Chlorophyll Content meter (Chlorophyll content index), RDW (Root dry weight, g), TFW (Total fresh weight, g), TDW (Total dry weight, g), SDW (Shoot dry weight, g), SFW (Shoot fresh weight, g), MSI (Membrane stability index, %), PH (Plant height, cm), RL (Root length, cm), SL (Shoot length, cm), R_K+ (Root K+ content, %), RWC (Relative water content, %), TRL (Total root length), TIPS (Total root tips), FORKS (Total root forks), TPA (Total projected area), TSA (Total surface area), TRV (Total root volume), L_K+ (Leaf K+ content), TSRL (Total specific root length), TSRSA (Total specific root surface area). *, **, and *** indicate 5%, 1%, and 0.1% levels of significance, respectively.

Author Contributions

J.B. conducted the experiments and statistical analysis and prepared the graphs. R.R. contributed to statistical analysis. R.P. contributed to infrared thermography. L.S. and J.B. wrote the manuscript. L.S. and V.C. conceived the idea and designed the experiments. All authors have read and agreed to the published version of the manuscript.

Funding

This research was funded by [ICAR_IARI institute project] grant bumber [CRSCIARISIL20210024309] and [DBT] grant number [No.BT/Ag/Network/Wheat/2019-20] And The APC was funded by [NAHEP-CAAST, ICAR-IARI] grant number [NAHEP/CAAST/2018-19/07].

Institutional Review Board Statement

This article does not contain any studies with human participants or animals performed by any of the authors.

Data Availability Statement

All data generated or analysed during this study are included in this published article [and its supplementary information files].

Acknowledgments

The authors thank the ICAR-Indian Agricultural Research Institute for providing the necessary facilities. JB acknowledges ICAR-IARI for the junior research fellowship support received during the study.

Conflicts of Interest

The authors declare no competing interest.

References

  1. Bhardwaj, S.C.; Prashar, M.; Kumar, S.; Jain, S.K.; Datta, D. Lr19 Resistance in Wheat Becomes Susceptible to Puccinia triticina in India. Plant Dis. 2005, 89, 1360. [Google Scholar] [CrossRef] [PubMed]
  2. Zörb, C.; Geilfus, C.M.; Dietz, K.J. Salinity and Crop Yield. Plant Biol. 2019, 21, 31–38. [Google Scholar] [CrossRef] [PubMed]
  3. Wang, W.; Vinocur, B.; Altman, A. Plant Responses to Drought, Salinity and Extreme Temperatures: Towards Genetic Engineering for Stress Tolerance. Planta 2003, 218, 1–14. [Google Scholar] [CrossRef]
  4. Julkowska, M.M.; Testerink, C. Tuning Plant Signaling and Growth to Survive Salt. Trends Plant Sci. 2015, 20, 586–594. [Google Scholar] [CrossRef]
  5. Ashraf, M.; Harris, P.J.C. Photosynthesis under Stressful Environments: An Overview. Photosynthetica 2013, 51, 163–190. [Google Scholar] [CrossRef]
  6. Sathee, L.; Jha, S.K.; Rajput, O.S.; Singh, D.; Kumar, S.; Kumar, A. Expression Dynamics of Genes Encoding Nitrate and Ammonium Assimilation Enzymes in Rice Genotypes Exposed to Reproductive Stage Salinity Stress. Plant Physiol. Biochem. 2021, 165, 161–172. [Google Scholar] [CrossRef]
  7. Rengasamy, P. World Salinization with Emphasis on Australia. J. Exp. Bot. 2006, 57, 1017–1023. [Google Scholar] [CrossRef]
  8. Qadir, M.; Quillérou, E.; Nangia, V.; Murtaza, G.; Singh, M.; Thomas, R.J.; Drechsel, P.; Noble, A.D. Economics of Salt-Induced Land Degradation and Restoration. Nat. Resour. Forum 2014, 38, 282–295. [Google Scholar] [CrossRef]
  9. Singh, S.; Sengar, R.S.; Kulshreshtha, N.; Datta, D.; Tomar, R.S.; Rao, V.P.; Garg, D.; Ojha, A. Assessment of Multiple Tolerance Indices for Salinity Stress in Bread Wheat (Triticum aesticum L.). J. Agric. Sci. 2015, 7, 49–57. [Google Scholar]
  10. Goyal, E.; Amit, S.K.; Singh, R.S.; Mahato, A.K.; Chand, S.; Kanika, K. Transcriptome Profiling of the Salt-Stress Response in Triticum Aestivum Cv. Kharchia Local. Sci. Rep. 2016, 6, 27752. [Google Scholar] [CrossRef]
  11. Lekshmy, S.; Sairam, R.K.; Chinnusamy, V.; Jha, S.K. Differential Transcript Abundance of Salt Overly Sensitive (SOS) Pathway Genes Is a Determinant of Salinity Stress Tolerance of Wheat. Acta Physiol. Plant. 2015, 37, 1–10. [Google Scholar] [CrossRef]
  12. Sairam, R.K.; Rao, K.; Srivastava, G.C. Differential Response of Wheat Genotypes to Long Term Salinity Stress in Relation to Oxidative Stress, Antioxidant Activity and Osmolyte Concentration. Plant Sci. 2002, 163, 1037–1046. [Google Scholar] [CrossRef]
  13. Chaurasia, S.; Kumar, A.; Singh, A.K. Comprehensive Evaluation of Morpho-Physiological and Ionic Traits in Wheat (Triticum aestivum L.) Genotypes under Salinity Stress. Agriculture 2022, 12, 1765. [Google Scholar] [CrossRef]
  14. Munns, R.; James, R.A.; Läuchli, A. Approaches to Increasing the Salt Tolerance of Wheat and Other Cereals. J. Exp. Bot. 2006, 57, 1025–1043. [Google Scholar] [CrossRef]
  15. Munns, R.; Gilliham, M. Salinity Tolerance of Crops—What Is the Cost? New Phytol. 2015, 208, 668–673. [Google Scholar] [CrossRef]
  16. Lekshmy, S.; Vanita, J.; Sangeeta, K.; Pandey, R.; Rajendra, S. Effect of Elevated Carbon Dioxide on Kinetics of Nitrate Uptake in Wheat Roots. Indian J. Plant Physiol. 2009, 14, 16–22. [Google Scholar]
  17. Weatherley, P. Studies in Water Relations of Cotton Plants. I. The Field Measurement of Water Deficit in Leaves. New Phytol. 1950, 49, 81–87. [Google Scholar] [CrossRef]
  18. Sairam, R.K.; Deshmukh, P.S.; Shukla, D.S. Tolerance of Drought and Temperature Stress in Relation to Increased Antioxidant Enzyme Activity in Wheat. J. Agron. Crop Sci. 1997, 178, 171–178. [Google Scholar] [CrossRef]
  19. Naguib, W.B.; Divte, P.R.; Chandra, A.; Sathee, L.; Singh, B.; Mandal, P.K.; Anand, A. Raffinose Accumulation and Preferential Allocation of Carbon (14C) to Developing Leaves Impart Salinity Tolerance in Sugar Beet. Physiol. Plant. 2021, 173, 1421–1433. [Google Scholar] [CrossRef]
  20. Sathee, L.; Jain, V. Interaction of Elevated CO2 and Form of Nitrogen Nutrition Alters Leaf Abaxial and Adaxial Epidermal and Stomatal Anatomy of Wheat Seedlings. Protoplasma 2021, 2021, 1–14. [Google Scholar] [CrossRef] [PubMed]
  21. Kusumi, K.; Hirotsuka, S.; Kumamaru, T.; Iba, K. Increased Leaf Photosynthesis Caused by Elevated Stomatal Conductance in a Rice Mutant Deficient in SLAC1, a Guard Cell Anion Channel Protein. J. Exp. Bot. 2012, 63, 5635–5644. [Google Scholar] [CrossRef]
  22. Jagadhesan, B.; Sathee, L.; Meena, H.S.; Jha, S.K.; Chinnusamy, V.; Kumar, A.; Kumar, S. Genome Wide Analysis of NLP Transcription Factors Reveals Their Role in Nitrogen Stress Tolerance of Rice. Sci. Rep. 2020, 10, 1–16. [Google Scholar] [CrossRef] [PubMed]
  23. Kumar, D.; Yusuf, M.; Singh, P.; Sardar, M.; Sarin, N. Histochemical Detection of Superoxide and H2O2 Accumulation in Brassica Juncea Seedlings. Bio-Protocol 2014, 4, e1108. [Google Scholar] [CrossRef]
  24. Chaitanya, K.S.K.; Naithani, S.C. Role of Superoxide, Lipid Peroxidation and Superoxide Dismutase in Membrane Perturbation during Loss of Viability in Seeds of Shorea Robusta Gaertn.F. New Phytol. 1994, 126, 623–627. [Google Scholar] [CrossRef]
  25. Heath, R.L.; Packer, L. Photoperoxidation in Isolated Chloroplasts: I. Kinetics and Stoichiometry of Fatty Acid Peroxidation. Arch. Biochem. Biophys. 1968, 125, 189–198. [Google Scholar] [CrossRef] [PubMed]
  26. Dhindsa, R.S.; Plumb-Dhindsa, P.; Thorpe, T.A. Leaf Senescence: Correlated with Increased Levels of Membrane Permeability and Lipid Peroxidation, and Decreased Levels of Superoxide Dismutase and Catalase. J. Exp. Bot. 1981, 32, 93–101. [Google Scholar] [CrossRef]
  27. Nakano, Y.K.A. Hydrogen Peroxide Is Scavenged by Ascorbate Specific Peroxidase in Spinach Chloroplasts. Plant Cell Physiol. 1981, 22, 867–880. [Google Scholar]
  28. Aebi, H. Catalase. In Methods in Enzymatic Analysis; Bergmeyer, H.V., Ed.; Academic Press Inc.: New York, NY, USA, 1974; pp. 673–686. [Google Scholar]
  29. Smith, I.K.; Vierheller, T.L.; Thorne, C.A. Assay of Glutathione Reductase in Crude Tissue Homogenates Using 5,5′-Dithiobis(2-Nitrobenzoic Acid). Anal. Biochem. 1988, 175, 408–413. [Google Scholar] [CrossRef]
  30. Flowers, T.J.; Troke, P.F.; Yeo, A.R. The Mechanism of Salt Tolerance in Halophytes. Annu. Rev. Plant Physiol. 1977, 28, 89–121. [Google Scholar] [CrossRef]
  31. Munns, R.; Tester, M. Mechanisms of Salinity Tolerance. Annu. Rev. Plant Biol. 2008, 59, 651–681. [Google Scholar] [CrossRef]
  32. Katori, T.; Ikeda, A.; Iuchi, S.; Kobayashi, M.; Shinozaki, K.; Maehashi, K.; Sakata, Y.; Tanaka, S.; Taji, T. Dissecting the Genetic Control of Natural Variation in Salt Tolerance of Arabidopsis thaliana Accessions. J. Exp. Bot. 2010, 61, 1125–1138. [Google Scholar] [CrossRef]
  33. Sirault, X.R.R.; James, R.A.; Furbank, R.T.; Sirault, X.R.R.; James, R.A.; Furbank, R.T. A New Screening Method for Osmotic Component of Salinity Tolerance in Cereals Using Infrared Thermography. Funct. Plant Biol. 2009, 36, 970–977. [Google Scholar] [CrossRef] [PubMed]
  34. Epstein, E.; Norlyn, J.D.; Rush, D.W.; Kingsbury, R.W.; Kelley, D.B.; Cunningham, G.A.; Wrona, A.F. Saline Culture of Crops: A Genetic Approach. Science 1980, 210, 399–404. [Google Scholar] [CrossRef] [PubMed]
  35. Hu, Y.; Schmidhalter, U. Opportunity and Challenges of Phenotyping Plant Salt Tolerance. Trends Plant Sci. 2023, 28, 552–566. [Google Scholar] [CrossRef] [PubMed]
  36. Achard, P.; Cheng, H.; De Grauwe, L.; Decat, J.; Schoutteten, H.; Moritz, T.; van de Straeten, D.; Peng, J.; Harberd, N.P. Integration of Plant Responses to Environmentally Activated Phytohormonal Signals. Science 2006, 311, 91–94. [Google Scholar] [CrossRef]
  37. Geng, Y.; Wu, R.; Wee, C.W.; Xie, F.; Wei, X.; Chan, P.M.Y.; Tham, C.; Duan, L.; Dinneny, J.R. A Spatio-Temporal Understanding of Growth Regulation during the Salt Stress Response in Arabidopsis. Plant Cell 2013, 25, 2132–2154. [Google Scholar] [CrossRef] [PubMed]
  38. West, G.; Inze, D.; Beemster, G.T. Cell Cycle Modulation in the Response of the Primary Root of Arabidopsis to Salt Stress. Plant Physiol. 2004, 135, 1050–1058. [Google Scholar] [CrossRef]
  39. Essa, T.A. Effect of Salinity Stress on Growth and Nutrient Composition of Three Soybean (Glycine Max L. Merrill) Cultivars. J. Agron. Crop Sci. 2002, 188, 86–93. [Google Scholar] [CrossRef]
  40. Benito, B.; Haro, R.; Amtmann, A.; Cuin, T.A.; Dreyer, I. The Twins K+ and Na+ in Plants. J. Plant Physiol. 2014, 171, 723–731. [Google Scholar] [CrossRef]
  41. Julkowska, M.M.; Hoefsloot, H.C.; Mol, S.; Feron, R.; de Boer, G.J.; Haring, M.A.; Testerink, C. Capturing Arabidopsis Root Architecture Dynamics with ROOT-FIT Reveals Diversity in Responses to Salinity. Plant Physiol. 2014, 166, 1387–1402. [Google Scholar] [CrossRef]
  42. Zolla, G.; Heimer, Y.M.; Barak, S. Mild Salinity Stimulates a Stress-Induced Morphogenic Response in Arabidopsis Thaliana Roots. J. Exp. Bot. 2010, 61, 211–224. [Google Scholar] [CrossRef] [PubMed]
  43. McLoughlin, F.; Galvan-Ampudia, C.S.; Julkowska, M.M.; Caarls, L.; Van Der Does, D.; Laurière, C.; Munnik, T.; Haring, M.A.; Testerink, C. The Snf1-Related Protein Kinases SnRK2.4 and SnRK2.10 Are Involved in Maintenance of Root System Architecture during Salt Stress. Plant J. 2012, 72, 436–449. [Google Scholar] [CrossRef] [PubMed]
  44. Faiyue, B.; Al-Azzawi, M.J.; Flowers, T.J. The Role of Lateral Roots in Bypass Flow in Rice (Oryza sativa L.). Plant Cell Environ. 2010, 33, 702–716. [Google Scholar] [PubMed]
  45. Faiyue, B.; Vijayalakshmi, C.; Nawaz, S.; Nagato, Y.; Taketa, S.; Ichii, M.; Al-Azzawi, M.J.; Flowers, T.J. Studies on Sodium Bypass Flow in Lateral Rootless Mutants Lrt1and Lrt2, and Crown Rootless Mutant Crl1of Rice (Oryza sativa L.). Plant Cell Environ. 2010, 33, 687–701. [Google Scholar] [PubMed]
  46. Faiyue, B.; Al-Azzawi, M.J.; Flowers, T.J. A New Screening Technique for Salinity Resistance in Rice (Oryza Sativa L.) Seedlings Using Bypass Flow. Plant Cell Environ. 2012, 35, 1099–1108. [Google Scholar] [CrossRef] [PubMed]
  47. Julkowska, M.M.; McLoughlin, F.; Galvan-Ampudia, C.S.; Rankenberg, J.M.; Kawa, D.; Klimecka, M.; Haring, M.A.; Munnik, T.; Kooijman, E.E.; Testerink, C. Identification and Functional Characterization of the Arabidopsis Snf1-Related Protein Kinase SnRK2.4 Phosphatidic Acid-Binding Domain. Plant Cell Environ. 2014, 38, 614–624. [Google Scholar] [CrossRef]
  48. Wu, H.; Guo, J.; Wang, C.; Li, K.; Zhang, X.; Yang, Z.; Li, M.; Wang, B. An Effective Screening Method and a Reliable Screening Trait for Salt Tolerance of Brassica napus at the Germination Stage. Front. Plant Sci. 2019, 10, 530. [Google Scholar] [CrossRef]
  49. Huqe, M.A.S.; Haque, M.S.; Sagar, A.; Uddin, M.N.; Hossain, M.A.; Hossain, A.Z.; Rahman, M.M.; Wang, X.; Al-Ashkar, I.; Ueda, A.; et al. Characterization of Maize Hybrids (Zea mays L.) for Detecting Salt Tolerance Based on Morpho-Physiological Characteristics, Ion Accumulation and Genetic Variability at Early Vegetative Stage. Plants 2021, 10, 2549. [Google Scholar] [CrossRef]
  50. Sivakumar, J.; Prashanth, J.E.P.; Rajesh, N.; Reddy, S.M.; Pinjari, O.B. Principal component analysis approach for comprehensive screening of salt stress-tolerant tomato germplasm at the seedling stage. J. Biosci. 2020, 45, 141. [Google Scholar] [CrossRef]
  51. Sivakumar, J.; Sridhar Reddy, M.; Sergeant, K.; Hausman, J.F.; ShaValli Khan, P.S.; Osman Basha, P. Principal component analysis-assisted screening and selection of salt-tolerant tomato genotypes. Plant Physiol. Rep. 2023, 28, 272–288. [Google Scholar] [CrossRef]
  52. Kose, A.; Oguz, O.; Ozlem, B.; Ferda, K. Application of multivariate statistical analysis for breeding strategies of spring safflower (Carthamus tinctorius L.). Turkish J. F. Crop. 2018, 23, 12–19. [Google Scholar] [CrossRef]
Figure 1. Effect of salt stress (C: control, 5 dS m−1, 10 dS m−1, and 15 dS m−1) on shoot dry weight (a), root dry weight (b), relative water content (c), membrane stability index (d), and chlorophyll content index (e) of wheat genotypes Kharchia 65 (K-65), B.T. Schomburgk (BTS), HD2687, and HD3298. Salt stress was imposed for 4 weeks via a mix of salts added to 7-day-old hydroponically grown wheat seedlings. Significant differences (p < 0.05) between treatment mean values are specified with different letters. Values are means (±SE) of 3 biological replicates.
Agriculture 13 01946 g001
Figure 2. Effect of salt stress (C: control, 5 dS m−1, 10 dSm−1, and 15 dSm−1) on total root length (a), total root surface area (b), total root volume (c), average root diameter (d), specific root length (e), and specific root surface area (f), of wheat genotypes Kharchia 65 (K-65), B.T. Schomburgk (BTS), HD2687, and HD3298. Salt stress was imposed for 4 weeks via a mix of salts added to 7-day-old hydroponically grown wheat seedlings. Significant differences (p < 0.05) between treatment mean values are specified with different letters. Values are means (±SE) of 3 biological replicates.
Agriculture 13 01946 g002
Figure 3. Effect of salt stress (C: control, 5 dS m−1, 10 dS m−1, and 15 dS m−1) on canopy temperature (a,b), The actualcanopy temperature of salt-stressed plants relative to control plants (b), thermal image of wheat genotypes and numerical values indicating canopy temperature of plants (each pixel marked with + marker and temperature retrieved from thermal image, the red font indicate maximum temperature of object during capture) (c), stomatal density (d) of wheat genotypes Kharchia 65 (K-65), B.T. Schomburgk (BTS), HD2687, and HD3298. Salt stress was imposed for 4 weeks via a mix of salts added to 7-day-old hydroponically grown wheat seedlings. Significant differences (p < 0.05) between treatment mean values are specified with different letters. Values are means (±SE) of 3 biological replicates.
Agriculture 13 01946 g003
Figure 4. Effect of salt stress (C: control, 5 dS m−1, 10 dS m−1, and 15 dS m−1) on leaf sodium ion (Na+) concentration (a), root (Na+) concentration (b), leaf potassium ion (K+) concentration (c), root K+ concentration (d), leaf Na+/K+ ratio (e), and root Na+/K+ ratio (f) of wheat genotypes Kharchia 65 (K-65), B.T. Schomburgk (BTS), HD2687, and HD3298. Salt stress was imposed for 4 weeks via a mix of salts added to 7-day-old hydroponically grown wheat seedlings. Significant differences (p < 0.05) between treatment mean values are specified with different letters. Values are means (±SE) of 3 biological replicates.
Agriculture 13 01946 g004
Figure 5. Corrplot of the different seedling traits in wheat genotypes Kharchia 65 (K-65), B.T. Schomburgk (BTS), HD2687, and HD3298 grown under control, 5 dS m−1, 10 dS m−1, and 15 dS m−1 conditions. Salt stress was imposed for 4 weeks via a mix of salts added to 7-day-old hydroponically grown wheat seedlings. The colour gradient from green to purple represents Pearson’s correlation coefficient, ranging from highly positive (1) to highly negative (−1) values. * indicate 5% levels of significance. CT (Canopy temperature, °C), AD (Average diameter of root,), R_Na (Root Na+ content, %), L_Na (Leaf Na+, %), L_NaK (Leaf Na+/K+, %), R_NaK (Root Na+/K+, %), WD (Water deficit, %), TSRW_LB (Total specific root weight length basis), TSRW_LB (Total specific root weight surface area basis), STD (Stomatal density), RFW (Root fresh weight, g), CCM (Chlorophyll content meter (Chlorophyll content index), RDW (Root dry weight, g), TFW (Total fresh weight, g), TDW (Total dry weight, g), SDW (Shoot dry weight, g), SFW (Shoot fresh weight, g), MSI (Membrane stability index, %), PH (Plant height, cm), RL (Root length, cm), SL (Shoot length, cm), R_K (Root K+ content, %), RWC (Relative water content, %), TRL (Total root length), TIPS (Total root tips), FORKS (Total root forks), TPA (Total projected area), TSA (Total surface area), TRV (Total root volume), L_K (Leaf K+ content), TSRL (Total specific root length), TSRSA (Total specific root surface area).
Agriculture 13 01946 g005
Figure 6. Effect of salt stress (C: control, 5 dS m−1, 10 dS m−1, and 15 dS m−1) on the correlation of stomatal density and canopy temperature in wheat genotypes Kharchia 65 (K-65), B.T. Schomburgk (BTS), HD2687, and HD3298. Salt stress was imposed for 4 weeks via a mix of salts added to 7-day-old hydroponically grown wheat seedlings.
Agriculture 13 01946 g006
Figure 7. Salt tolerance index (STI) of different traits in wheat genotypes (a) Kharchia 65 (K-65), (b) B.T. Schomburgk (BTS), (c) HD2687, and (d) HD3298 plants receiving different salt stress treatments (C: control, 5 dS m−1, 10 dS m−1, and 15 dS m−1). Salt stress was imposed for 4 weeks via a mix of salts added to 7-day-old hydroponically grown wheat seedlings.
Agriculture 13 01946 g007
Figure 8. Principal Component Analysis (PCA)-2D biplot of variables in Kharchia 65 (K-65), B.T. Schomburgk (BTS), HD2687, and HD3298 plants’ morpho−physiological and biochemical traits when receiving different salt stress treatments (C: control, 5 dS m−1, 10 dS m−1, and 15 dS m−1 Salt stress was imposed for 4 weeks via a mix of salts added to 7-day-old hydroponically grown wheat seedlings. The first two components explain 51.4% and 16.1% of the variances, respectively. Arrows indicate the strength of the trait influence on the first two PCs. The lengths of the arrows denote the contribution of the traits to the first two components in the PCA. The longer arrows indicate a higher contribution, while the shorter arrows indicate a lower contribution by the variables. PH (Plant height, cm), RL (Root Length, cm), SL (Shoot Length, cm), RFW (Root Fresh Weight, g), SFW (Shoot Fresh weight, g), TFW (Total Fresh Weight, g), RDW (Root Dry Weight, g), SDW (Shoot Dry Weight, g), TDW (Total Dry Weight, g), MSI (Membrane stability index), RWC (Relative water content), WD (Water deficit), CCI (Chlorophyll content index), CT (Canopy temperature, °C), STD (Stomatal density, mm2 per leaf surface), Root K content (Root K+ concentration, %), Shoot K content (Shoot K+ concentration, %), Root Na content (Root Na+ concentration %), Shoot Na content (Shoot Na+ concentration, %), Leaf Na+/K+ ratio, Root Na+/K+ ratio, TRL (Total root length), TRV (Total root volume), TPA (Total projected area), TSA (Total surface area), AD (Average diameter), TIPS (Root tips), FORKS (Root forks), SRW (Specific root weight), TSRL (Total specific root length), TSRSA (Total specific root surface area).
Agriculture 13 01946 g008
Disclaimer/Publisher’s Note: The statements, opinions and data contained in all publications are solely those of the individual author(s) and contributor(s) and not of MDPI and/or the editor(s). MDPI and/or the editor(s) disclaim responsibility for any injury to people or property resulting from any ideas, methods, instructions or products referred to in the content.

