
Real-Time Cattle Pose Estimation Based on Improved RTMPose

Abstract
:1. Introduction
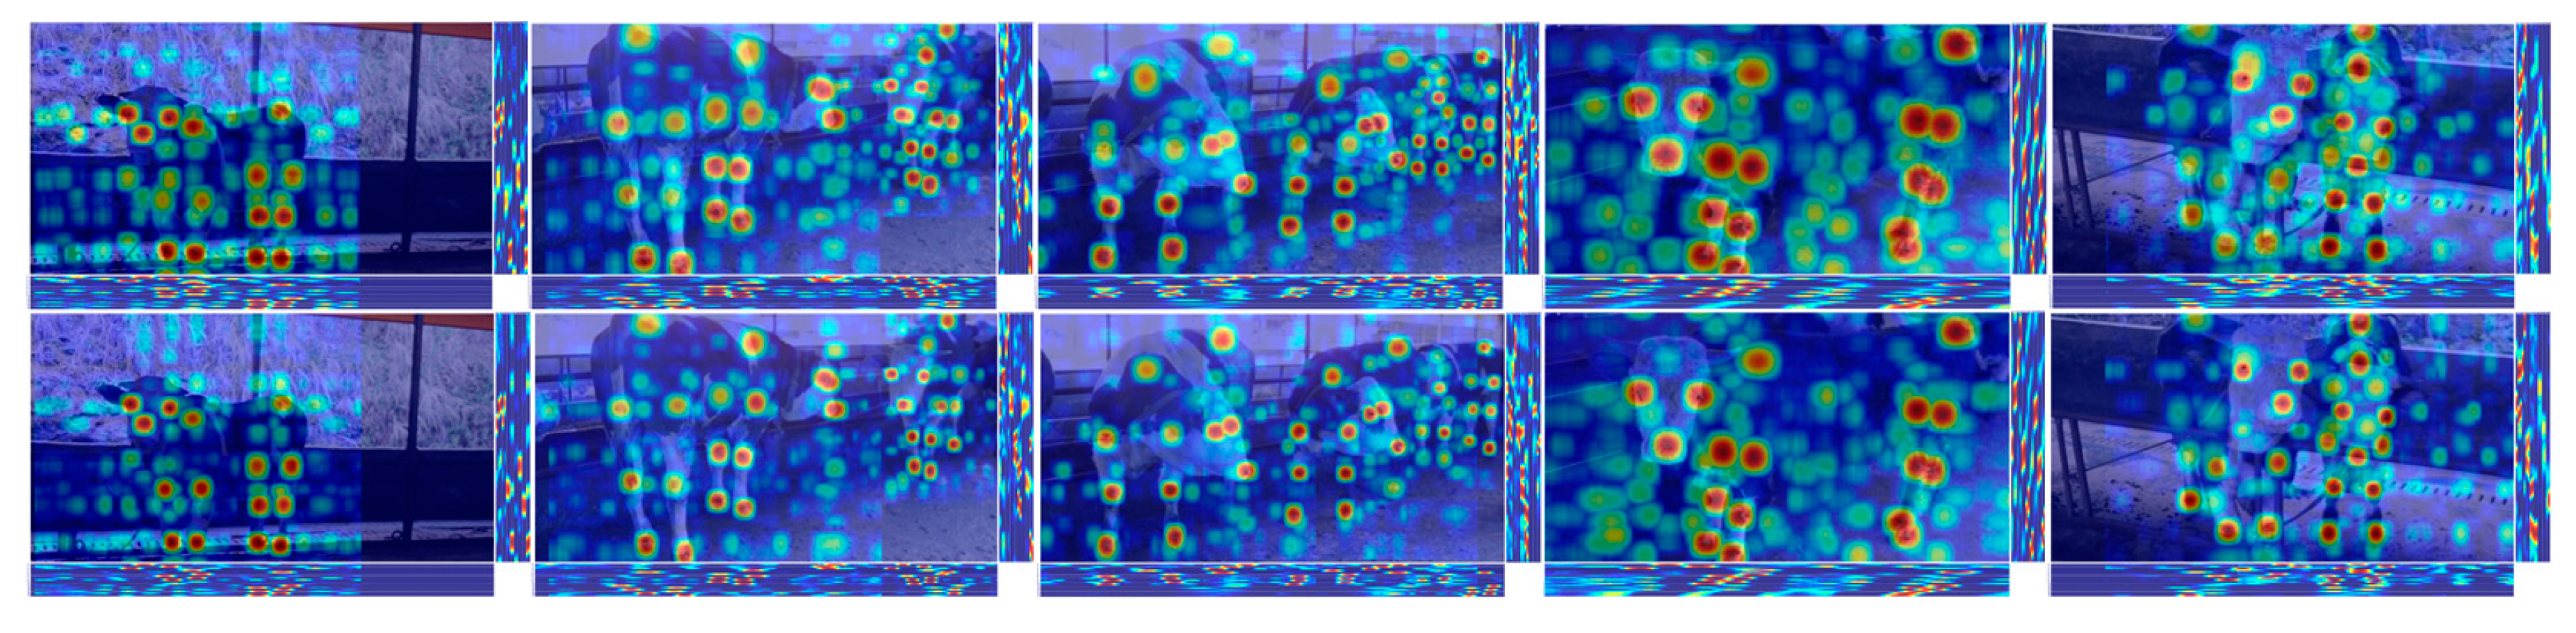
- Efficient Keypoint Localization: This paper introduces an enhanced RTMPose method. First, it leverages the highest-level image features. Then, it locates keypoints by performing sub-pixel scale classification in the horizontal and vertical directions for only k (number of keypoints). Compared to the RTMPose algorithm, our approach significantly improves detection accuracy while maintaining inference speed.
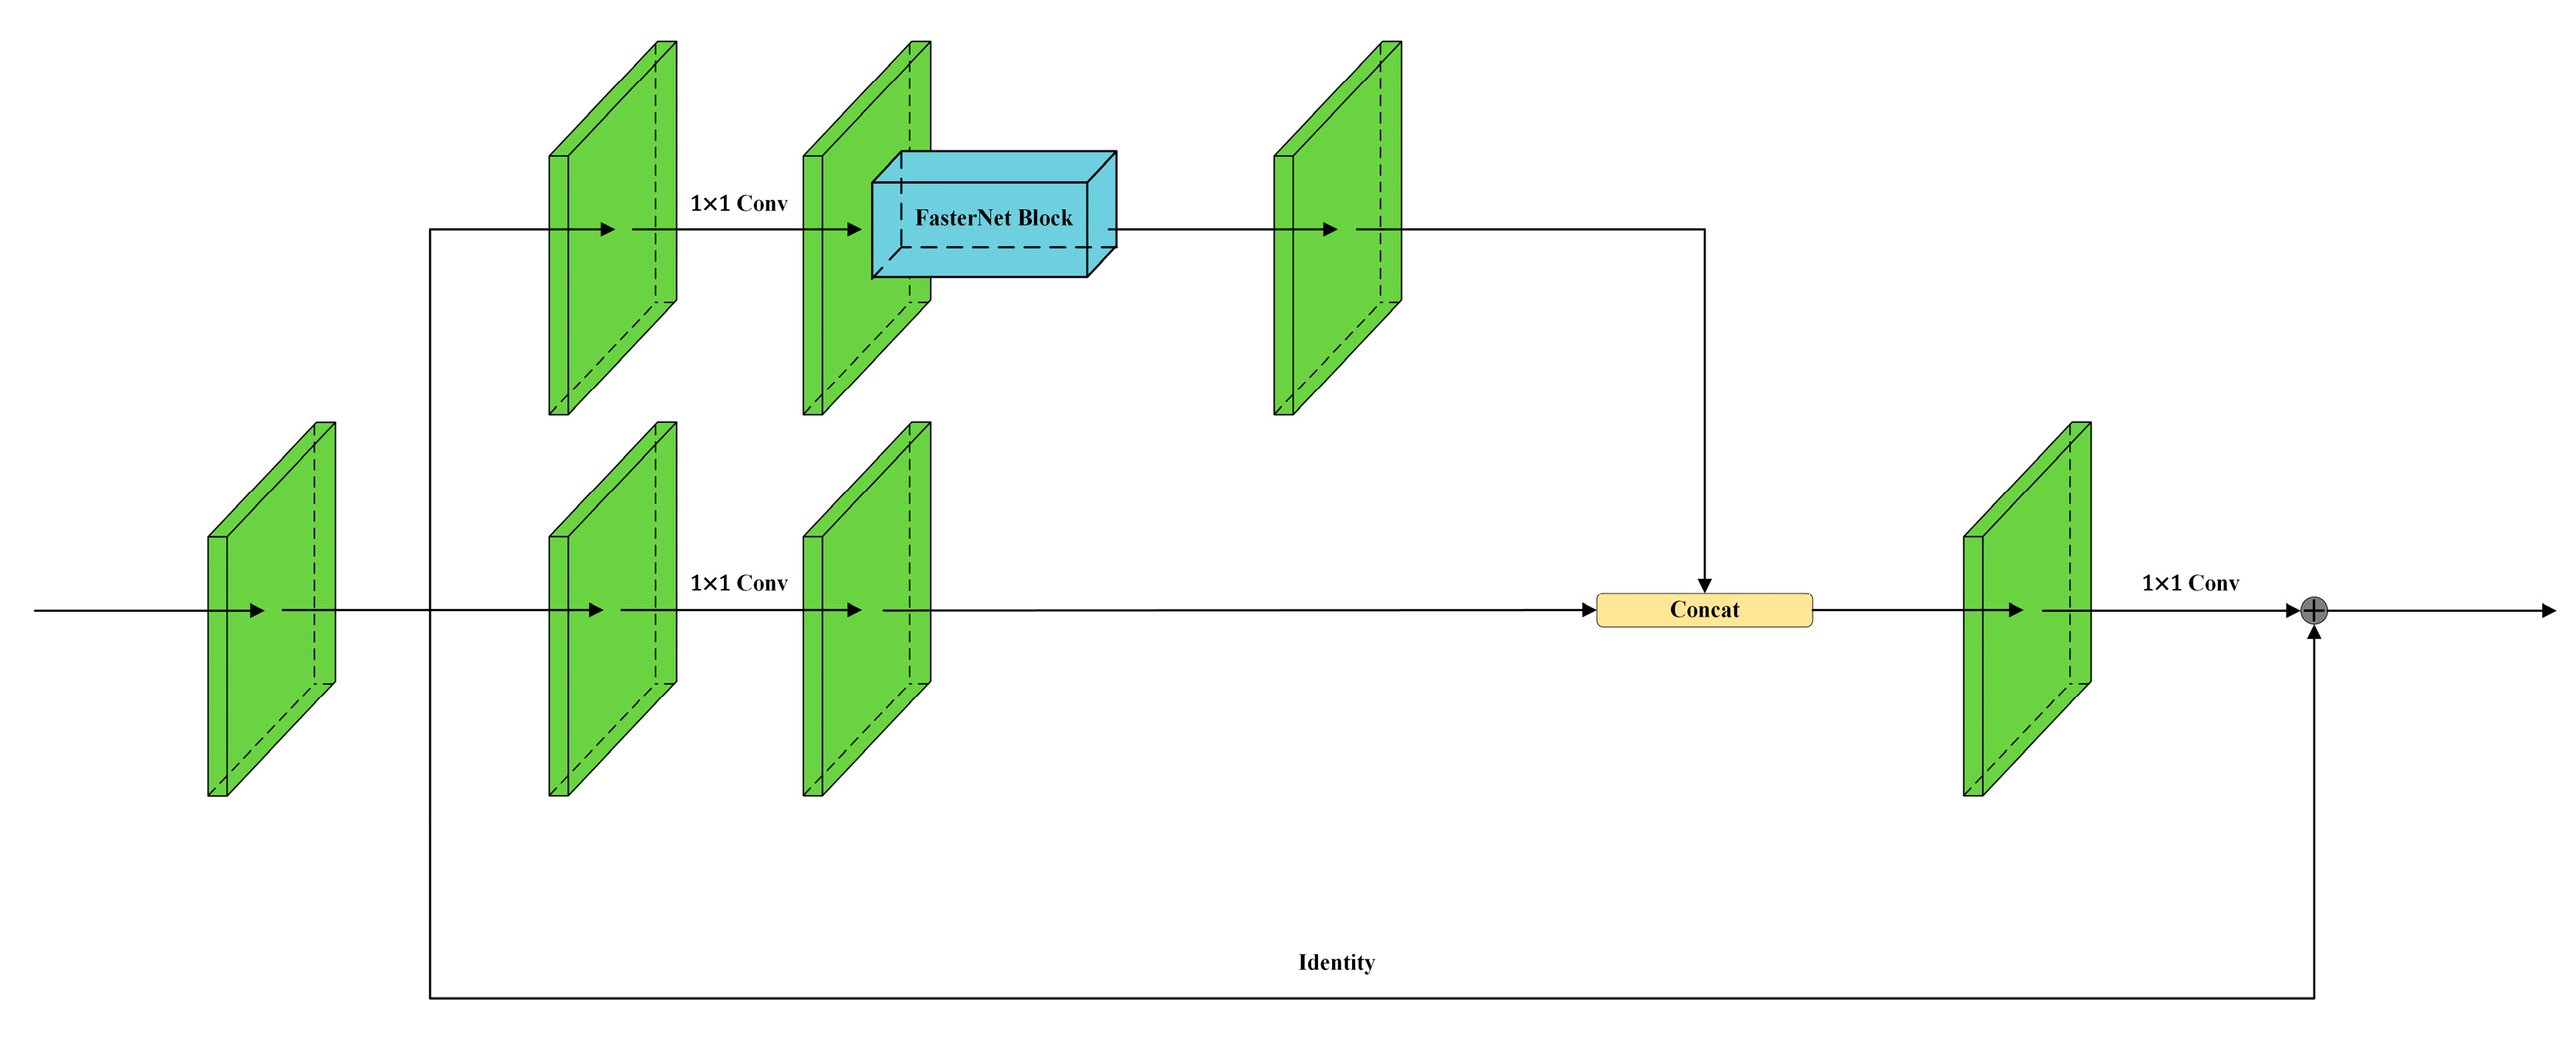
- FasterNest Block with Three-Branch Structure: RTMPose utilizes the highest-level image features as the basis for keypoint localization. To more effectively use these high-level image features, we introduce the FasterNest Block. This three-branch structure is embedded into the fourth stage of the backbone, enhancing the model’s feature learning capabilities.
- Integration of SimAM Attention: RTMPose exhibits limited spatial learning capabilities. The SimAM attention module can infer three-dimensional attention weights for feature maps. In the CSPLayer, channel attention is replaced with SimAM attention, augmenting RTMPose’s spatial learning capabilities without additional parameters.
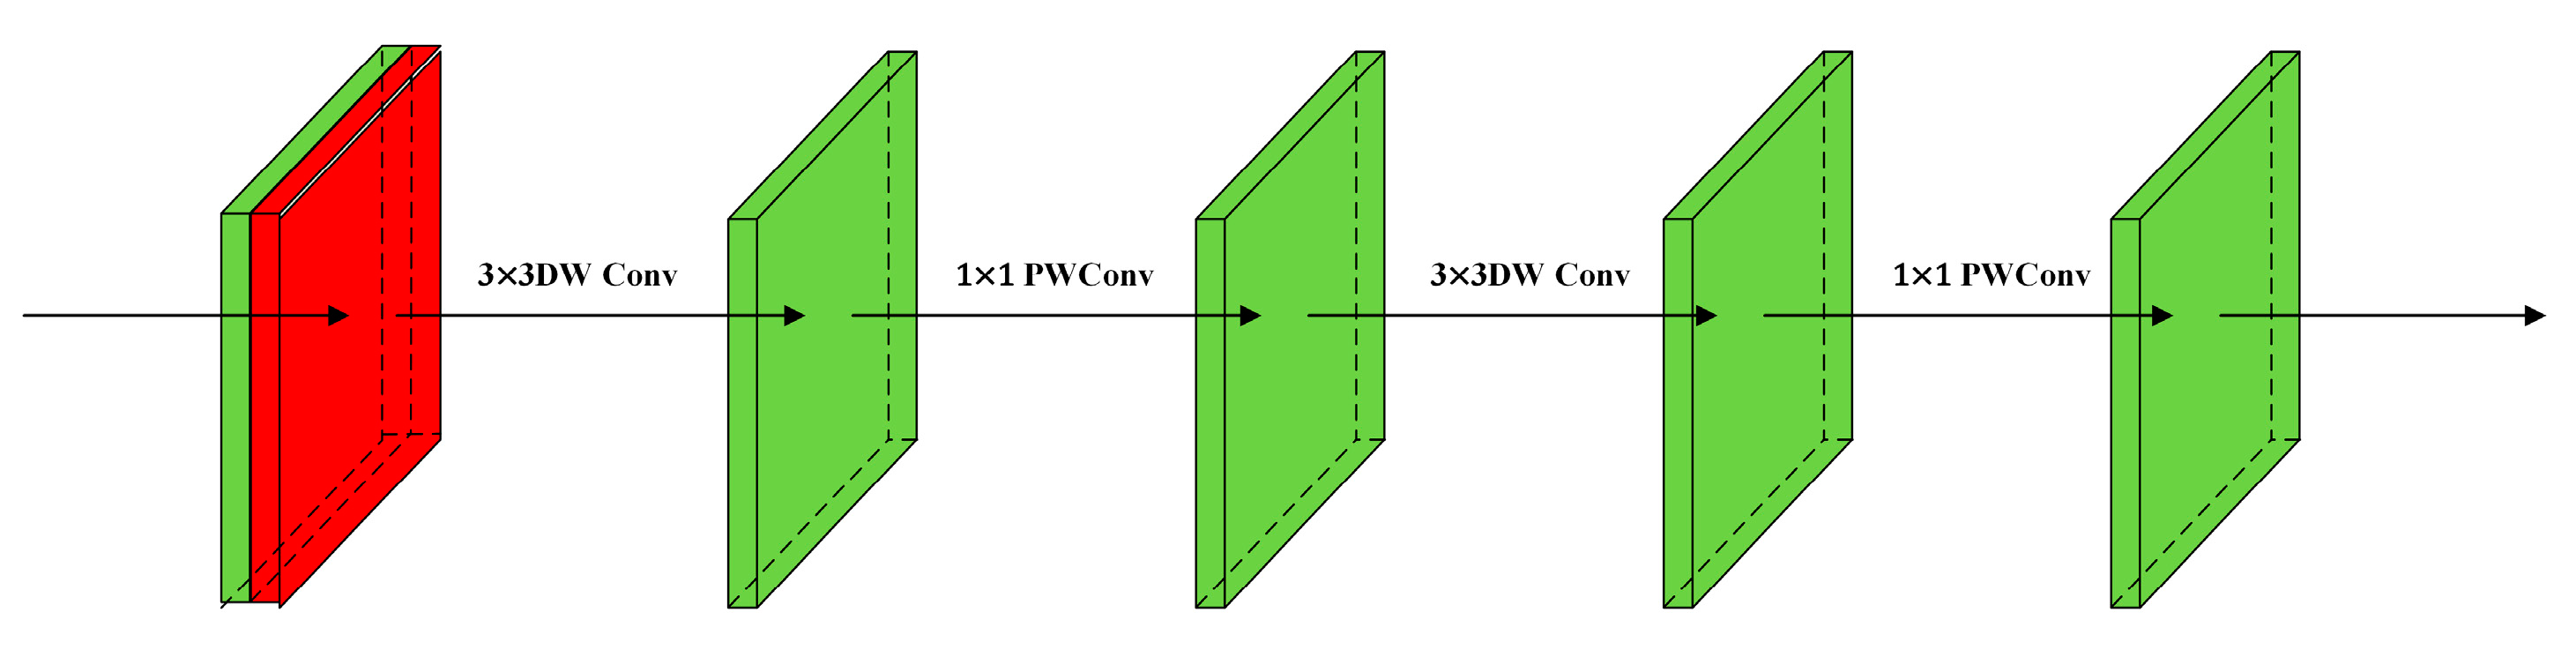
- Lightweight Depth Block: Since 7 × 7 convolutions add computation parameters and overhead to the RTMPose model, the Depth Block module based on depth separable convolutions, which is more suitable for lightweight models than traditional convolutions, has been designed in this paper. It replaces the conventional 7 × 7 convolution in the Head, addressing the insensitivity of the model to semantic information while reducing parameters.
2. Materials and Methods
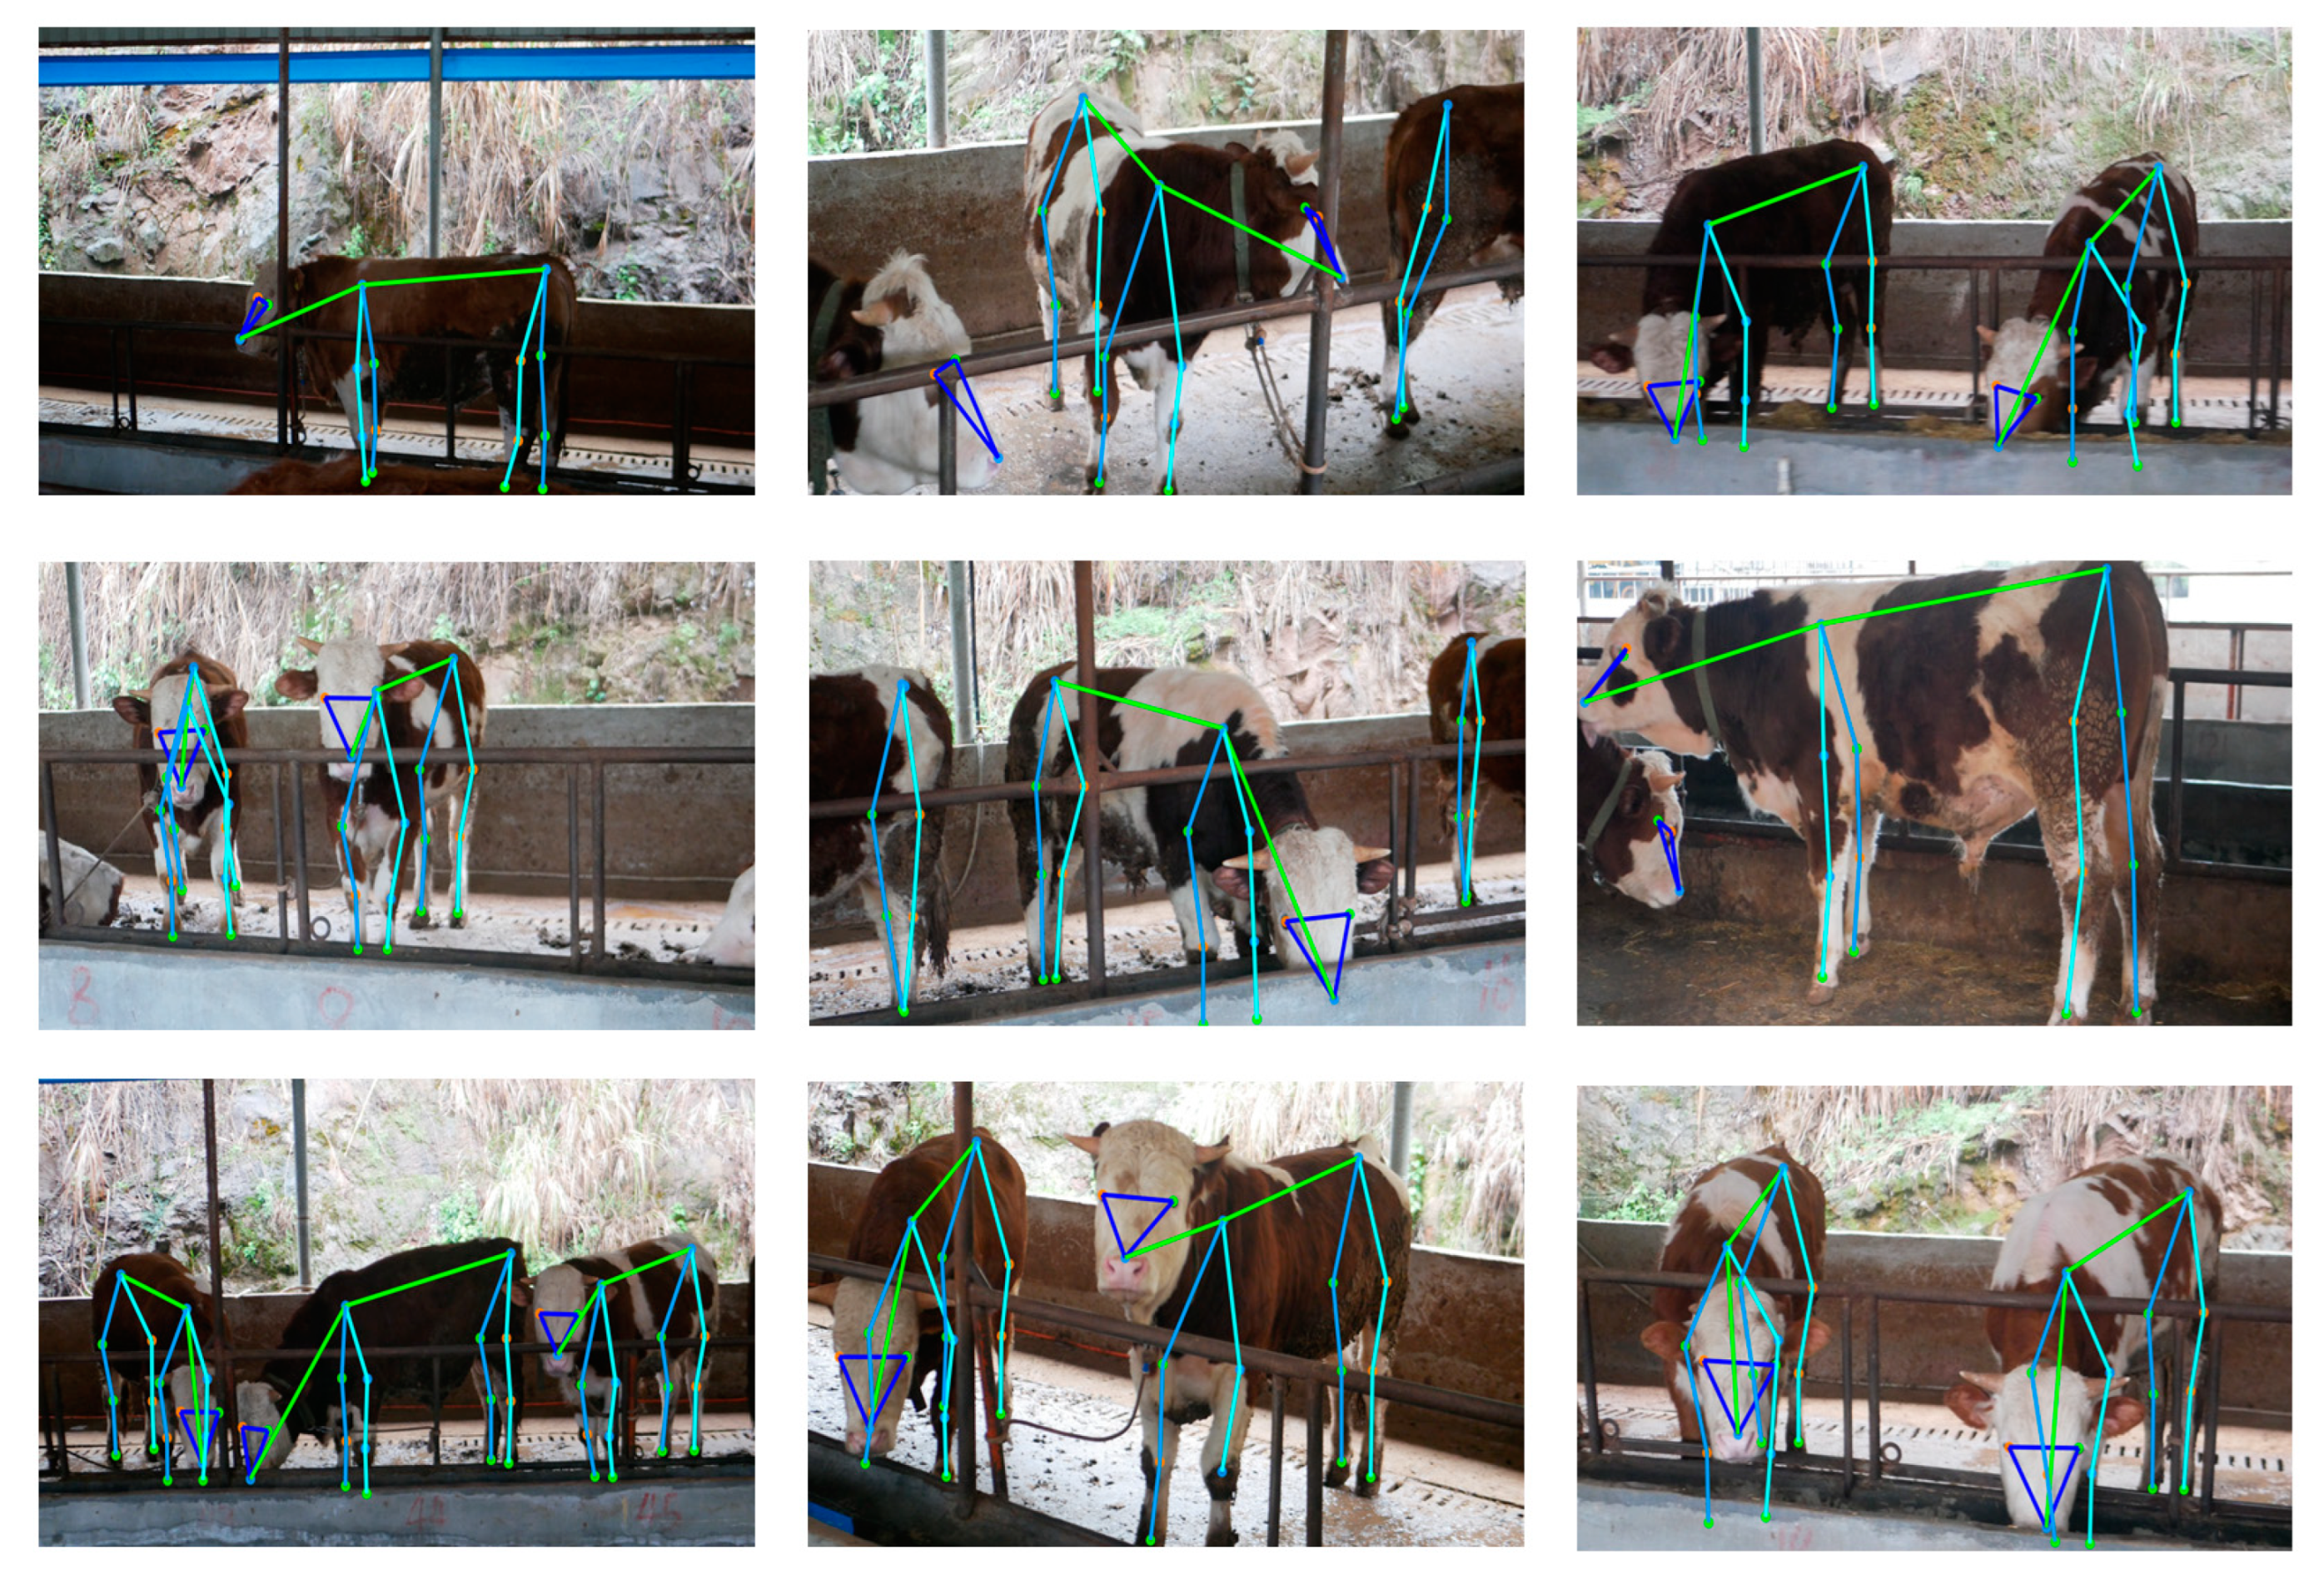
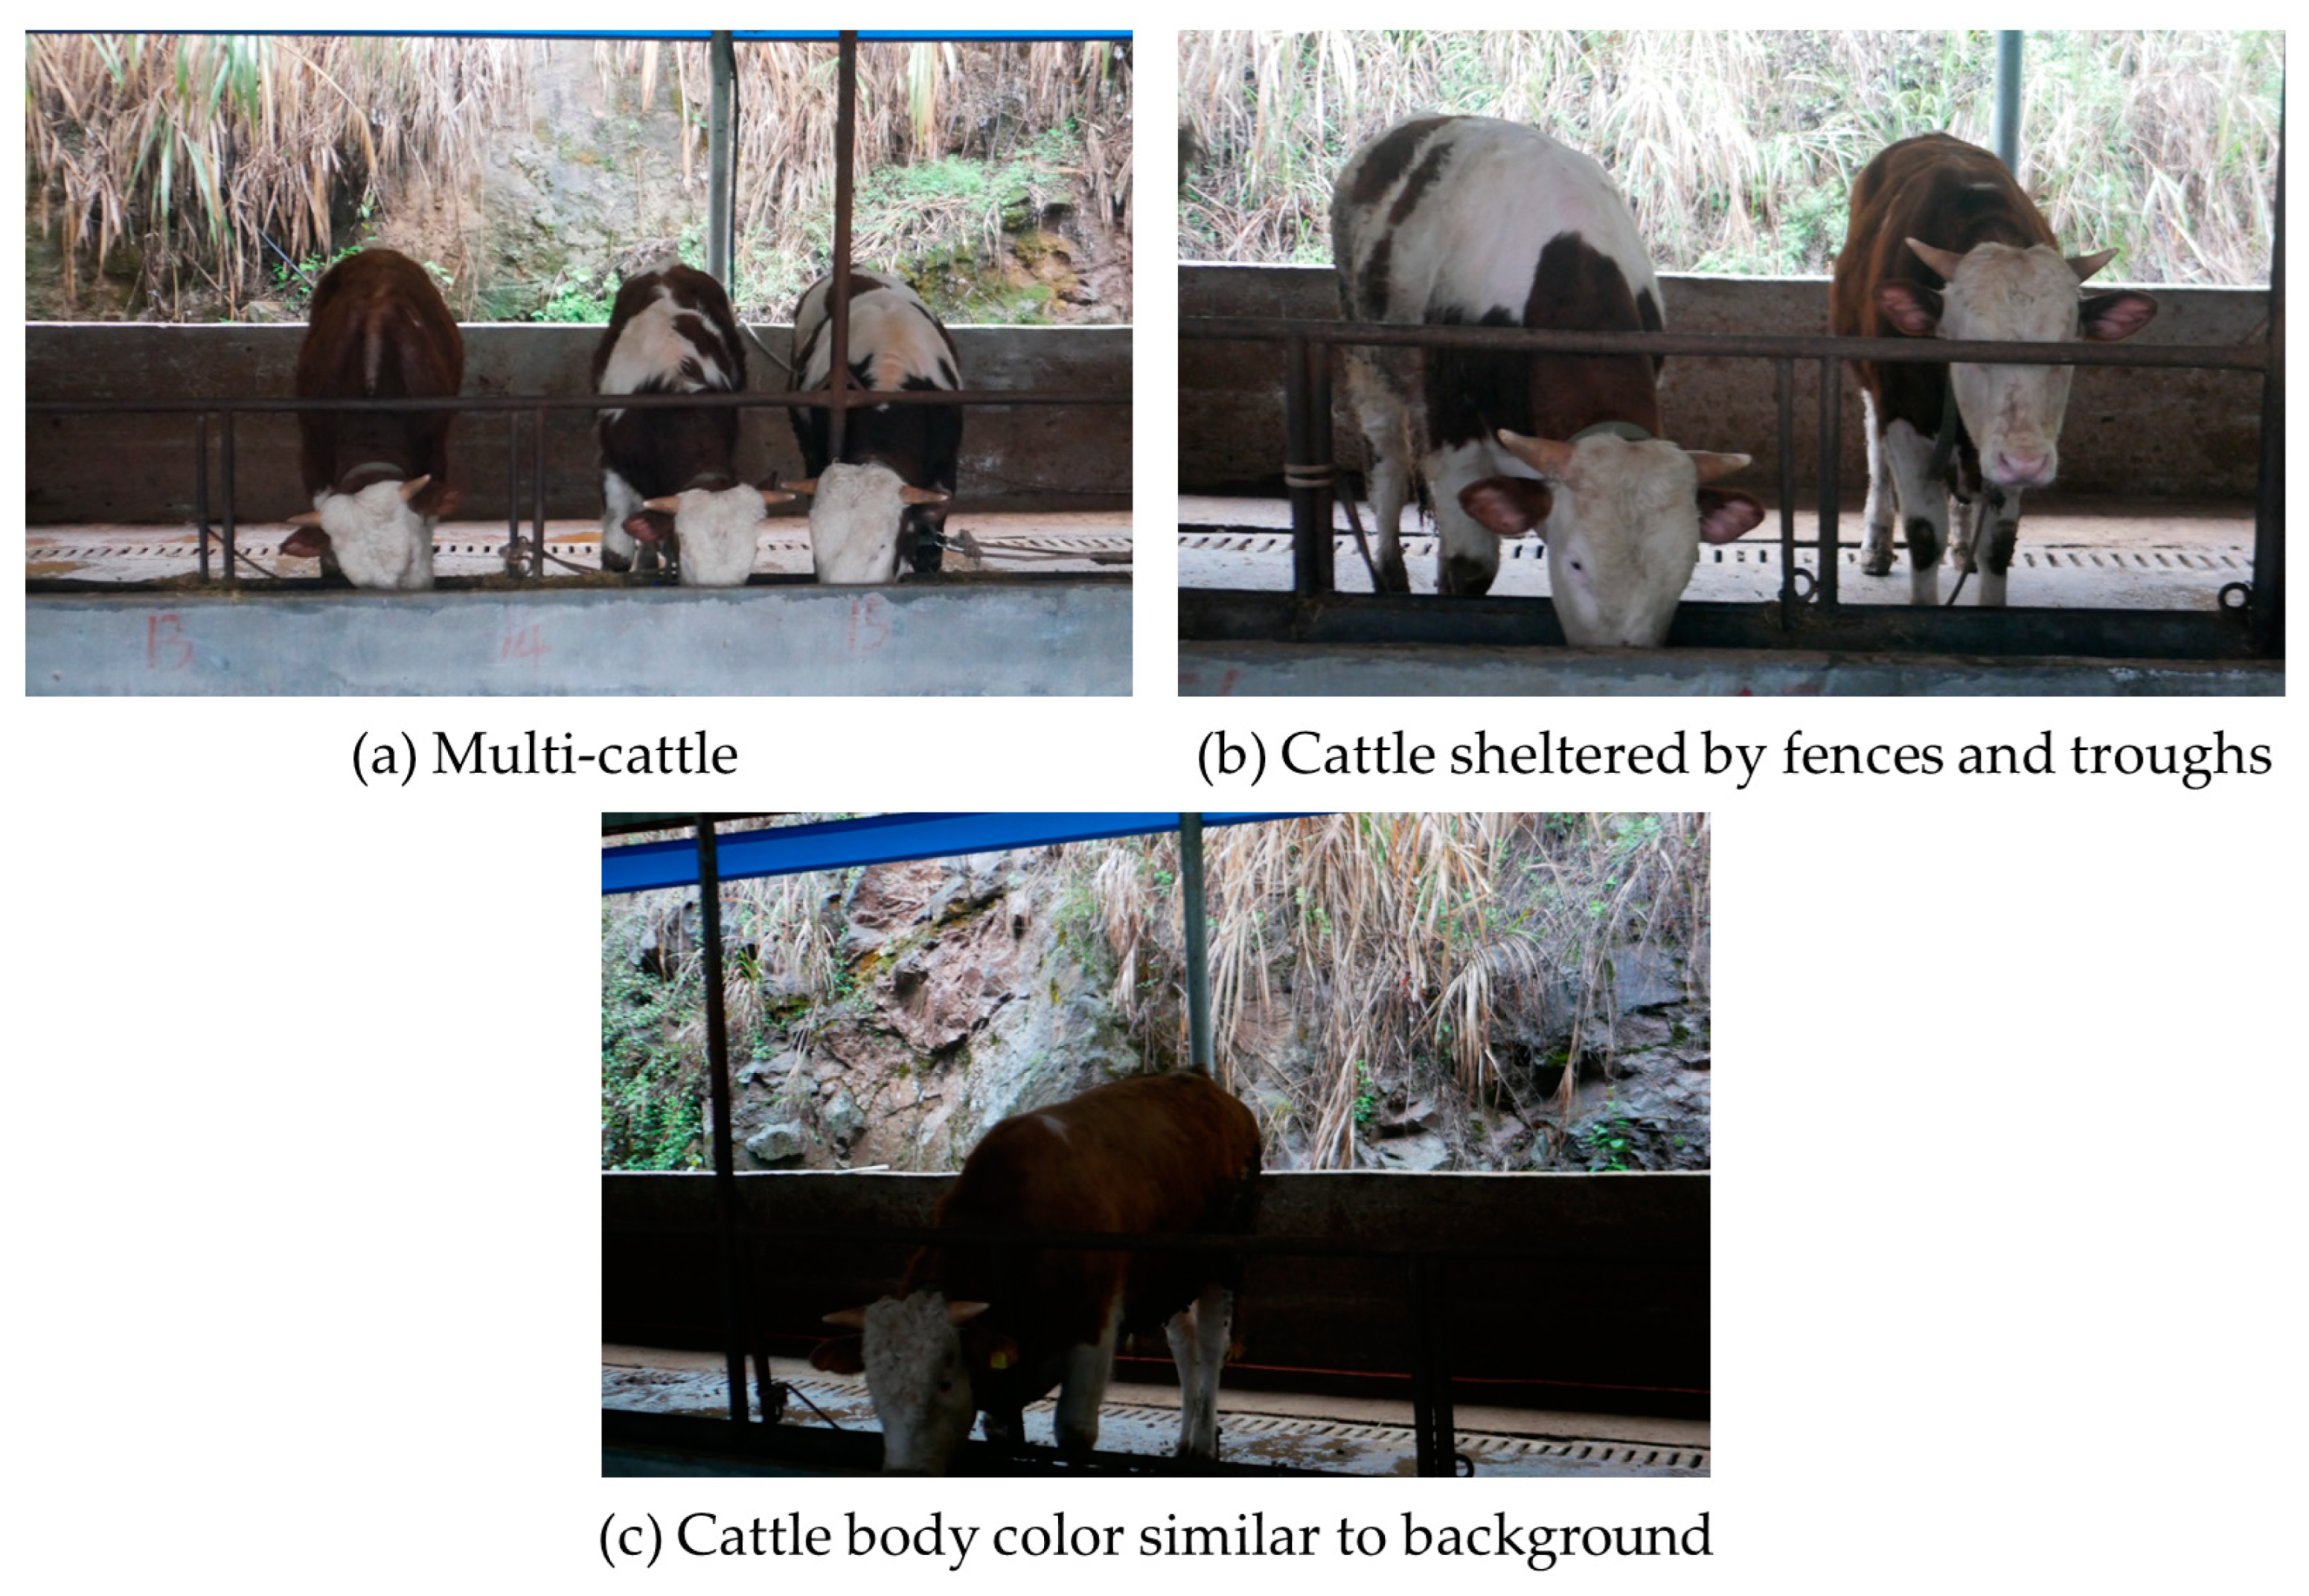
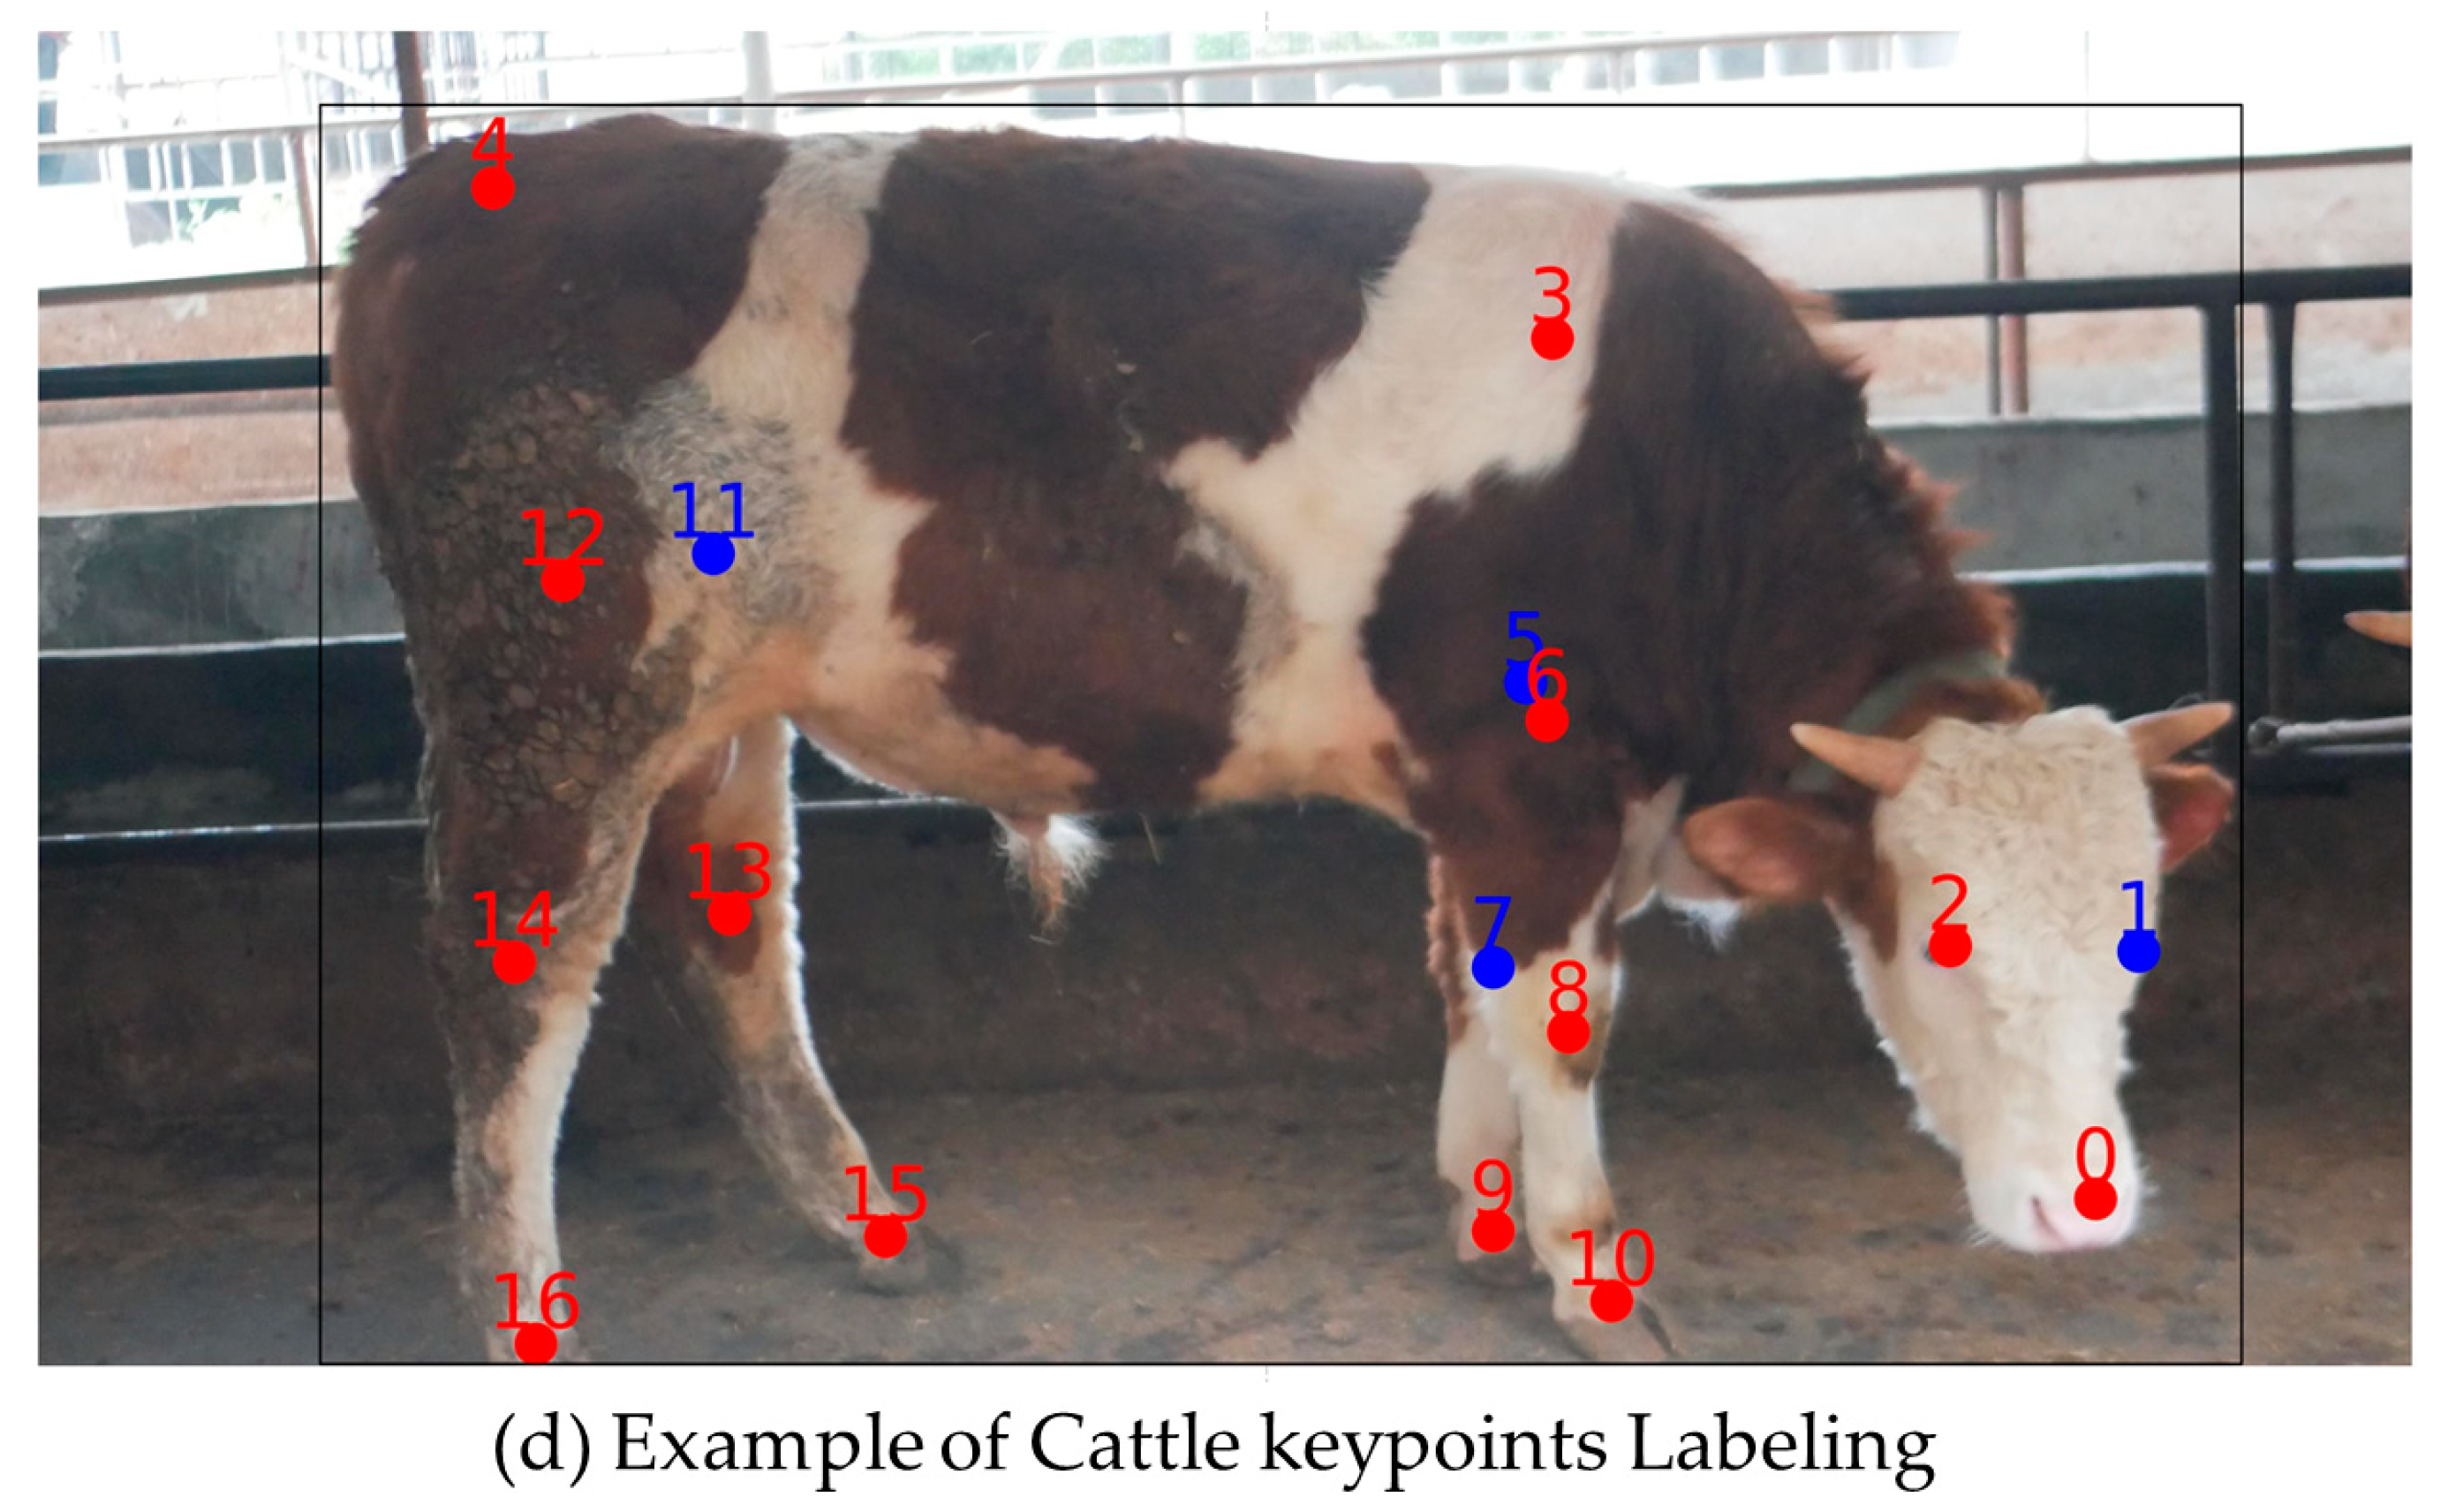
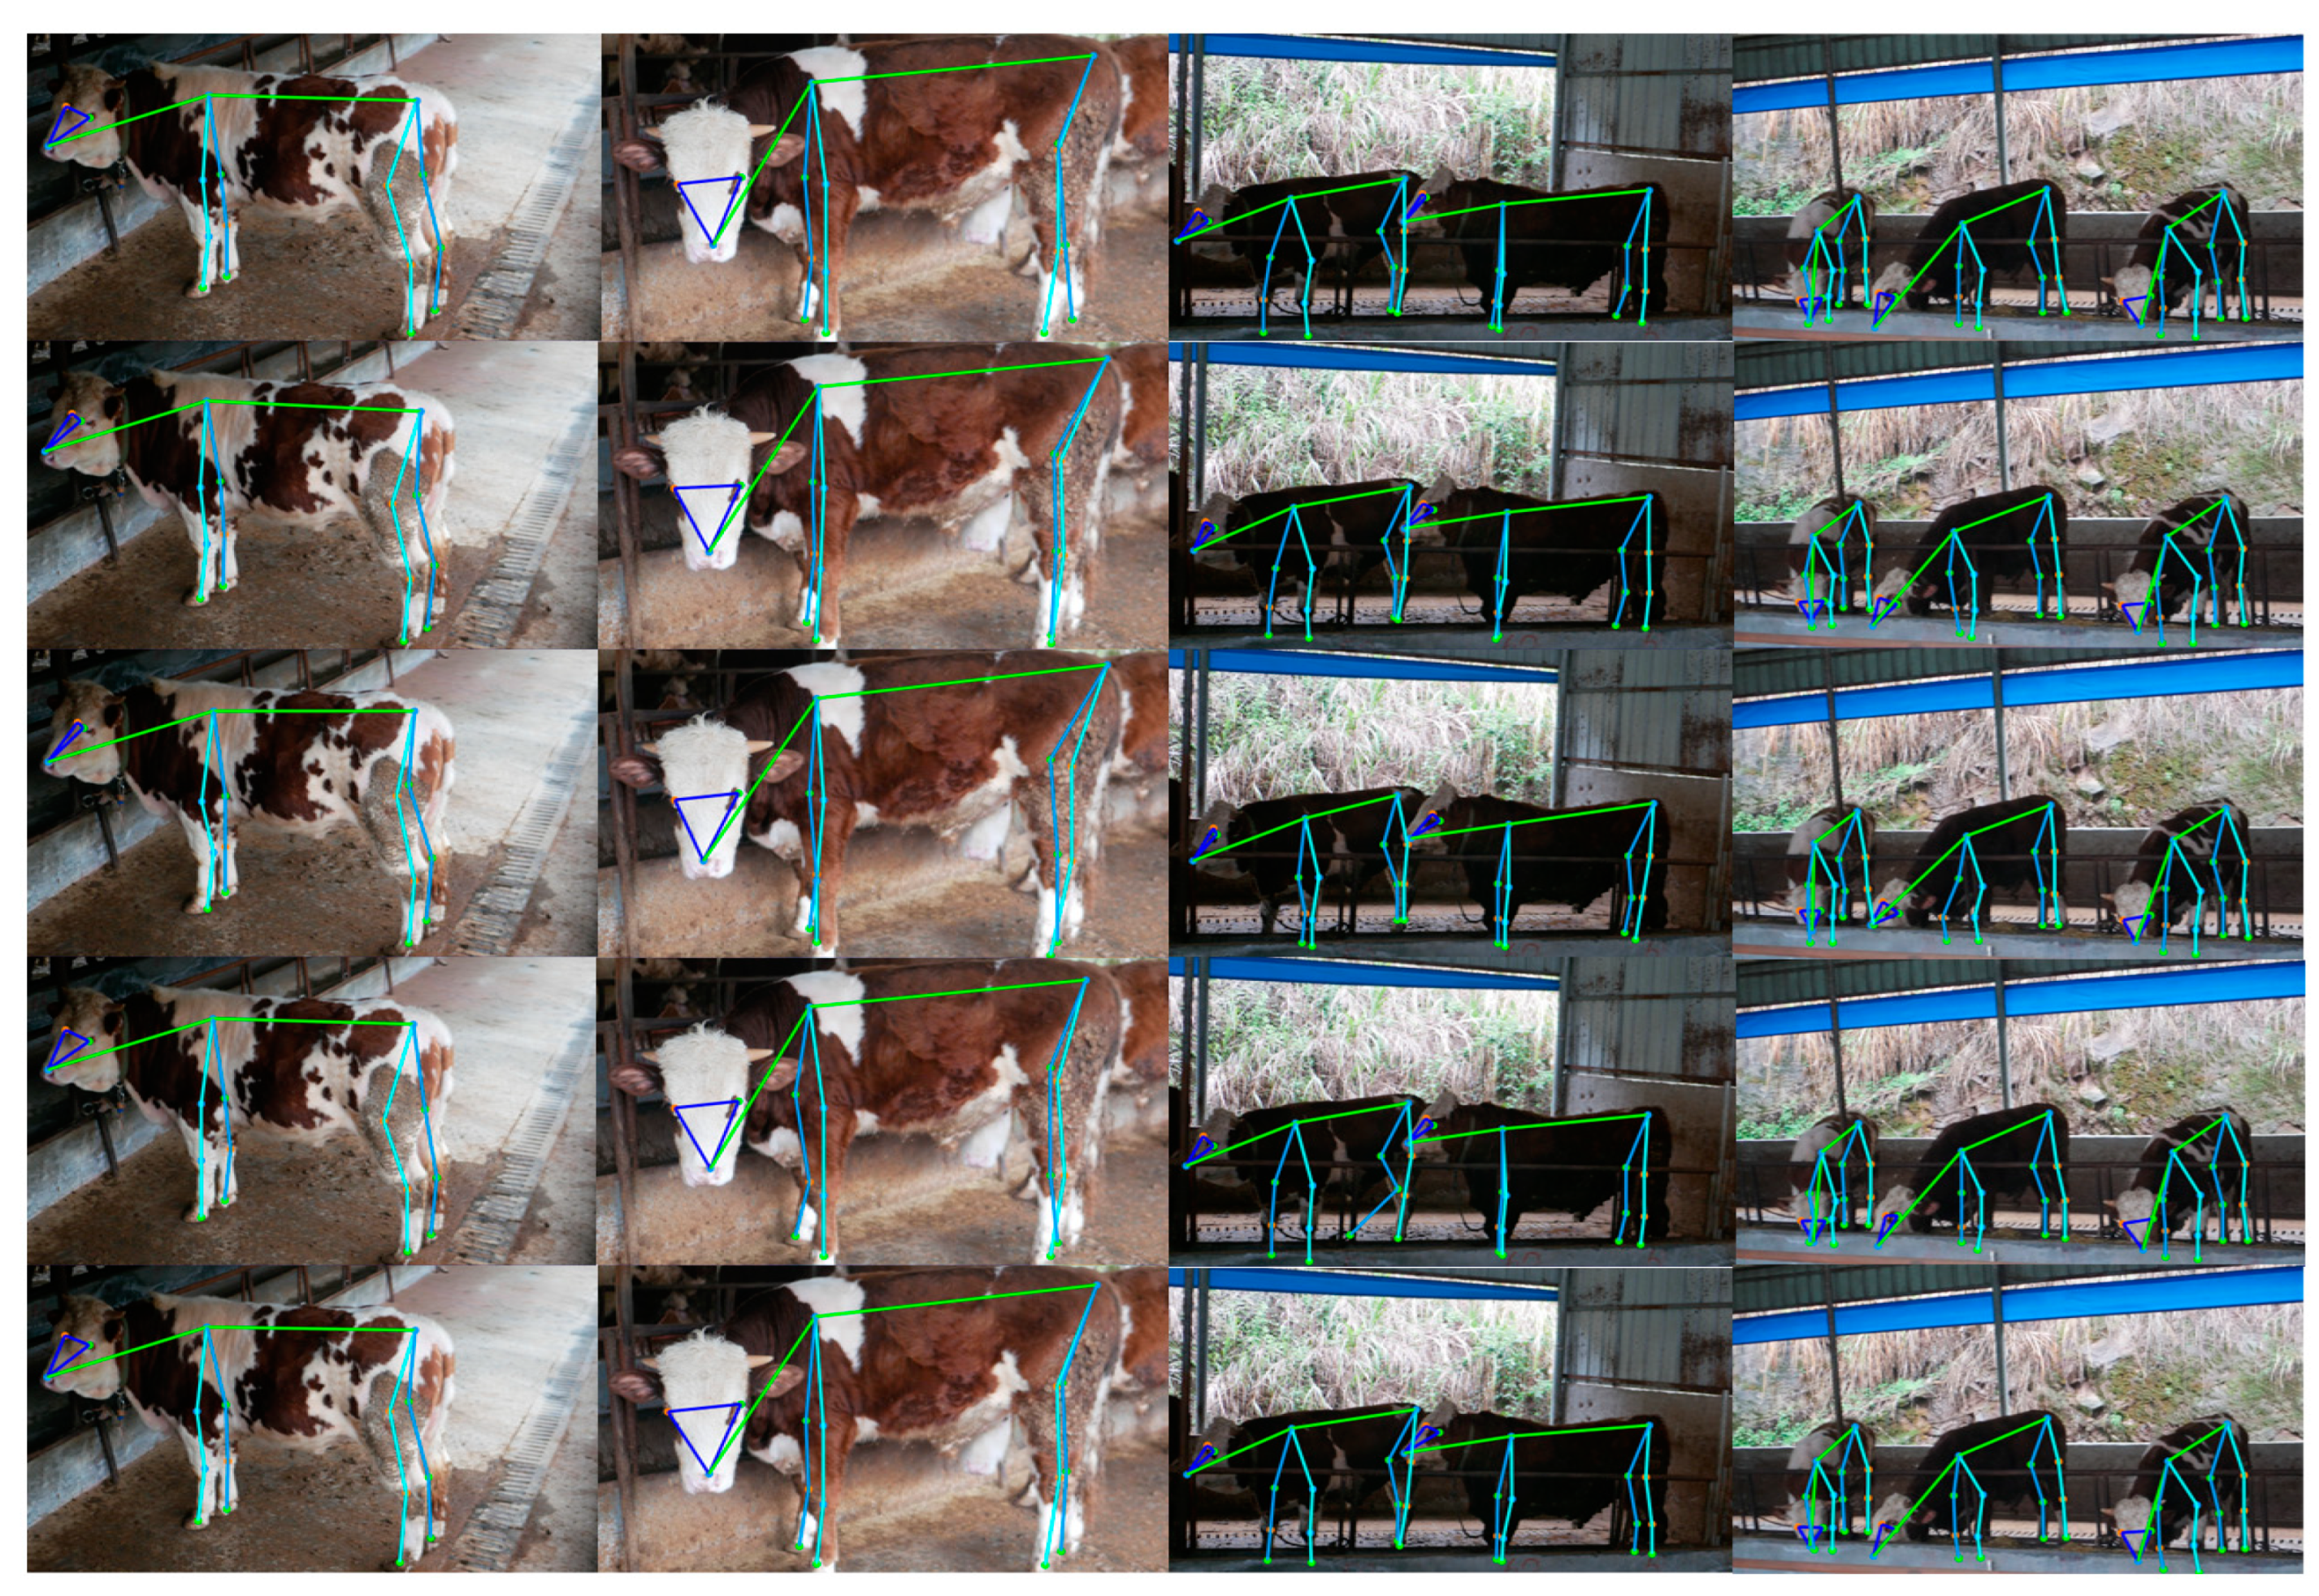
2.1. Data Collection and Data Annotation
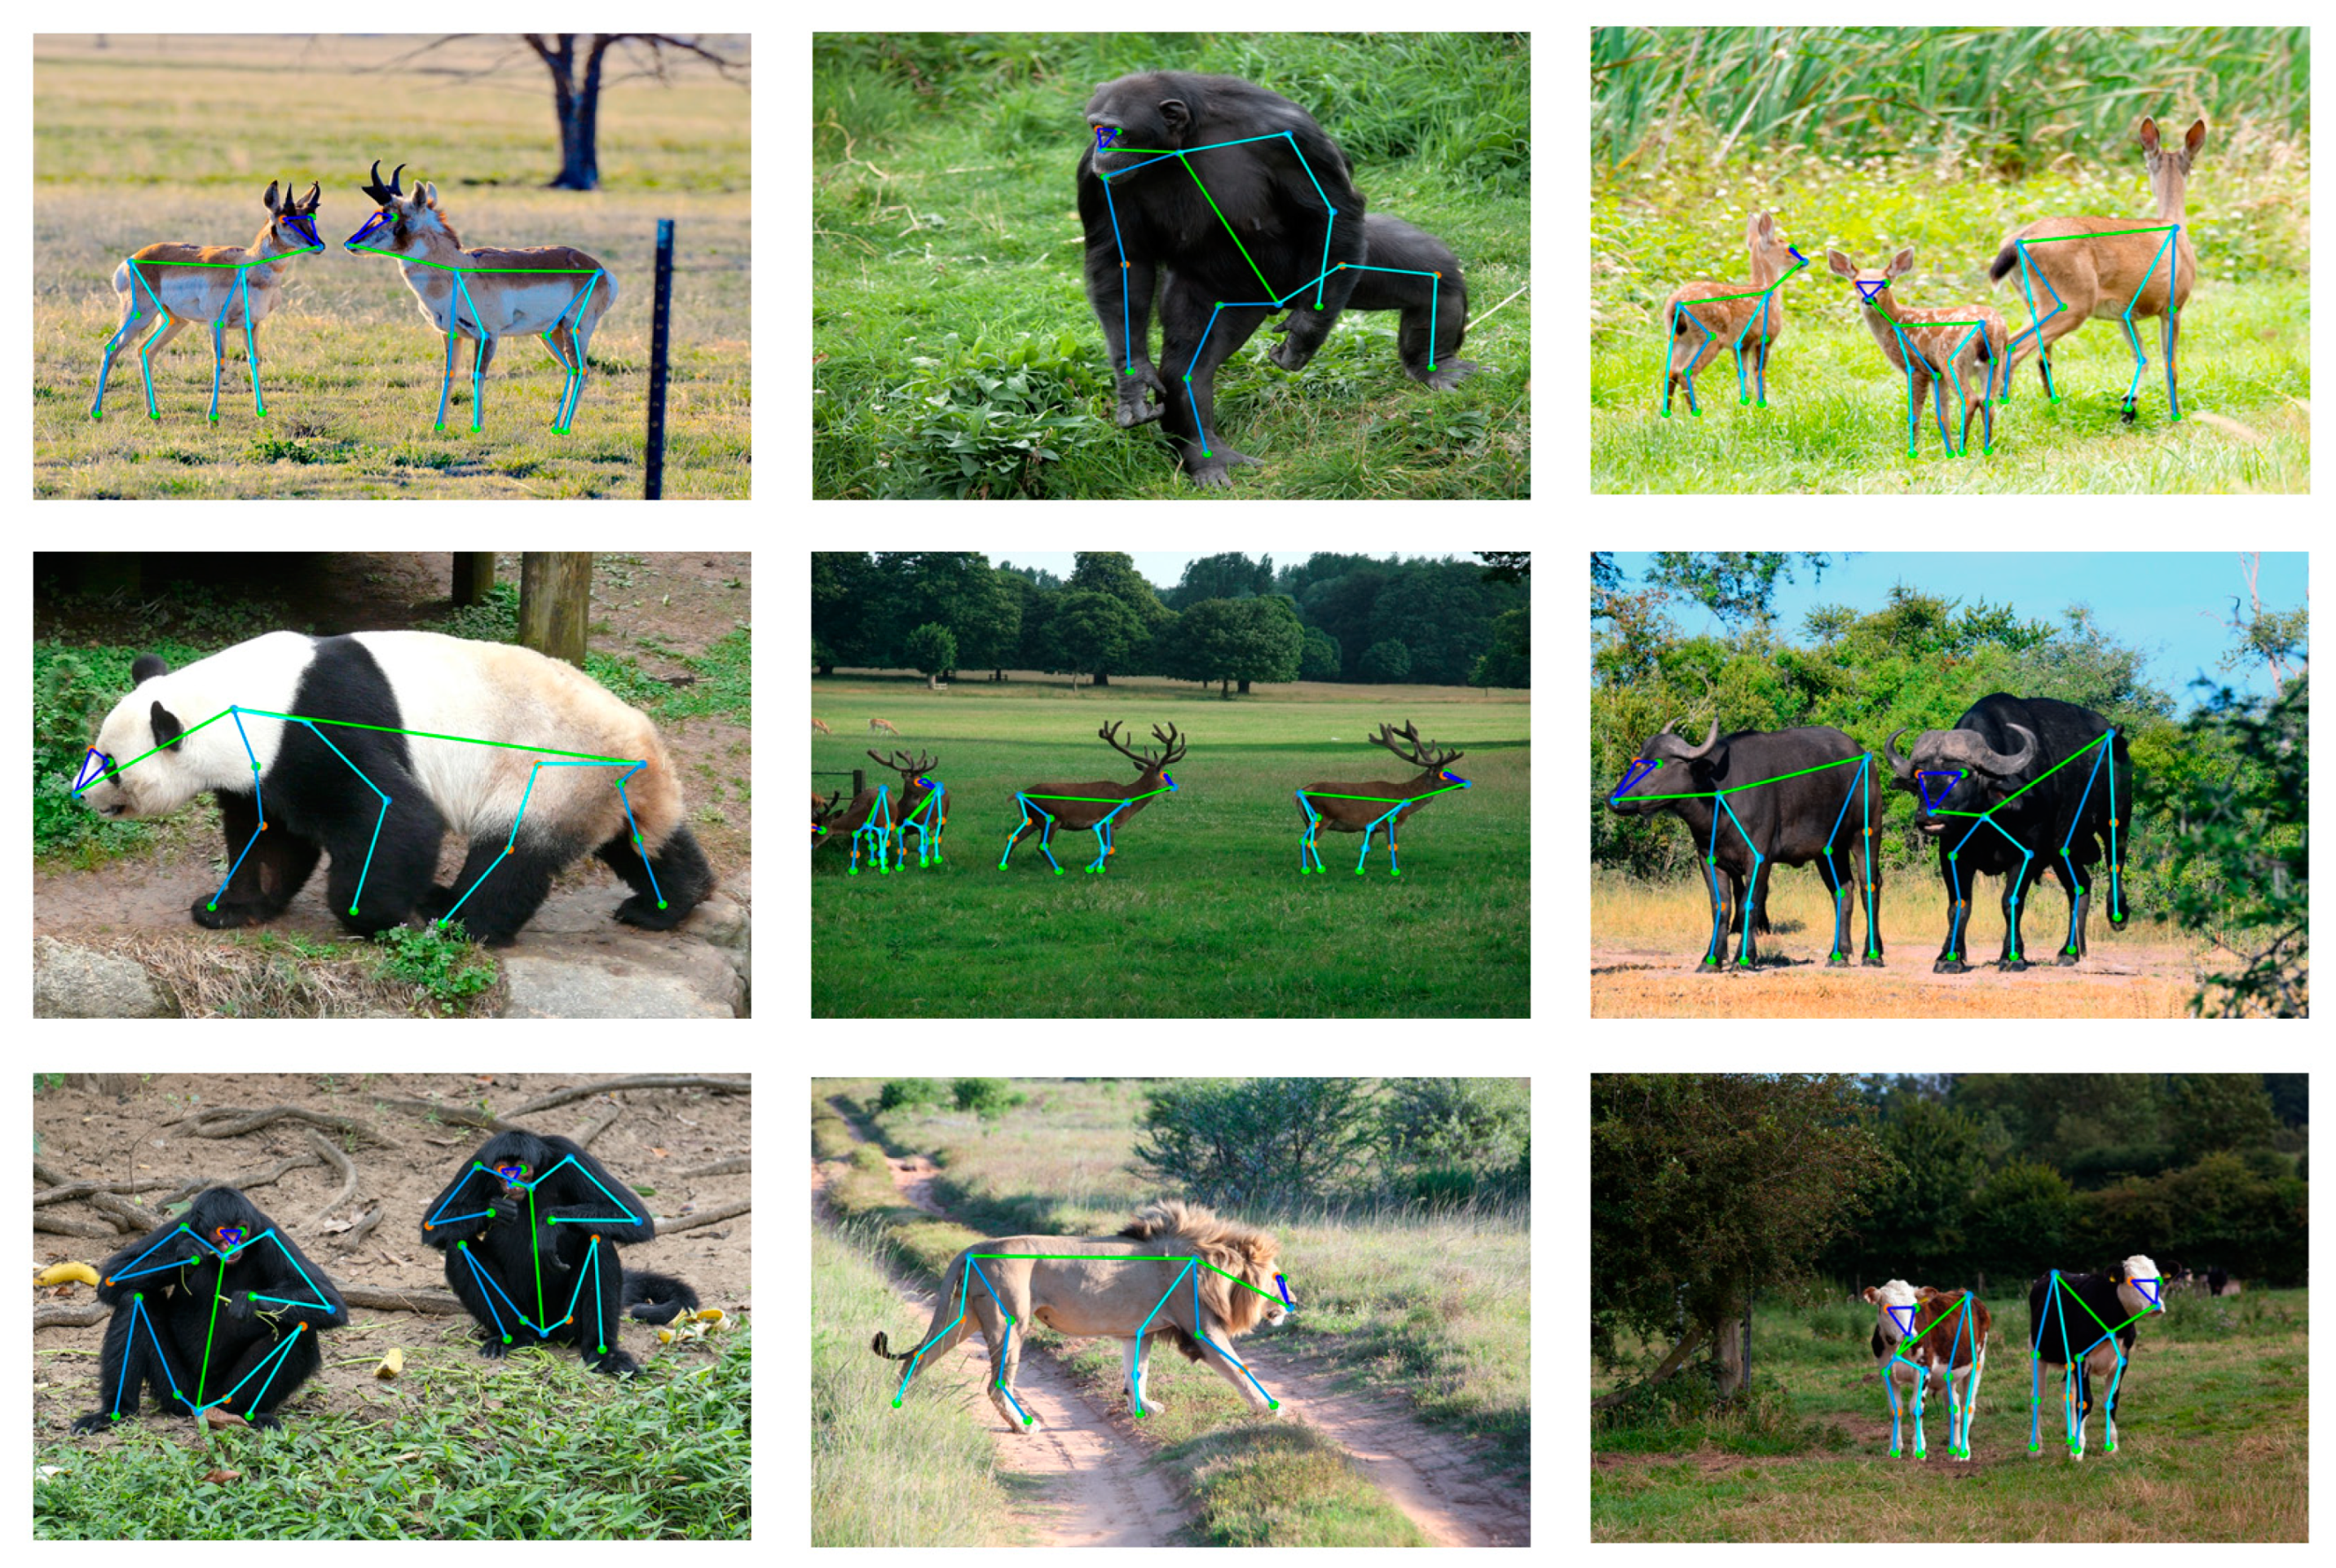
2.2. Public Dataset AP-10K
2.3. Methods
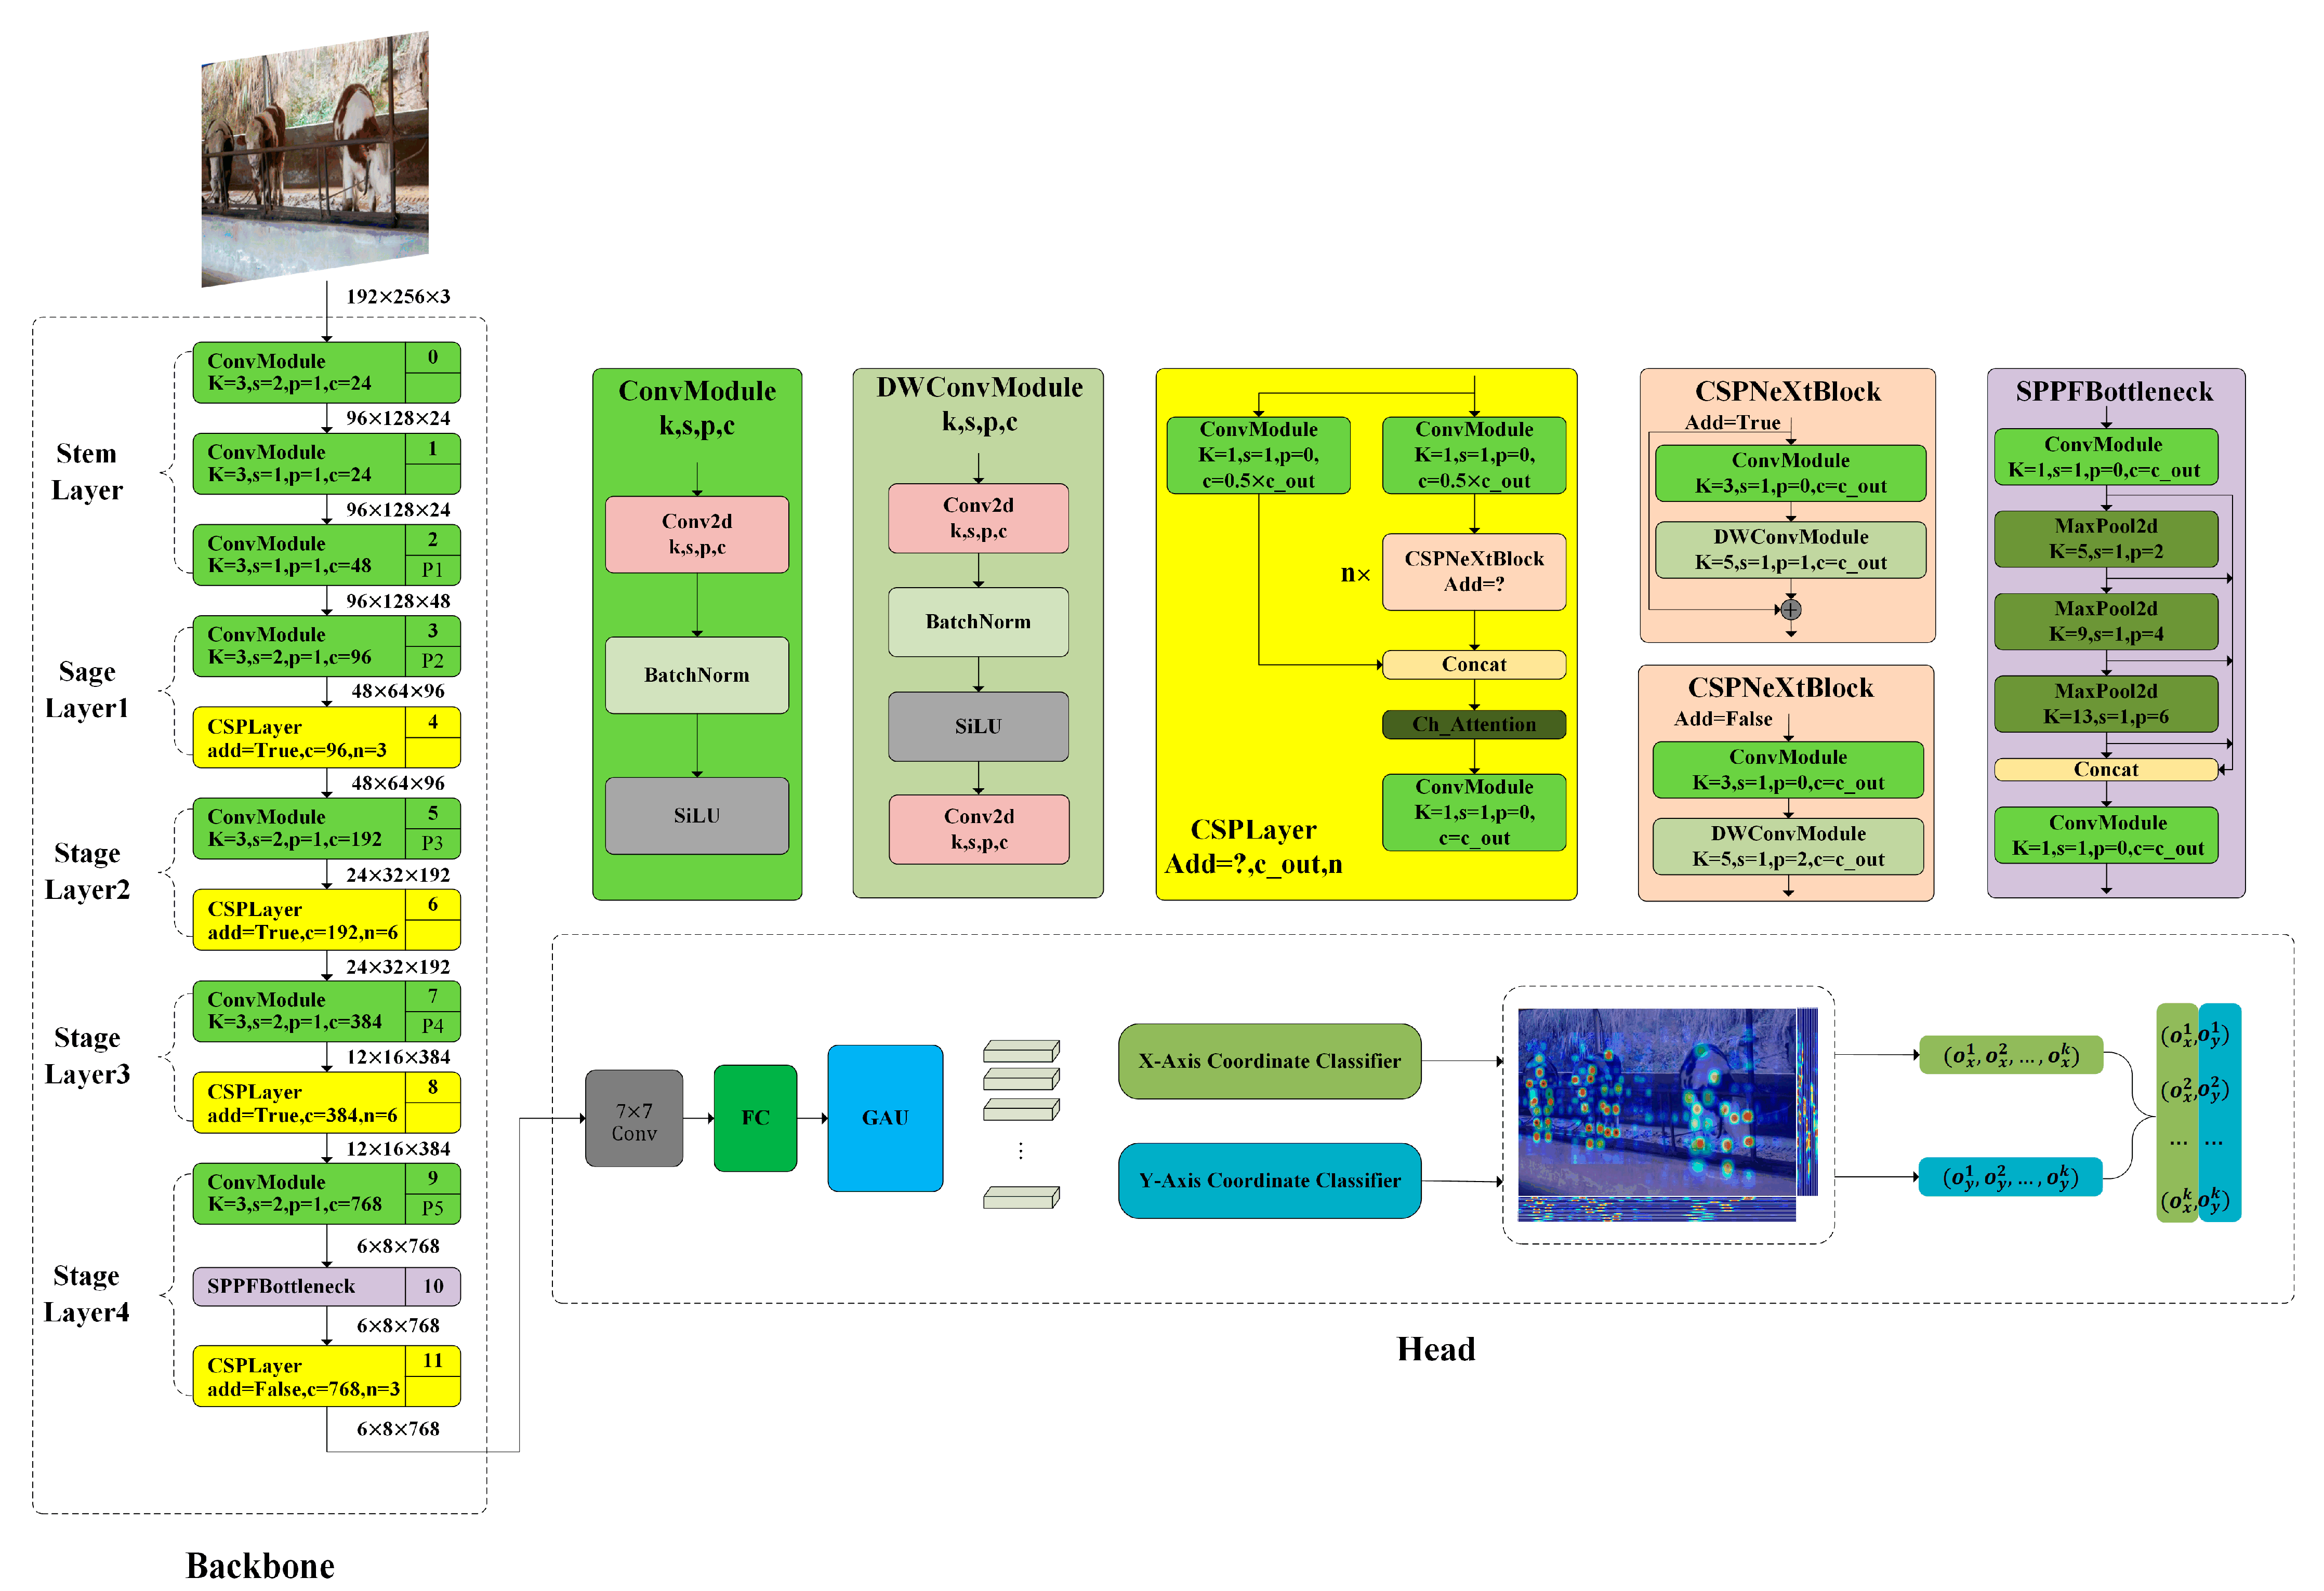
2.3.1. RTMPose
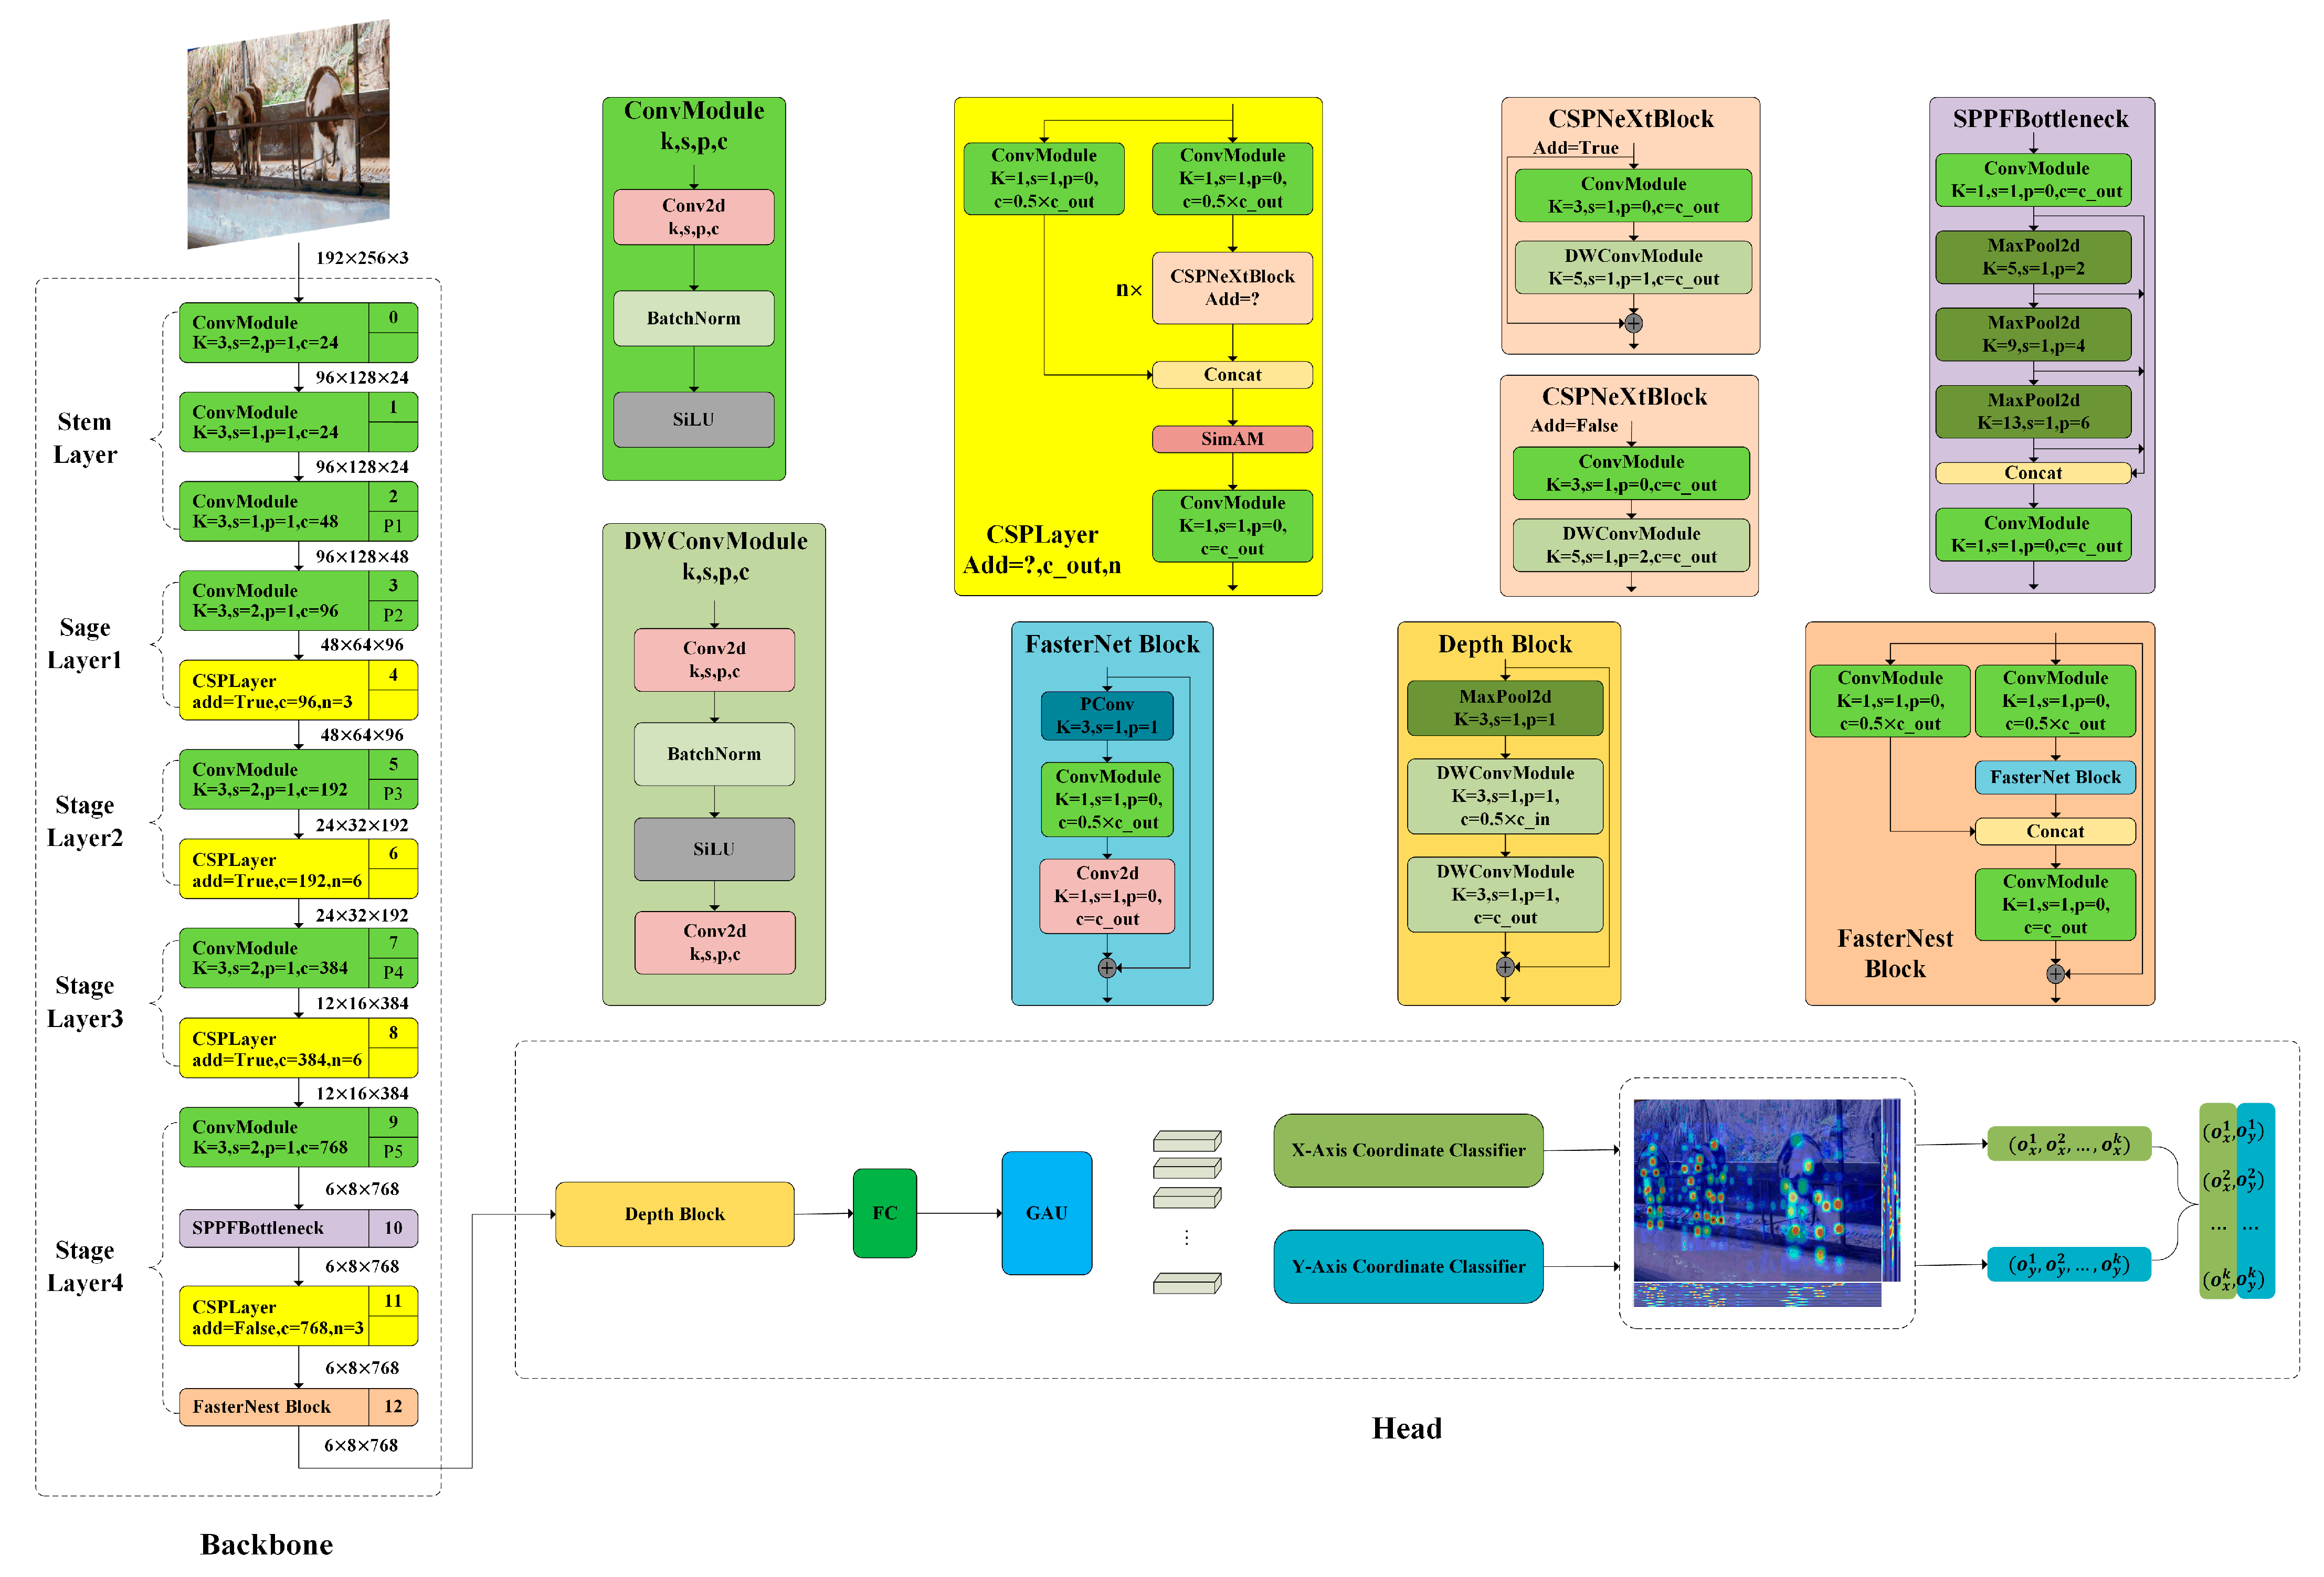
2.3.2. RTMPose-FSD
2.3.3. FasterNest Block
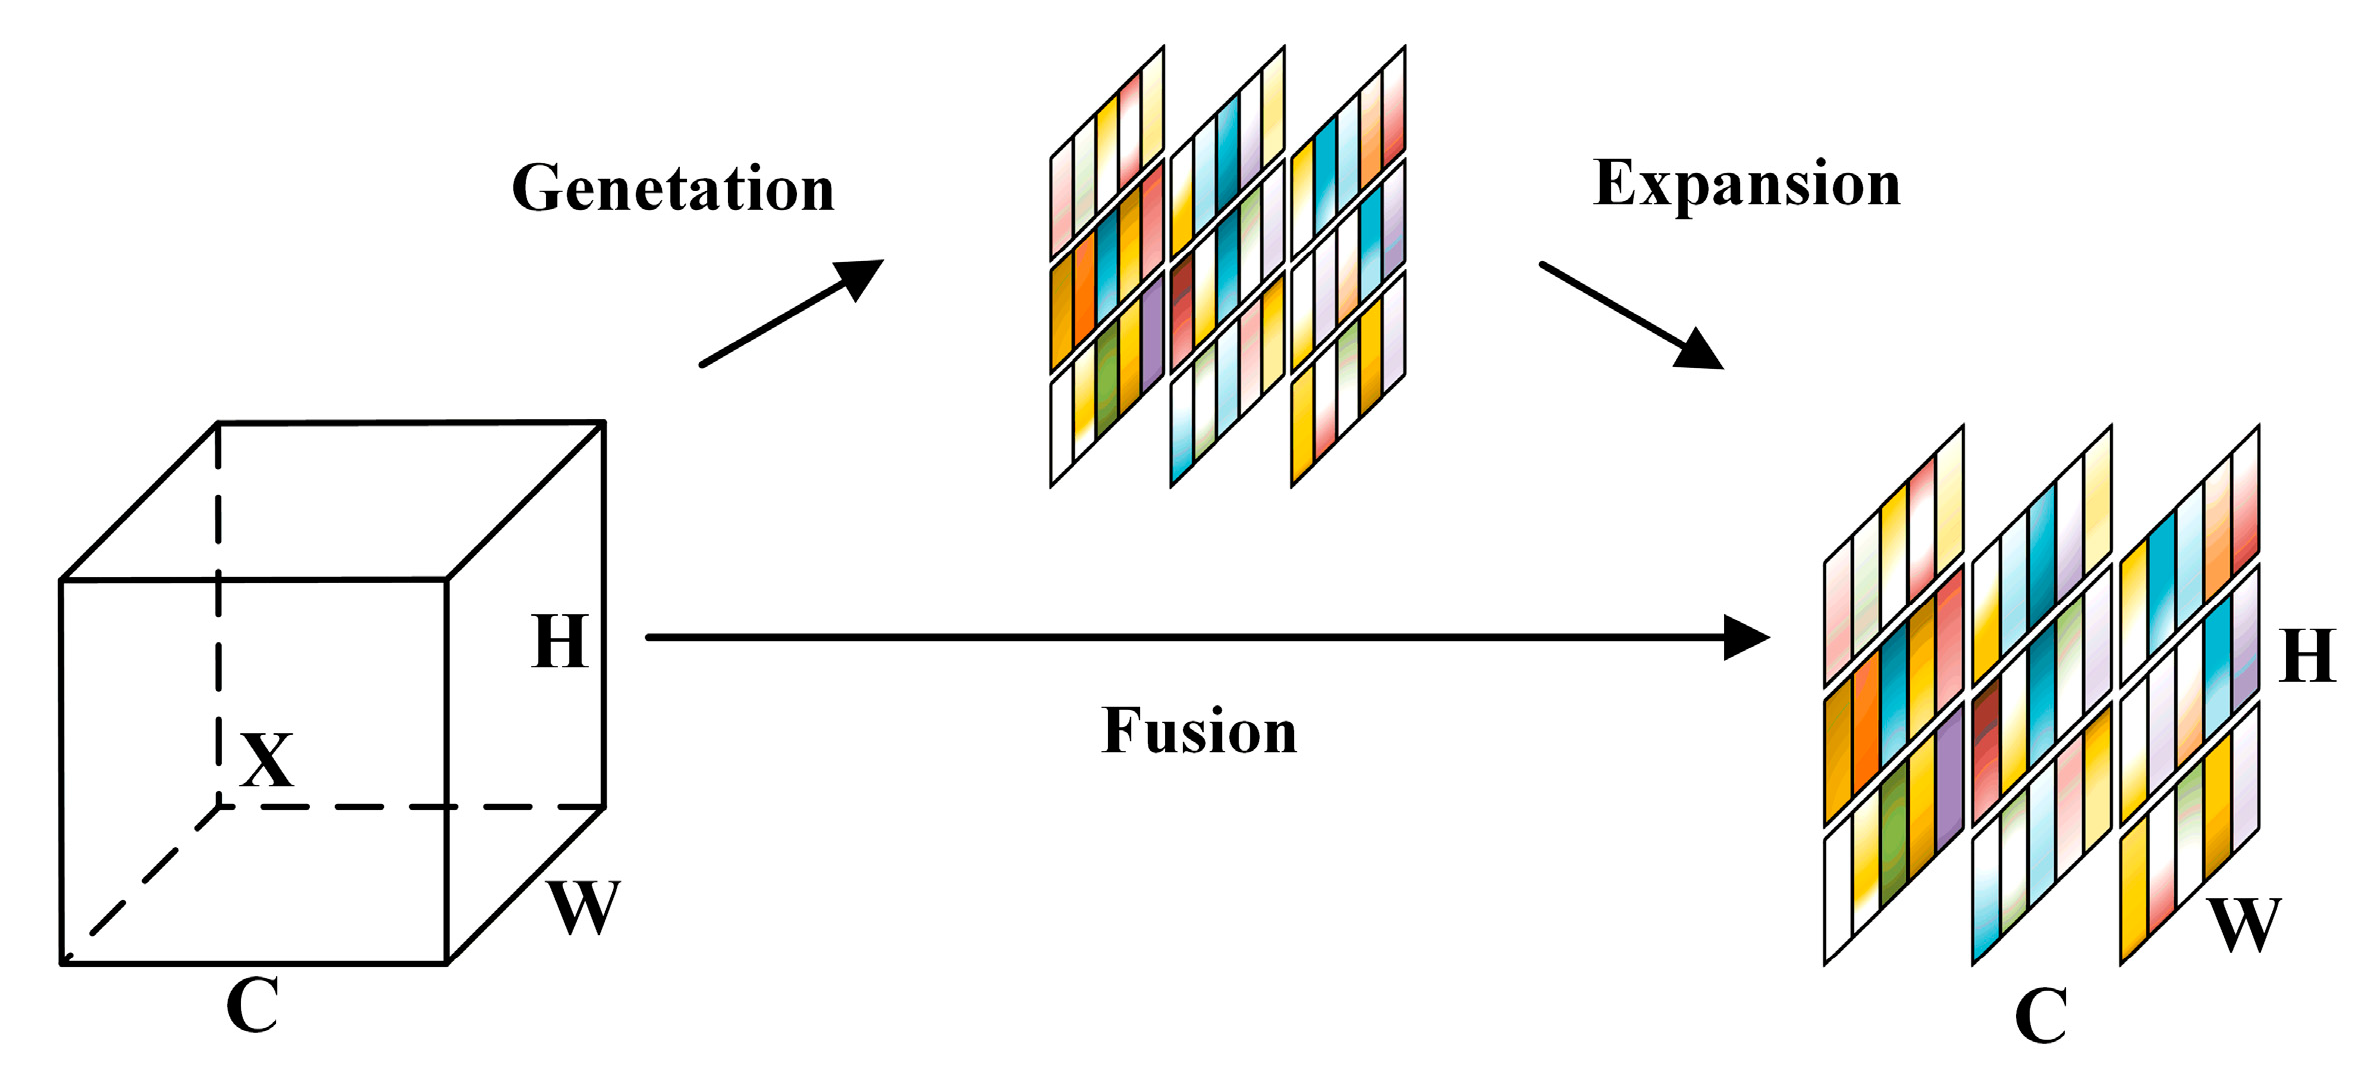
2.3.4. SimAM Attention Mechanism
2.3.5. Depth Block
2.4. Evaluation Indicators and Experimental Environment
2.4.1. Evaluation Indicators
2.4.2. Experimental Setup
3. Results
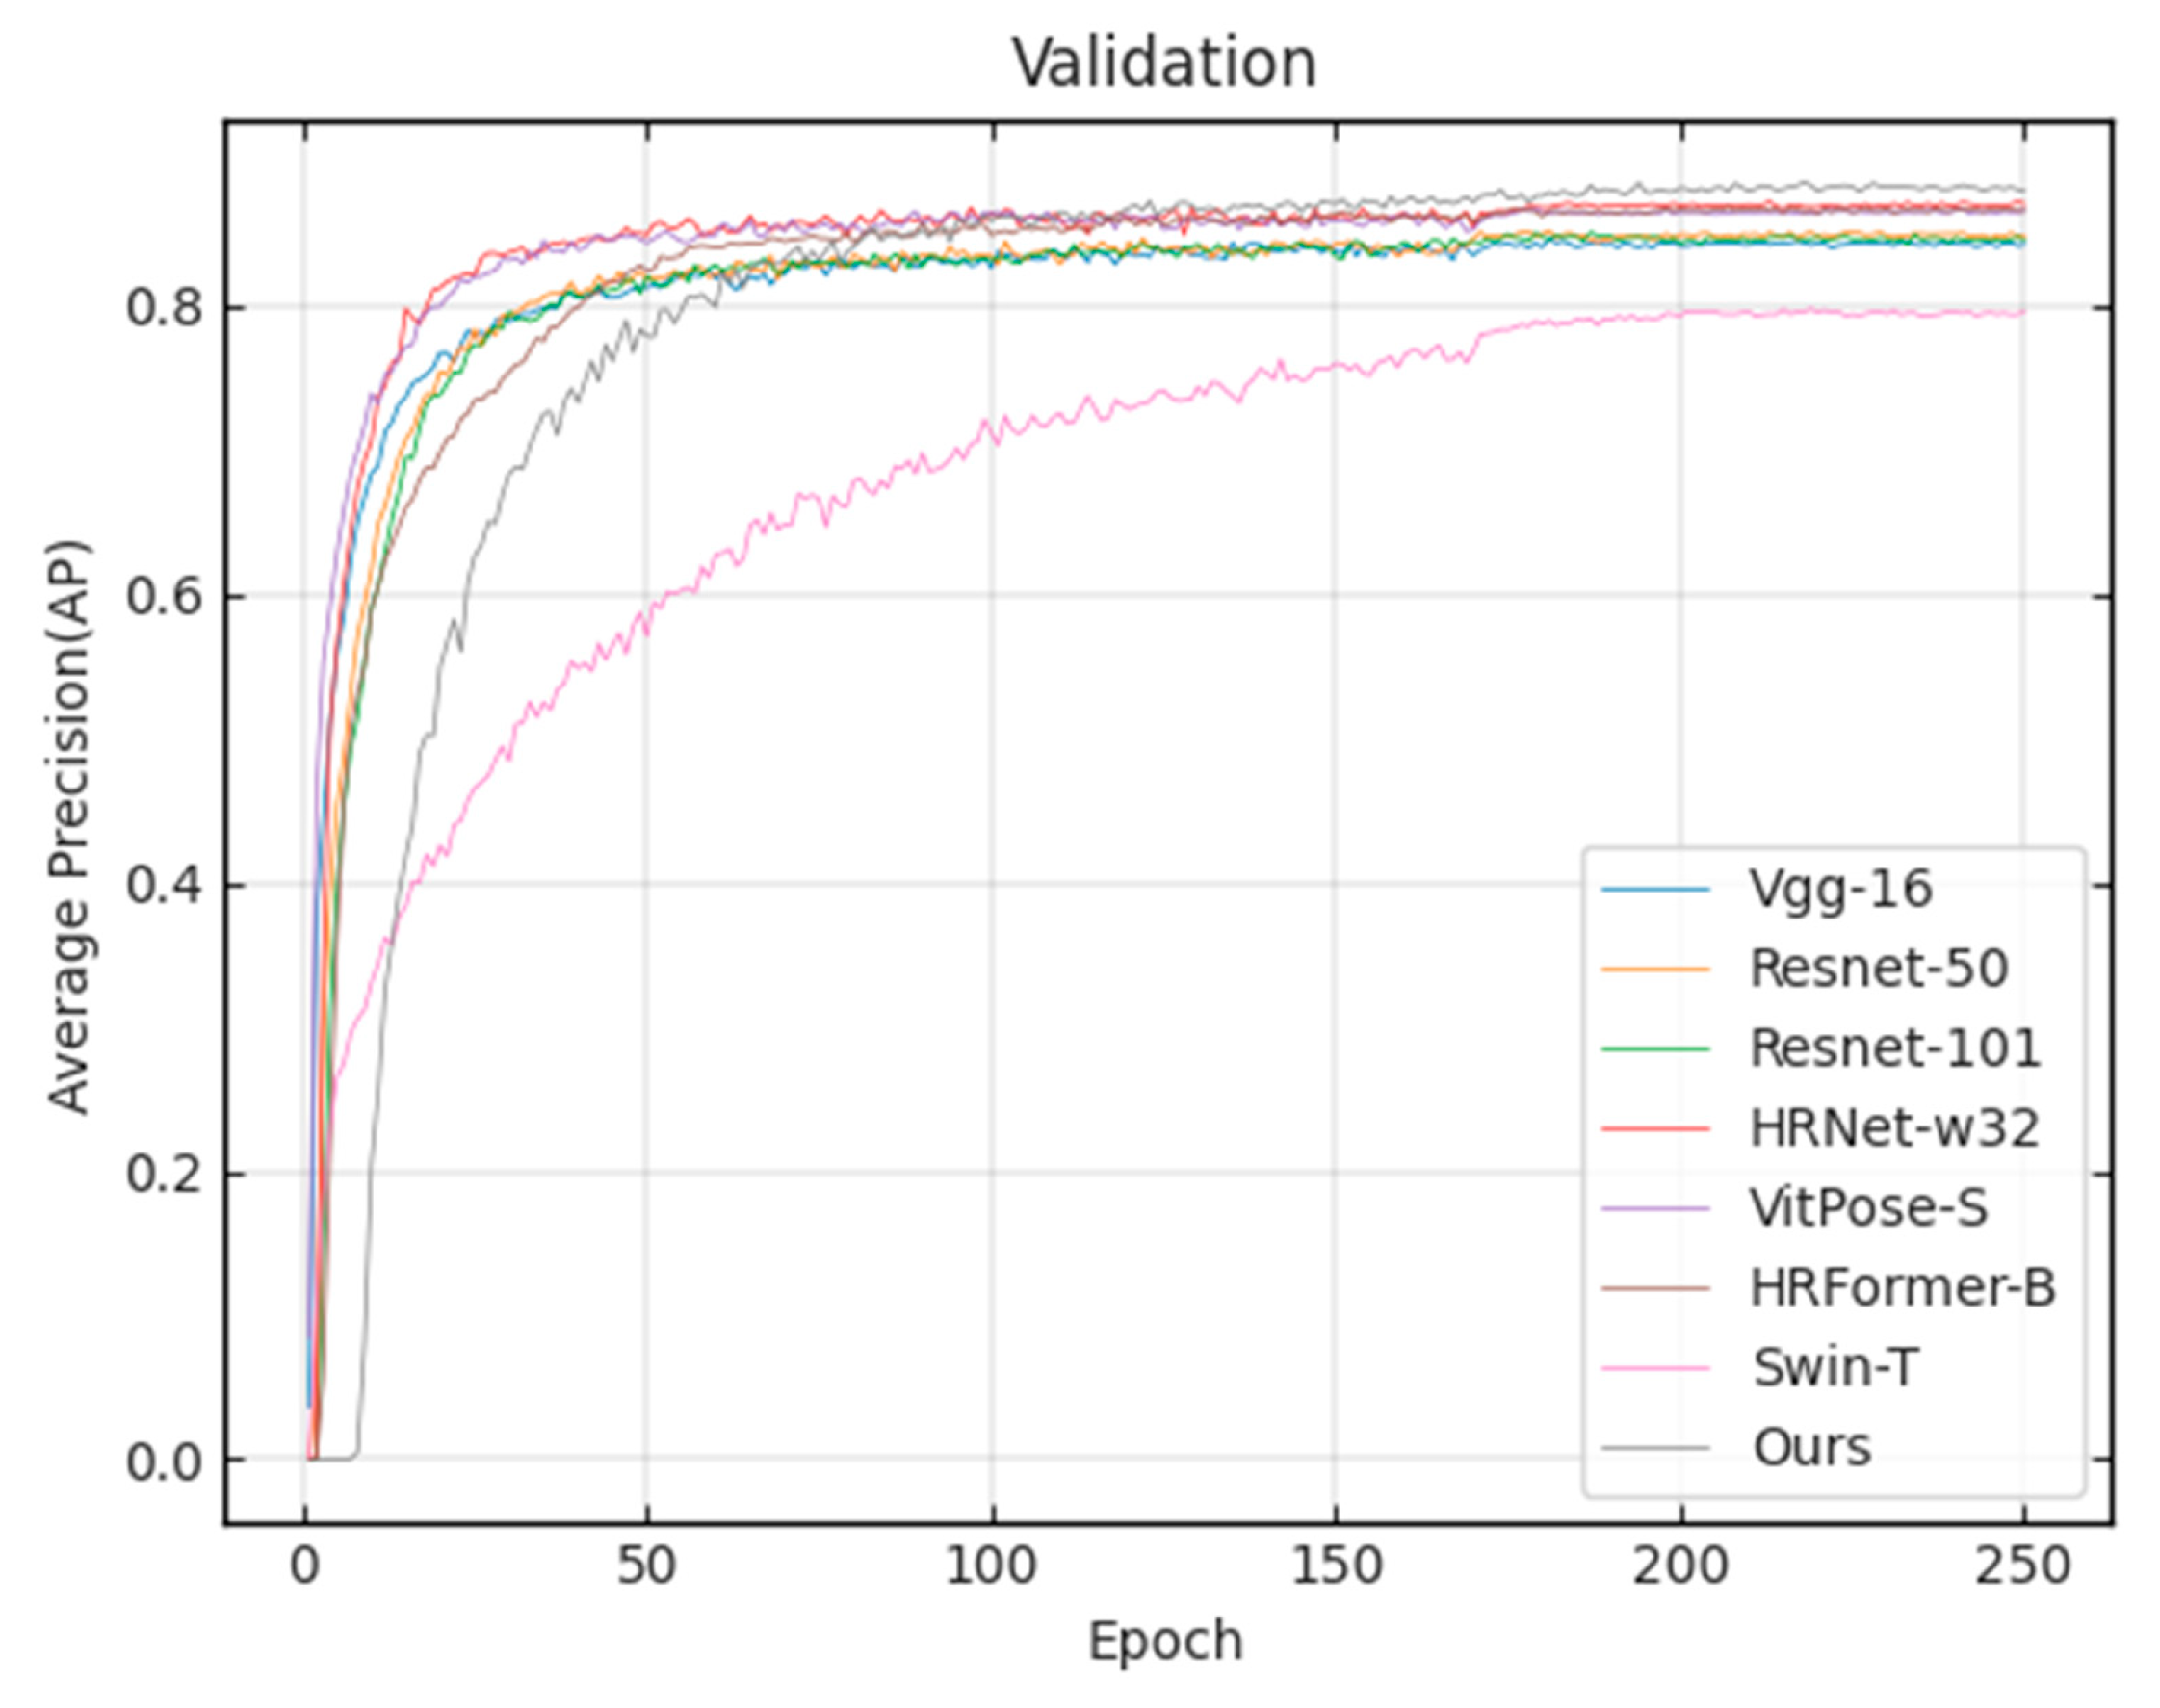
3.1. Validation Set Results
3.2. Test Set Results
3.3. Ablation Experiments
4. Discussion
5. Conclusions
Author Contributions
Funding
Institutional Review Board Statement
Data Availability Statement
Acknowledgments
Conflicts of Interest
References
- Nasirahmadi, A.; Edwards, S.A.; Sturm, B. Implementation of machine vision for detecting behaviour of cattle and pigs. Livest. Sci. 2017, 202, 25–38. [Google Scholar] [CrossRef]
- Li, J.; Xu, W.; Deng, L.; Xiao, Y.; Han, Z.; Zheng, H. Deep learning for visual recognition and detection of aquatic animals: A review. Rev. Aq-Uaculture 2023, 15, 409–433. [Google Scholar] [CrossRef]
- Hernandez-Patlan, D.; Tellez-Isaias, G.; Hernandez-Velasco, X.; Solis-Cruz, B. Technological strategies to improve animal health and production. Front. Vet. Sci. 2023, 10, 1206170. [Google Scholar] [CrossRef] [PubMed]
- Fang, C.; Zhang, T.; Zheng, H.; Huang, J.; Cuan, K. Pose estimation and behavior classification of broiler chickens based on deep neural networks. Comput. Electron. Agric. 2021, 180, 105863. [Google Scholar] [CrossRef]
- Barney, S.; Dlay, S.; Crowe, A.; Kyriazakis, I.; Leach, M. Deep learning pose estimation for multi-cattle lameness detection. Sci. Rep. 2023, 13, 4499. [Google Scholar] [CrossRef]
- Warnick, L.; Janssen, D.; Guard, C.; Gröhn, Y. The effect of lameness on milk production in dairy cows. J. Dairy Sci. 2001, 84, 1988–1997. [Google Scholar] [CrossRef]
- Li, X.; Cai, C.; Zhang, R.; Ju, L.; He, J. Deep cascaded convolutional models for cattle pose estimation. Comput. Electron. Agric. 2019, 164, 104885. [Google Scholar] [CrossRef]
- Liu, S.; Fan, Q.; Liu, S.; Zhao, C. DepthFormer: A High-Resolution Depth-Wise Transformer for Animal Pose Estimation. Agriculture 2022, 12, 1280. [Google Scholar] [CrossRef]
- Gong, C.; Zhang, Y.; Wei, Y.; Du, X.; Su, L.; Weng, Z. Multicow pose estimation based on keypoint extraction. PLoS ONE 2022, 17, e0269259. [Google Scholar] [CrossRef]
- Fan, Q.; Liu, S.; Li, S.; Zhao, C. Bottom-up cattle pose estimation via concise multi-branch network. Comput. Electron. Agric. 2023, 211, 107945. [Google Scholar] [CrossRef]
- Sun, K.; Xiao, B.; Liu, D.; Wang, J. Deep high-resolution representation learning for human pose estimation. In Proceedings of the IEEE/CVF Conference on Computer Vision and Pattern Recognition, Long Beach, CA, USA, 15–20 June 2019; pp. 5693–5703. [Google Scholar]
- Cheng, B.; Xiao, B.; Wang, J.; Shi, H.; Huang, T.S.; Zhang, L. Higherhrnet: Scale-aware representation learning for bottom-up human pose estimation. In Proceedings of the IEEE/CVF Conference on Computer Vision and Pattern Recognition, Seattle, WA, USA, 13–19 June 2020; pp. 5386–5395. [Google Scholar]
- Jiang, T.; Lu, P.; Zhang, L.; Ma, N.; Han, R.; Lyu, C.; Li, Y.; Chen, K. RTMPose: Real-Time Multi-Person Pose Estimation based on MMPose. arXiv 2023, arXiv:2303.07399. [Google Scholar]
- Nguyen, H.C.; Nguyen, T.H.; Nowak, J.; Byrski, A.; Siwocha, A.; Le, V.H. Combined yolov5 and hrnet for high accuracy 2d keypoint and human pose estimation. J. Artif. Intell. Soft Comput. Res. 2022, 12, 281–298. [Google Scholar] [CrossRef]
- Seong, S.; Choi, J. Semantic segmentation of urban buildings using a high-resolution network (HRNet) with channel and spatial attention gates. Remote Sens. 2021, 13, 3087. [Google Scholar] [CrossRef]
- Yuan, Y.; Fu, R.; Huang, L.; Lin, W.; Zhang, C.; Chen, X.; Wang, J. Hrformer: High-resolution transformer for dense prediction. arXiv 2021, arXiv:2110.09408. [Google Scholar]
- Lin, T.-Y.; Maire, M.; Belongie, S.; Bourdev, L.; Girshick, R.; Hays, J.; Perona, P.; Ramanan, D.; Zitnick, C.L.; Dollár, P. Microsoft coco: Common objects in context. In Proceedings of the Computer Vision–ECCV 2014: 13th European Conference, Zurich, Switzerland, 6–12 September 2014; Proceedings, Part V 13. Springer International Publishing: Zurich, Switzerland, 2014; pp. 740–755. [Google Scholar]
- Xu, Y.; Zhang, J.; Zhang, Q.; Tao, D. Vitpose: Simple vision transformer baselines for human pose estimation. Adv. Neural Inf. Process. Syst. 2022, 35, 38571–38584. [Google Scholar]
- Toshev, A.; Szegedy, C. Deeppose: Human pose estimation via deep neural networks. In Proceedings of the IEEE Conference on Computer Vision and Pattern Recognition, Columbus, OH, USA, 23–28 June 2014; pp. 1653–1660. [Google Scholar]
- Li, J.; Bian, S.; Zeng, A.; Wang, C.; Pang, B.; Liu, W.; Lu, C. Human pose regression with residual log-likelihood estimation. In Proceedings of the IEEE/CVF International Conference on Computer Vision, Montreal, BC, Canada, 11–17 October 2021; pp. 11025–11034. [Google Scholar]
- Newell, A.; Yang, K.; Deng, J. Stacked hourglass networks for human pose estimation. In Proceedings of the Computer Vision–ECCV 2016: 14th European Conference, Amsterdam, The Netherlands, 11–14 October 2016; Proceedings, Part VIII 14. Springer International Publishing: Berlin/Heidelberg, Germany, 2016; pp. 483–499. [Google Scholar]
- Li, Y.; Yang, S.; Liu, P.; Zhang, S.; Wang, Y.; Wang, Z.; Yang, W. Simcc: A simple coordinate classification perspective for human pose estimation. In Proceedings of the European Conference on Computer Vision, Tel Aviv, Israel, 23–27 October 2022; Springer Nature: Cham, Switzerland, 2022; pp. 89–106. [Google Scholar]
- Lyu, C.; Zhang, W.; Huang, H.; Zhou, Y.; Wang, Y.; Liu, Y.; Zhang, S.; Chen, K. Rtmdet: An empirical study of designing real-time object detectors. arXiv 2022, arXiv:2212.07784. [Google Scholar]
- Yu, H.; Xu, Y.; Zhang, J.; Zhao, W.; Guan, Z.; Tao, D. Ap-10k: A wild animal pose estimation benchmark. arXiv 2021, arXiv:2108.12617. [Google Scholar]
- Xiao, B.; Wu, H.; Wei, Y. Simple baselines for human pose estimation and tracking. In Proceedings of the European Conference on Computer Vision (ECCV), Honolulu, HI, USA, 21–26 July 2018; pp. 466–481. [Google Scholar]
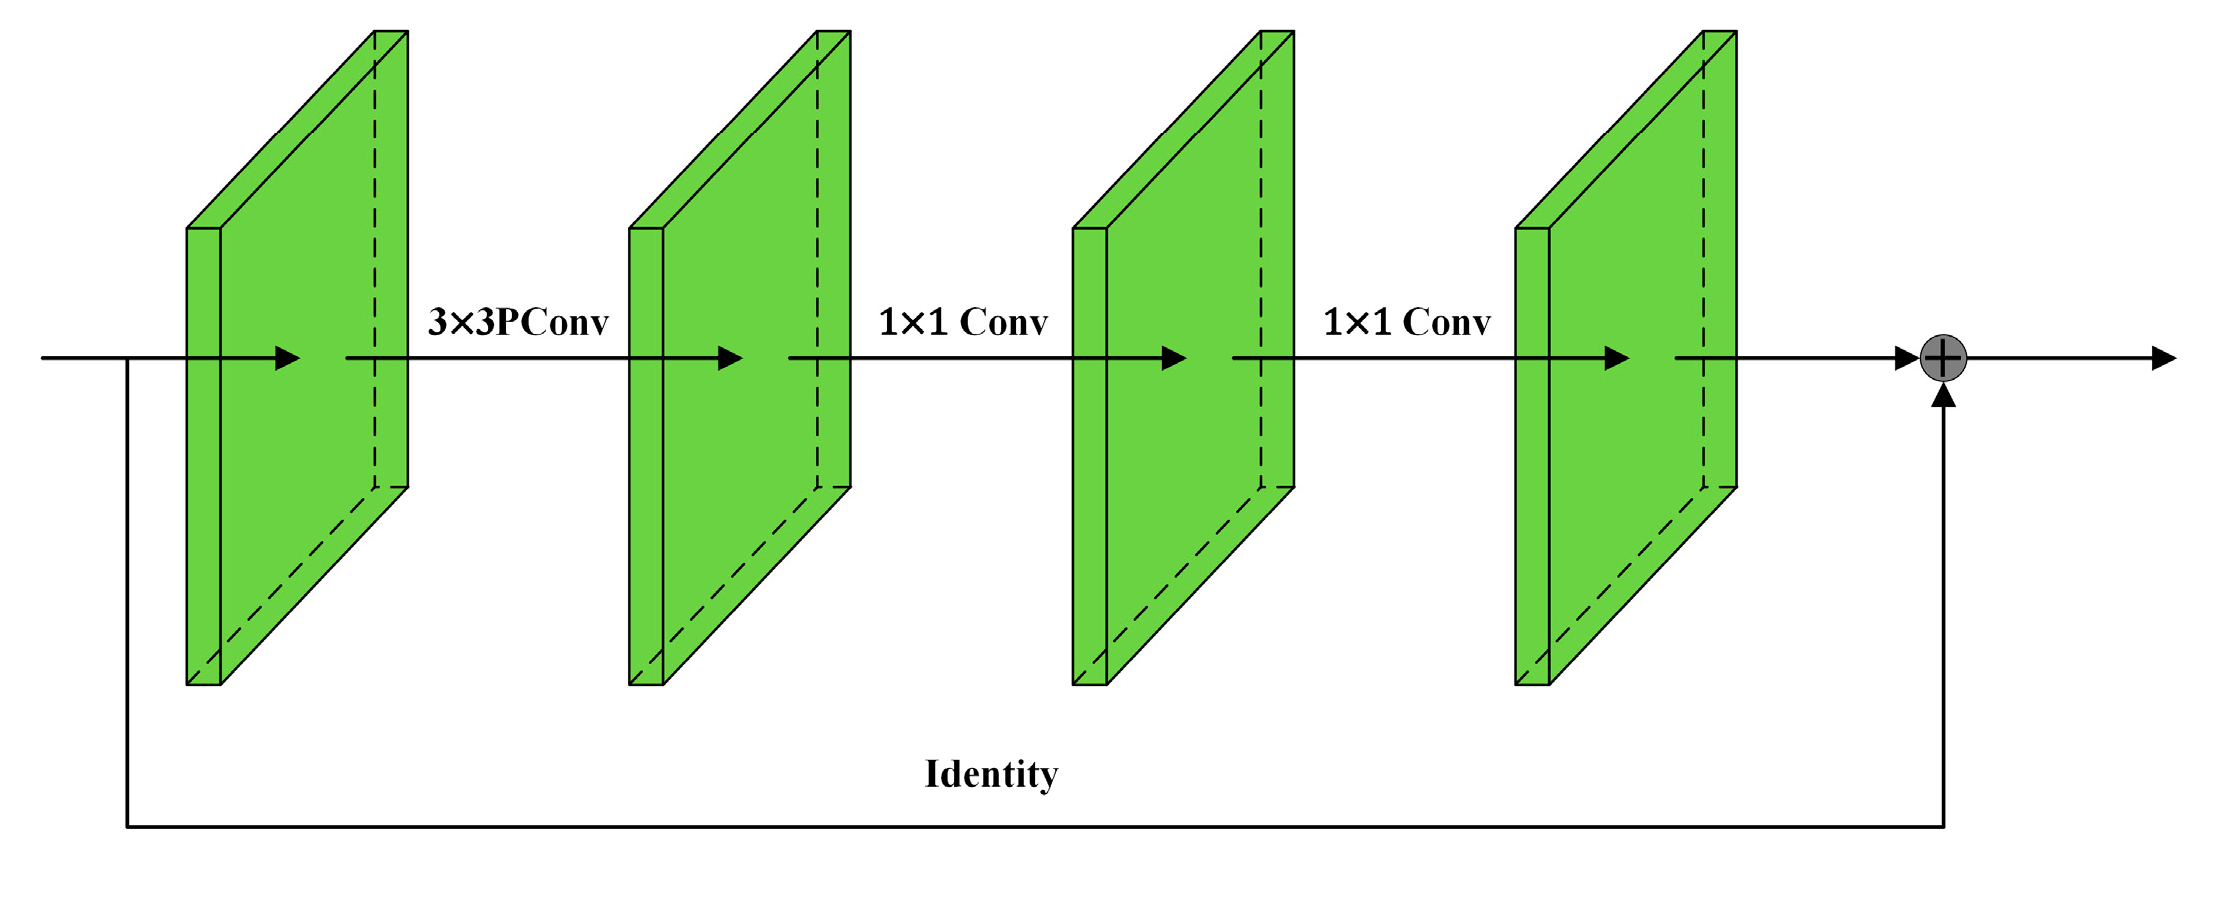
- Chen, J.; Kao, S.-H.; He, H.; Zhuo, W.; Wen, S.; Lee, C.-H.; Chan, S.-H.G. Run, Don’t Walk: Chasing Higher FLOPS for Faster Neural Networks. In Proceedings of the IEEE/CVF Conference on Computer Vision and Pattern Recognition, Vancouver, BC, Canada, 18–22 June 2023; pp. 12021–12031. [Google Scholar]
- Bahdanau, D.; Cho, K.; Bengio, Y. Neural machine translation by jointly learning to align and translate. arXiv 2014, arXiv:1409.0473. [Google Scholar]
- Woo, S.; Park, J.; Lee, J.Y.; Kweon, I.S. Cbam: Convolutional block attention module. In Proceedings of the European Conference on Computer Vision (ECCV), Tel Aviv, Israel, 23–27 October 2018; pp. 3–19. [Google Scholar]
- Vaswani, A.; Shazeer, N.; Parmar, N.; Uszkoreit, J.; Jones, L.; Gomez, A.N.; Kaiser, Ł.; Polosukhin, I. Attention is all you need. In Proceedings of the 31st International Conference on Neural Information Processing System, Long Beach, CA, USA, 4–9 December 2017; pp. 6000–6010. [Google Scholar]
- Webb, B.S.; Dhruv, N.T.; Solomon, S.G.; Tailby, C.; Lennie, P. Early and late mechanisms of surround suppression in striate cortex of macaque. J. Neurosci. 2005, 25, 11666–11675. [Google Scholar] [CrossRef]
- Yang, L.; Zhang, R.Y.; Li, L.; Xie, X. Simam: A simple, parameter-free attention module for convolutional neural networks. In Proceedings of the International Conference on Machine Learning, Baltimore, MD, USA, 17–23 July 2021; pp. 11863–11874. [Google Scholar]
- Chollet, F. Xception: Deep learning with depthwise separable convolutions. In Proceedings of the IEEE Conference on Computer Vision and Pattern Recognition, Honolulu, HI, USA, 21–26 July 2017; pp. 1251–1258. [Google Scholar]
- Simonyan, K.; Zisserman, A. Very deep convolutional networks for large-scale image recognition. arXiv 2014, arXiv:1409.1556. [Google Scholar]
- He, K.; Zhang, X.; Ren, S.; Sun, J. Deep residual learning for image recognition. In Proceedings of the IEEE Conference on Computer Vision and Pattern Recognition, Las Vegas, NV, USA, 26 June–1 July 2016; pp. 770–778. [Google Scholar]
- Liu, Z.; Lin, Y.; Cao, Y.; Hu, H.; Wei, Y.; Zhang, Z.; Lin, S.; Guo, B. Swin transformer: Hierarchical vision transformer using shifted windows. In Proceedings of the IEEE/CVF International Conference on Computer Vision, Montreal, BC, Canada, 11–17 October 2021; pp. 10012–10022. [Google Scholar]
- Zhou, H.; Wang, X.; Au, W.; Kang, H.; Chen, C. Intelligent robots for fruit harvesting: Recent developments and future challenges. Precis. Agric. 2022, 23, 1856–1907. [Google Scholar] [CrossRef]
- Eli-Chukwu N, C. Applications of artificial intelligence in agriculture: A review. Eng. Technol. Appl. Sci. Res. 2019, 9, 4377–4383. [Google Scholar] [CrossRef]
- Wang, X.; Wang, W.; Lu, J.; Wang, H. HRST: An Improved HRNet for Detecting Joint Points of Pigs. Sensors 2022, 22, 7215. [Google Scholar] [CrossRef] [PubMed]
- Gong, Z.; Zhang, Y.; Lu, D.; Wu, T. Vision-Based Quadruped Pose Estimation and Gait Parameter Extraction Method. Electronics 2022, 11, 3702. [Google Scholar] [CrossRef]
- Volkmann, N.; Zelenka, C.; Devaraju, A.M.; Brünger, J.; Stracke, J.; Spindler, B.; Kemper, N.; Koch, R. Keypoint detection for injury identification during turkey husbandry using neural networks. Sensors 2022, 22, 5188. [Google Scholar] [CrossRef] [PubMed]


| Methods | Input Size | Params (M) | FLOPs (G) | AP | AP50 | AP75 | AR | FPS |
|---|---|---|---|---|---|---|---|---|
| Vgg-16 | 192 × 256 | 19.1 | 16.3 | 84.5 | 95.9 | 88.2 | 86.5 | 19 |
| Resnet-50 | 192 × 256 | 34.1 | 5.5 | 84.8 | 92.3 | 88.3 | 87.0 | 33 |
| Resnet-101 | 192 × 256 | 53.1 | 9.2 | 85.1 | 94.9 | 89.6 | 87.2 | 27 |
| HRNet-w32 | 192 × 256 | 28.6 | 7.8 | 87.0 | 96.8 | 89.7 | 90.0 | 16 |
| VitPose-S | 192 × 256 | 24.3 | 5.4 | 86.6 | 96.2 | 89.5 | 88.4 | 32 |
| HRFormer-B | 192 × 256 | 43.3 | 13.3 | 86.6 | 96.5 | 88.9 | 88.5 | 16 |
| Swin-T | 192 × 256 | 32.8 | 6.2 | 79.8 | 95.7 | 85.4 | 82.0 | 30 |
| Ours | 192 × 256 | 14.2 | 2.0 | 88.6 | 96.8 | 92.0 | 90.4 | 39 |
| Methods | Input Size | Params (M) | FLOPs (G) | AP | AP50 | AP75 | AR | FPS |
|---|---|---|---|---|---|---|---|---|
| Vgg-16 | 192 × 256 | 19.1 | 16.3 | 78.2 | 95.1 | 84.6 | 81.3 | 19 |
| Resnet-50 | 192 × 256 | 34.1 | 5.5 | 78.8 | 96.1 | 84.3 | 82.3 | 33 |
| Resnet-101 | 192 × 256 | 53.1 | 9.2 | 79.6 | 96.3 | 85.1 | 83.4 | 27 |
| HRNet-32 | 192 × 256 | 28.6 | 7.8 | 81.4 | 96.5 | 88.4 | 83.9 | 16 |
| VitPose-S | 192 × 256 | 24.3 | 5.4 | 80.7 | 95.5 | 86.6 | 83.6 | 32 |
| HRFormer-B | 192 × 256 | 43.3 | 13.3 | 81.2 | 96.5 | 86.5 | 83.6 | 16 |
| Swin-T | 192 × 256 | 32.8 | 6.2 | 70.1 | 94.2 | 74.6 | 73.4 | 30 |
| Ours | 192 × 256 | 14.2 | 2.0 | 82.9 | 96.7 | 90.2 | 85.8 | 39 |
| Methods | Input Size | Params (M) | FLOPs (G) | AP | AP50 | AP75 | AR | FPS |
|---|---|---|---|---|---|---|---|---|
| Vgg-16 | 192 × 256 | 19.1 | 16.3 | 66.3 | 91.5 | 72.4 | 70.3 | 19 |
| Resnet-50 | 192 × 256 | 34.1 | 5.5 | 66.5 | 91.7 | 72.7 | 70.4 | 33 |
| Resnet-101 | 192 × 256 | 53.1 | 9.2 | 67.2 | 91.9 | 73.4 | 70.9 | 27 |
| HRNet-32 | 192 × 256 | 28.6 | 7.8 | 70.5 | 93.0 | 77.6 | 74.2 | 16 |
| VitPose-S | 192 × 256 | 24.3 | 5.4 | 67.6 | 91.9 | 73.6 | 71.1 | 32 |
| HRFormer-B | 192 × 256 | 43.3 | 13.3 | 70.3 | 92.9 | 75.1 | 73.9 | 16 |
| Swin-T | 192 × 256 | 32.8 | 6.2 | 57.8 | 87.0 | 61.4 | 62.3 | 30 |
| Ours | 192 × 256 | 14.2 | 2.0 | 72.0 | 94.1 | 79.7 | 75.2 | 39 |
| No. | Baseline | FasterNest Block | SimAM | Depth Block | Params (M) | FLOPs (G) | AP | AR | FPS |
|---|---|---|---|---|---|---|---|---|---|
| 1 | √ | 13.6 | 1.9 | 81.5 | 84.4 | 40 | |||
| 2 | √ | √ | 14.6 | 2.0 | 82.0 | 85.3 | 39 | ||
| 3 | √ | √ | 13.6 | 1.9 | 81.8 | 84.9 | 39 | ||
| 4 | √ | √ | 12.5 | 1.9 | 81.9 | 85.1 | 42 | ||
| 5 | √ | √ | √ | 14.6 | 2.0 | 82.3 | 85.6 | 39 | |
| 6 | √ | √ | √ | 14.3 | 2.0 | 82.5 | 85.7 | 40 | |
| 7 | √ | √ | √ | 12.5 | 1.9 | 82.2 | 85.6 | 40 | |
| 8 | √ | √ | √ | √ | 14.2 | 2.0 | 82.9 | 86.0 | 39 |
Disclaimer/Publisher’s Note: The statements, opinions and data contained in all publications are solely those of the individual author(s) and contributor(s) and not of MDPI and/or the editor(s). MDPI and/or the editor(s) disclaim responsibility for any injury to people or property resulting from any ideas, methods, instructions or products referred to in the content. |
© 2023 by the authors. Licensee MDPI, Basel, Switzerland. This article is an open access article distributed under the terms and conditions of the Creative Commons Attribution (CC BY) license (https://creativecommons.org/licenses/by/4.0/).
Share and Cite
Li, X.; Sun, K.; Fan, H.; He, Z. Real-Time Cattle Pose Estimation Based on Improved RTMPose. Agriculture 2023, 13, 1938. https://doi.org/10.3390/agriculture13101938
Li X, Sun K, Fan H, He Z. Real-Time Cattle Pose Estimation Based on Improved RTMPose. Agriculture. 2023; 13(10):1938. https://doi.org/10.3390/agriculture13101938
Chicago/Turabian StyleLi, Xiaowu, Kun Sun, Hongbo Fan, and Zihan He. 2023. "Real-Time Cattle Pose Estimation Based on Improved RTMPose" Agriculture 13, no. 10: 1938. https://doi.org/10.3390/agriculture13101938
APA StyleLi, X., Sun, K., Fan, H., & He, Z. (2023). Real-Time Cattle Pose Estimation Based on Improved RTMPose. Agriculture, 13(10), 1938. https://doi.org/10.3390/agriculture13101938