Article

Response of Shoot and Root Growth, Yield, and Chemical Composition to Nutrient Concentrations in Soybean Varieties Grown under Soilless and Controlled Environment Conditions

Institute of Agronomy, Hungarian University of Agriculture and Life Sciences, Páter Károly u. 1, H-2100 Gödöllő, Hungary
*
Author to whom correspondence should be addressed.
Agriculture 2023, 13(10), 1925; https://doi.org/10.3390/agriculture13101925
Submission received: 18 July 2023 / Revised: 26 September 2023 / Accepted: 27 September 2023 / Published: 30 September 2023
(This article belongs to the Section Crop Production)

Abstract

:
The practice of cultivating crops in a controlled environment using a soilless culture method is seeing an increasing level of popularity. The aforementioned challenges include addressing climate change, combating pests and diseases, mitigating falling soil fertility, and ensuring constant production and quality. One of the potential crops that could be grown with such a method is soybean. Soybean cultivation in a controlled environment using soilless culture still needs more information, especially regarding nutrient solution management of certain soybean varieties. Thus, this study investigated the impact of nutrient concentrations and variety on soybean growth, yield, and chemical composition. This research was carried out in a plant growth chamber using expanded clay aggregate as a soilless substrate. The treatments were four nutrient concentrations: 0% (control), 50%, 100%, and 150%, and two different varieties: Martina and Johanna. The findings of this research revealed that there were significant differences in nutrient treatments on all parameters measured. Application of nutrient concentration at 50% resulted in the most profound root size for both varieties. Applying 100% nutrient concentration produced a higher 100-grain weight for the Johanna variety. Application of nutrient concentration at 150% resulted in the highest shoot weight and shoot:root ratio for both varieties, with varietal differences. Furthermore, applying nutrient concentration at 150% also produced the highest grain yield/pot, protein yield, and lipid yield for both varieties. Thus, the nutrient concentration between 100% and 150% gave a positive effect and can be applied for planting Martina and Johanna using this system.

1. Introduction

The practice of controlled or indoor environment agriculture for food production is gaining significant popularity on a global scale. The efficacy of controlled environment agriculture lies in its capacity to shield plants from external weather conditions and regulate the internal climate of the cultivation area. This enables the manipulation, control, and monitoring of environmental factors to achieve enhanced and consistent yields and quality throughout the entire year of production [1,2]. Furthermore, crop yields and quality of conventional cultivation vary substantially due to seasonality, weather extremes, pests, and diseases, particularly soil-borne diseases, and cultivating most crops throughout the year is only possible in certain areas. In addition, controlled environment systems can overcome the problem of decreasing agricultural land and optimize an area’s utilization. This is because environmentally controlled structures can be installed in a wide range of facilities and sizes, including high tunnels, greenhouses, growth chambers, warehouses, abandoned buildings, etc. [3,4,5]. The controlled environment crop production system mainly utilizes soilless cultivation techniques, saving up to 70–95% of the water used in conventional farming [5,6,7]. In addition, it can also optimize the use of nutrients. Therefore, the controlled environment agricultural practices that integrate science- and engineering-based approaches can increase productivity and optimize resource use [8]. The soilless systems are also suitable for vertical farming, particularly in urban areas. This is due to their long-term resource efficiency and low weight [9]. According to Gruda [10] and Hong et al. [11], soilless systems are used to develop new crops and enhance biochemicals in herbs and aromatic plants. As a result, the demand for soilless agriculture systems is growing globally, and innovative research is required to overcome constraints and keep providing chances for this industry [12].
Soilless culture is a growing medium that replaces soil where the nutrients needed by plants are supplied through irrigation water [13]. Soilless culture is ideal for this system as water culture or hydroponics such as floating hydroponics, aeroponics, deep-water culture, and nutrient film technique. Other than hydroponics, the soilless culture widely uses organic (sawdust, peat, coconut coir, bark, straw, rice hull, etc.) and inorganic substrate (pebbles, sand, perlite, gravel, rock wool, vermiculite, etc.) [13,14,15]. The soilless substrate is widely used in soilless cultivation because, in addition to saving water, substrates also retain nutrient solution reserves, buffering water and nutrient supply disruptions and protecting roots from temperature fluctuations [13]. In addition, good qualities of the soilless substrate are good aeration and drainage, good water holding capacity and being easily wetted, lasting long in the pot and resisting decomposition, and good cation exchange capacity (CEC) and pH [16]. Clay mineral aggregate, also known as expanded clay aggregate, is widely used in soilless agriculture because it meets the characteristics of a good quality substrate with a neutral pH of 7.0 and has a long lifespan due to its reusability [13,16]. Therefore, it not only meets the ideal characteristics of the substrate but is also more practical and cost-effective.
Various crops, such as herbs, leafy vegetables, flowers, strawberries (Fragaria x ananassa), tomatoes (Solanum lycopersicum), cucumbers (Cucumis sativus), and peppers (Capsicum annuum) can be grown in a controlled condition utilizing a soilless crop system [17]. However, various other crops are suitable and have the potential to be grown in a controlled condition utilizing a soilless culture, including soybean. Soybean is an essential crop because it is a high protein crop whose chemical composition consists of protein (38%), carbohydrate (27%), oil (19%), water (12%), and ashes (4%) [18]. Soybeans are an essential source of food for humans as well as animals [19,20,21]. Therefore, soybean is widely used in food products such as tofu, soy milk, soy source, fermented bean paste, tempeh, and animal feed. Soybean cultivation in a soilless culture system is being investigated because soybeans not only can use nitrogen from biological nitrogen fixation and reduce the requirement for mineral fertilizer, but can also improve the production of necessary amino acids and functional ingredients, including minerals as well as vitamins when planted in a controlled environment [22]. Soybean is also one of the candidate crops for cultivation in bioregenerative life-support systems (BLSS) for space missions [23]. Therefore, the study of soybeans in a controlled environment using soilless culture is essential to be carried out, especially for specific varieties, so that the findings obtained can be used as a guide and as a source of reference.
An essential factor that needs to be emphasized in the planting system in a controlled environment besides light, temperature, CO2, and water is the need for nutrients. In a soilless cultivation system, all essential plant nutrients should be supplied via the nutrient solution, where inorganic fertilizers are used as nutrient sources [9,24]. According to Savvas [25], due to the substrate’s limited capacity as a buffer and a limited supply of nutrients, it is necessary to continuously supply the essential elements, including micronutrients. The nutrient solution can be formulated with a mixture of several fertilizer sources or using fertilizers that were formulated and are commercially available in the market, such as ‘Advance Hydroponics of Holland (Dutch Formula)’. This hydroponics fertilizer was developed in 1993 in the Netherlands and consisted of three-part mineral fertilizers (Grow, Bloom, and Micro) [26].
The precise amount of the nutrient solution differs depending on the crop, variety, stage of plant growth, conditions of the environment, and irrigation system. The fertilizer used in the soilless cultivation system should have balanced nutrients with no precipitates [27]. The guide for fertilizers developed for field cultivation can be used for planting soybeans in soilless culture. Total nutrients absorbed by the soybean plant for field planting per metric tonne of production of grains is 146 kg nitrogen (N), 25 kg phosphorus pentoxide (P2O5), 53 kg potassium oxide (K2O), 22 kg magnesium oxide (MgO), 28 kg calcium oxide (CaO), 5 kg sulfur (S), 476 kg iron (Fe), 104 kg zinc (Zn), 123 kg manganese (Mn), 41 kg copper (Cu), 55 kg boron (B), and 13 kg molybdenum (Mo) [28]. For soilless crop production, Wheeler et al., 2008 [29] used a nutrient solution containing substances such as 7.5 mM N, 0.5 mM phosphorus (P), 3.0 mM potassium (K), 2.5 mM calcium (Ca), 1.0 mM S, 1.0 mM magnesium (Mg), 60 μM Fe, 7.4 μM Mn, 1.04 μM Cu, 0.96 μM Zn, 7.13 μM B, and 0.01 μM Mo in his study on the performance of wheat, potato, tomato, lettuce, and soybean (var. McCall and Hoyt) that were carried out in a biomass production chamber using one of the soilless system methods namely the nutrient film technique. The pH was controlled to 5.8, adding 0.4 mM nitric acid and EC to 1.2 dS m−1. Another study on soybean varieties McCall and Hoyt in a controlled environment using soilless substrate peat: perlite at a ratio of 1:1 and nutrient solution containing substances such as 1.0 mM calcium nitrate [Ca(NO3)2], 5 mM potassium nitate (KNO3), 0.75 mM magnesium sulfate (MgSO4), 1.5 μM ferric nitrate [Fe(NO3)3], 5 μM ferric-hydroxyethylenediaminetriacetic acid (Fe-HEDTA), 9 μM manganese dichloride (MnCl2), 2 μM zinc sulfate (ZnSO4), 40 μM boric acid (H3BO3), 0.6 μM copper sulfate (CuSO4), and 0.06 μM sodium molybdate (Na2MoO4) [30]. According to Basal et al., 2020 [31], who studied the effect of water stress using polyethylene glycol (PEG) to control the water level on the growth of soybean variety ES Mentor and Pedro, used a nutrient solution containing substances such as 0.7 mM potassium sulfate (K2SO4), 0.1 mM KCl, 2.0 mM Ca(NO3)2, 0.5 mM MgSO4, 0.1 mM potassium dihydrogen phosphate (KH2PO4), 10 μM H3BO3, 0.5 μM manganese sulfate (MnSO4), 0.5 μM ZnSO4, 0.2 μM CuSO4, and 10−4 M Fe-EDTA. These three studies use nutrient solutions with varying concentrations because the soilless culture type and variety are different. Thus, the study of nutrient concentration for specific varieties, such as the Martina and Johanna varieties, is essential so that the nutrients supplied are according to the needs of the variety. There is still no research on the requirements and effects of nutrients for the two varieties using soilless culture systems in a controlled environment.
Some essential things that must be emphasized in managing nutrient solutions for soilless cultivation systems are pH and electrical conductivity (EC). The proper pH value of the nutrient solution for plant growth is between 5.5 and 6.5 [32]. Meanwhile, EC is a salt level index that measures the quantity of salts in a solution and can be utilized for estimating nutrient solution osmotic pressure. As a result, the EC of the nutrient solution can be used as an indicator to determine the quantity of available ions in the root area of the plant [33]. The optimum EC varies according to crop and environmental conditions. However, the EC standards for soilless culture or hydroponics systems range between 1.5 and 2.5 ds/m [34]. Higher EC reduces the absorption of nutrients by increasing the pressure of osmosis, while lower EC could be detrimental to the health and productivity of the plant [35]. Therefore, optimal pH and EC values are essential in ensuring that the nutrient solution is in a proper condition to be supplied to the plant.
Thus, the study of a nutrient solution, including nutrient concentration for soybean plants with certain varieties, is essential to implement. Therefore, an investigation was conducted to study the influence of different nutrient concentrations on shoot and root growth, yield components, yield, and the chemical composition of two soybean varieties grown in a controlled environment using a soilless substrate. The influence of nutrient concentration on the soybean varieties varied. However, the study hypothesis was accepted, which predicts that the growth, yield, and protein composition of soybean varieties will increase with increasing nutrient concentrations up to a certain level. The findings from this research can be used as a guideline for developing high-yielding, high-quality, and pesticide-free soybean production technologies.

2. Materials and Methods

2.1. Experimental Setup

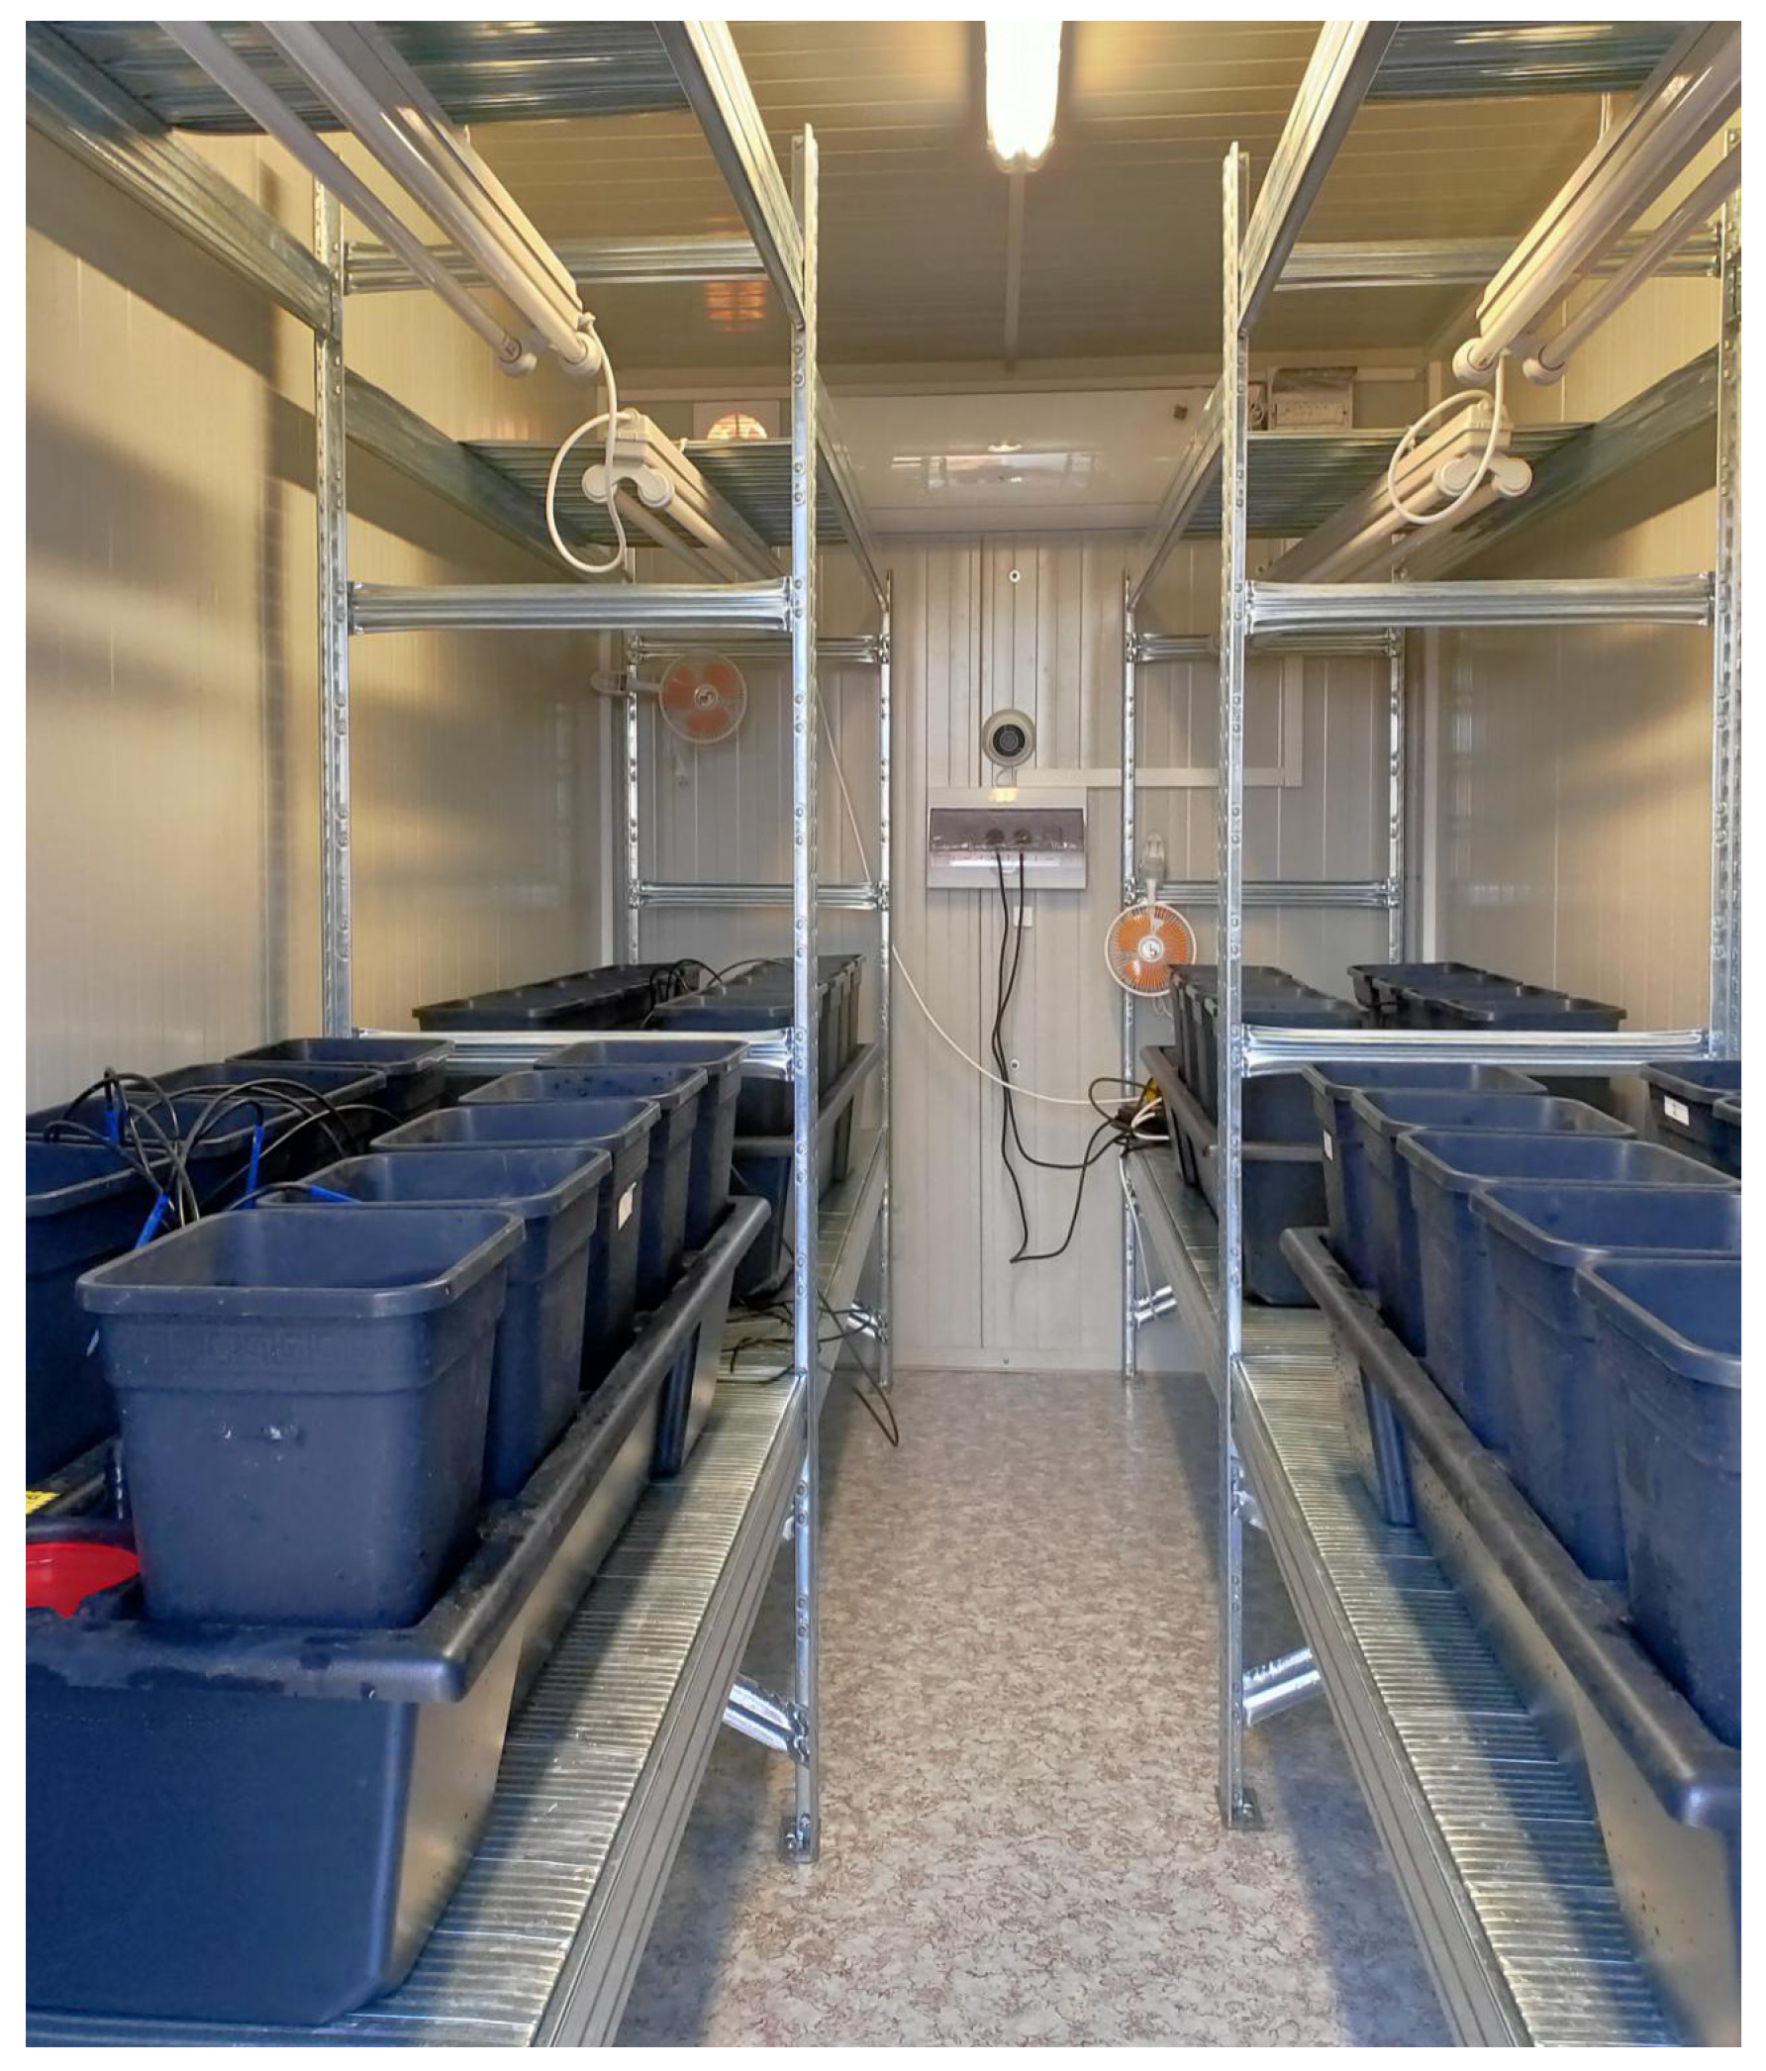
The research was conducted in a 7.2 m2 controlled environment growth chamber at the research field, Institute of Agronomy, the Hungarian University of Agriculture and Life Sciences (MATE), Gödöllő, Hungary, which is located at 47°46′ N, 19°21′ E, and 242 m above sea level. The chamber is equipped with planting tools, including pots with a capacity of 10 L and dimension of 19 cm in diameter by 22 cm in height, 117 cm × 60 cm fertilizer solution tanks, 1000 L/h water pumps (Newa Maxi IP68, Loreggia, PD, Italy; 220–240 V, 13 W), drip irrigation system, and timer. A total of 24 pots were placed on top of 4 nutrient solution tanks, where 6 pots were placed for each tank. Each tank was installed with a water pump that pumps the fertilizer solution in the tank through a drip irrigation system to each pot controlled by a timer. The arrangement of some equipment in this planting system is shown in Figure 1.
In order to optimize the growing conditions for soybean growth, the chamber was installed with air conditioning to control the temperature, fluorescent lamps to supply enough light, fans for a sound ventilation system, and an exhaust fan for airflow. The growth chamber’s temperature was 22 °C during the day and 16 °C at night. Each nutrient concentration treatment (main plot) had two fluorescent lamps installed, each 58 watts, with a combination of red and blue lights. The lamp was turned on automatically for 16 h at 950 Lux and turned off automatically for 8 h at night. The humidity percentage in the chamber was between 40 and 60%. Before planting, pots were filled with substrate culture as a growing medium, which used expanded clay aggregate. The research was carried out from January 2022 to November 2022.

2.2. Experimental Treatments and Design

This study examined four different nutrient concentrations and two different soybean varieties. There were four different nutrient concentration treatments: 0, 50, 100, and 150%. The control treatment was 0%, which means no nutrients were supplied to the soybean plants under this treatment. Meanwhile, Martina and Johanna were the two tested varieties. Martina and Johanna are early maturing varieties from Hungary, with standard maturation times of 138 days for Martina and 140 days for Johanna. The Martina variety has a standard plant height of 106 cm, and the Johanna variety has a standard plant height of 91 cm. Both varieties have mature-brown pods and yellow seeds. Martina has a standard thousand-grain weight of 187.1 g, and Johanna weights 193.4 g. The fertilizer used was ‘Advance Hydroponics of Holland (Dutch Formula)’ in liquid form, a commercial fertilizer. This fertilizer is suitable for hydroponics cultivation and consists of three different formulas, namely formula 1 (Grow), 2 (Bloom), and 3 (Micro). Table 1 indicates the nutrient content of each of the three formulas.
The use of fertilizer was in combination, and the rate was according to the growth stage of the soybean plant. Formula 1 was applied during the first vegetative stage (V1), the second vegetative stage (V2), the third vegetative stage (V3), the fourth vegetative stage (V4), the fifth vegetative stage (V5), and the flowering stage. The fertilizer formulations 2 and 3 were given at all stages of plant growth, including the end of the flowering stage. Identification of each of these stages is crucial, especially when deciding when to apply nutrients. According to Purcell et al. [36], the vegetative stages of soybean plants can be determined based on their leaves and nodes. When the unifoliated leaves are fully developed, the plant is at its V1 stage.
Meanwhile, when the plant has unifoliate leaves and two trifoliate leaves, the edges of the early developing trifoliate are not touching, indicating that the plant is in V2. The nodes above the unifoliate leaves and vegetative growth are identified from V2 to the highest node of the plant (Vn). If a minimum of 50% of the examined plants reached that stage, the whole field can be considered in that stage [37]. Each fertilizer formulation needs to be diluted with water, and in this study, as much as 25 L of water was used in each fertilizer tank. Therefore, the amount of fertilizer used based on 25 L of water and according to the plant growth stage and treatment is shown below (Table 2). The nutrient solutions started to be supplied to the plants for all treatments after 10 days of germination.
The experimental design for this study was a split plot with three replications. The nutrient concentration factor was a central plot, while the variety factor was a subplot. Figure 2 below shows the experimental layout for this study.

2.3. Planting and Crop Management

Soybean seeds of both varieties that have a growth rate of more than 90% were used in this study. A total of 8 seeds were sown directly into the pot by planting the seeds 3 cm deep into the growing medium. Six seedlings that were healthy and growing uniformly were retained in the pots, while the other 2 were uprooted and discarded after 10 days of planting.
For the first 10 days of planting, during the germination period, each pot was irrigated without nutrients thrice daily for 30 min each irrigation. Irrigation with fertilizer solution was then given according to the treatment and growth stage of the plant from the 11th day after planting. The fertilizer solution was automatically given thrice daily for 30 min per irrigation. The solution was manually replaced weekly by pumping it out of the tank and refilling it with a new fertilizer solution. The aim was to maintain the proper range for the EC and pH readings. The plants treated with different nutrient concentration treatments 60 days after planting are shown in Figure 3. Fallen leaves in and around the pot were collected and disposed of to prevent the growth of fungi that would damage the plant.

2.4. Harvesting and Sampling

Soybean plants are mature when the seeds, pods, and stem turn yellow. However, harvesting should be conducted when the soybean pods are completely dry and turn brown. In this study, plants were harvested at the age of 162 days after planting. After the pods were harvested, they were oven-dried for two days at 50 °C to reduce the moisture in the seeds and reach the appropriate moisture of less than 13%. This purpose was to prevent seed damage, mould, and insect attacks. After the pods were completely dried, the seeds were then removed from the pods and stored in a covered and dry area.
After all the pods were harvested, six pot plants were uprooted and separated into two parts: above ground (leaves and stem) and below ground (root). Both parts were then oven-dried at 50 °C for dried weight measurement for two days.

2.5. Data Collections

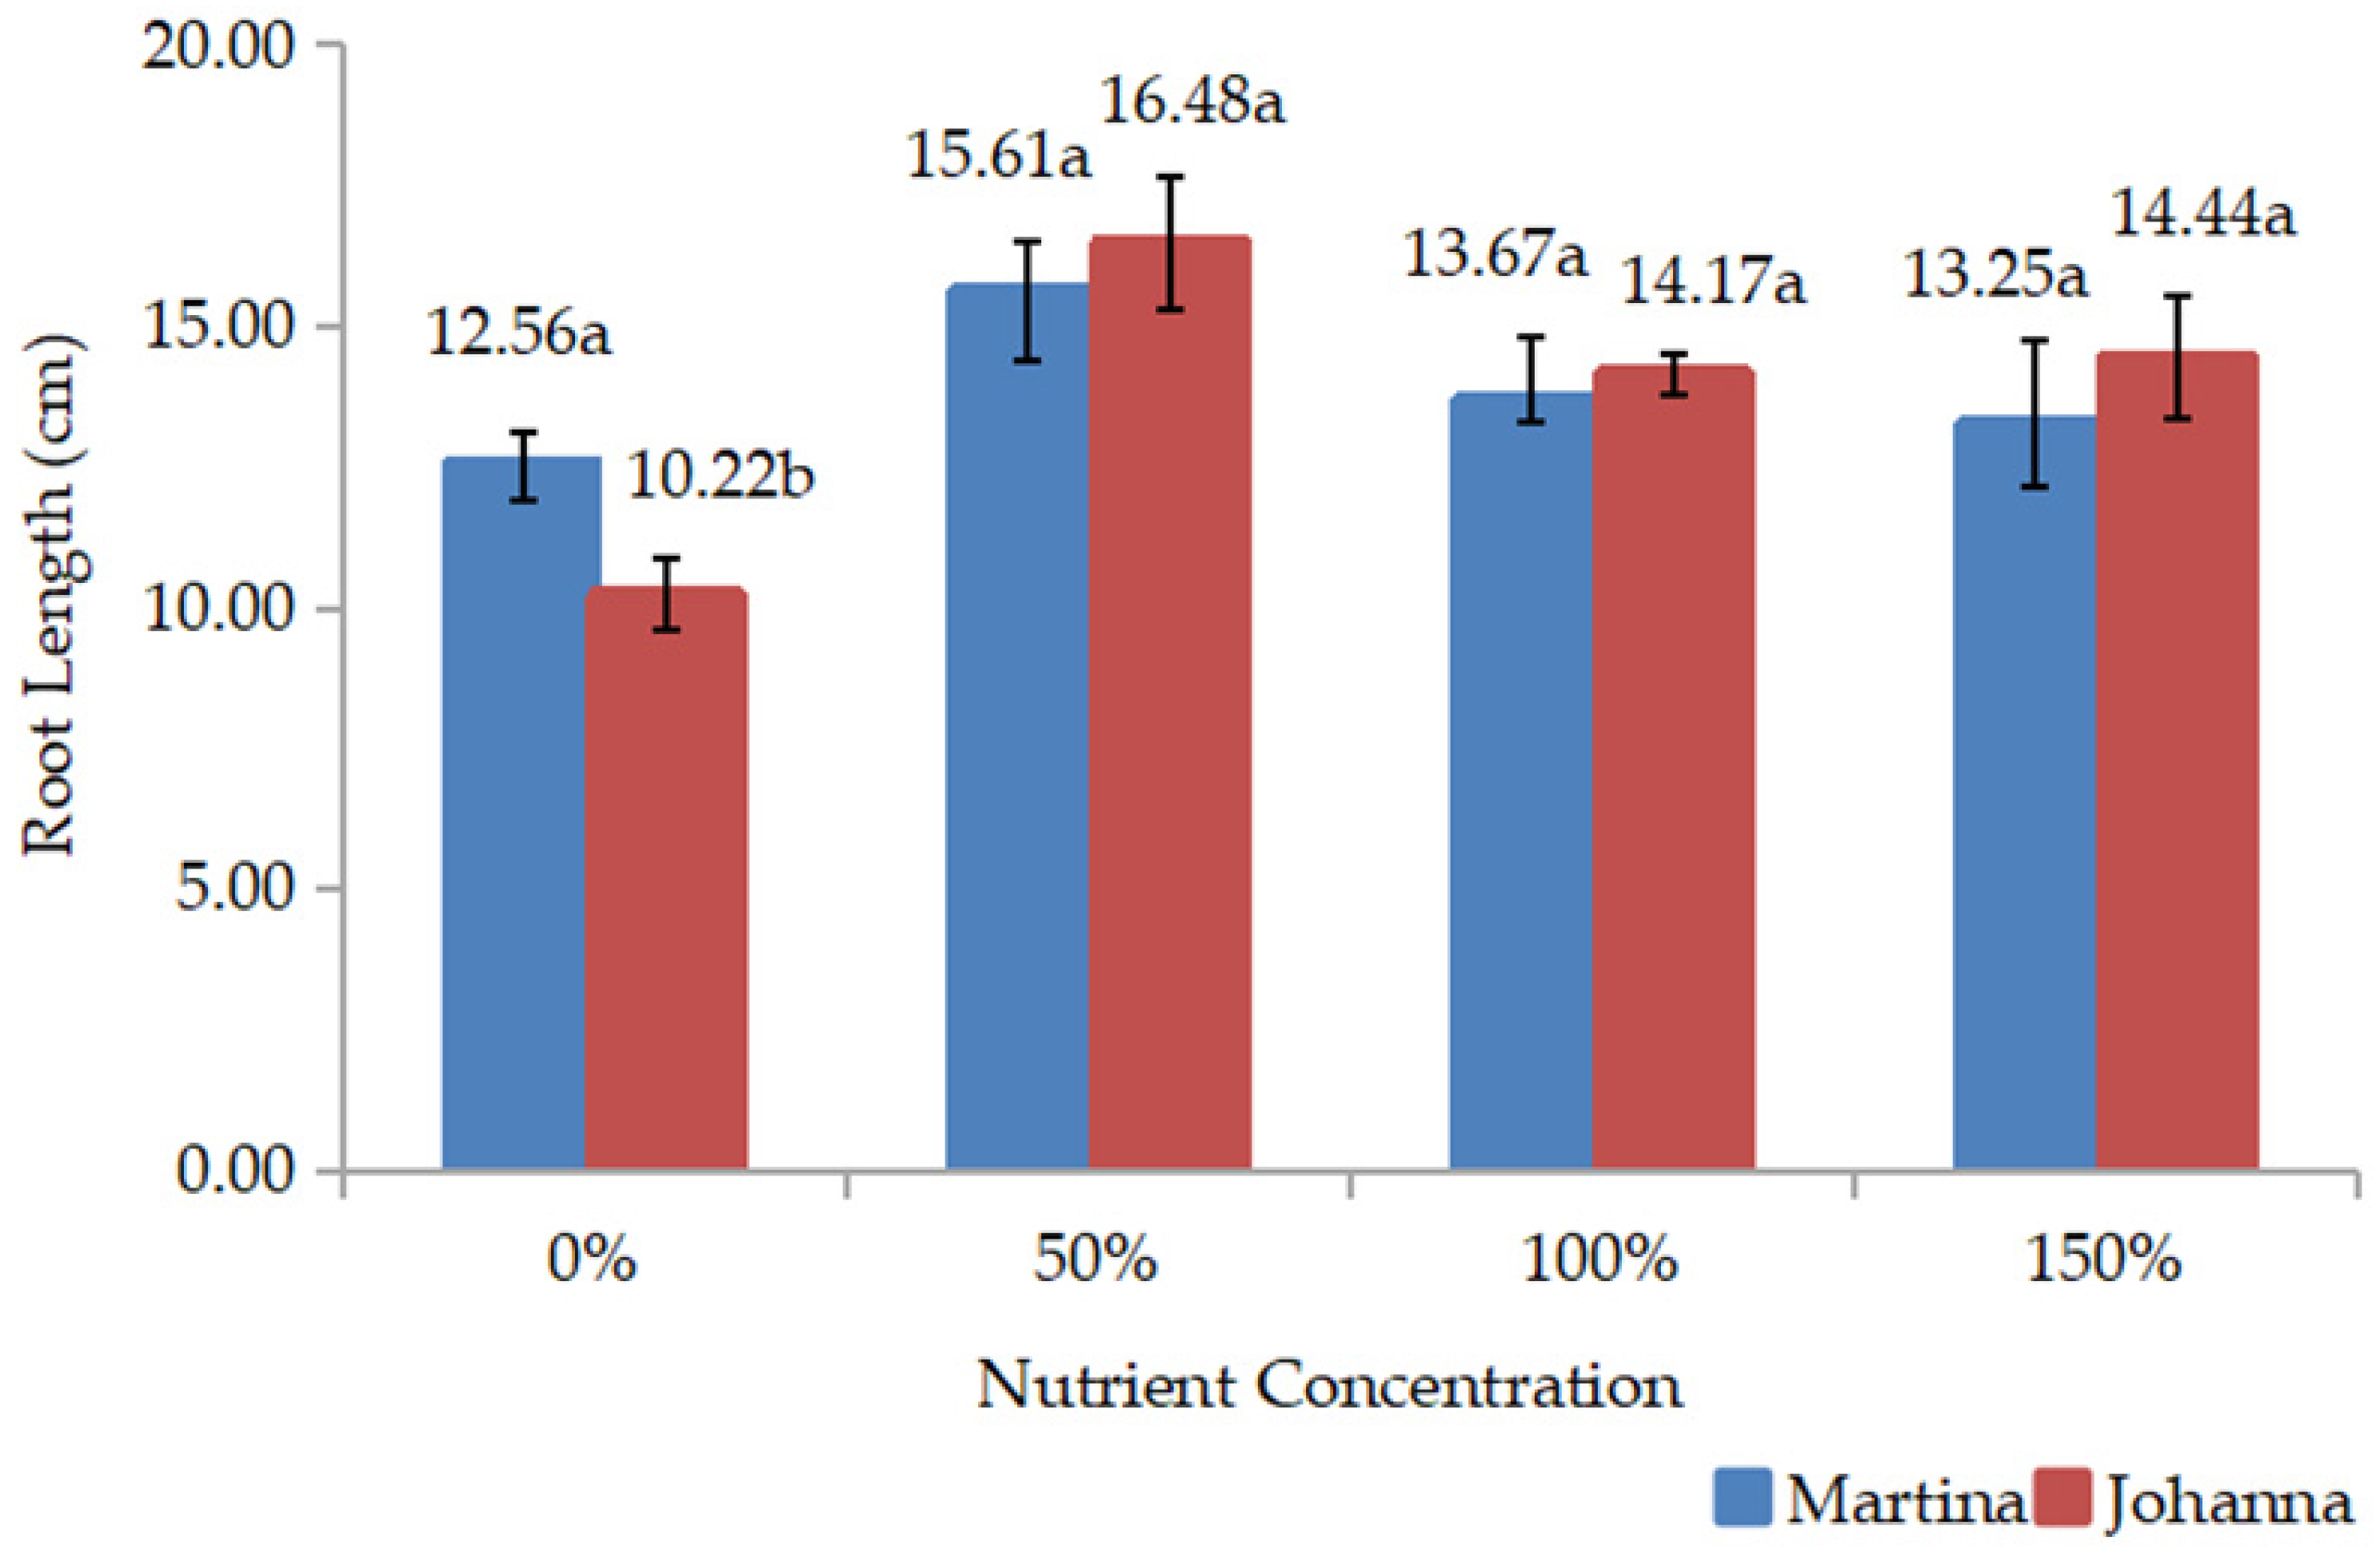
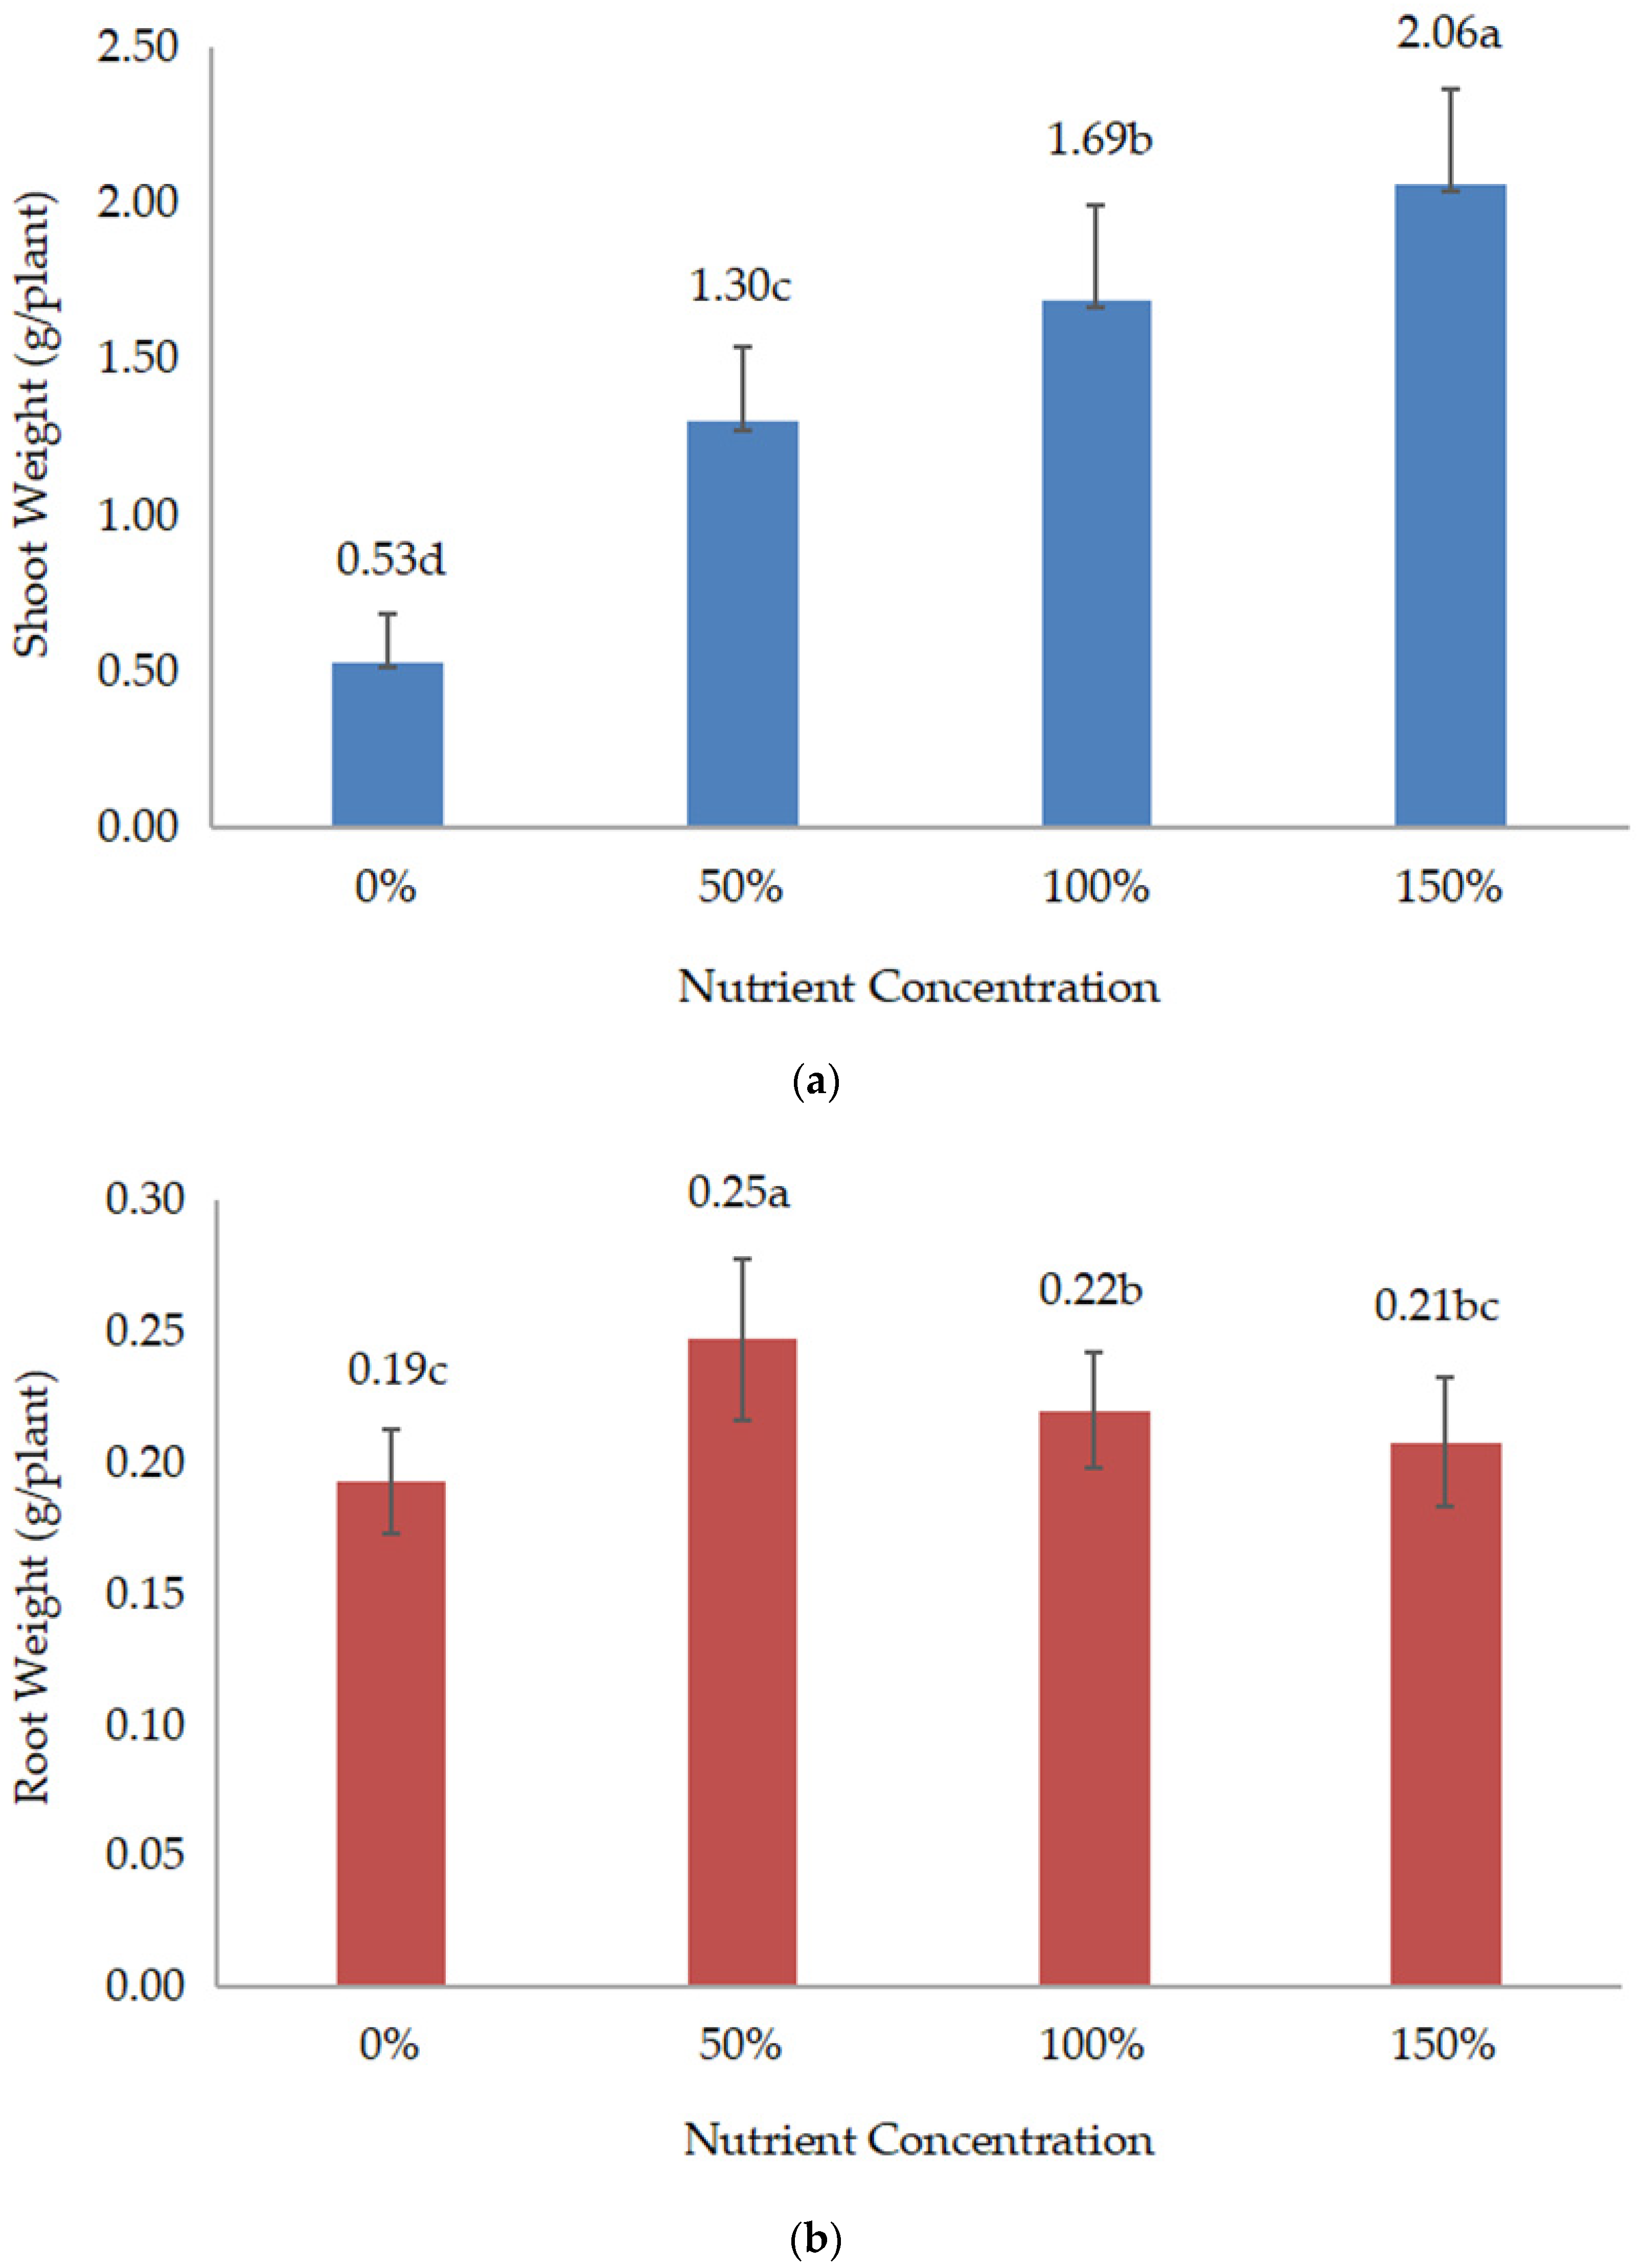
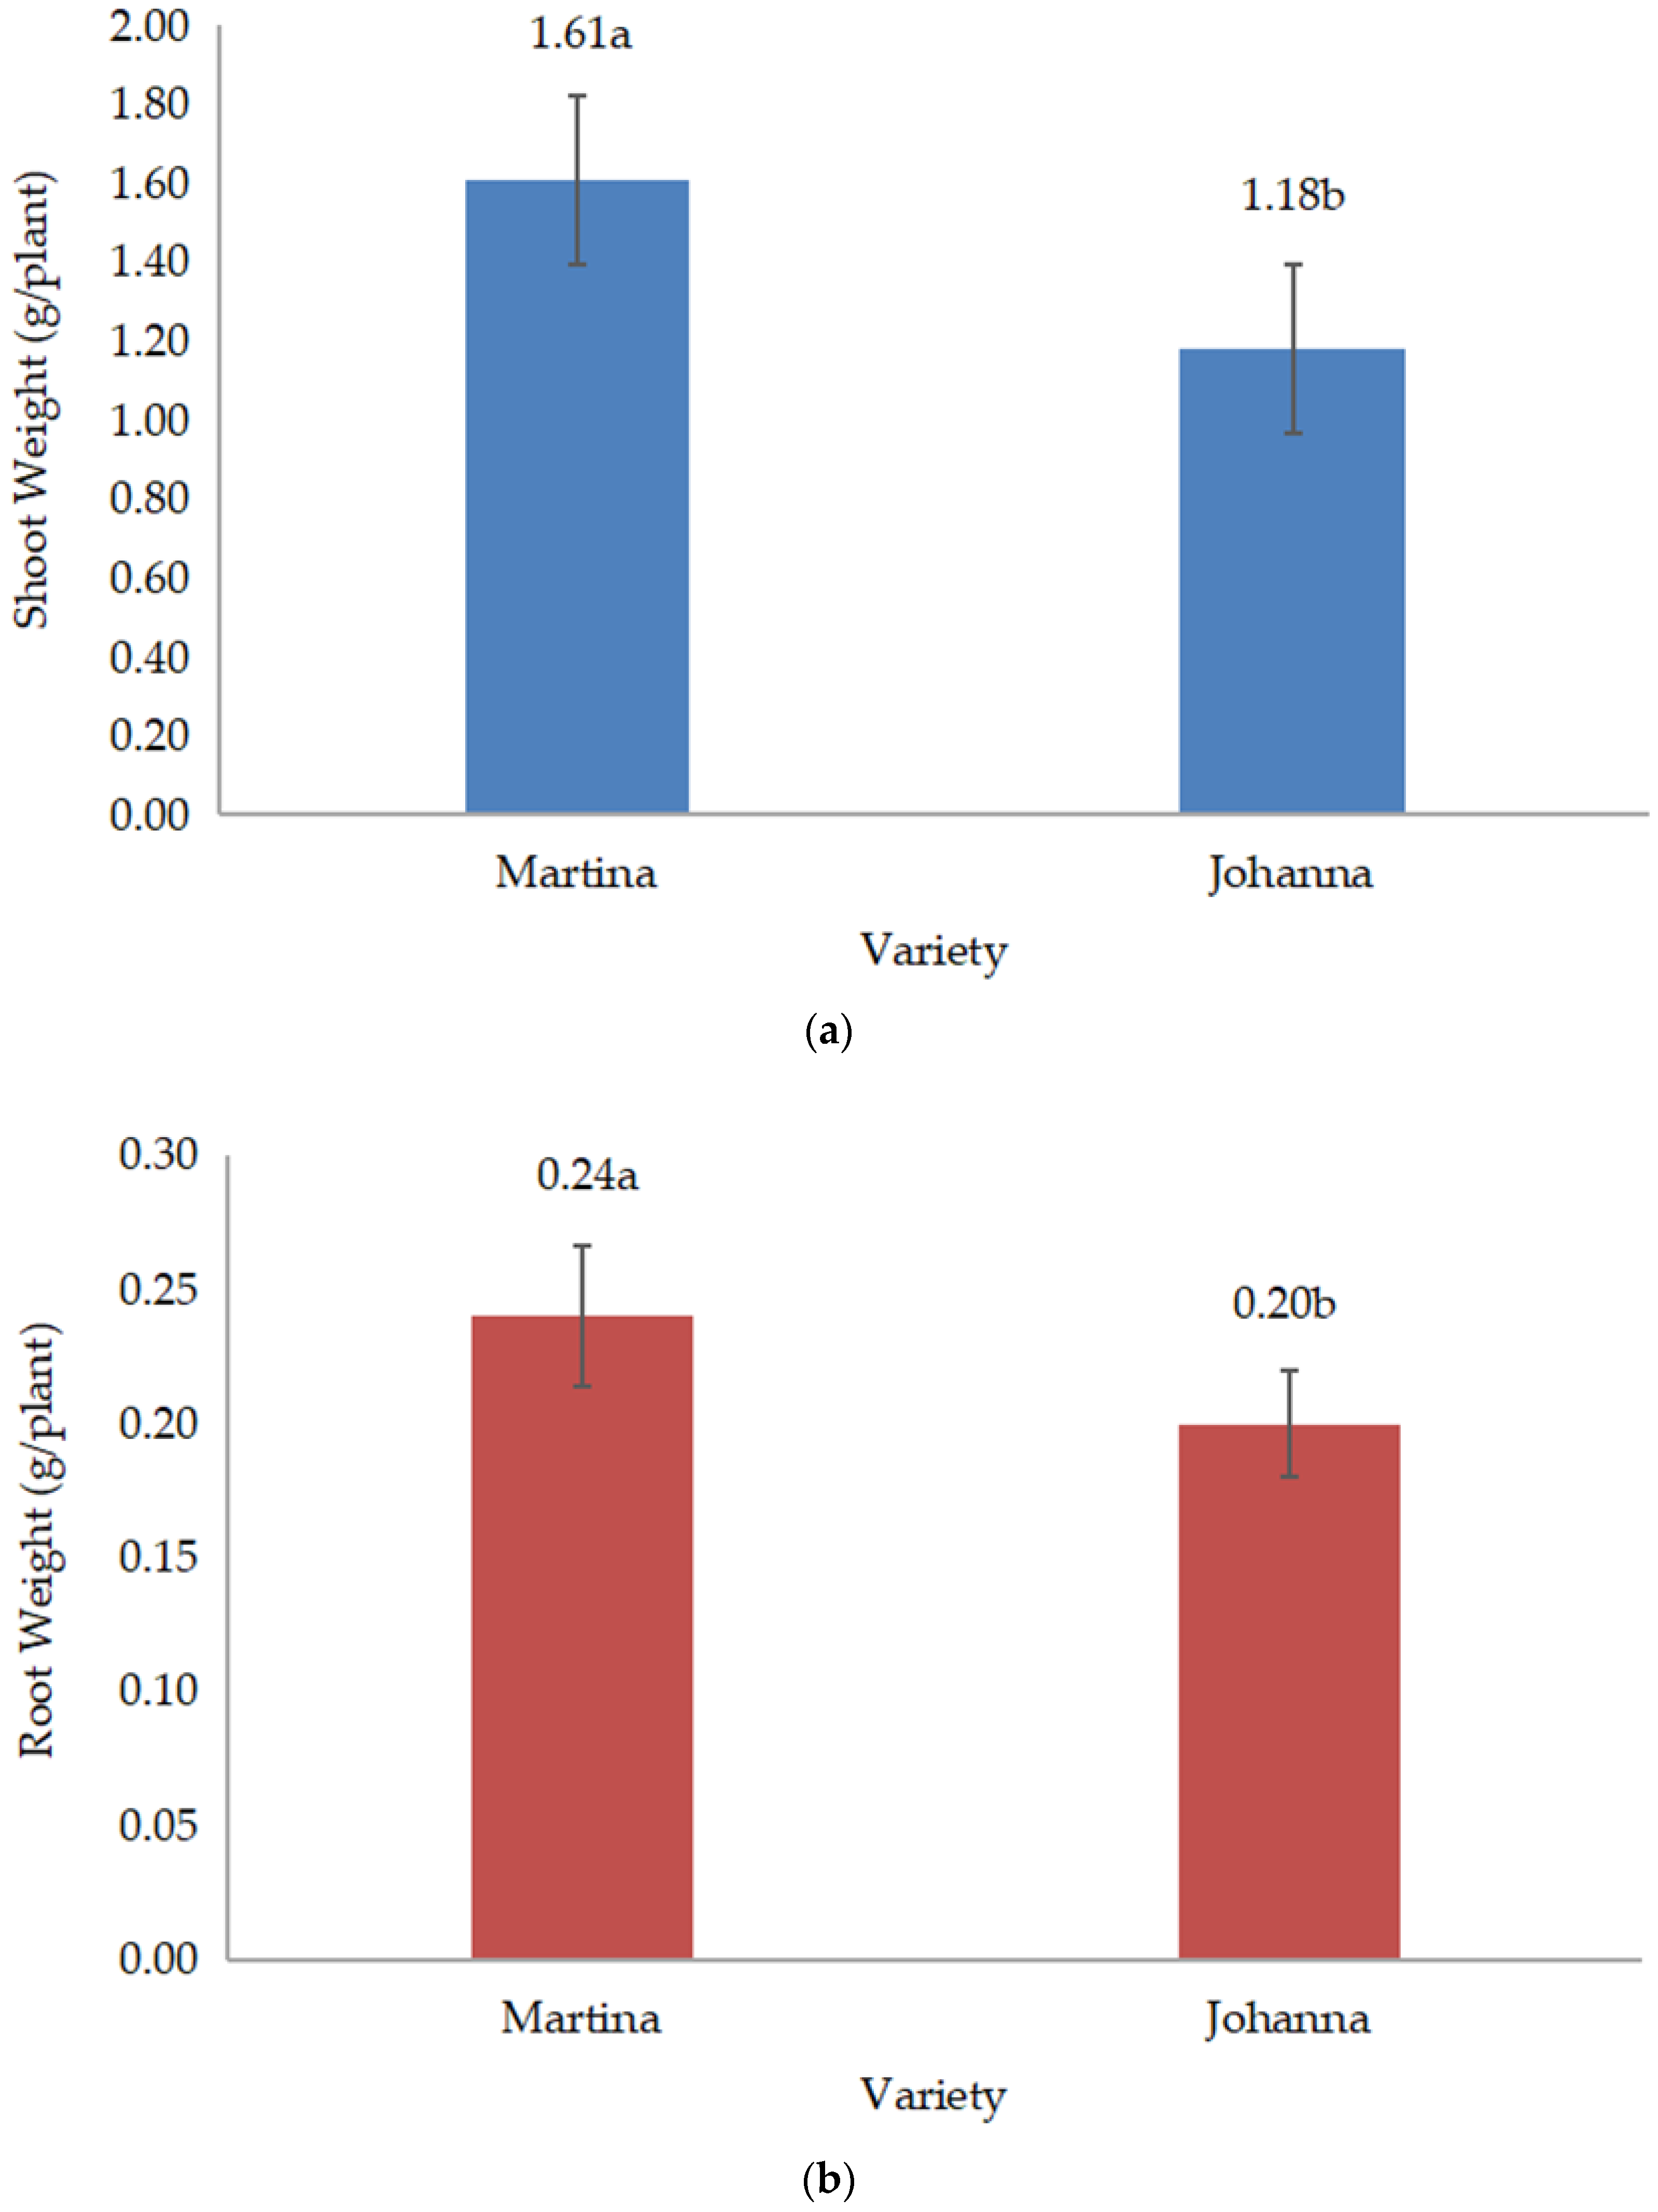
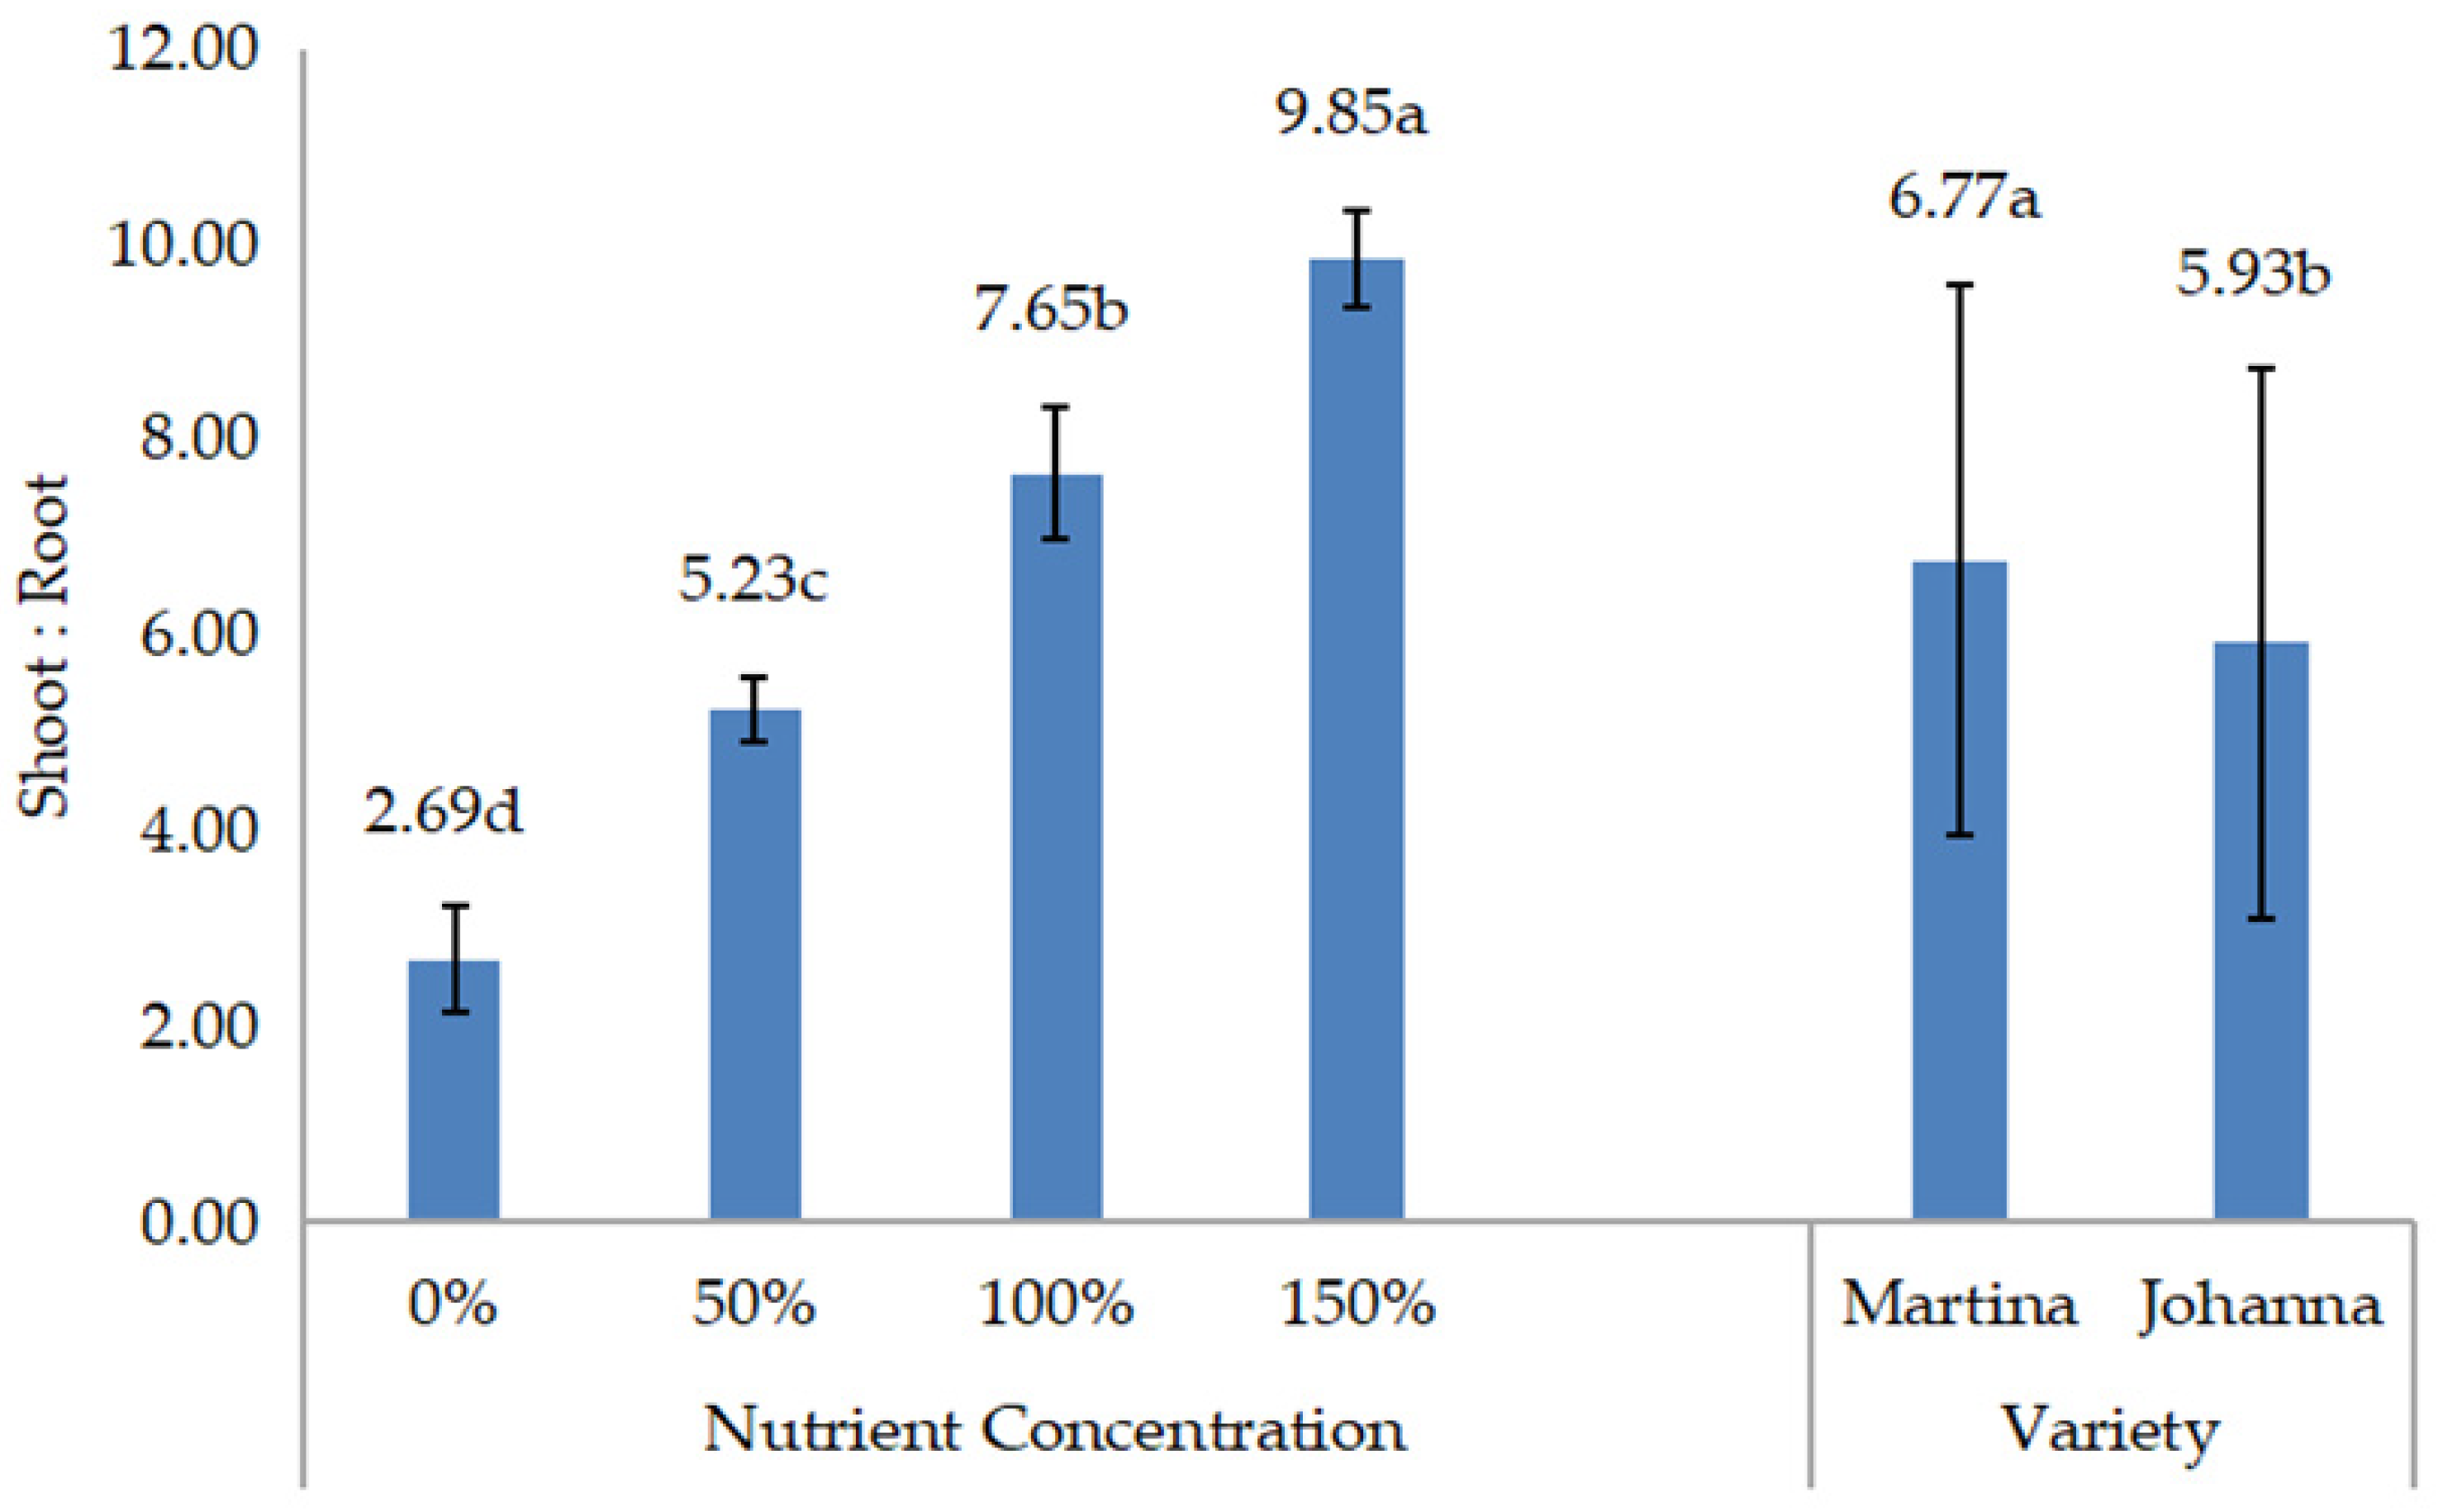
All data were collected during and after harvest. The collected data include root length, root weight, shoot weight, shoot:root, yield components, yield, and chemical composition. Root length or deep root was measured vertically, which was conducted during harvest. Meanwhile, shoot (above the ground) and root (below the ground) weights were measured by weighing the weight of both parts of the plant after drying. When the root and shoot weights were measured, the shoot:root ratio was calculated and recorded. Data on yield components, such as the number of pods/plants and the number of grains/pods, were recorded during harvesting.
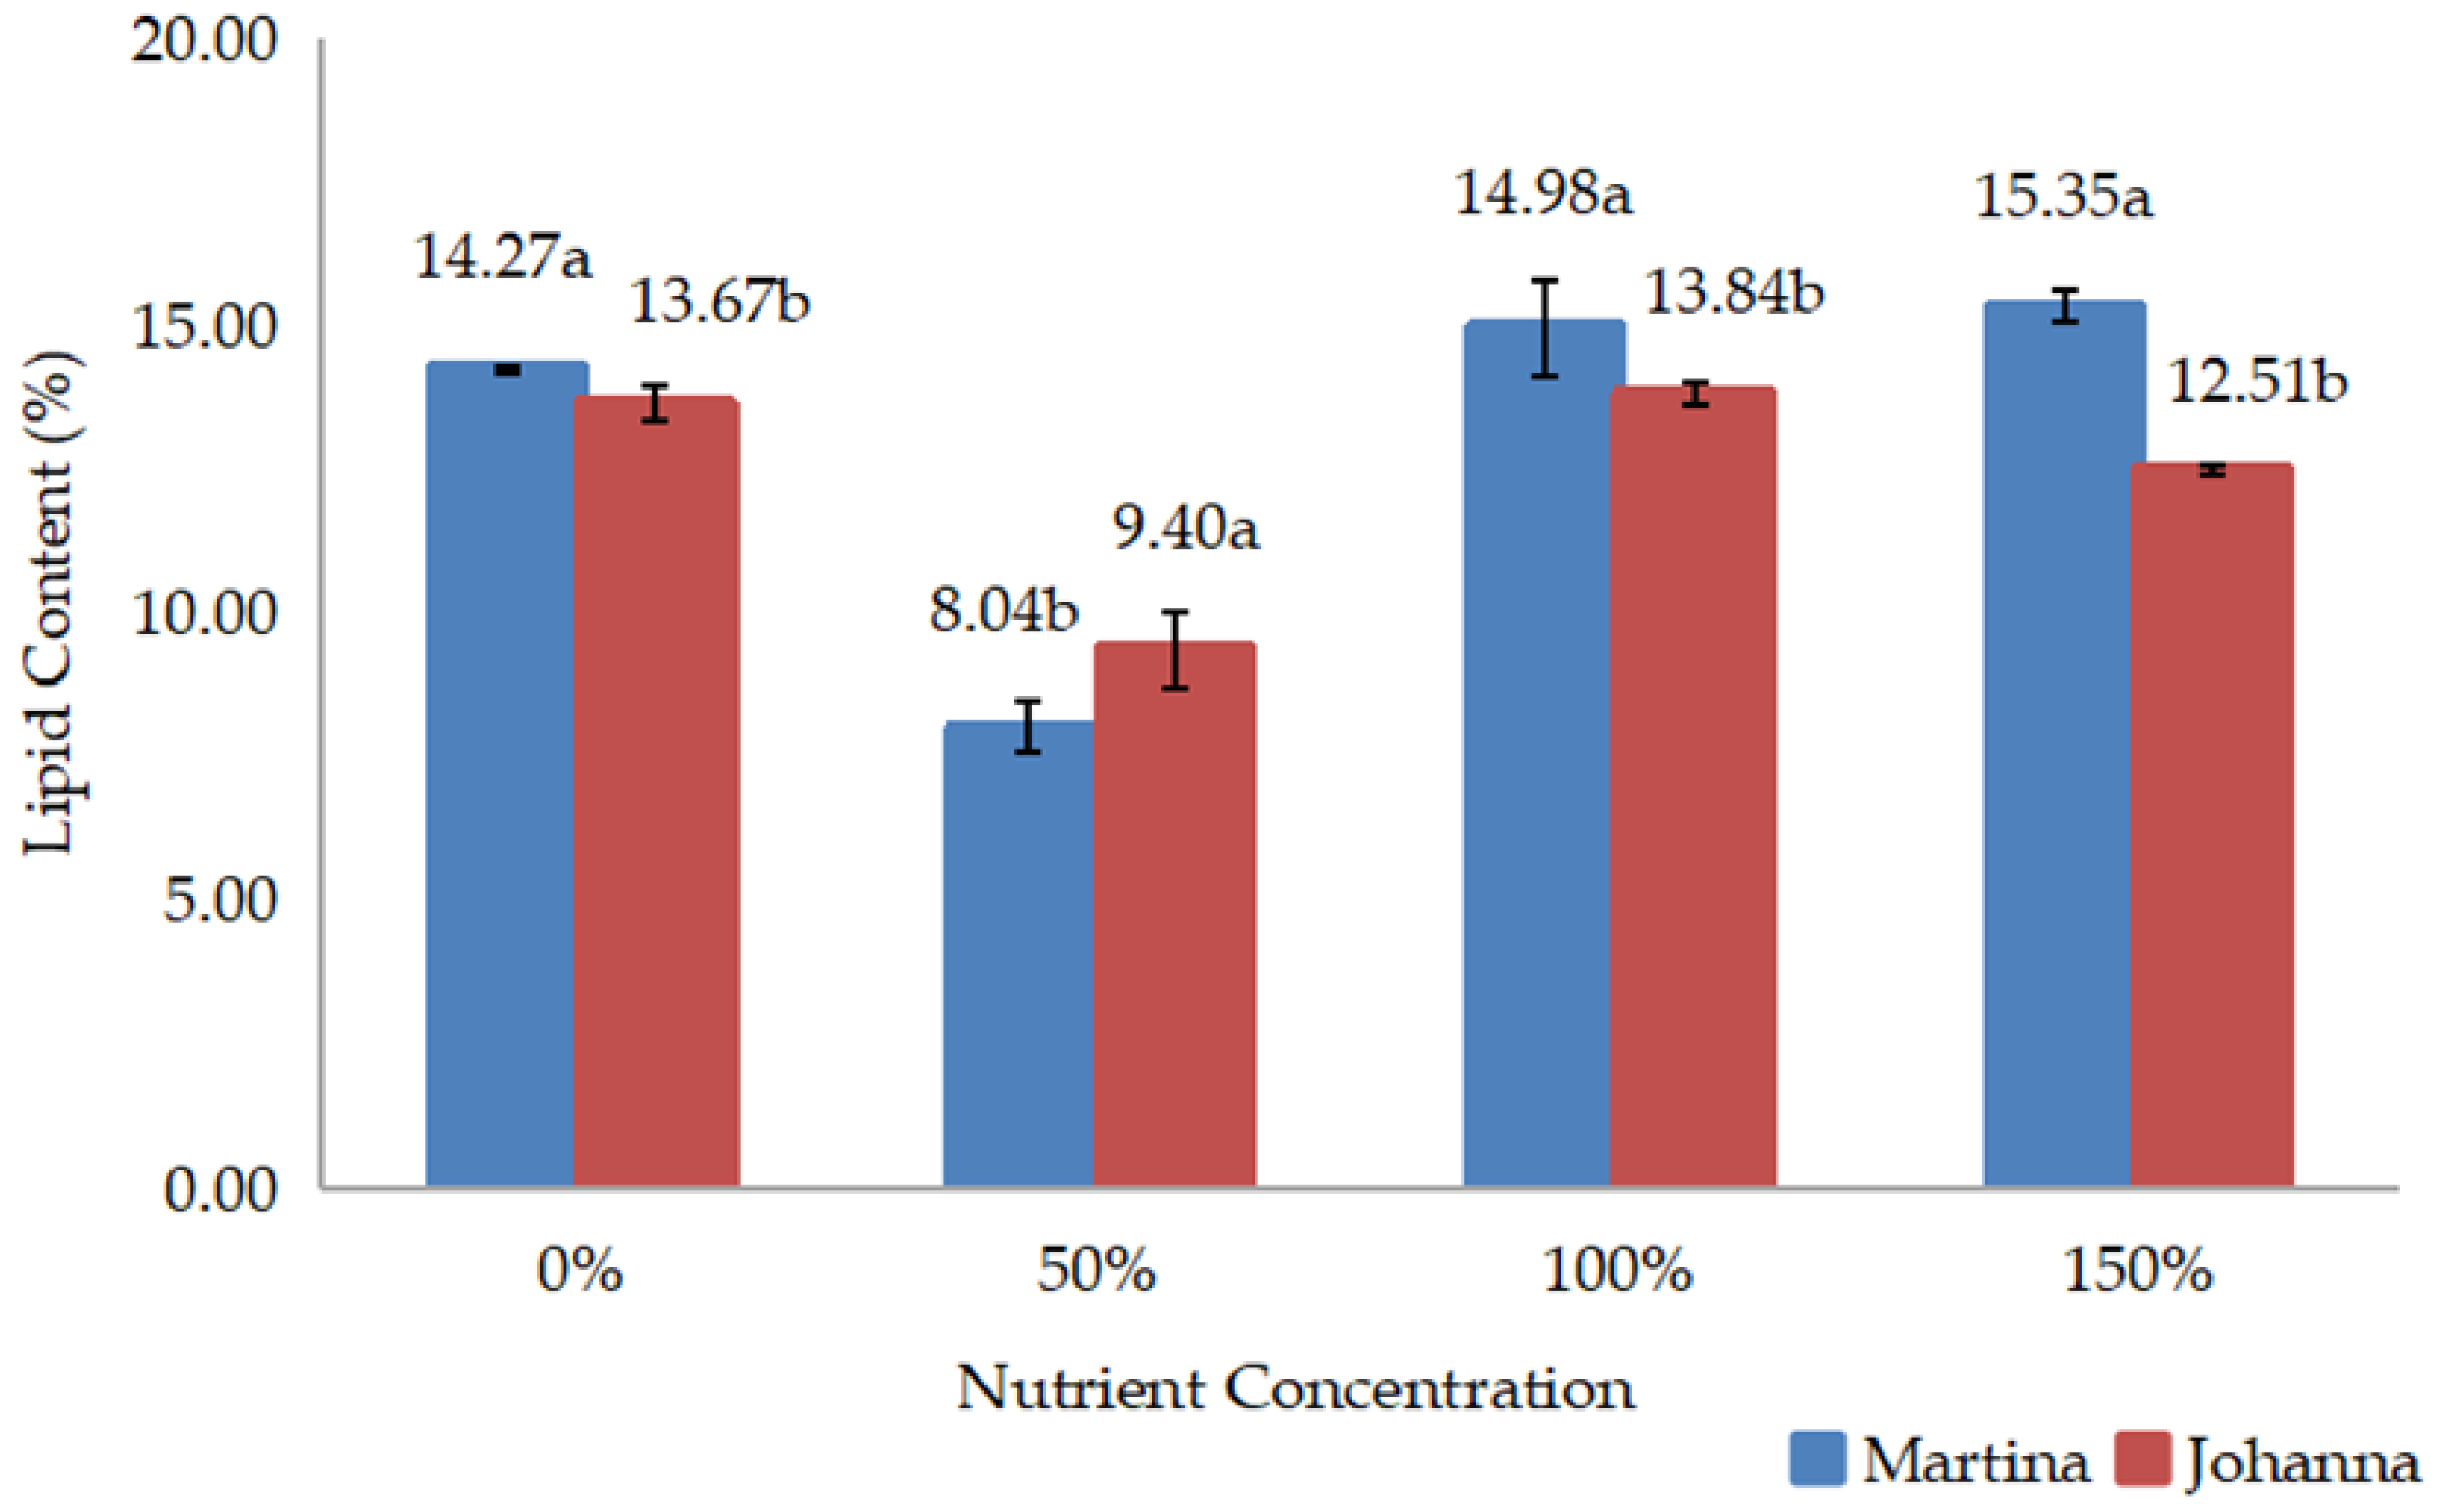
Meanwhile, yield data such as grain weight/pod, grain yield/pot, and 100-grain weight were recorded three days after harvest, when the pods were dried. The grains from each treatment were then grounded to measure chemical composition, including protein and lipid content. Protein and lipid content expressed as percentages were measured in the laboratory using a NIR Product Analyzer (INSTALAB 600, Auburn, IL, USA). The yields of protein and lipids were then calculated by multiplying their contents by grain yield.

2.6. Statistical Analysis

The reported results and data are presented as averages for the main effect of nutrient concentration, variety, and the interaction of the main effects. At the significance level of p = 0.05, a two-way analysis of variance (ANOVA) was carried out to compare the effects of nutrient concentration and variety on all recorded parameters. Post hoc comparisons were then performed using the least significant difference (LSD) test at p < 0.05. All the statistical analyses in this study used a 5% significance level. Meanwhile, the software of IBM SPSS V.23 (SPSS Inc., Chicago, IL, USA) was used to analyze the data.

3. Results

3.1. Root Length

Based on the analysis of variance (ANOVA) table in Table 3, nutrient concentration and variety of treatments have a significant interaction at p < 0.05 on root length. The Martina variety had deeper roots than the Johanna variety at 0% nutrient concentration, 12.56 cm, and 10.22 cm, respectively (Figure 4). On the other hand, at a nutrient concentration of 50%, the variety Johanna had deeper roots than Martina. The highest root length for both varieties, 16.48 cm for Johanna and 15.61 cm for Martina, were observed in this treatment. Similar results were obtained at 100% and 150% concentrations, where the Johanna variety had deeper roots than the Martina variety. However, the root length of both varieties increased as the nutrient concentration treatments increased from 0% to 50%. When the nutrient was increased to 100%, the root length of both varieties was shorter but not significant than the root length under the treatment of 150%.

3.2. Shoot Weight/Plant (g), Root Weight/Plant (g), and Shoot:Root Ratio

The analysis of variance (ANOVA) results on shoot weight and root weight, shown, respectively, in Table 4 and Table 5, reveal that the main effects of nutrient concentration and variety were significantly different (p < 0.05). However, the interaction effect between both factors was not significantly different. The result on shoot weight in Figure 5 shows that the lowest shoot weight was found when no nutrient (0%) was supplied to the plant. When the nutrient concentration was raised to 50%, 100%, and 150%, the shoot weight increased, with the highest shoot weight at 150% concentration. Different trends were shown by root weight when different nutrient concentrations were applied. Root weight was the highest under the nutrient concentration of 50% and significant (p < 0.05) compared to that of other nutrient concentrations (Figure 5). However, root weight under the 0% concentration was the lowest but not significantly different from the 150% treatment.
Meanwhile, the results on the shoot weight of the two tested varieties showed that the figures of the Martina variety were significantly higher than the Johanna variety at p < 0.05 (Figure 6a). As shown in Figure 6b, the Martina variety also has a significantly higher root weight (p < 0.05) compared to the Johanna variety.
Based on the ANOVA table in Table 6, the effect of different nutrient concentrations and varieties resulted in significant differences in the shoot:root ratio at p < 0.05. However, the interaction between the two factors was insignificant.
The shoot:root ratio increased as the nutrient concentration rose from 0% to 150%, of which the nutrient-free treatment (0%) had the lowest value. The plant with the nutrient concentration treatment of 150% was the highest, with the difference in shoot:root ratio with the 0% treatment being as much as 7.16 (Figure 7). Meanwhile, the Martina variety showed a higher and significant (p < 0.05) shoot:root ratio compared to the Johanna variety (Figure 7).

3.3. Number of Grains/Pods, Grain Weight/Pod (g), and Number of Pods/Plants

The results on the yield components, such as the number of grains/pods, grain weight/pod, and the number of pods/plants, showed that the nutrient and variety treatments significantly affected all three recorded parameters on the yield components (Table 7). Table 7 also shows an insignificant interaction between the nutrient concentration and variety of all three yield components.
Results on the number of grains/pods show that the soybean plant with the 0% nutrient treatment had the lowest number of grains/pods, which was only one grain per pod, and it was very significant compared to the other nutrient concentration treatments. The other nutrient concentration treatments, 50%, 100%, and 150%, have two grains per pod (Table 7). As for the Johanna and Martina varieties, the number of grains of both varieties was insignificant and had two grains per pod (Table 7).
The results for grain weight/pod showed that the soybean with a 150% nutrient concentration treatment had the highest grain weight/pod, followed by the 100% treatment (Table 7). However, the two treatments were not significantly different from one another. Meanwhile, soybean grown without nutrient treatment (0%) was the lowest grain weight/pod followed by treatment of 50%, but both treatments were insignificant, with the treatment of 100% and 150%. At the same time, the grain weights/pods under the 100% and 150% treatments were not significantly different. According to variety treatment, no significant difference was observed between Martina and Johanna’s grain weight/pod, where the average grain weight/pod of the two varieties was 0.271 g (Table 7).
The other parameter of the yield components was the number of pods/plants. The result shows that the number of pods/plants for soybean with 150% nutrient concentration was the highest, followed by 100%, 50%, and 0% (Table 7). All the treatments were significant at p < 0.05. Based on Table 7, the two tested varieties significantly differed in several pods/plants’ indicators. It revealed that the Johanna variety had more pods/plants with one pod difference than the Martina variety.

3.4. Grain Yield

The other finding was the grain yield/pot (g). Records were taken from six soybean plants per pot. According to the ANOVA table in Table 8, only the nutrient concentration treatment significantly differed in grain yield/pot. Different varieties were insignificant, and even the interaction of the two factors was not significant.
Grain yield/pot for soybean with 0% treatment was the lowest and increased in plants with 50% nutrient concentration (Figure 8). Grain yield continued to increase when 100% nutrient concentration was given and increased again when the nutrient was applied at 150%. From the 0% treatment up to 150%, the increase in yield was as much as 26.73 g. All the nutrient concentration treatments were significant at p < 0.05 on grain yield. For the variety treatments, both the Martina and Johanna varieties gave comparable grain yield/pot results and were not significantly different. The difference in total yield between the Martina and Johanna varieties was only 0.69 g (Figure 8).

3.5. 100-Grain Weight

In contrast to the results for 100-grain weight (g), according to the ANOVA table in Table 9, the nutrient concentration and variety factors significantly affect 100-grain weight. However, the interaction between nutrient concentration and variety still did not show significant differences.
Based on Figure 9, plants treated with a nutrient concentration of 0% still have the lowest results, including 100-grain weight, and were significant with other nutrient concentration treatments. The weight of 100 grains increased under the 50% nutrient concentration treatment and continued to increase significantly when 100% nutrient concentration was applied. Treatment with 100% concentration gave the highest value of 100-grain weight, but it was not significant with 100-grain weight at 150% treatment. The difference in weight between 100% and 150% treatments was only 0.08 g. The results of the different varieties reveal that the weight of 100 grains of the Johanna variety was significantly higher than that of the Martina variety. The difference was 1.33 g.

3.6. Protein Content and Lipid Content

The chemical composition of soybeans, such as protein content (%), revealed that both tested factors significantly affected the protein content of soybeans grown on a soilless substrate under this controlled condition. The ANOVA table below (Table 10) shows the obtained result. Furthermore, according to Table 10, both factors significantly influenced protein content.
The results of the interaction effects are to be discussed because nutrient concentration and variety showed a significant impact. According to the interaction effect in Figure 10, the Johanna variety has greater protein content than the Martina variety at each tested nutrient concentration. At a nutrient concentration of 50%, both varieties gave the highest protein content, 46.59% (Johanna) and 46.15% (Martina), respectively. However, the protein content of both varieties decreased by 3.49% (Johanna) and 3.70% (Martina) when nutrient concentration was supplied at 100%. At a nutrient concentration of 150%, the protein content of the Johanna variety was greater by 1.81% compared with the protein content at 100% treatment. However, the protein content of the Martina variety under the 150% nutrient concentration was almost the same as that of the 100% treatment, which had 42.47% and 42.45% protein content, respectively.
The study’s results on lipid content also show that all main factors and interaction effects were significant, as shown in the ANOVA table in Table 11. In the treatment without nutrients (0%), the variety of Martina had a greater lipid content than Johanna’s variety. The percentages of the lipid content, respectively, were 14.27% and 13.67% for Martina and Johanna (Figure 11). However, the lipid content at the 50% nutrient concentration treatment for both varieties was similar to that of the 0% treatment but had the lowest value compared to other treatments. The lipid content under the 50% nutrient was 8.04% (Martina) and 9.40% (Johanna). At 100% nutrient concentration, the lipid content increased again and was higher than the 50% nutrient treatment, but the variety Martina (14.98%) was higher than Johanna (13.84%). The lipid content in the Martina variety’s 150% nutrient concentration treatment continued to increase slightly from the 100% treatment, which was 14.98%. However, the lipid content of the Johanna variety slightly decreased in the 150% nutrient treatment, which was 12.51%.

3.7. Protein Yield (g) and Lipid Yield (g)

Only the main factor of nutrient concentration was significantly different at p < 0.05 on both protein yield/pot (Table 12) and lipid yield/pot (Table 13). Protein yield/pot increased as the concentration of nutrients increased from 0% to 150% (Figure 12). The percentage of increase in protein yield from 0% to 150% was as much as 87%. All the treatments of 0%, 50%, 100%, and 150% showed a significant effect at p < 0.05. Meanwhile, the results for lipid yield also show an increasing trend from 0% to 150% (Figure 12). However, the lipid yield of soybeans treated with 0% and 50% did not significantly differ.
Both tested soybean varieties had almost similar protein and lipid yields and did not differ significantly (p < 0.05) (Figure 12). The Johanna variety was only 7% higher in protein yield than the Martina variety. The variety of Martina produced a lipid yield of 6.9% higher than the Johanna variety.

4. Discussion

4.1. Nutrient Concentration and Variety Interactions Regarding Root Length

Soybean responses to mineral nutrients might vary depending on the nutrient type and rate and the time and method of application [38]. In our study, the response of root length of tested soybean varieties showed that the Martina variety had deeper roots than the Johanna variety when treated with 0% nutrient concentration. At other nutrient concentrations (50%, 100%, and 150%), the roots of the Johanna variety were more profound than that of the Martina variety. However, at 150% nutrient concentration, the root length of the Martina variety was slightly shorter than at 100% concentration, but the opposite effect was found for the Johanna variety. This showed that soybean root length was influenced by nutrient concentration and the type of variety. Although both nutrient concentration and variety factors influenced root length, the findings in this study showed that the roots of both varieties were the deepest at a low nutrient concentration of 50%. Based on the information data collected by Balliu et al. [39] in their review article on environmental and cultivation factors affecting the morphology, architecture, and performance of root systems in soilless-grown plants, they found that there was an increase in the elongation of vertical or deep roots for various plants grown in soilless culture systems when there was limited nitrogen supply. When plants are deprived of nutrients, their root morphology changes, and their root surface area expands [40].
Therefore, deeper roots in plants with low nutrient supply were due to the nature of the root itself, which functions as a vital organ that gives physical anchoring, nutrient absorption, water, stress prevention mechanisms, and particular signals to the aerial part of the plant [41]. Thus, the roots assist the plant in obtaining the necessary nutrients and are extending to obtain enough nutrients to meet the growth needs.

4.2. Nutrient Concentration and Variety Impacts on Root Weight, Shoot Weight, and Shoot:Root Ratio

The nutrient concentration effects on root weight also showed that low nutrient applications gave the highest root weight, and the trend was almost the same as the trend shown on root length. This finding was further strengthened by the statement by Marzec et al. [40] that when plants encounter nutrient deficiency, it causes an increase in root surface to improve the root’s capability in nutrient uptake. In contrast to the shoot weight, when the nutrient concentration was raised, the shoot weight increased dramatically. This finding was in line with a study by Kang and van Iersel [42] on salvia plants (Salvia splendens) that showed that the shoot dry weight of salvia increased significantly with increasing nutrient solution concentrations from 12.5% to 100% to 200% concentrations. They used a source of fertilizer from the Hoagland solution that is also available in the market. Similar to the findings by Sakamoto and Suzuki [43], the shoot weight of sweet potato leaves planted hydroponically using vermiculate soilless substrate increased at higher nutrient solution levels. The shoot weight was determined based on the weight of all the plant’s aboveground parts. The shoot weight rose as nutrient concentration increased, possibly due to the role of the fertilizer that supplies food sources through uptake by the roots to support plant growth. The more fertilizer is supplied until a certain level, the more nutrients required can be absorbed by the plant to grow actively, especially during its vegetative stage [44].
Similar to shoot weight, our study’s shoot:root ratio increased as the nutrient level rose from 0% to 150%. A similar result was reported by van Iersel [42] that nutrient concentration greatly affected salvia’s shoot:root ratio. They found an increase in the shoot:root ratio when the concentration increased. It is typical for the shoot:root ratio to rise as fertilizer level increases [45,46]. The shoot:root ratio of plants can significantly decrease because of deficiencies of nutrients and water [47]. Shoot:root ratio is a measurement of the amount of plant tissues with growth function (shoots) compared to the amount of plant tissue with supportive functions (roots) [48]. A high value of shoot:root ratio in a plant shows a greater proportion of shoots compared to roots in which plants with a higher proportion of shoots can better capture light energy and grow larger [47].
Shoot and root weight also depend on the variety. The Martina variety had a higher weight and better significance than the Johanna variety, which contributes to the higher shoot:root ratio of the Martina variety. The difference in shoot and root growth is due to the nature of the growth of the variety itself. Although the Johanna variety had lower above- and below-ground growth, the yield component was not affected and was comparable to the Martina variety. This is discussed in the sub-topic below.

4.3. Nutrient Concentration Impacts on the Number of Pods/Plants, Grain Weight/Pod, and Grain Yield/Pot

The main concern of producers in soybean cultivation is grain yield. In our study, different nutrient concentration rates significantly affected the number of grains/pods, grain weight/pod, and grain yield/pot. Martina and Johanna varieties have an average number of grains/pods of two grains regardless of how many nutrients were supplied. A similar result was reported by Etone Epie et al. [49], who found that the number of grains/pods was insignificant when different concentrations of nitrogen fertilizers were applied to several soybean varieties. However, their study was in field planting. Our results also show that when no nutrient (0%) was supplied, both varieties only had one grain/pod. When the grain weight/pod was measured, the grain weight rose as the nutrient concentration increased, but the weight of the grain/pod for 100% and 150% concentration was not significant. At a nutrient concentration of 50%, even though it had two grains/pod, the weight of the grain/pod was lighter compared to other nutrient concentrations.
The numbers of grain/pod and grain weight/pod affected both soybean varieties’ grain yield/pot. Due to the high grain weight/pod and the high pod number/plants on soybeans with high nutrient concentrations, the grain yield/pot also showed the same increasing trend. The result of the study is the same as reported by Morshed et al. [50], which found no significant difference in the yield of grain/plant on soybeans planted in the field when the nitrogen fertilizer was increased to a certain level. In their field experiment studies, Gai et al. [51] also found that soybean grain yield was significantly different when different nitrogen rates were applied, with the highest yield obtained under the rate of 50%. They tested up to 75% fertilizer rate. For soybean cultivation using a soilless system in a controlled condition, Valdez et al. [52] reported that the pod yield/plant of snap bean (Phaseolus vulgaris) increased with increasing nutrient levels from 25% to 150%, and pod yield/plant decreased at a nutrient level of 200%. They used the nutrient solution ‘Enshi-shoho’, which is widely used in Japan. This may be due to the greater uptake of crop and influencing the crop growth and yield components that effectively assimilated partitioning of photosynthesis from the source to sink in the post-flowering stage and resulted in the highest grain yield [53,54]. As mentioned earlier, increasing nutrients in a planting system, whether using soil or without soil, increases nutrient uptake by plants but only at certain nutrient levels. After a certain level, the excess of nutrients occurred, which means that the plants did not absorb the nutrients and became toxic; consequently, the plant production decreased. In our study, the results increased until reaching the maximum nutrient concentration (150%), and the probability that the yield will decrease after that rate is high.

4.4. Nutrient Concentration and Variety Impacts on the Number of Pods/Plants and 100-Grain Weight

The pod number increased significantly with the increase in nutrient concentration. A study conducted by Smith et al. [55] in a controlled environment and soilless culture cultivation system (mixture of sand and vermiculite at a rate of 50:50 for common bean (Phaseolus vulgaris) plants also found that there was an increase in pod number when the fertilizer concentration was increased from low (10%), medium (50%), and high (100%). As discussed in sub-topic 4.3 above, a high number of pods/plants at a high nutrient concentration contributed to an increase in grain yield/pot under a nutrient concentration of 150% in our study. Nevertheless, 100-grain weight only increased to 100% nutrient concentration and was insignificant with the 150% treatment. This means that to reach the maximum 100-grain weight, the optimal nutrient solution for tested soybean varieties was as much as 100%.
The results by Oljirra and Temesgen [56] differ from the findings of our study in which the 100-grain weight of soybean varieties (Dhidhessa, Ethio-Yugoslavia, and Wello) planted in the field did not show significant differences when supplied with different nutrient levels where the 100-grain weight obtained was in the range of 16.02 g to 16.42 g. They used blended NPS fertilizer sources. Similarly, another study conducted by Etone Epie et al. [49] in the field of other soybean varieties found that the weight of 100 grains did not show a significant difference when different concentrations of nitrogen fertilizer were used. This difference in finding may be due to differences in environmental conditions, planting systems, and nutrient management, which play an integral part in determining the growth of plants and subsequently affect yield, including 100-grain weight. However, Oljirra and Temesgen [56] and Etone Epie et al. [49] found significant differences in 100-grain yield at different varieties. Their finding was similar to the conclusions of our study. In addition to soybean, 100-grain weights were strongly controlled genetically in field beans (Vicia faba) and chickpeas (Cicer arietinum) [57,58]. The 100-grain weight is an essential agronomical characteristic, and genes related to it were targeted to enhance the soybean grain’s quality [59]. In addition, a 100-grain weight is vital because the grain size of a soybean variety can be determined [60]. This supported the results of our study when the 100-grain weight of the Johanna variety was higher and had a more prominent grain size than Martina.
The result of our study also found that the variety affected not only the 100-grain weight, but also the number of pods/plants, as reported by Agegn et al. [61] that the pod number of soybean field planting was influenced not only by the nutrient level, but also by the variety. This indicates that the traits of the soybean varieties tested, Martina and Johanna, are not only influenced by cultivation management, but also controlled by genetic factors.

4.5. Nutrient Concentration and Variety Interactions on Protein and Lipid Content

Our study results on protein and lipid content prove that both contents were affected by the interaction between nutrient concentration and variety. As for protein content, both varieties showed almost the same trend at nutrient concentrations of 0%, 50%, and 100%, the Johanna variety containing a higher protein content than Martina. This means the Johanna variety accumulated more protein in seeds than the Martina variety. This may be because, in terms of size, Johanna’s variety was larger than Martina’s. The large soybean grain can produce more protein content. It was found by Choi et al. [60] that the average total protein content of soybean grain dropped in the order of large (39.63%) > medium (39.31%) size. Therefore, the grain size of the Johanna variety can be categorized as large, and the grain size of the Martina variety can be categorized as medium.
In our study, both varieties also have the highest protein content when applied with a low nutrient concentration of 50%. Protein content decreased when nutrients were increased to 100 and 150% for both varieties. This is supported by findings from Ray et al. [62], who found that when a significant amount of nitrogen fertilizer was supplied at the rates of 290, 310, and 360 kg/ha on the Sharkey clay soil, the protein concentration of irrigated soybeans decreased by 2.7%. A significant effect of nutrients was also reported by Jarecki and Bobrecka-Jambo [63], who reported that the nitrogen fertilizer supplied at 25 kg/ha significantly boosted the seed’s protein content compared to the control. In our study, the total protein content of the unfertilized (0%) and 100% treatments was approximately the same, with a difference of only 1.5% for Johanna and 0.98% for Martina. In agreement with findings by Purcell et al. [64] in their study on silt loam soil, they found that when 112 kg N/ha was supplied during the R2 stage of soybean growth, there were no differences in the amount of seed protein and oil concentrations compared to the soybean planted without fertilizer. Our findings also had a similar trend to those of Kaur et al. [65]. The soybean variety of ‘Pioneer 49T80′ was planted in field conditions on soil clay texture when it showed the highest protein content was on low nitrogen fertilizer and decreased after the fertilizer rate was increased and was almost the same as the protein content without fertilization treatment. However, they reported no significant difference in protein content when the soybean variety was planted in soil with a silt loam texture. According to Jurgonski [30], soybean seeds are rich in protein and lipid content for soybeans grown in a controlled environment compared to seeds grown in field planting.
Although most of the studies on soybeans indicated that the protein content increased with lower nutrient concentration, some studies on wheat crops reported that the protein content increased with higher fertilizer rates up to a certain level, such as 160 kg/ha for planting in fields [66,67]. However, according to Wan et al. [68], the relationship between protein content and fertilizer generally followed a quadratic function in which the content increased initially and then declined with increases in nutrient level.
The opposite trend from protein content was shown for lipid content in our study. Both varieties showed the lowest lipid content at 50% nutrient; the lipid content of the Johanna variety exceeds the Martina variety at this rate. At other nutrient concentrations, the Martina variety had the highest lipid content. The response of these two varieties to lipid content differed from the response to protein content, probably because the smaller-sized variety usually has a higher lipid content. According to Choi et al. [60], grain size and lipid content were categorized as follows, which was medium (17.32%) > large (16.93%). Meanwhile, the low lipid content under low nutrients was supported by the findings of another study in which the lipid content of soybeans grown on clay soil showed a low lipid content at a nutrient of 45 kg N/ha and increased with increasing nutrient levels [65]. Surprisingly, in our study, the lipid content at 0% was higher than that at nutrient 50%. This finding is the same as Szostak et al. [63], who reported that the lipid content of the soybean variety without nutrients was higher than with 30 kg/ha of nitrogen. Based on some research results, most show that the lipid content became low when the protein content was increased. Choi et al. [60] discovered that there was a significant but inverse correlation (r = −0.714, p < 0.0001) between the total lipid and protein levels of soybeans. This meant that soybeans with greater protein contents also had lower lipid contents, and contrarily. This inverse relationship was expected to result from the pleiotropic effects of minor and major genes related to protein and lipid content [69]. Therefore, protein and lipid content strongly influence each other in soybean plants, which are influenced not only by the environment or meteorological conditions, but also by nutrient management and variety.

4.6. Nutrient Concentration Impacts on Protein and Lipid Yield

Our finding also reveal that only nutrient concentration treatment significantly affects protein and lipid yield, whereas variety treatment did not significantly affect these yields. It is based on the result shown in Figure 12. Varieties Johanna and Martina have comparable protein and lipid yields. Protein and lipid yields were estimated according to protein and lipid content multiplied by grain yield/pot. In this study, protein and lipid yields increased when nutrients were up from 0% to 150%. Although the protein content was higher in low nutrients (50%), the low grain yield/pot in this treatment caused the protein yield to be low.
Similarly, lipid yield was the highest at a high nutrient concentration (150%) due to increased lipid content and grain yield at the treatment. Protein and lipid yield are significant in soybean production in addition to grain yield because they contribute to the total nutritional value of soybean crops; it is essential, particularly in producing soybean-based secondary products for human or livestock consumption. Therefore, for crop production in a controlled environment using soilless culture, it is necessary to focus on crop management for high-yield production and high quality that is rich in nutritional value and can further enhance economic development. So, according to Fussy and Papenbrock [70], other than lighting and nutrient application, soilless agriculture should evaluate various types of systems, applications, and soilless cultures as well as their economic viability and sustainability.

5. Conclusions

In conclusion, applying 50% nutrient concentration of the Advance Hydroponics of Holland in a controlled condition using clay mineral aggregate as a substrate produced the deepest root and the highest protein content for the varieties of Martina and Johanna. The application of nutrient solutions at 100% and 150% had a favorable impact on many of the parameters measured in both varieties, including higher shoot weight and shoot:root ratio, more pod number, higher 100-grain weight, higher grain yield/pot, better lipid content, as well as greater protein and lipid yields/pot. Therefore, it is recommended that fertilizer concentrations ranging from 100 to 150% be used for Martina and Johanna varieties planted using this technique. These findings provide essential information for producing high-yielding, high-quality, and pesticide-free soybeans specifically for the varieties of Martina and Johanna. However, these findings can also be used to guide cultivating other soybean varieties that use this system. It is suggested that further research on both varieties can be conducted on other critical agronomic practices such as the requirements for light, water, and other types of soilless substrate to boost their yield and chemical composition.

Author Contributions

Methodology, investigation, writing—original draft preparation, R.A.G.; Conceptualization, methodology, Á.T. and Z.K.; investigation, S.O. and N.K.; software, Z.K.; data curation, R.A.G., S.O. and N.K.; writing—review and editing, M.J.; supervision, M.J. and M.K.K. All authors have read and agreed to the published version of the manuscript.

Funding

The Hungarian University of Agriculture and Life Sciences provided internal funding for this study. The Malaysian Agricultural Research and Development Institute supported it.

Institutional Review Board Statement

Not applicable.

Informed Consent Statement

Not applicable.

Data Availability Statement

This manuscript’s data, tables, and figures are original.

Acknowledgments

The authors would like to acknowledge all the members of the Institute of Agronomy who contributed to this research, including the technical staff in the field and the laboratory. We would also like to express our gratitude to MATE’s Doctoral School of Plant Science, which provided funding for this research, as well as the Malaysian Agricultural Research and Development Institute (MARDI) and the Stipendium Hungaricum, which sponsored the Ph.D. students who were involved in this study.

Conflicts of Interest

The authors declare no conflict of interest.

References

  1. Benis, K.; Reinhart, C.; Ferrão, P. Building-Integrated Agriculture (BIA) in urban contexts: Testing a simulation-based decision support workflow. In Proceedings of the Building Simulation, San Francisco, CA, USA, 7–9 August 2017. [Google Scholar]
  2. Engler, N.; Krarti, M. Review of energy efficiency in controlled environment agriculture. Renew. Sustain. Energy Rev. 2021, 141, 110786. [Google Scholar] [CrossRef]
  3. Niu, G.; Masabni, J. Plant production in controlled environments. Horticulturae 2018, 4, 28. [Google Scholar] [CrossRef]
  4. Van Gerrewey, T.; Boon, N.; Geelen, D. Vertical Farming: The Only Way Is up? Agronomy 2021, 12, 2. [Google Scholar] [CrossRef]
  5. Chole, A.S.; Jadhav, A.R.; Shinde, V. Vertical farming: Controlled environment agriculture. Just Agric. 2021, 1, 249–256. [Google Scholar]
  6. Barbosa, G.L.; Gadelha, F.D.A.; Kublik, N.; Proctor, A.; Reichelm, L.; Weissinger, E.; Wohlleb, G.M.; Halden, R.U. Comparison of land, water, and energy requirements of lettuce grown using hydroponic vs. conventional agricultural methods. Int. J. Environ. Res. Public Health 2015, 12, 6879–6891. [Google Scholar] [CrossRef]
  7. Despommier, D. Advantages of the vertical farm. In Sustainable Environmental Design in Architecture; Rassia, S.T., Pardalos, P.M., Eds.; Springer: New York, NY, USA, 2012; Volume 56, pp. 259–275. [Google Scholar]
  8. Li, C.; Adhikari, R.; Yao, Y.; Miller, A.G.; Kalbaugh, K.; Li, D.; Nemali, K. Measuring plant growth characteristics using smartphone based image analysis technique in controlled environment agriculture. Comput. Electron. Agric. 2020, 168, 105–123. [Google Scholar] [CrossRef]
  9. Eigenbrod, C.; Gruda, N. Urban vegetable for food security in cities. A review. Agron. Sustain. Dev. 2015, 35, 483–498. [Google Scholar] [CrossRef]
  10. Gruda, N.S. Soilless culture systems and growing media in horticulture: An overview. In Advances in Horticultural Soilless Culture; Gruda, N., Ed.; Burleigh Dodds Science Publishing Limited: Cambridge, UK, 2021; pp. 1–20. [Google Scholar] [CrossRef]
  11. Hong, J.; Gruda, N.S. The potential of introduction of Asian vegetables in Europe. Horticulturae 2020, 6, 38. [Google Scholar] [CrossRef]
  12. Gruda, N.S.; Fernández, J.A. Optimising soilless culture systems and alternative growing media to current used materials. Horticulturae 2022, 8, 292. [Google Scholar] [CrossRef]
  13. Savvas, D.; Gianquinto, G.; Tuzel, Y.; Gruda, N. Soilless culture. In Good Agricultural Practices for Greenhouse Vegetable Crops; Baudoin, W., Nono-Womdim, R., Lutaladio, N., Hodder, A., Castilla, N., Leonardi, C., De Pascale, S., Qaryouti, M., Duffy, R., Eds.; Food and Agriculture Organization of The United Nations: Rome, Italy, 2013; pp. 6–57. [Google Scholar]
  14. Hussain, A.; Iqbal, K.; Aziem, S.; Mahato, P.; Negi, A.K. A review on the science of growing crops without soil (Soilless Culture)—A novel alternative for growing crops. Int. J. Agric. Crop Sci. 2014, 7, 833–842. [Google Scholar]
  15. Al Shrouf, A. Hydroponics, aeroponic and aquaponic compared to conventional farming. Int. Sch. Res. Netw. Agron. 2017, 27, 247–255. [Google Scholar]
  16. Acquaah, G. Horticulture Principles and Practices, 4th ed.; Pearson Education, Inc.: London, UK, 2009. [Google Scholar]
  17. Julia, K. Phase 1: Examining the industry and impacts of contcontrolled environment agriculture. In Indoor Soilless Farming; The Markets Institute at World Wildlife Fund (WWF): Washington, DC, USA, 2020; pp. 7–15. Available online: https://files.worldwildlife.org/wwfcmsprod/files/Publication/file/84omrzpdge_WWW_SoilessAg_Phase1_Final_Report_Full_051320.pdf?_ga=2.179350884.1787328897.1677599468-1603533520.1677599467 (accessed on 21 February 2023).
  18. Proterra Foundation Report. The Importance of Soy in Crop Rotation. 2020. Available online: https://www.proterrafoundation.org/news/the-importance-of-soy-in-crop-rotation/ (accessed on 21 February 2023).
  19. Rao, M.; Bhagsari, A.; Mohamed, A. Fresh green seed yield and seed nutritional traits of vegetable soybean genotypes. Crop Sci. 2002, 42, 1950–1958. [Google Scholar] [CrossRef]
  20. Li, Y.S.; Du, M.; Zhang, Q.Y.; Wang, G.H.; Hashemi, M.; Liu, X.B. Greater differences exist in seed protein, oil, total soluble sugar and sucrose content of vegetable soybean genotypes (Glycine max (L.) Merrill) in Northeast China. Aust. J. Crop Sci. 2012, 6, 1681–1686. [Google Scholar] [CrossRef]
  21. Wilk, M. Soya as a source of valuable nutrients. Zywn-Nauk-Technol-Ja 2017, 2, 16–25. [Google Scholar] [CrossRef]
  22. Graamans, L. Protein-Rich Crops: Growing Soybean in Vertical Farms. News. Wegeningen University and Research. 7 March 2022. Available online: https://www.wur.nl/en/research-results/research-institutes/plant-research/greenhouse-horticulture/show-greenhouse/protein-rich-crops-growing-soybean-in-vertical-farms.htm (accessed on 22 February 2023).
  23. Paradiso, R.; de Micco, V.; Buonomo, R.; Aronne, G.; Barbieri, G.; de Pascale, S. Soilless cultivation of soybean for Bioregenerative Life-Support Systems: A literature review and the experience of the MELiSSA Project—Food characterisation Phase I. Plant Biol. 2013, 16, 69–78. [Google Scholar] [CrossRef]
  24. Croce, J.; Badano, E.I.; Trigo, C.B.; Martinez-Galvez, F.; Talamo, A. Experimental approaches to select tree species for forest restoration: Effects of light, water availability and interspecific competition in degraded areas. J. For. Res. 2022, 33, 1197–1207. [Google Scholar] [CrossRef]
  25. Savvas, D. Nutritional management of vegetables and ornamental plants in hydroponics. In Crop Management and Postharvest Handling of Horticultural Products, Volume 1—Quality Management; Dris, R., Niskanen, R., Jain, S.M., Eds.; Science Publishers: Enfield, NH, USA, 2001; pp. 37–87. [Google Scholar]
  26. Anonymous. 25 Successful Years with Advanced Hydroponcs. Overview. 28 May 2018. Available online: https://advancedhydro.com/news/3/25-successful-years-with-advanced-hydroponics (accessed on 22 February 2023).
  27. Singh, H.; Dunn, B.; Payton, M.; Brandenberger, L. Selection of fertilizer and cultivar of sweet pepper and eggplant for hydroponic production. Agronomy 2019, 9, 433. [Google Scholar] [CrossRef]
  28. International Fertilizer Industry Association. World Fertilizer Use Manual; IFA: Paris, France, 1992; p. 632. [Google Scholar]
  29. Wheeler, R.M.; Mackowiak, C.L.; Stutte, G.W.; Yorio, N.C.; Ruffe, L.M.; Sager, J.C.; Prince, R.P.; Knott, W.M. Crop productivities and radiation use efficiencies for bioregenerative life support. Adv. Space Res. 2008, 41, 706–713. [Google Scholar] [CrossRef]
  30. Jurgonski, L.J.; Smart, D.J.; Bugbee, B.; Nielsen, S.S. Controlled environments alter ntrient content of soybeans. Adv. Space Res. 1997, 20, 179–1988. [Google Scholar] [CrossRef]
  31. Basal, O.; Szabó, A.; Veres, S. Physiology of soybean as affected by PEG-induced drought stress. Curr. Plant Biol. 2020, 22, 100135. [Google Scholar] [CrossRef]
  32. Iris, L.; Gomez-Merino, F.C. Nutrient solutions for hydroponic systems. In Hydroponics—A Standard Methodology for Plant Biological Researches; InTech: Rijeka, Croatia, 2012. [Google Scholar] [CrossRef]
  33. Nemali, K.S.; van Iersel, M.W. Light Intensity and fertilizer concentration: I. Estimating optimal fertilizer concentration from water-use efficiency of wax begonia. HortScience 2004, 39, 1287–1292. [Google Scholar] [CrossRef]
  34. Sonneveld, C.; Voogt, W. Plant Nutrition of Greenhouse Crops; Springer: New York, NY, USA, 2009; ISBN 9048125316. [Google Scholar]
  35. Samarakoon, U.C.; Weerasinghe, P.A.; Weerakkody, A.P. Effect of electrical conductivity [EC] of the nutrient solution on nutrient uptake, growth and yield of leaf lettuce (Lactuca sativa L.) in stationary culture. Trop. Agric. Res. 2006, 18, 13–21. [Google Scholar]
  36. Purcell, L.C.; Salmeron, M.; Ashlock, L. Soybean growth and development. In Arkansas Soybean Production Handbook; University of Arkansas Cooperative Extension, University of Arkansas System Division of Agriculture: Fayetteville, AR, USA, 2014; Available online: https://www.uaex.uada.edu/publications/pdf/mp197/chapter2.pdf (accessed on 15 February 2023).
  37. McClure, T.; Cocuron, J.C.; Osmark, V.; McHale, L.K.; Alonso, A.P. Impact of environment on the biomass composition of soybean (Glycine max) seeds. J. Agric. Food Chem. 2017, 65, 6753–6761. [Google Scholar] [CrossRef]
  38. Moreno, G.; Albrecht, A.J.P.; Albrecht, L.P.; Junior, C.P.; Pivetta, L.A.; Tessele, A.; Lorenzetti, J.B.; Furtado, R.C.N. Application of nitrogen fertilizer in high-demand stages of soybean and its effects on yield performance. Aust. J. Crop Sci. 2018, 12, 16–21. [Google Scholar] [CrossRef]
  39. Balliu, A.; Zheng, Y.; Sallaku, G.; Fernández, J.A.; Gruda, N.S.; Tuzel, Y. Environmental and cultivation factors affect the morphology, architecture and performance of root systems in soilless grown plants. Horticulturae 2021, 7, 243. [Google Scholar] [CrossRef]
  40. Marzec, M.; Melzer, M. Regulation of root development and architecture by strigolactones under optimal and nutrient deficiency conditions. Int. J. Mol. Sci. 2018, 19, 1887. [Google Scholar] [CrossRef]
  41. Vives-Peris, V.; de Ollas, C.; Gómez-Cadenas, A.; Pérez-Clemente, R.M. Root exudates: From plant to rhizosphere and beyond. Plant Cell Rep. 2020, 39, 3–17. [Google Scholar] [CrossRef]
  42. Kang, J.G.; van Iersel, M.W. Nutrient solution concentration affects shoot:root ratio, leaf area ratio, and growth of subirrigated salvia (Salvia splendens). HortScience 2004, 39, 49–54. [Google Scholar] [CrossRef]
  43. Sakamoto, M.; Suzuki, T. Effect of nutrient solution concentration on the growth of hydroponic sweetpotato. Agronomy 2020, 10, 1708. [Google Scholar] [CrossRef]
  44. Jones, J.B., Jr. Hydroponics: Its history and use in plant nutrition studies. J. Plant Nutr. 1982, 5, 1003–1030. [Google Scholar] [CrossRef]
  45. Mak, A.T.Y.; Yeh, D.M. Nitrogen nutrition of Spathiphyllum ‘Sensation’grown in sphagnum peat- and coir-based media with two irrigation methods. HortScience 2001, 36, 645–649. [Google Scholar] [CrossRef]
  46. Sattelmacher, B.; Klotz, F.; Marschner, H. Influence of the nitrogen level on the root growth and morphology of two potato varieties differing in nitrogen acquisition. Plant Soil 1990, 123, 131–137. [Google Scholar] [CrossRef]
  47. Findenegg, G.R. Effect of varied shoot/root ratio on growth of maize (Zea mays) under nitrogen-limited conditions: Growth experiment and model calculations. In Plant Nutrition—Physiology and Applications; Kluwer Academic Publisher: London, UK, 1990; pp. 21–27. [Google Scholar]
  48. Harris, R.W. Root-Shoot Ratios. J. Arboric. 1992, 18, 39–42. [Google Scholar] [CrossRef]
  49. Epie, K.E.; Bauer, P.J.; Stone, K.C.; Locke, A.M. Nitrogen fertilizer effects on soybean physiology, yield components, seed yield and protein content in the Southeastern United States. J. Plant Nutr. 2023, 46, 462–472. [Google Scholar] [CrossRef]
  50. Morshed, R.M.; Rahman, M.M.; Rahman, M.A. Effect of nitrogen on seed yield, protein content and nutrient uptake of soybean (Glycine max L.). J. Agric. Rural Dev. 2008, 6, 1652. [Google Scholar] [CrossRef]
  51. Gai, Z.; Zhang, J.; Li, C. Effects of starter nitrogen fertilizer on soybean root activity, leaf photosynthesis and grain yield. PLoS ONE 2017, 12, e0174841. [Google Scholar] [CrossRef]
  52. Valdez, M.T.; Ito, T.; Shinohara, Y.; Maruo, T. Effects of nutrient solution levels on the growth, yield and mineral contents in hydroponically-grown bush snap bean. Environ. Control Biol. 2002, 40, 167–175. [Google Scholar] [CrossRef]
  53. Shivakumar, B.G. Performance of chickpea (Cicer arietinum) varieties as influenced by sulphur with and without phosphorus. Indian J. Agron. 2001, 46, 273–276. [Google Scholar]
  54. Desta, B. Biological nitrogen fixation research on grain legumes in Ethiopia: An Overview. In Proceedings of the A Workshop on Biological Nitrogen Fixation on Mediterranean-Type Agriculture, ICARDA, Aleppo, Syria, 14–17 April 1986; Beck, D.P., Materon, L.A., Eds.; Springer: Dordrecht, The Netherlands; pp. 73–78. [Google Scholar]
  55. Smith, M.R.; Reis Hodecker, B.E.; Fuentes, D.; Merchant, A. Investigating nutrient supply effects on plant growth and seed nutrient content in common bean. Plants 2022, 11, 737. [Google Scholar] [CrossRef]
  56. Oljirra, D.; Temesgen, T. Responses of Soybean (Glycine max L.) Varieties to NPS fertilizer rates at Bako, Western Ethiopia. Am. J. Water Sci. Eng. 2019, 5, 155. [Google Scholar] [CrossRef]
  57. Jawahar, S.V.; Vaiyapuri, V.; Suseendran, K.; Kalaiyarasa, C.; Sriramachandrasekharan, M. Effect of sources and levels of sulphur on growth and yield of rice fallow blackgram (Vigna mungo). Int. J. Chem. 2017, 3, 1–7. [Google Scholar]
  58. Tanaka, A.; Fujita, K. Growth, photosynthesis and yield components in relation to seed yield of the field bean. J. Fac. Agric. 1979, 59, 145–238. [Google Scholar]
  59. Qi, Z.; Song, J.; Zhang, K.; Liu, S.; Tian, X.; Wang, Y. Identification of QTNs controlling 100-seed weight in soybean using multilocus genome-wide association studies. Front Genet. 2020, 11, 689. [Google Scholar] [CrossRef] [PubMed]
  60. Choi, Y.-M.; Yoon, H.; Shin, M.-J.; Lee, Y.; Sook Hur, O.; Lee, C.; Ha, B.K.; Wang, X.; Taye Desta, K. Change in protein, oil and fatty acid contents in soybeans (Glycine max (L.) Merr.) of different seed coat colors and seed weight. bioRxiv 2021. [Google Scholar] [CrossRef]
  61. Agegn, A.; Bitew, Y.; Ayalew, D. Response of yield and quality of soybean [Glycine max (L.) Merrill] varieties to blended NPSZnB fertilizer rates in Northwestern Ethiopia. Heliyon 2022, 8, e09499. [Google Scholar] [CrossRef]
  62. Ray, J.; Fritschi, F.; Heatherly, L. Large applications of fertilizer n at planting affects seed protein and oil concentration and yield in the early soybean production system. Field Crops Res. 2006, 99, 67–74. [Google Scholar] [CrossRef]
  63. Szostak, B.; Głowacka, A.; Kasiczak, A.; Kiełtyka-Dadasiewicz, A.; Bąkowski, M. Nutritional value of soybeans and the yield of protein and fat depending on a cultivar and the level of nitrogen application. J. Elem. 2020, 25, 45–57. [Google Scholar] [CrossRef]
  64. Purcell, L.C.; Serraj, R.; Sinclair, T.R.; De, A. Soybean n fixation estimates, ureide concentration, and yield responses to drought. Crop Sci. 2004, 44, 484–492. [Google Scholar] [CrossRef]
  65. Kaur, G.; Serson, W.R.; Orlowski, J.M.; McCoy, J.M.; Golden, B.R.; Bellaloui, N. Nitrogen sources and rates affect soybean seed composition in Mississippi. Agronomy 2017, 7, 77–87. [Google Scholar] [CrossRef]
  66. Eser, A.; Kassai, K.M.; Kato, H.; Kunos, V.; Tarnava, A.; Jolánkai, M. Impact of nitrogen topdressing on the quality parameters of winter wheat (Triticum aestivum L.) yield. Acta Alimentaria 2020, 49, 244–253. [Google Scholar] [CrossRef]
  67. Pepó, P. Adaptive capacity of wheat (Triticum aestivum L.) and maize (Zea mays L.) crop models to ecological conditions. Növénytermelés 2010, 59, 325–328. [Google Scholar]
  68. Wan, C.; Gao, L.; Wang, J.; Lei, X.; Tao, J.; Feng, B.; Gao, J. Effects of nitrogen fertilizer on protein synthesis, accumulation, and physicochemical properties in common buckwheat. Crop J. 2023, 11, 941–950. [Google Scholar] [CrossRef]
  69. Pathan, S.M.; Vuong, T.; Clark, K.; Lee, J.D.; Grover Shannon, J.; Roberts, C.A. Genetic mapping and confirmation of quantitative trait loci for seed protein and oil contents and seed weight in soybean. Crop Sci. 2013, 53, 765–774. [Google Scholar] [CrossRef]
  70. Fussy, A.; Papenbrock, J. An overview of soil and soilless cultivation techniques—Chances, challenges and the neglected question of sustainability. Plants 2022, 11, 1153. [Google Scholar] [CrossRef] [PubMed]
Figure 1. Planting equipment that was set up and installed in a controlled growth chamber.
Agriculture 13 01925 g001
Figure 2. Experimental layout of the study. N1: 0% of nutrient concentration, N2: 50% of nutrient concentration, N3: 100% of nutrient concentration, N4: 150% of nutrient concentration; V1: Martina variety, V2: Johanna variety; R1: Replicate 1, R2: Replicate 2, and R3: Replicate 3.
Agriculture 13 01925 g002
Figure 3. Plants at 60 days after planting under nutrient concentration treatments of (a) 0%, (b) 50%, (c) 100%, and (d) 150%.
Agriculture 13 01925 g003
Figure 4. Effects of nutrient concentration and variety on root length of soybean grown in soilless conditions. Mean values with different letters are significantly different by LSD (p < 0.05).
Agriculture 13 01925 g004
Figure 5. Shoot weight (a) and root weight (b) of soilless cultivated soybeans as influenced by nutrient concentration. Mean values with different letters are significantly different by LSD (p < 0.05).
Agriculture 13 01925 g005
Figure 6. Shoot weight (a) and root weight (b) of soilless cultivated soybeans as influenced by variety. Mean values with different letters are significantly different by LSD (p < 0.05).
Agriculture 13 01925 g006
Figure 7. Shoot:root ratio of soilless cultivated soybeans as influenced by nutrient concentration and variety. Mean values with different letters are significantly different by LSD (p < 0.05).
Agriculture 13 01925 g007
Figure 8. Grain yield of soilless cultivated soybeans as influenced by nutrient concentration and variety. Mean values with different letters are significantly different by LSD (p < 0.05).
Agriculture 13 01925 g008
Figure 9. Hundred-grain weight of soilless cultivated soybeans as influenced by nutrient concentration and variety. Mean values with different letters are significantly different by LSD (p < 0.05).
Agriculture 13 01925 g009
Figure 10. Effects of nutrient concentration and variety on soybean protein content grown in soilless conditions. Mean values with different letters are significantly different by LSD (p < 0.05).
Agriculture 13 01925 g010
Figure 11. Effects of nutrient concentration and variety on the lipid content of soybean grown in soilless conditions. Mean values with different letters are significantly different by LSD (p < 0.05).
Agriculture 13 01925 g011
Figure 12. Protein and lipid yields of soilless cultivated soybeans as influenced by nutrient concentration and variety. Mean values with different letters are significantly different by LSD (p < 0.05).
Agriculture 13 01925 g012
Table 1. Nutrient content (%) in Dutch Formula fertilizers.
NutrientNutrient Content (%)
Formula 1 (Grow)Formula 2 (Bloom)Formula 3 (Micro)
Nitrate (NO3)1.80.34.5
Ammonium (NH4)0.60.40
Phosphorus pentoxide (P2O5)4.45.70
Potassium oxide (K2O)7.45.33.0
Magnesium oxide (MgO)0.82.10
Sulfur trioxide (SO3)2.25.60
Calcium oxide (CaO)006.0
Boron (B)000.015
Molybdenum (Mo)000.01
Copper (Cu)000.006
Manganese (Mn)000.04
Zinc (Zn)000.02
Iron (Fe)000.15
Table 2. The total of the Advance Hydroponics of Holland fertilizers at different formulas that were diluted in 25 L of water based on nutrient concentration treatments and stages of plant growth.
Plant StageTreatmentFormula 1 (Grow)Formula 2 (Bloom)Formula 3 (Micro)
Growing stage (V1, V2)0%000
50%9.384.634.63
100%18.759.259.25
150%28.1313.8813.88
Growing stage (V3, V4, V5)0%000
50%18.759.389.38
100%37.518.7518.75
150%56.2528.1328.13
Flowering stage0%000
50%102010
100%204020
150%306030
End of the flowering stage0%000
50%037.512.5
100%07525
150%0112.537.5
Table 3. Analysis of variance (ANOVA) for soybean root length (cm) as affected by nutrient concentration and variety.
Source of VariationSum of SquaresDegree of FreedomMean SquareF ValueSignificance
Nutrient
concentration (N)65.24321.7522.150.0001
Variety (V)0.0210.020.020.894
N × V11.8733.964.030.026
Error15.71160.98
Total92.8423
Significance level: p < 0.05.
Table 4. Two-way analysis of variance (ANOVA) for the effects of nutrient concentration and variety on the weight of soybean shoots.
Source of VariationSum of SquaresDegree of FreedomMean SquareF ValueSignificance
Nutrient
concentration (N)7.7432.58232.290.0001
Variety (V)1.0911.0998.400.0001
N × V0.0630.021.720.202
Error0.18160.01
Total9.0623
Significance level: p < 0.05.
Table 5. Two-way analysis of variance (ANOVA) for the effects of nutrient concentration and variety on the weight of soybean roots.
Source of VariationSum of SquaresDegree of FreedomMean SquareF ValueSignificance
Nutrient
concentration (N)0.0130.0019.250.0001
Variety (V)0.0110.0158.130.0001
N × V0.0030.000.870.478
Error0.00160.00
Total0.0223
Significance level: p < 0.05.
Table 6. Two-way analysis of variance (ANOVA) for the effects of nutrient concentration and variety on the shoot:root ratio of soybean.
Source of VariationSum of SquaresDegree of FreedomMean SquareF ValueSignificance
Nutrient
concentration (N)171.59357.20935.210.0001
Variety (V)4.3014.3070.330.0001
N × V0.3330.111.780.192
Error0.98160.06
Total177.1923
Significance level: p < 0.05.
Table 7. The number of grains/pods, grain weight/pod, and number of pods/plants of soybean cultivated in soilless conditions as influenced by nutrient concentration and variety.
TreatmentNumber of Grains/PodsGrain Weight/Pod (g)Number of Pods/Plants
Nutrient Concentration (N)
0%1b0.143c5d
50%2a0.232b7c
100%2a0.342a11b
150%2a0.367a14a
Grand mean1.750.2719
Significance*****
Variety (V)
Martina2a0.269a9b
Johanna2a0.273a10a
Grand mean20.2719
Significance*Not significant**
N × V
NV
0%Martina1a0.133a5a
Johanna1a0.152a5a
50%Martina2a0.242a7a
Johanna2a0.222a8a
100%Martina2a0.359a11a
Johanna2a0.325a12a
150%Martina2a0.358a14a
Johanna2a0.376a14a
Grand mean1.750.2719.5
SignificanceNot significantNot significantNot significant
Mean values with different letters are significantly different by LSD, * significantly different at p < 0.05, and ** significantly different at p < 0.01.
Table 8. Two-way analysis of variance (ANOVA) for the effects of nutrient concentration and variety on the grain yield of soybean.
Source of VariationSum of SquaresDegree of FreedomMean SquareF ValueSignificance
Nutrient
concentration (N)2647.443882.4844.870.0001
Variety (V)2.9212.920.150.705
N × V9.5733.190.160.920
Error314.661619.67
Total2974.5823
Significance level: p < 0.05.
Table 9. Two-way analysis of variance (ANOVA) for the effects of nutrient concentration and variety on the 100-grain weight of soybean.
Source of VariationSum of SquaresDegree of FreedomMean SquareF ValueSignificance
Nutrient
concentration (N)105.57335.19132.290.0001
Variety (V)6.4116.4124.090.0001
N × V0.3130.100.390.766
Error4.26160.27
Total116.5423
Significance level: p < 0.05.
Table 10. Two-way analysis of variance (ANOVA) for the effects of nutrient concentration and variety on the protein content of soybean.
Source of VariationSum of SquaresDegree of FreedomMean SquareF ValueSignificance
Nutrient
concentration (N)42.19314.0640.330.0001
Variety (V)8.2818.2823.760.0001
N × V3.6131.203.450.042
Error5.58160.35
Total59.6623
Significance level: p < 0.05.
Table 11. Two-way analysis of variance (ANOVA) for the effects of nutrient concentration and variety on the lipid content of soybean.
Source of VariationSum of SquaresDegree of FreedomMean SquareF ValueSignificance
Nutrient
concentration (N)131.29343.76226.610.0001
Variety (V)3.8513.8519.930.0001
N × V13.4834.4923.270.0001
Error3.09160.19
Total151.7023
Significance level: p < 0.05.
Table 12. Two-way analysis of variance (ANOVA) for the effects of nutrient concentration and variety on the protein yield of soybean.
Source of VariationSum of SquaresDegree of FreedomMean SquareF ValueSignificance
Nutrient
concentration (N)13.6334.5440.800.0001
Variety (V)0.0510.050.450.511
N × V0.1130.040.320.809
Error1.78160.11
Total15.5723
Significance level: p < 0.05.
Table 13. Two-way analysis of variance (ANOVA) for the effects of nutrient concentration and variety on the lipid yield of soybean.
Source of VariationSum of SquaresDegree of FreedomMean SquareF ValueSignificance
Nutrient
concentration (N)58.94319.6553.490.0001
Variety (V)0.1610.160.430.523
N × V0.5330.180.480.699
Error5.88160.37
Total65.5023
Significance level = p < 0.05.
Disclaimer/Publisher’s Note: The statements, opinions and data contained in all publications are solely those of the individual author(s) and contributor(s) and not of MDPI and/or the editor(s). MDPI and/or the editor(s) disclaim responsibility for any injury to people or property resulting from any ideas, methods, instructions or products referred to in the content.

