1. Introduction
The ability of soil organic carbon to operate as a sink for atmospheric CO
2 is a topic of intense discussion in the scientific literature. Soil carbon sequestration can be accomplished by increasing C inputs with increasing ecosystem productivity, or decreasing soil carbon losses by delaying the decomposition process [
1].
Soil carbon sequestration techniques have a favorable impact on increasing soil resilience to climate stress, which aids in ecosystem services and climate change adaptation. At the same time, the terrestrial C pools are one of the potential sources of atmospheric greenhouse gases (GHGs), which, if not properly controlled, can have a considerable impact on future climate change [
2].
Since C loss from carbon-rich soils can be a significant source of CO
2 emissions, the increase in C storage in these soils presents an opportunity for adaptation and climate change mitigation [
3,
4]. It is believed that C accumulation in mineral soils leads to a certain saturation level—the upper limit for additional C gains. Paustain et al. [
5] proposed 5% of soil organic C by mass as such a criterion. Even when arable soils are below the saturation level, the high C content in such soils is commonly considered to be a factor preventing further C accumulation.
The removal of C from the atmosphere in managed terrestrial ecosystems—C sequestration and storage—has been the subject of numerous articles in recent years [
6,
7,
8,
9,
10,
11,
12,
13]. As noted by Chenu et al. [
6], the term «sequestration», representing negative emission technology, denotes a relatively long duration period, at least 20 years based on the recommendations of the Intergovernmental Panel on Climate Change (IPCC). The term “storage” has a broader meaning, indicating C accumulation in the soil, which is not always related to the removal of C from the atmosphere. For example, the application of farmyard manure (FYM) originating from outside of the field does not reflect direct CO
2 removal at the site [
5].
However, the evaluation of the effectiveness of changing management practices is usually carried out at the regional level, where the loss of C in some areas can be offset by a corresponding increase in other areas [
14,
15]. Thus, the soils with lower C concentration may compensate for a weak reaction of carbon-rich soils to the management practices. In real conditions within one field, many other restrictions arise. First, the long-term application of management practices is necessary for increasing SOC stocks. These practices should provide a sustainable increase in C input [
16], which can be difficult to ensure [
5]. The interaction or cumulative effect of change in crop rotation, fallowing, residue management, and fertilization affect the balance of soil C stock [
17,
18]. A set of practices that provide consistent C storage compared to business-as-usual (BAU) cropping systems should be economically justified [
11]. Secondly, the accumulation of C may slow down when a new equilibrium state is reached [
5]. Thirdly, the rate of mineralization of organic matter may increase, which is controlled at the local level by a set of other factors compared to regional estimates [
19]. In this case, it becomes important to assess the comparability of the impact of climate change and agricultural practices on the processes of mineralization and stabilization of SOC locally in the long term [
20].
In this paper, we discuss perspectives for the implementation of the 4 per 1000 initiative [
13] for arable Chernozem under future climate conditions. Previously, up until 2020, we reproduced the dynamics of SOC in a long-term field experiment (LTFE) on Chernozem in the Rostov region [
21]. In the present paper, we present a simulation for a period up to 2090 for the same experimental plot on Haplic Chernozems. The aim of this simulation was to assess the possibility of consecutive SOC storage and an SOC stock increase of 4 per 1000 in the LTFE under planned management practice changes. It is based on the dynamic modeling of SOC stocks for three contrasting LTFE treatments with average and high fertilization rates, considering two climate change scenarios and three management scenarios to investigate their effects in combination. Special attention was paid to estimating the necessary C input and its practical feasibility for preservation, or increasing SOC stocks over different time frames. We also analyze whether the required C input level can be achieved with crop rotation changes or with additional organic fertilization.
2. Materials and Methods
The study is based on the long-term field experiment of the Geographic Network of LTFE with Fertilizers [
22]. The LTFE was launched in 1974 by the Federal Rostov Agricultural Research Center. A detailed description of the experimental field and experimental treatments used to conduct the simulation modeling and predict the dynamics of soil organic carbon (SOC) stocks is presented in our previous work [
23]. Briefly, the experimental site is situated on a watershed plateau in the central part of the Rostov oblast near the village of Rassvet, Aksai District, 20 km from the Don River. The current rotation includes black fallow, winter wheat, maize for grain, spring barley, maize for silage, winter wheat, peas, winter wheat, and sunflower. In the LTFE, the effects of separate and combined organic and mineral fertilization on maintaining the fertility of Haplic Chernozem and crop rotation productivity were studied. The average annual application rate of 8.9 Mg·ha
−1 of FYM + N
44P
22K
22 per 1 hectare of crop rotation area was recommended to keep the SOC stock in the grain–fallow crop rotation close to the initial level. The average annual rate 11.1 Mg·ha
−1 of FYM + N
71P
23K
23 per 1 hectare could provide the maximum crop rotation productivity with a positive SOC balance, with an annual C gain up to 2 Mg·ha
−1. The SOC stock in 0–30 cm before launching the experiment was 88.5 Mg·ha
−1. Three treatments of the LTFE were used for simulation: a control without fertilization (control), 80 Mg·ha
−1 of FYM + N
330P
190K
190 on average per crop rotation (treatment 8), and 100 Mg·ha
−1 of FYM + N
580P
330K
330 on average per crop rotation (treatment 11). These treatments of the LTFE are considered as the most contrasting ones for fertilizer rate and source effect on SOC. Specifically, in the treatment, 8 FYM was applied twice per rotation in the black fallow and for silage maize, and the mineral fertilizer rates were N
40, N
90, and N
60 for the first, second, and third wheat, respectively; the other rates were N
60 for grain maize, P
60K
60 for peas, N
40 for spring barley, and N
40P
40K
40 for sunflower. In the treatment, 11 FYM was applied in the same periods, and the mineral fertilizer rates were N
40, N
180P
90K
90, and N
120P
90K90 for the first, second, and third wheat, respectively; the other rates were N
120P
90K
90 for grain maize, N
60 for barley, and N
60P
60K
60 for sunflower. N was applied as AN, P was applied as TSP, and K was applied as MOP. The organic C content was detected in the laboratory using wet oxidation with potassium bichromate + sulfuric acid [
23]. C gain according to the 4 per 1000 initiative was observed in the first 20 years for treatment 11, with an annual input of 4.3–5.7 Mg·ha
−1 of C from crop residues. Additionally, accumulated C was lost in the last two rotations after reducing rates of organic fertilizers [
21]. A database of this experiment was constructed in the EuroSOMNET (European Network of Field Experiments on Soil Organic Matter) format [
24]. In this study, we used the Rothamsted model RothC version 26.3 for the evaluation of SOC. The model considers the effects of soil clay content, monthly temperature, precipitation, evaporation, and C input on the SOC cycle. The initial equilibrium run of the model to match the initial C content provides SOC partitioning across four C pools: readily decomposing plant residues (DPMs), resistant plant material (RPM), microbial biomass (BIO), and humified (HUM) organic matter. The mineralization rates of these pools were described using first-order equations. The SOC of the inert pool IOM is controlled by soil clay content. Each pool has a constant rate of decay (k) per year: for DPM, k = 10, for RPM, k = 0.3, for BIO, k = 0.66, and for HUM, k = 0.02. To check the correctness of the simulations, the RothC model was fitted against the control treatment using the other treatments as independent ones. Our previous papers [
21,
25] include a description of the model, a list of the data required for simulation modeling, the results of the model verification based on the experimental data, and a statistical evaluation of the simulation results using the Modeval model. The two climate change scenarios include the Representative Concentration Pathways (RCPs) used in the IPCC Fifth Assessment Report: RCP4.5 and RCP8.5 [
26]. The first scenario describes moderate changes in the concentration of greenhouse gases in the atmosphere as a result of climate mitigation (650 ppm CO
2-eq at stabilization after 2100), while the second scenario assumes no effective climate mitigation with 1370 ppm CO
2-eq by 2100 [
12]. Climate data for the LTFE were calculated using the “Climate–Soil–Harvest” model based on regional data from the ensemble scenario from 31 global models in CMIP5 [
27]. Predicted climate variables on temperature, precipitation, and potential evapotranspiration were used with a monthly resolution up to 2100. For the simulation of future yields for the three treatments up to 2090 separately for each crop, we used the Selyaninov hydrothermal coefficient (HTC), which is widely applied for the estimation of moistening the territory from drought to excess moisture and used as an indicator of the availability of moisture for plants [
28]. The calculation methodology, which also accounts for the long-term technological trend, is described in detail in Prokopyeva et al. [
29]. The predicted yield for each crop in rotation was used to calculate the carbon input from plant residues using Levin’s approach [
30]. Three economic assumptions were considered as adaptation scenarios (ASs). The first involves changing the structure of agricultural production to ensure maximum profit return (MP). The second imposes a limitation on profit growth via the condition of ensuring a constant or increasing SOM content–carbon maintenance or sequestration (CS). Adaptation includes planned changes in crop rotation and/or organic fertilization rates. For the last condition, we assumed that economic characteristics would remain unchanged at the current level, accounting for changes in climatic conditions (BAU). The current nine-year rotation of crops (BAU) includes 33% row crops, 57% cereals, and 10% fallow. The MP scenario assumes 25% row crops and 75% cereals, while the CS scenario assumes 33% row crops and 66% cereals. The first adaptation scenario is based on an eight-year crop rotation with the following crops: winter wheat, peas, spring barley, maize for silage, winter wheat, peas, winter wheat, and sunflower. The crop rotation in the second scenario is as follows: winter wheat, peas, grain maize, spring barley, maize for silage, winter wheat, peas, winter wheat, and sunflower. Both alternative rotations have no fallow period. The scenarios were drawn using an economic predictive model that considers both the expected climate change and the dynamics of SOC stocks. The outputs of economic modeling are the following: crop rotation structure by crop groups, application rate of FYM per rotation area, initial and final SOM content, and average specific profit per 1 ha.
To create adaptation scenarios, the following equation for the carbon balance was used [
31]:
where
x2,
x3,
x4,
x5,
x11, and
x12 are the percent of perennial grasses in the crop rotation (%); the FYM rate per hectare of crop rotation, with 75% moisture content (Mg·ha
−1); the N fertilizers rate, kg·ha
−1; the % of cereal crops in the crop rotation; the % of row crops in the crop rotation; and the bare fallow % in the crop rotation, respectively.
The coefficients included in the balance equation have the following form:
Details of the economic modeling for planning the annual crop production in an agricultural enterprise, including SOM dynamics as additional economic and environmental criteria, are described in detail in Siptits et al. [
32,
33]. Thus, for each LTFE treatment, the SOC simulation for 2018–2090 was based on 2 RCP × 3 AS. The modeling was performed from January 2018 to December 2090 in a monthly time step.
3. Results
The average yield and the yield ranges for various crops obtained during the experimental period from 1975 to 2018 are presented in
Table 1. One can observe a regular increase in crop yields with an increase in organic and mineral fertilizer application rates in treatments 8 and 11.
Winter wheat and spring barley were the most responsive to fertilization (yield growth by 45% and 47%, respectively), while maize for silage was the least responsive (27%). The biggest increase in yield compared to the control was observed for treatment 8 with the average rate of fertilizers. A further increase in fertilization (treatment 11) resulted in only a 2–11% increase in yield.
For the predicted yield up to 2090, obtained for RCP4.5 and RCP8.5 scenarios, the maximum effect of climate change is expected for the yield of grain maize (an increase of 48–69% to the average values during the experiment), and the least gain is predicted for winter wheat (an increase of 9–19%). In reality, the increase in the wheat yield may be less pronounced due to fallowing elimination, as well as the planting of wheat after sunflower in the alternative crop rotations. A decrease in yields in future climates is predicted for maize for silage (up to 25%), peas, sunflower, and spring barley (12–14%). The decline is predicted to be proportional to the currently observed yields for all of the treatments. For grain maize and winter wheat, a slightly higher increase in yield is expected for the control compared to the fertilized treatments. Relative differences in average predicted yields under the RCP4.5 and RCP8.5 scenarios do not exceed 1% (
Table 2 and
Table 3).
The initial SOC stock in 2018 in the 0–30 cm layer corresponded to 73.9, 81.5, and 82.9 Mg∙ha−1 in the control, treatment 8, and treatment 11.
An analysis of SOC stock dynamics for the period 2018–2090 was carried out, analyzing the effects of crop rotation, the application of organic fertilizers, and bare fallow under different scenarios of the future climate on the ability of the studied soils to accumulate organic matter and the possibility of achieving an annual increase of 4‰ [
21].
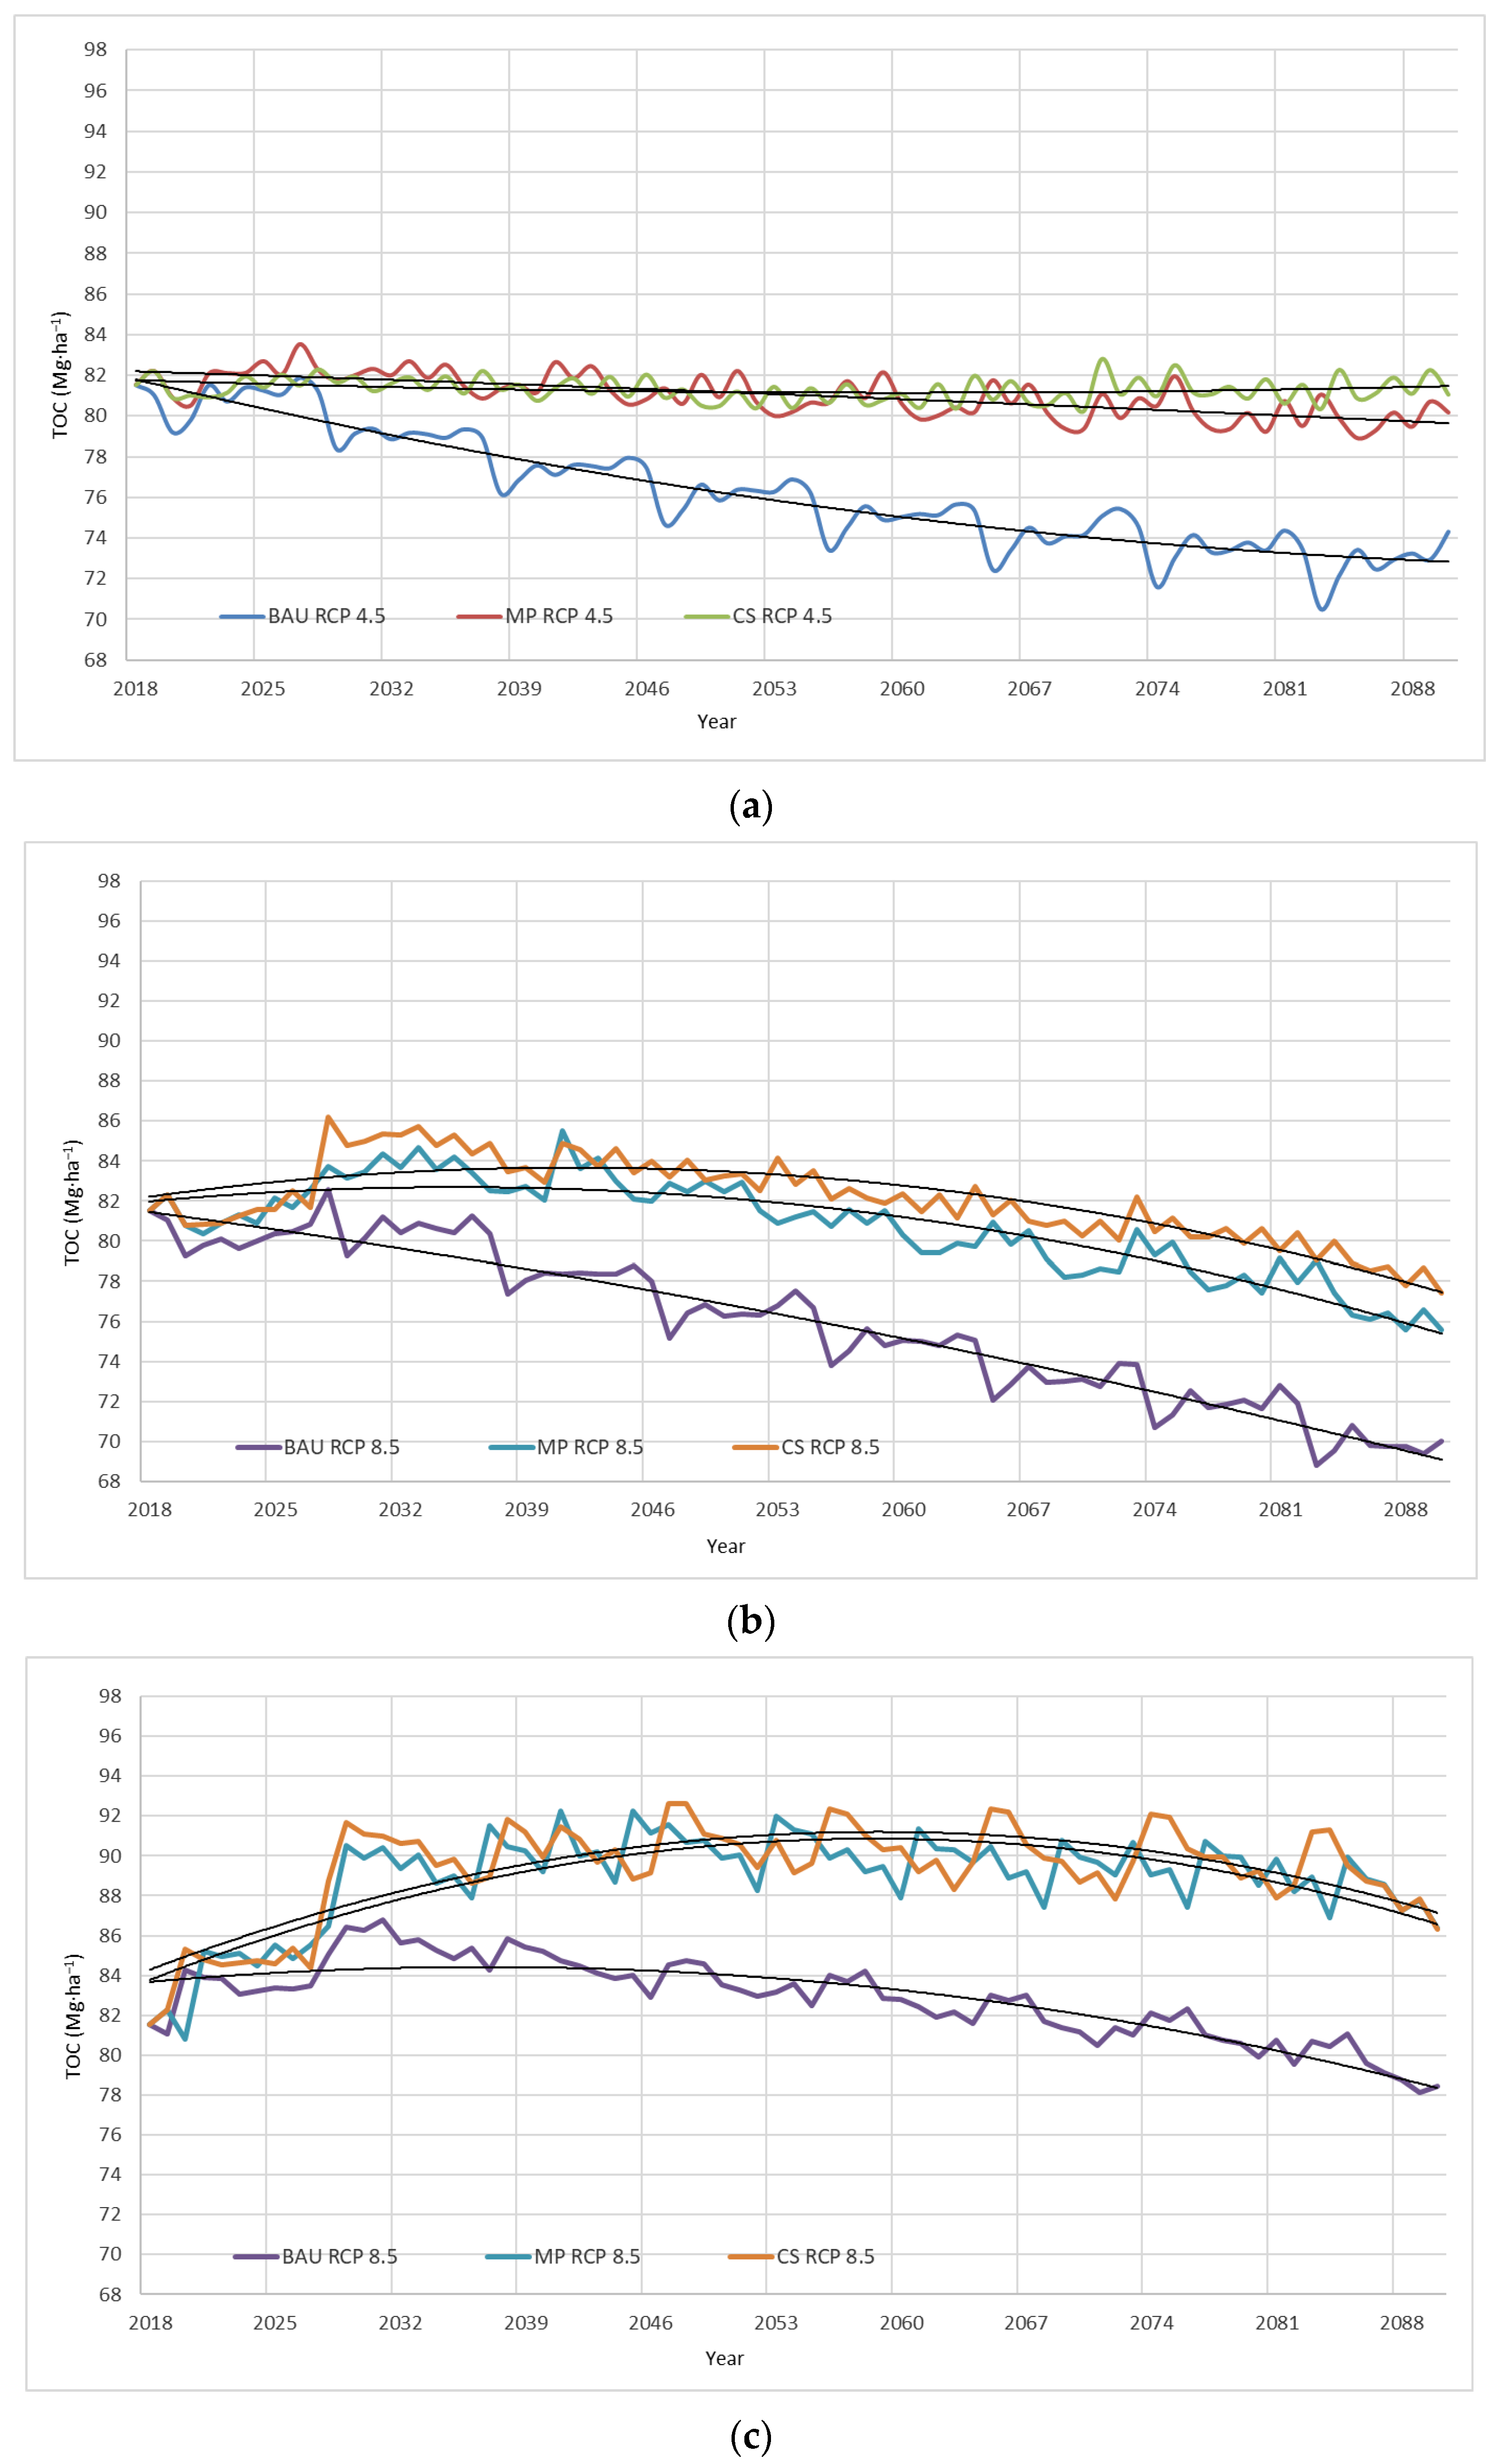
Figure 1 shows the dynamics of carbon stocks in the plow horizon, calculated for two climate change scenarios and three adaptation scenarios (BAU, MP, and CS) for the control treatment of the LTFE.
For both climate scenarios, there is a gradual decrease in SOC stocks (
Figure 1), but under the RCP8.5 scenario, there is a higher rate of SOC stock decline and sharper fluctuations in values associated with fallow. By the end of the simulated period, the difference between the SOC stocks was 1.4, 3.3, and 4.3 Mg·ha
−1 for the BAU, MP, and CS adaptive scenarios, respectively.
Starting in 2018, carbon stock forecasts were performed over a span of twenty years for calculating the rate of SOC dynamics and carbon input (
Table 4). Such a period is usually considered for evaluating the effectiveness of the “4 per 1000” initiative [
21]. The smallest absolute or relative changes in SOC are observed under the MP adaptive scenario and the RCP4.5 climate scenario. By 2090, SOC stocks will remain at the same level as in 2018. This fact allows concluding that even without fertilization, stabilization and even an increase in SOC in the arable layer of Chernozem can be achieved with a properly selected crop rotation. The maximum increase in the absolute SOC values is expected in the first twenty years with the rotation selected for the CS adaptation scenario and the RCP8.5 climate scenario (
Table 4). The largest average annual relative increase in SOC stocks, equal to 0.95‰, is predicted for the period of 2078–2090 under the MP adaptation scenario and the RCP4.5 climate scenario (
Table 5). The smaller proportion of row crop set for the MP rotation shows a higher rate of relative increase in SOC stocks in the final 20-year simulation period, although it results in smaller SOC accumulation by 2090. This suggests that under the CS adaptation scenario, equilibrium may be achieved several decades earlier than under the MP scenario. It is noteworthy that the simulation results confirm the conclusion of our previous study, conducted on LTFE on Luvic Chernozem, that crop rotation has a greater impact on SOC stock dynamics in comparison with climate change [
24].
For treatments 8 and 11, we also simulated the impact of both changes in crop rotation and the application of organic fertilizers on the SOC stock dynamics.
Figure 2 and
Figure 3 show the dynamics of SOC stocks in the arable layer of treatments 8 and 11, respectively, calculated for the RCP4.5 and RCP8.5 scenarios without organic fertilization and for the RCP8.5 scenario with the use of organic fertilizers.
Figure 2 and
Figure 3 show similar patterns of the predicted SOC dynamics for both treatments, which is explained by similar conditions in the amount of crop residues and C inputs with only a slight difference. The initial SOC stocks were 81.5 and 82.9 Mg·ha
−1 in treatments 8 and 11, respectively. The graphs show a significant increase in SOC stocks when FYM is used at rates of 80 and 100 Mg·ha
−1 per crop rotation in treatments 8 and 11, respectively. Both absolute and relative estimates of changes in SOC stocks in the first twenty years show drastic increases (
Table 6 and
Table 7). The RCP4.5 climate scenario and a properly selected crop rotation allow for maintaining SOC stocks at an equilibrium level of 80–82 Mg·ha
−1 and 82–84 Mg·ha
−1 for treatments 8 and 11, respectively, even without organic fertilization. But, achieving the 4 per mille indicators is possible primarily when FYM or other organic fertilizers are applied (
Table 4,
Table 6 and
Table 8).
As shown in
Table 6 and
Table 8, the maximum C gain in absolute values was recorded in the first twenty years under the application of organic fertilization for the RCP8.5 scenario. The SOC stocks increased by 9.4 and 9.5 Mg·ha
−1 in treatment 8, and were even higher in treatment 11 (by 11.8 and 10.9 Mg·ha
−1 in MP and CS adaptation scenarios, respectively). If we compare the values obtained for the RCP8.5 scenario with and without FYM application for both options in the first twenty years (2018–2038), the SOC accumulation rate increases 8–9-fold. In the next twenty years, for the RCP8.5 scenario in both treatments with FYM, equilibrium will be reached with higher SOC stocks than without organic fertilization. The values vary in the range of 88–91 and 91–95 Mg·ha
−1 in treatments 8 and 11, respectively, which is on average 10 and 13 Mg·ha
−1 higher than in the treatments without FYM application.
The maximum SOC accumulation depends primarily on crop rotation and, to a lesser extent, on climatic conditions. In both treatments, the accumulation of SOC in the BAU rotation is observed only when a sustainable SOC stock is reached. This corresponds to 74–75, 81–82, and 83–84 Mg·ha
−1 in the last simulated period of 2078–2090 for the control, treatment 8, and treatment 11, respectively, with FYM application being restored in 2018–2038. The maximum accumulation of SOC is observed in crop rotation with alternative scenarios: MP and CS, in the absence of a black fallow. A more optimistic forecast of changes in CO
2 concentration in the atmosphere, reflected in the RCP4.5 climate scenario, shows the achievement of an equilibrium of SOC stocks by the end of the modeled period; therefore, in both treatments, the values of the average annual changes are close to 0‰ (
Table 7 and
Table 9). Without organic fertilizers, the average annual accumulation is only expected in the first twenty years of 2018–2038 after changing the crop rotation and ceasing fallowing. The maximum accumulation rates of 1.57‰ and 1.73‰ are observed with crop rotation in the CS adaptation scenario for treatments 8 and 11, respectively. The FYM application will significantly increase the SOC accumulation in the first twenty years of the studied period, while an increase in FYM application rates from 80 to 100 Mg∙ha
−1 will only affect the rate at which SOC stocks increase but will not not shift the maximum accumulation over time (
Table 7 and
Table 9).
The predictive modeling results were used to estimate the total annual C input into the soil with crop residues, underground biomass, and organic fertilizers to maintain or increase soil C stocks under future climate conditions. The calculations were carried out separately for the first and second parts of the simulated period (
Figure 4).
4. Discussion
Estimates of the impact of climate change on shift in crop yields are characterized by a rather large degree of uncertainty. The Second Roshydromet Assessment Report on Climate Change and its Consequences in the Russian Federation (2014) estimates a possible decrease in grain yield of 5% in the Southern Federal District by the middle of the 21st century, to the level of 1981–2000 for the RCP4.5 climate scenario, with a subsequent improvement in climatic conditions by 2090 based on the Climate–Soil–Crop model [
34].
Under the RCP8.5 scenario, the predicted decline is 8% and 10%, respectively. In the Third Assessment Report, a possible decrease in wheat yields is estimated at 8% in the period of 2050–2059 [
35]. By the end of the century, the decrease will be about 3% under the RCP8.5 climate scenario due to the expected increase in precipitation by 11% and an increase in air temperature by 0.4–0.8 °C.
Using modeling based on the global agricultural model, Iizumi et al. [
36] predict an increase in wheat yields of more than 50% by the end of the century compared to 2010 for both RCP4.5 and RCP8.5 scenarios. For maize, an increase in yields by 11% under RCP4.5 and a 40% decrease under RCP8.5 are predicted at the average level of technological change over the same period. Müller and Robertson [
37] estimate a possible increase in wheat yields in the trial region by 2050 compared to 2000 under the RCP8.5 scenario based on simulations using the DSSAT model, which is consistent with the yield growth forecast for Central and Eastern Europe. Using the LPJmL model, the authors predict about a 10% yield reduction. Both models show greater convergence in predictions of maize yield, with a slight decline in 2050. A possible reason for the high variability in the modeling data is that Iizumi et al. [
36] considered the fertilizing effect of CO
2. This fertilization effect saturates earlier for C4 crops, to which maize belongs. Müller and Robertson [
37] did not take into account the effect of CO
2 on crop growth. The latter, as a rule, leads to the underestimation of yield results, but does not require additional consideration of changes in cultivation technologies, for example, nitrogen supply limitations.
In our case, in the forecast of future yields, we only considered the effect of climate change and the technological trend; the effect of CO2 was not accounted for. Since the obtained yield estimates tended to be close for cultivated crops under both climate scenarios, we assumed that the amount of C input from plant residues was also the same.
From a comparison of
Figure 1,
Figure 2 and
Figure 3, one can see that for the RCP8.5 scenario, the conditions for SOC accumulation until 2040 turn out to be more favorable, which makes it possible to provide additional accumulation of up to 2 Mg∙ha
−1 SOC without fertilization and up to 4 Mg∙ha
−1 in fertilized treatments compared with the RCP4.5 scenario. But, after 2050, losses of previously accumulated C increase, and as a result, by the end of the modeled period, SOC stocks turn out to be 4–6 Mg∙ha
−1 C less than under the RCP4.5 scenario. To some extent, this reflects the accelerated temperature increase under the RCP8.5 scenario; the difference between both scenarios will be 2.2 °C by the end of the century. A map of the temperature vulnerability of SOC stocks discussed by Vargas-Rojas et al. [
4] shows that in the region of the LTFE, the loss of soil C with an increase in air temperature can occur but is not as pronounced as in higher latitudes. If we use the approach of Clivot et al. [
20], who summarized the data of 60 long-term European experiments, a state close to equilibrium is characterized by annual changes in C stocks of ±0.1 Mg∙ha
−1 or 2 Mg∙ha
−1 over a twenty-year period. In this case, the RCP4.5 scenario provides such a state for the entire simulation period, as well as the RCP8.5 scenario for the period up to 2058; after this, the losses accelerate compared to RCP4.5, which is visible for all experimental treatments (
Table 4,
Table 6 and
Table 8).
Differences in alternative rotations of MP and CS are due to the introduction of one field of maize instead of barley. Steady differences in C stocks are visible by the end of the modeled period, after 2070, and are more pronounced for the RCP8.5 scenario. The CS crop rotation provides an additional accumulation of 1.5–2 Mg∙ha
−1 of SOC, but in the treatments with the organic–mineral fertilizer system, this effect is much less pronounced against the background of increased interannual variability in SOC stocks, which is noticeable in
Figure 2c and
Figure 3c with the maximum rate of FYM.
The elimination of the fallow field in the crop rotation is of critical importance since losses of 3.5–4 Mg∙ha
−1 C are possible during the fallow period. The application of FYM will ensure the maintenance of C stocks at the level of 84 Mg∙ha
−1 for the RCP8.5 scenario and 87 Mg∙ha
−1 for RCP4.5, only until the middle of the 21st century. Then, a decrease in C stocks compared to the beginning of the simulation period occurs. The same results were also obtained when modeling SOC dynamics in an LTFE experiment with a fallow field on Luvic Chernozem, with lower initial C stocks [
26]. According to Poeplau and Don [
4], C sequestration in arable soils can be accelerated by replacing bare fallow with cover crops. The obtained results for Chernozems confirm the importance of bare fallow for SOC dynamics. This measure should be offset by changes in management practices that will maintain high crop yields and prevent the spread of weeds and pathogens. Adaptation scenarios MP and CS show the prospect of expanding areas with cereals, provided that the applied agricultural technologies will ensure sufficient yields of winter wheat in the absence of fallow as the best predecessor.
During 70 years of predictive modeling for the control treatment, a steady decline in SOC stocks is expected, but the rate of decline is slower than in the first 40-year period [
18]. This can be the result of more favorable climatic conditions that change the C input with plant residues and the processes of SOM accumulation and mineralization, as well as cause a decrease in the rate of losses with progressive soil plowing [
3,
19]. This trend can be explained by the change in the ratio of SOC pools, i.e., an increase in the proportion of more stable SOM fractions and the achievement of an equilibrium state. While C dynamics for the BAU scenario can be well described using a linear C loss model, it can be assumed that changes in C stocks predicted by the RothC model under future climate conditions mainly reflect differences in mineralization rates due to changes in temperature and humidity. It is enough to remove one fallow field from the rotation to maintain the current stock of 73 Mg∙ha
−1 SOC. But, even without the application of organic fertilizers, it is possible to reach the equilibrium level faster due to a proper crop rotation with crops that contribute the largest C input after harvest. This approach could potentially be more attractive under the RCP4.5 scenario compared to the RCP8.5 scenario, which did not achieve a sustained level of SOC stocks over the forecast period.
Using the CS adaptation scenario instead of BAU allows for 10% more SOC accumulation by the end of the simulated period, for both of the experimental treatments (8 and 11). The SOC dynamics are close for both of the climate scenarios, but RCP8.5 shows higher values of SOC stocks in the first half of the 21st century than RCP4.5, although in the second half of the century the stocks gradually decrease in both management scenarios. Thus, RCP4.5 seems to be somewhat more favorable for SOC accumulation without the use of organic fertilizers, which is inconsistent with the conclusions made in a previous study on Luvic Chernozem [
26].
Minasny et al. [
21], assessing the possibility of sequestration for various management practices, indicate that with SOC stocks in the upper layer of about 80 Mg∙ha
−1, maintaining the initial stocks is more possible than providing a 4‰ or higher annual increase in SOC stock. Nevertheless, our LTFE shows an increase in SOC stock at a rate of 4‰, and more is possible, although this will be limited until 2038. To achieve this, it is necessary to correct the crop rotation and apply FYM, making it possible to compensate for the observed SOC losses of 7–9 Mg∙ha
−1 for 2000–2015 after the cessation of organic fertilization [
22]. However, with only mineral fertilization in treatments 8 and 11 (
Figure 2a,b and
Figure 3a,b), the SOC stocks will not exceed those for arable Luvic Chernozems of the study area (83.6 ± 1.4 Mg∙ha
−1) [
22]. It is assumed that the arable Chernozems have lost about 1/3 of the SOC stocks in native soils. The application of manure makes it possible to achieve a maximum accumulation of 7–10 Mg∙ha
−1 C (
Figure 2c and
Figure 3c), i.e., not more than 25% of the lost SOC stocks by native soils, although this accumulation may be unstable under the conditions of the future climate scenario RCP8.5, and part of the additionally accumulated SOC will be lost later. However, if we divide graphs 2c and 3c into two time periods, then the first characterizes a linear relationship between C inputs and SOC stocks during the first two decades, while the second resembles the potential SOC storage [
19] more, assuming the saturation behavior described by RothC [
8,
16]. Against this background, the interannual variability in C stocks in alternative crop rotations can be 4–5 Mg∙ha
−1, even in the absence of a fallow field.
Since the differences between BAU and adaptation scenarios in all cases turned out to be greater than the differences due to the RCP4.5 and RCP8.5 climate scenarios, it can be assumed that changes in agricultural technologies for Chernozems with large SOC stocks have a greater effect than climate change. With a properly selected and timely performed adaptation scenario, its effect on C sequestration will be greater than the effect of climate. Rolinski et al. [
15], with the LPJmL model for Chernozems in the south of European Russia, demonstrated that the variation in SOC as affected by different climate scenarios was smaller compared with the land-use scenarios.
However, the obtained results reflect the complexity of sequestration management in Chernozems. Accumulation rates in the most favorable periods do not exceed 0.5 Mg∙ha
−1 per year, and their duration is about 20 years. Accumulated SOC stocks can be lost at a rate of 0.25–0.3 Mg∙ha
−1 per year (
Table 6 and
Table 8), and the accumulation of additional C stocks leads to an accelerated loss later. The absolute accumulation values are much lower than the values of 1 Mg∙ha
−1 per year given by Freibauer et al. [
9] in assessing the impact of changing agricultural practices on C sequestration. Wang et al. (2009) note that fertilizers play an important role in the long-term management of C stocks on arable Chernozems, provided that they increase the total plant biomass and also the biomass of residues that return to the soil [
18]. Experimentally confirmed results of maintaining C stocks and their accumulation in the 0–10 and 10–20 cm layers with increasing rates of mineral and organic fertilizers in arable Chernozem over a 25-year period have been demonstrated in the studies of Orekhovskaya et al. [
38].
A comparative assessment of both climate scenarios based on the annual amount of C input necessary to maintain C stocks shows that in 2055 the RCP8.5 scenario will be more favorable because it requires less C input: 2.63 Mg∙ha
−1·yr
−1 compared with 2.93 Mg∙ha
−1·yr
−1 for RCP4.5. To achieve an increase of 4‰ in SOC stocks, the same trend persists: it is necessary to provide inputs of 7.63 and 6.29 Mg∙ha
−1·yr
−1 for the RCP4.5 and RCP8.5 scenarios (
Figure 4). The estimates obtained using the model during the period of the experiment for 1975–2015 were 3.87 to maintain C stocks and 5.82 Mg ha
−1·year
−1 to increase them by 4‰ annually [
22]. Thus, under the conditions of the future climate, one can expect that maintaining the current C stocks requires a smaller C input, if an increase in the current C stocks requires a higher C input than in the current period. Most likely, the decrease in estimates of the required C input is due to a decrease in C stocks of 8.3–15% since the start of the experiment.
When estimating the required average input C until 2090, the climate scenario RCP4.5 is the most favorable for carbon sequestration. For this, the estimated C input is close to 2055. Against the background of more intense losses of accumulated C stocks under the RCP8.5 scenario, by the end of the modeled period, to maintain the current stocks, it will be necessary to ensure a supply of C of 4.68 Mg∙ha
−1·year
−1, and for an increase of 4‰ it will be 11.16 Mg∙ha
−1·year
−1. This C input is twice as much as the current estimates and seems unrealistic. It is noteworthy that the obtained estimates for C input to maintain initial stocks or to increase them by 4‰ for the RCP8.5 scenario are close to those given by Riggers et al. [
3] for 2090–2099 for arable land in Germany, but significantly exceed those for RCP4.5. In this study, the initial stocks of C in arable soils were estimated at 58 Mg∙ha
−1, which is less than in our experiment. The modeling was carried out using a set of carbon models that included RothC.
But, it should be noted that the simulation results confirm the role of changing crop rotation with the application of sufficient rates of organic fertilizers in soil C accumulation, and the possibility, as discussed above, of achieving the goal of increasing SOC by 4‰ annually, in any case, over a 20-year period.


 ,
, 


