Article

Morphology and SSR Markers-Based Genetic Diversity Analysis of Sesame (Sesamum indicum L.) Cultivars Released in China

1
Key Laboratory of Biology and Genetic Improvement of Oil Crops, Ministry of Agriculture, Oil Crops Research Institute of Chinese Academy of Agricultural Sciences, Wuhan 430062, China
2
Xiangyang Academy of Agricultural Sciences, Xiangyang 441057, China
*
Author to whom correspondence should be addressed.
Agriculture 2023, 13(10), 1885; https://doi.org/10.3390/agriculture13101885
Submission received: 1 September 2023 / Revised: 17 September 2023 / Accepted: 25 September 2023 / Published: 27 September 2023
(This article belongs to the Section Genotype Evaluation and Breeding)

Abstract

:
Sesame is a highly valuable crop with significant global importance due to its nutritional and economic value. To better understand the genetic diversity of sesame genotypes at both molecular and morphological levels, a comprehensive study was conducted using 25 pairs of simple sequence repeat (SSR) primers and 56 biological traits in a collection of 183 sesame accessions, which comprised 101 Chinese cultivars, 62 landraces, and 20 exotic accessions. The analysis revealed a total of 166 SSR polymorphic bands, with an average of 6.64 bands per marker. The values of Shannon’s information index ranged from 0.2732 to 0.6497, indicating a moderate level of genetic diversity. The polymorphic information index ranged from 0.0859 to 0.6357, further supporting the presence of genetic variation. The average frequency of heterozygous genotypes was calculated as 0.34, suggesting a relatively narrow genetic diversity. The application of the unweighted pair group method with arithmetic averaging (UPGMA) clustering and principal component analysis allowed for the categorization of the 183 sesame accessions into three distinct groups. Furthermore, the genetic diversity coefficient of sesame germplasm is generally constrained, with no significant difference observed between the genetic diversity coefficient of Chinese cultivars and that of foreign resources. The results provide valuable data for various applications, including the breeding and promotion of new sesame cultivars in China, the protection of new variety rights, the inquiry and identification of DNA genetic information of cultivars, as well as the development and utilization of sesame germplasm resources both domestically and internationally.

1. Introduction

Sesame (Sesamum indicum L.) is an annual herbaceous plant that belongs to the flax family [1,2]. Sesame is widely cultivated in tropical and subtropical regions spanning a wide range of latitudes, from approximately 40° N to 40° S. It is grown in more than 50 countries in the world [3]. The seeds are rich in fat, protein, vitamin E, and other nutrients, as well as sesamol, sesamin, and other antioxidant substances [3,4]. It is a good antiaging and health product [5]. All parts of the sesame plant have a wide range of uses. For instance, the oil extracted from sesame seeds has an aromatic smell [6] and can be used as cooking oil and also for medicinal purposes [7,8]. Sesame pastries are an integral part of traditional cuisine and have gained immense popularity among individuals of all ages [9]. Sesame leaves are rich in vitamins, calcium, magnesium, selenium, and other trace elements. In the Henan province and its neighboring regions in China, the consumption of sesame leaves is a common culinary practice. Therefore, sesame leaves have become a popular choice for incorporation into various dishes as a delicious and nutritious vegetable option [7]. Sesame leaves are not only a culinary delight but also a valuable source of flavonoids, known for their stable composition and resistance to degradation. This makes sesame leaf an excellent choice as a cosmetic additive, offering potential benefits for skincare. Additionally, the vibrant and attractive sesame flowers have the unique ability to attract bees, resulting in the production of high-quality honey. The consumption of this honey can potentially aid in the prevention of chilblains and hypoglycemia, showcasing the multifaceted advantages of sesame flowers [10]. Flower tea made from sesame buds has gradually become a healthy food and is highly attractive to young people. A growth/culture medium derived from sesame stalks offers numerous benefits for cultivating mushrooms, while the mature stem of sesame also contributes to the ripening process of persimmons. In recent years, China has witnessed notable progress in sesame production, processing, trade, and policy support. However, there are still areas that require attention, particularly in the research and development of machinery for sesame harvesting and the breeding of new cultivars suitable for mechanized harvesting. The lack of advancements in these areas has resulted in increased production costs and decreased efficiency, posing significant challenges to the growth of the domestic sesame industry. The demand for edible oil in China has been steadily rising, leading to a growing gap between the supply and demand of domestic edible vegetable oil. Consequently, improving the production efficiency of sesame has emerged as a key objective within the sesame community.
Morphological traits, such as growth habit, plant height, plant type, leaf shape, leaf arrangement, flower color, stem color at maturity, capsule color at maturity, hairiness of the stem, number of flowers and capsules per leaf axil, number of carpels per capsule, seed count per capsule, days to flower, days to maturity, seed coat color, seed yield, and other agronomical traits, were considered the most representative agro-morphological traits used to estimate the genetic diversity of sesame [11]. However, these agronomical traits are prone to being affected by the environment. The other methods for variety identification using physiological and biochemical measurements are also affected by the environment, making the accuracy and authenticity of identification inefficient.
Molecular markers have become invaluable in molecular biology techniques for accurately determining the purity and authenticity of cultivars. These markers offer numerous advantages, including reliability, abundant information, rapid detection, and convenience [12]. Various universal markers, such as random amplified polymorphic DNA (RAPD) [4,13], amplified fragment length polymorphism (AFLP) [14], inter-simple sequence repeat (ISSR) [15], genomic simple sequence repeat (gSSR) [16], chloroplast simple sequence repeats (cpSSRs) [17], and expressed sequence tag (EST)-SSR [18], have been extensively utilized to assess the genetic diversity in sesame. Among these markers, SSRs stand out due to their desirable characteristics, including fidelity, co-dominance, chromosome specificity, polymorphism, and reproducibility [19]. Notably, the sesame project successfully developed 19,816 nonredundant SSR markers [20], and Wei et al. identified 7702 EST-SSRs from sesame transcriptomes [21]. These markers have played a crucial role in evaluating and characterizing the diversity of sesame germplasm from different origins and wild species [22,23,24,25,26], owing to the availability of the sesame whole genome sequence [27]. Additionally, SSR markers have also been applied to other vegetable crops such as pepper [28], tomato [29], and vegetable soybean [30]. Despite the widespread use of SSR markers in sesame research, no specific efforts have been made to evaluate the genetic diversity of Chinese modern sesame cultivars.
In this study, our primary objective was to evaluate the genetic diversity present in a collection of sesame accessions mainly comprising Chinese cultivars. By integrating SSR markers and agronomical traits, we aim to: (1) gain comprehensive insights into the genetic diversity of sesame, (2) assess the influence of breeding practices on its genetic composition, and (3) identify valuable molecular markers that can be utilized for the precise identification and conservation of these cultivars.

2. Materials and Methods

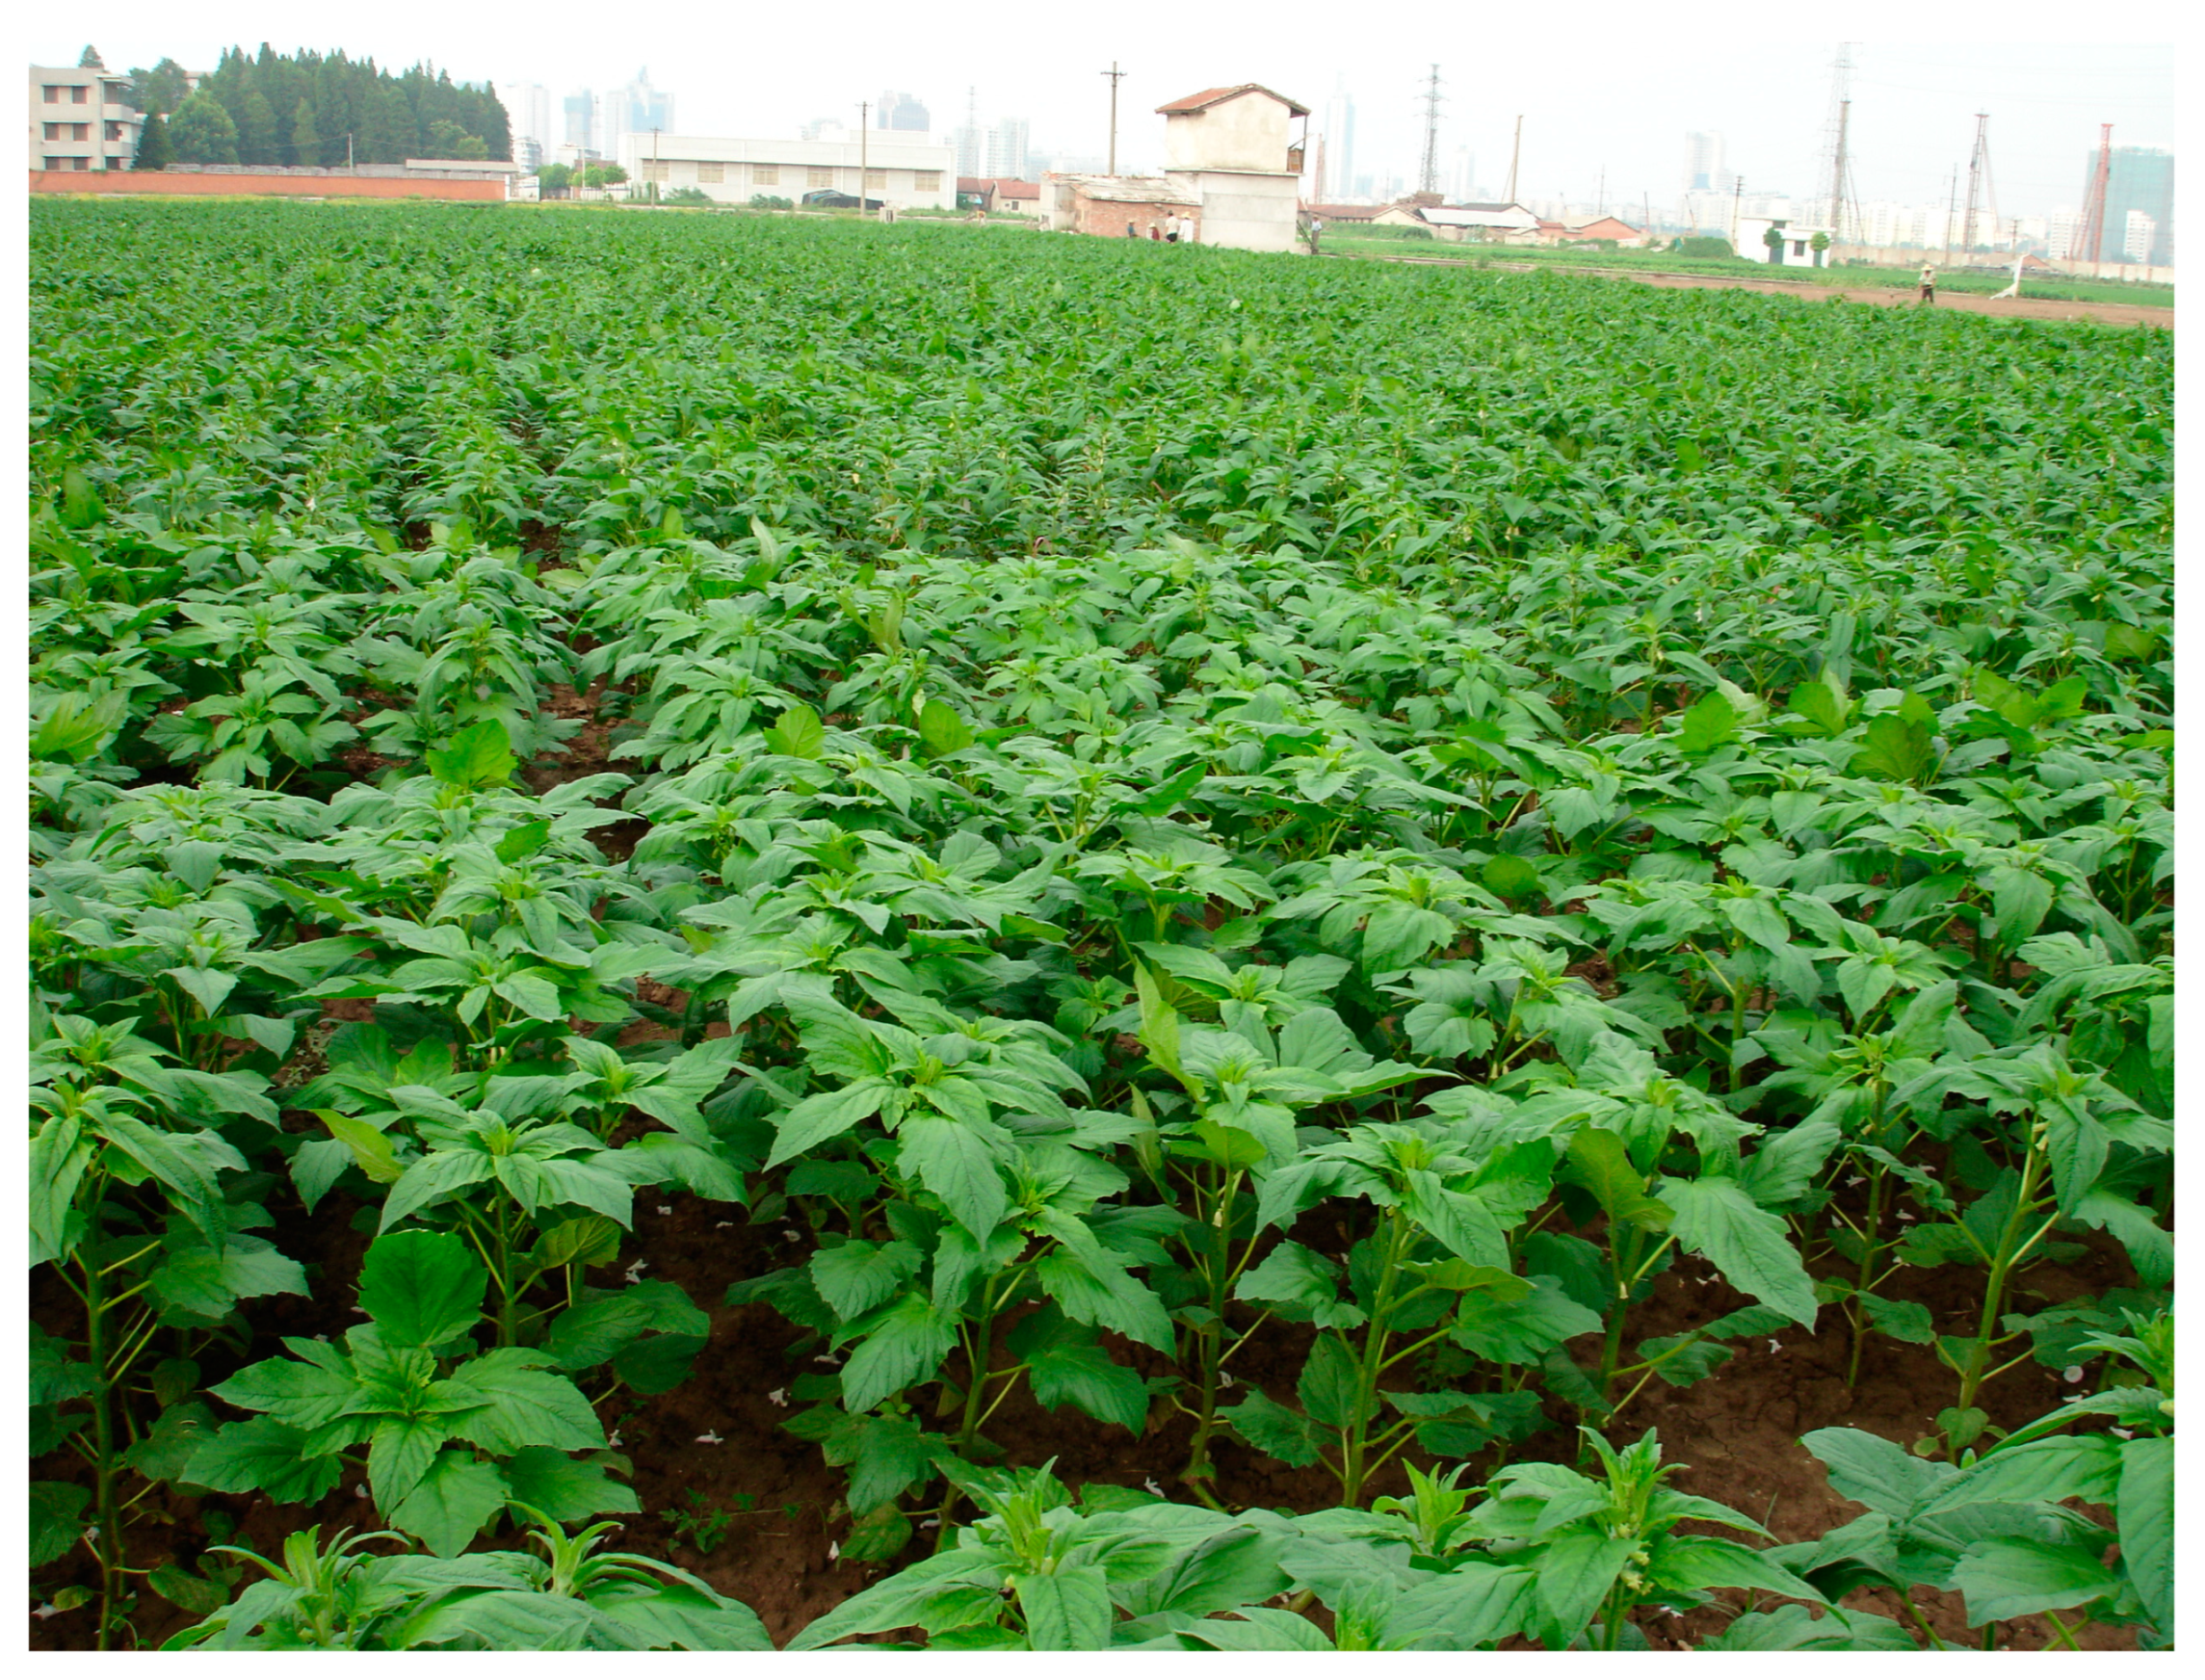
2.1. Plant Materials

This study utilized a comprehensive collection of 183 sesame accessions as the primary plant materials. These accessions were empirically classified into three distinct accession types: Chinese cultivar (CC), Chinese landrace (CL), and exotic accession (EA) obtained from various regions across Asia, Africa, and America. Among these accessions, 101 belonged to CC, while 62 were CL. Furthermore, the study included 20 EA, resulting in a diverse and representative collection (Supplementary Materials, Table S1). All of these sesame accessions were sourced from the Chinese Midterm Oil Crops GenBank affiliated with the Oil Crops Research Institute of the Chinese Academy of Agricultural Sciences (CAAS), as well as the Xiangyang Academy of Agricultural Sciences in China.

2.2. Morpho-Physiological Investigation

A comprehensive morpho-physiological analysis of the 183 sesame accessions was conducted through a two-season field experiment at the experimental station of CAAS (114.31° E, 30.52° N, altitude 27 m). The experimental station’s soil composition is characterized by a well-balanced mixture of clay, silt, and sand, creating an optimal environment for crop growth. Sesame plants were cultivated during the summer season, specifically from May to October in the year 2021–2022. The experiment followed a randomized block design, with three replications to ensure reliable and statistically significant results. The planting arrangement included a row spacing of 0.4 m and a distance of 0.15 m between individual plants within each row. Five plants were randomly selected and tagged in each plot to determine the agronomical traits. A total of 56 morphological and agronomical characteristics related to growth, branching, leaf and stem morphology, flower, capsule, and seed traits, as well as flowering time and seed maturity were recorded for each plant based on the descriptors and data standard for sesame [31].
To evaluate drought tolerance, three replicated pots were used, each containing two plants per genotype. Drought stress was induced at the early flowering stage by withholding water for 7 d, followed by rewatering for recovery. The survival rate was recorded and used to score drought tolerance on a scale of 1 (most tolerant) to 9 (most sensitive). For the waterlogging stress experiment, a greenhouse was utilized. Pots with plants at the early flowering stage were submerged in tap water, maintaining a water level 3 cm above the soil surface for 36 h before draining to allow plant recovery. The severity of symptoms was recorded to assess the level of waterlogging tolerance [31].
The identification of stem blight disease caused by Macrophomina phaseoli involves two steps: field-induced identification and re-identification of resistant accessions. In the field-induced method, artificial disease plots are established in areas where the disease is prevalent. Sesame plants are grown and irrigated, if necessary, and disease grading is performed before the plants reach maturity. In the artificial inoculation method, different sesame accessions are arranged and the disease is induced using a suspension of fungi. Grading criteria are then used to evaluate the resistance or susceptibility of the genotypes [31].

2.3. Total DNA Extraction

Sesame seeds were germinated and grown in a plant growth chamber at 25 °C for 10 d. Fifteen ten-day-old seedlings per accession (around 10 g) were collected for total DNA extraction using the optimized CTAB method [32]. In this extraction process, 1.0 mL of extraction buffer was added to a grinding bowl where the seedlings were rapidly ground to achieve a homogenate. The homogenate was then placed in a water bath set at 60 °C for 1 h to facilitate extraction. Following this, an equal volume of chloroform:isopropanol mixture (24:1) was added to the sample and gently mixed. The mixture was subsequently subjected to centrifugation at 12,000 r/min for 15 min, allowing the supernatant, containing the desired components, to be obtained. Afterward, frozen absolute ethanol was added to precipitate the DNA. Finally, the DNA precipitate was rinsed l–2 times with 76% (v/v) ethanol, dried at about 25 °C, and dissolved with TE buffer. Two microliters of the mixture were used for electrophoresis to measure its mass and concentration, and then the DNA concentration was uniformly adjusted to 25 ng/μL.

2.4. Simple Sequence Repeat (SSR) Detection

A set of 25 SSR primer pairs was selected from references [33,34] and synthesized by Sangon Biotech (Shanghai, China) Co., Ltd. (Supplementary Materials, Table S2). PCR amplification reactions were carried out with a 10 µL reaction volume consisting of 2.5 µL of genomic DNA (25 ng/µL), 0.9 µL each of forward and reverse primers (50 ng/µL), 1.2 μL of Mg2+ (25 mmol/L), 0.3 μL of dNTPs (10 mmol/L), 0.3 μL of Taq enzyme (5 U/μL), 0.7 μL of 10× reaction buffer, and 4.1 μL of ddH2O. The PCR reactions were performed using the MJ PTC100 Thermocycler (Thermo Fisher Scientific Inc., Waltham, MA, USA). The protocol included an initial cycle at 94 °C for 3 min, followed by 40 cycles consisting of 30 s at 94 °C, 30 s at 60 °C, and 45 s at 72 °C. Subsequently, a final incubation step of 5 min at 72 °C was conducted, followed by cooling at 4 °C. The visualization of PCR products was accomplished via silver staining after separating them on 6% denaturing polyacrylamide gels.
PCR amplification was performed for the 183 sesame genotypes, and each primer pair was amplified at least three times. To prevent the phenomenon of inconsistent data reading due to high or low and continuous peaks, each group of experimental data was read by two people independently. The comparison of the experimental data and manual proofreading was then carried out. Finally, a set of fingerprint data with 100% integrity was obtained.

2.5. Data Analysis

The morpho-physiological data were analyzed using HEMI 2.0 software and the web tool ClustVis 1.0 for hierarchical clustering heatmap visualization [35,36]. To classify the accessions based on these trait data, principal component analysis (PCA) was performed after standardizing the variables, and the Spearman coefficient was used to assess the correlation among the variables. The covariance matrix was then utilized to determine the principal components of the data. In the PCA analysis, factor loadings higher than 0.55 were considered significant, and biplots were generated to visualize the first two most important principal components. Additionally, for agglomerative hierarchical clustering, Ward’s method was employed [37].
The electrophoresis bands were manually observed and categorized as either clear bands (1) or bands without any presence (0). Subsequently, various indexes were derived from the SSR marker data, including the number of alleles, polymorphism information content (PIC) value, primer distinguishing power (DP), and Shannon index (SI) for each primer pair. Additionally, the frequency of heterozygous genotypes and the number of different sites between pairs were determined. Furthermore, the data were used to assign genotypes to three distinct groups, with calculations made for the total number of alleles, average frequency of heterozygous genes, and gene diversity values within each group. The above statistical analysis was performed using the Popgene32 software [38].
To deepen our understanding of the genetic connections between Chinese cultivars and other accessions, we conducted genetic distance calculations, systematic clustering analysis, and principal coordinate analysis on 183 genotypes. We utilized NTSYSpc version 2.1 software (Exeter Software, Setauket, NY, USA) to construct an unweighted pair group method with arithmetic averaging (UPGMA) clustering tree and perform binary coordinate analysis. By integrating the genetic distance matrix and systematic clustering results, we conducted a coordinate analysis of the 183 sesame accessions using the R package and generated scatter plots to visualize the results.

3. Results

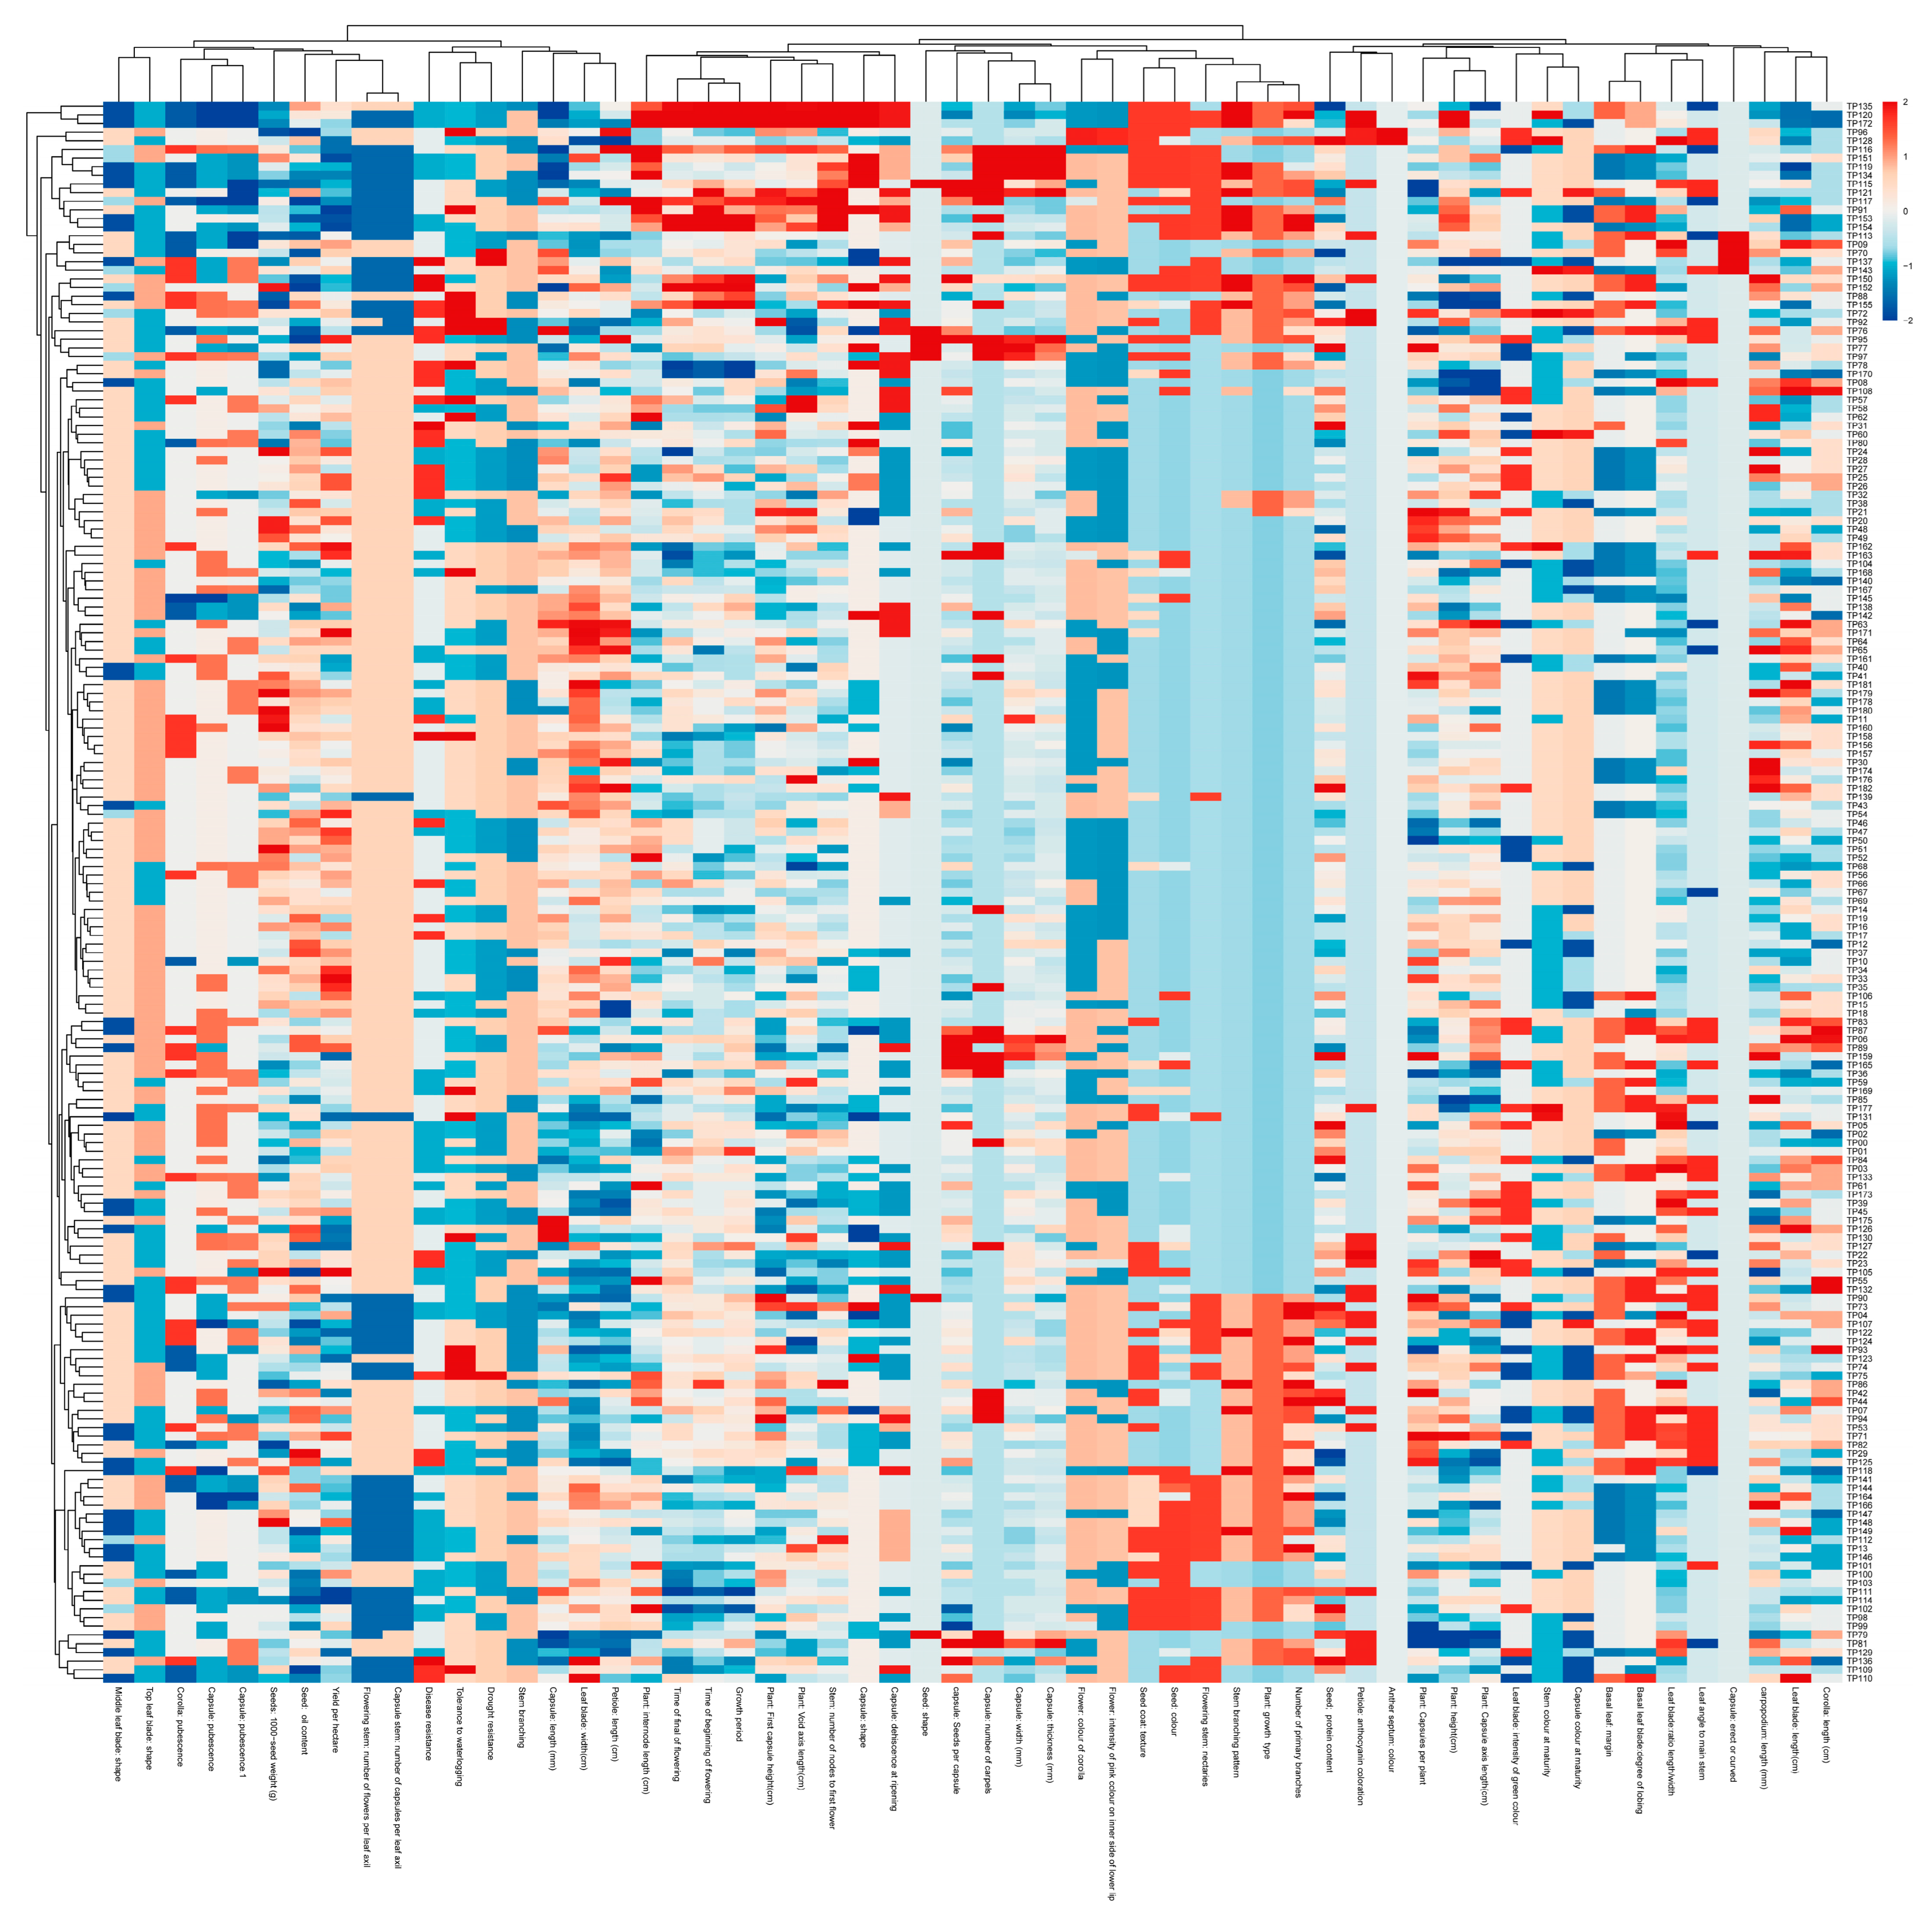
3.1. Morphological and Agronomical Diversity of the Sesame Accessions

To evaluate the phenotypic variability within the 183 sesame accessions, we conducted a comprehensive analysis of 56 morphological and agronomical traits encompassing growth, branching, leaf, stem, nectary, flower, capsule, and seed characteristics, as well as flowering and maturation times, growth period, drought resistance, waterlogging tolerance, and disease resistance in the field (Figure 1). The sesame genotypes exhibited a wide range of diversity in their morphological traits, with notable variations observed in corolla length, leaf blade length, carpopodium length, leaf blade length/width ratio, plant height, number of capsules per plant, seed protein content, number of seeds per capsule, number of nodes required for the first flower, void axis length, first capsule height, growth period, time of the beginning of flowering, time of final flowering, inter-node length, petiole length, leaf blade width, capsule length, yield per hectare, seed oil content, and 1000-seed weight (Figure 2; Supplementary Materials, Table S3).
Many cultivars exhibited a large variation in specific traits. For instance, an erect or curved capsule was observed for the cultivars ‘Zhongzhi No.12’, ‘Xiniujiao’, ‘Xinheheizhima’, ‘Raofengbaizhima’, and ‘777nongyanfa’. For the above cultivars, the number of carpels that produced the erect type was two or four, but occasionally there was one carpel showing the curve type. Furthermore, ‘Xiangheizhi2078’ and ‘Zihuayeersan’ showed the highest values in another trait, i.e., septum color. The same pattern was observed among the 183 genotypes for the number of flowers per leaf axil, capsules per leaf axil, and nectary (Supplementary Materials, Table S3). Notably, two alien accessions, i.e., ‘NA1’ from Vietnam and ‘C-50’ from India, were regarded as outliners, which showed a distinct pattern in the morphological variables (Figure 2).
We also compared the traits among the three accession types: CC, CL, and EA. Notably, CC stands out with an impressive average seed yield of 1078.1 kg/ha, surpassing both CL and EA by a significant margin of 20% (Supplementary Materials, Table S4). This remarkable result suggests that breeding selection and heterosis utilization have greatly contributed to enhancing this trait in CC. Additionally, the oil content in CC seeds was significantly higher, with a mean of 55.5%, compared with the EA. However, it is worth mentioning that the growth period of CC was the shortest, averaging 92.9 days. This represents a noteworthy decrease of 17.5% compared with the EA type (Supplementary Materials, Table S4).
An analysis of the Spearman correlation matrix showed a diverse range of both positive and negative correlations among the examined traits (Supplementary Materials, Table S2). Strong positive or negative correlations were observed between the 1000-seed weight and many other traits such as yield per hectare (−0.9309 **), stem branching pattern (−0.9552 **), petiole length (−0.9517 **), corolla length (0.9078 **), number of carpels (0.9096 **), and number of capsules per leaf axil (0.9432 **). The most significant negative correlations were observed among the nectary, the number of capsules per leaf axil (−1.0000 **), and the number of flowers per leaf axil (−0.9725 **). The correlation coefficient between the nectary and other characters is opposite to those for leaf axillary and other characters. Furthermore, there was a positive correlation observed between the plant growth type and the number of primary branches (0.8988 **), as well as the stem branching pattern (0.8889 **). The time of flower beginning was also positively correlated with the time of terminal flowering (0.8163 **) and growth period (0.8808 **). Other significant correlations included the following: (i) the time of final flowering was positively correlated with the growth period (0.8324 **); (ii) the 1000-seed weight was positively or negatively correlated with protein content (−0.8955 **), number of primary branches (0.8925 **), capsule shape (−0.9096 **), presence/absence of nectary (0.8842 **), and seed coat texture (−0.8539 **); (iii) the leaf margin was positively correlated with basal leaf degree of lobing (0.8544 **); and the capsule thickness was associated with capsule width (0.8889 **) (Supplementary Materials, Table S5).

3.2. Polymorphism of the SSR Markers

The number of polymorphic bands, as detected using 25 pairs of SSR primers in the 183 sesame accessions, was found to be three for each marker (Table 1). The range of detected alleles per marker varied from 1.23 to 1.85, resulting in a total of 40.35 alleles identified. On average, 1.61 alleles were found. Of these, the primer LG141 detected the largest number of alleles (1.85), while SB393 detected the least (1.23 alleles). The range of PIC values observed was between 0.086 and 0.636, with an average of 0.525; most of the values fell within the range of 0.50–0.63. The DP value indicates the ability of a primer pair to differentiate the sesame genotypes tested; the higher the value, the stronger the DP. The DP value of the 25 SSR primers ranged from 0.456 to 0.813 (mainly between 0.70 and 0.80), with an average value of 0.721. The major allele frequencies varied between 0.24 and 0.49 (mostly between 0.27 and 0.43), with an average of 0.34 (Table 1).

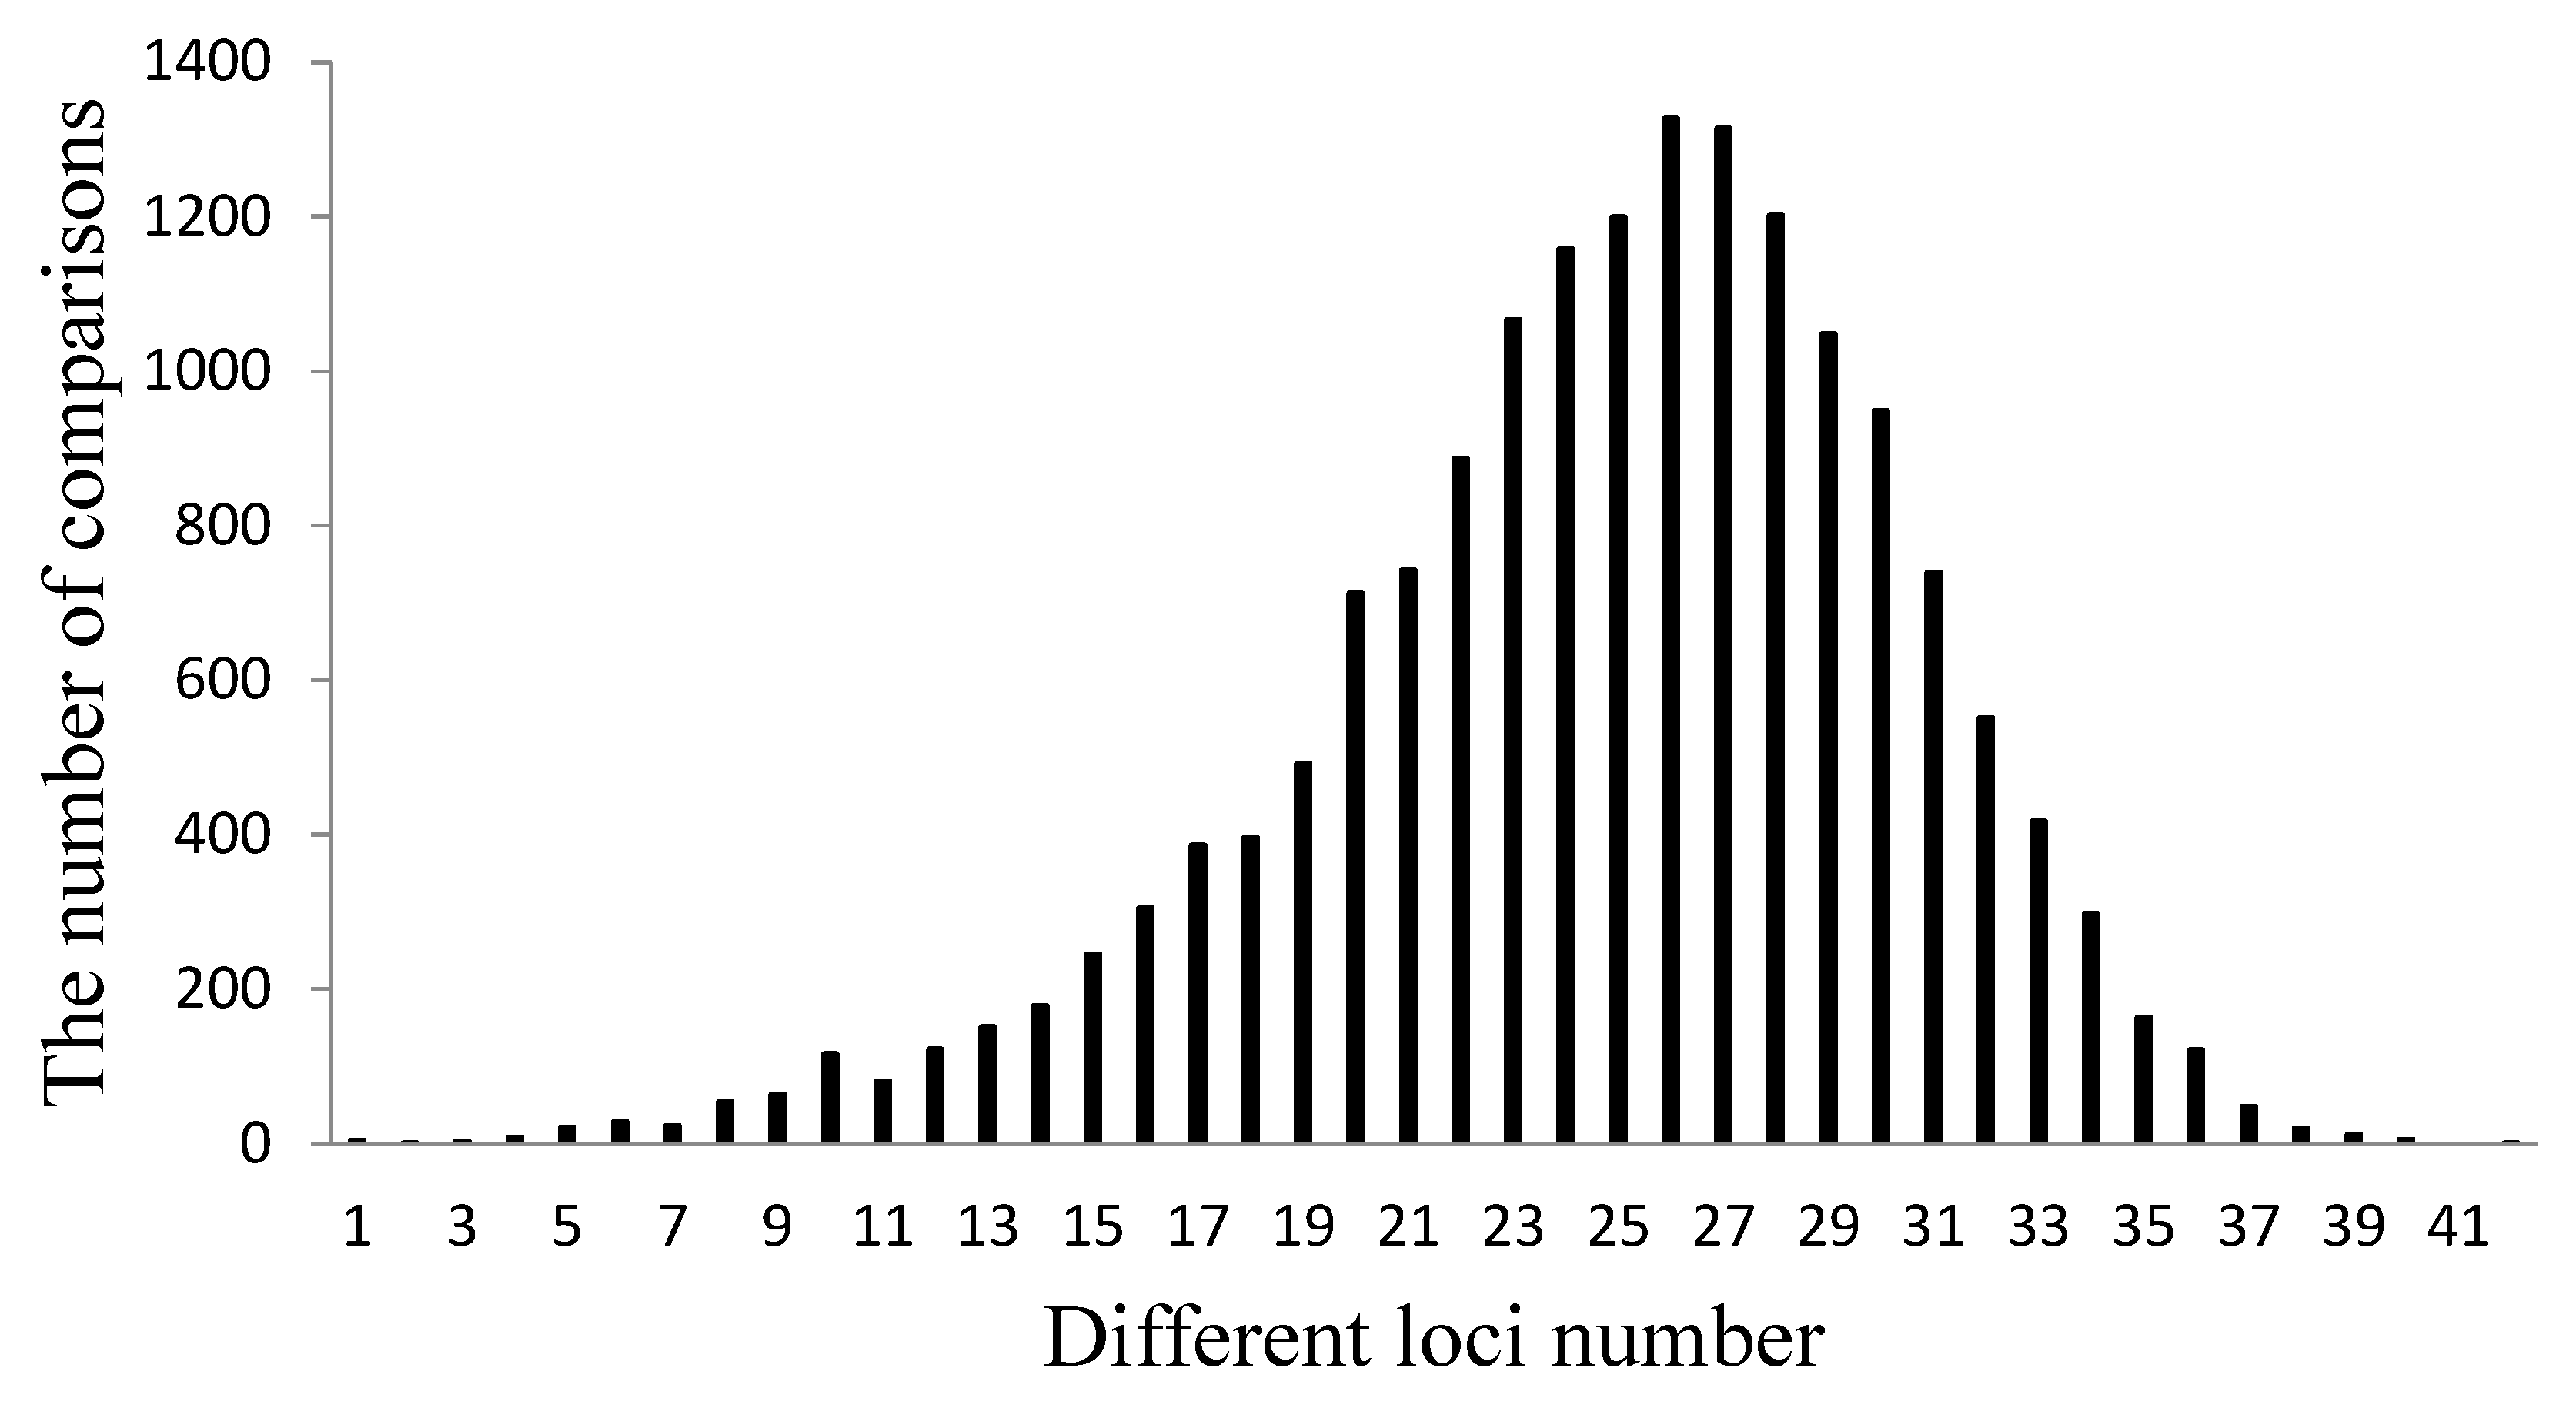
3.3. DNA Fingerprinting of 183 Accessions

The frequency of heterozygous genotypes varied from 0.05 to 0.51, with an average of 0.34. There were 53 accessions (28.96%) with heterozygotic genotype frequency smaller than 31, 115 accessions (62.84%) between 0.31 and 0.46, and only 15 accessions (8.20%) higher than 0.46 (Figure 3).
There was a total of 16,653 line-by-line comparisons, of which the number of different sites within two given accessions ranged from 4 to 44, and 90.35% of the number of different sites ranged from 15 to 34 (Figure 4). There were only eight pairs of accessions with different sites smaller than five. In addition, four, one, and three pairs of accessions had different sites of three, four, and five, respectively. Moreover, 37 pairs of accessions had different sites that were more than 40; 20, 11, 5, 0, and 1 pair showed 40, 41, 42, 43, and 44 different sites, respectively. Finally, there were at least three different sites for any two accessions, indicating that this set of SSR markers has great power to differentiate any of the 183 accessions tested.

3.4. Genetic Diversity Analysis of Sesame Accessions with Different Origins

To compare the genetic diversity of 183 sesame accessions, they were initially categorized into three types based on their origins: CC, CL, and EA. Subsequently, SSR markers were employed to analyze the genetic diversity parameters within each type (Table 2). The total number of SSR alleles ranged from 117 to 121 for each type. Interestingly, despite the EA and CL groups having fewer accessions compared with the CC type, the total number of detected alleles was comparable to or slightly higher than that of the CC type. The CC type comprised 101 cultivars, accounting for 55.19% of all accessions, but exhibited lower numbers of alleles compared with the CL group. The average frequency of heterozygous genotypes across the three types ranged from 0.3219 to 0.3667, with the EA type displaying the highest frequency (0.3667) and the CL type exhibiting the lowest (0.3219). Gene diversity, which reflects the differences in genetic diversity among the germplasm, was determined by summing the genetic variation detected using 25 pairs of SSR primers for different accessions within each type. The gene diversity ranged from 0.3454 to 0.3515, with the CL type slightly surpassing the CC and AA types in terms of diversity.

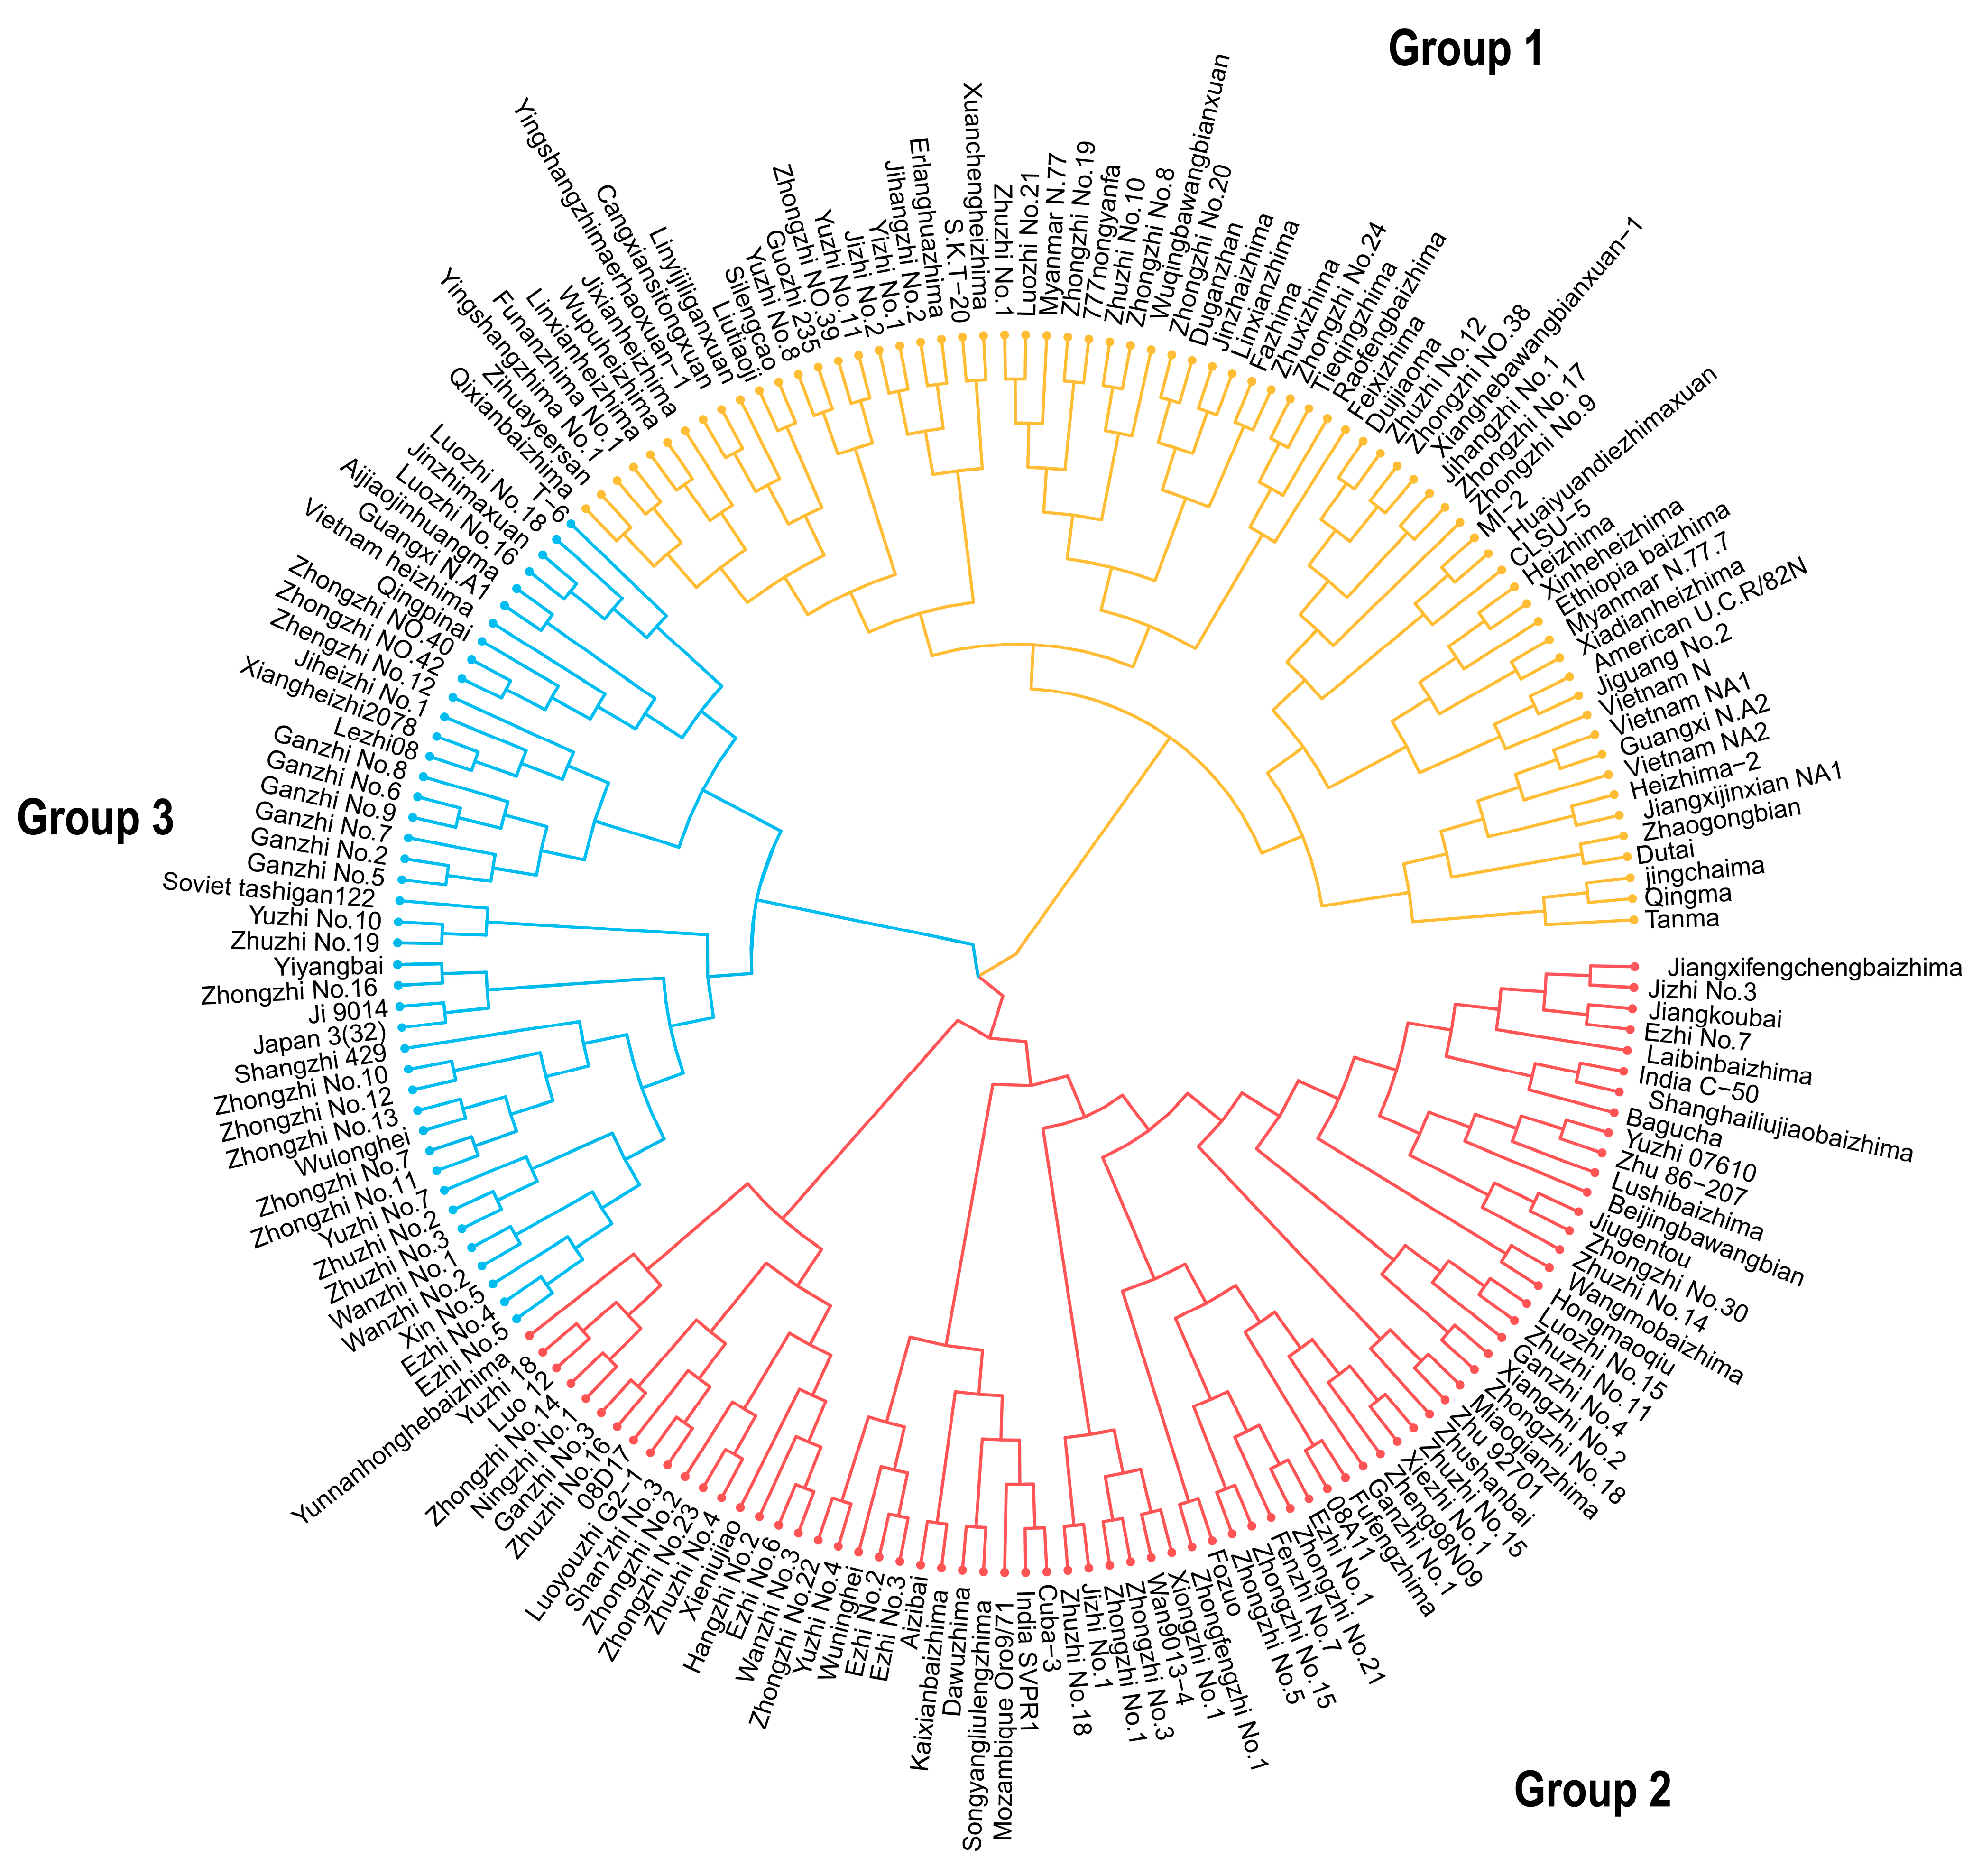
3.5. Systematic Clustering of 183 Sesame Accessions

A systematic cluster analysis was conducted using SSR markers to examine the genetic relationships among the 183 sesame accessions. As a result, three major groups were identified (Figure 5). Group 1 comprised 68 accessions belonging to the EA and CL types, originating from north China and regions outside China. These accessions were characterized by black or brown grain color, a single flower in the leaf axil, easy branching, and low yield. However, their growth period was either excessively long or short, making them unsuitable for cultivation in the main sesame-producing regions of China, such as the Jianghuai Valley (located downstream of the Yangtzi and Huihe rivers). Additionally, these accessions exhibited a high susceptibility to drought and heat stresses, leading to premature aging. Moreover, they were prone to infection by stem point blight and blight during rainy years, which negatively impacted their yield potential. Despite their resilience to waterlogging, these accessions faced multiple challenges that hindered their overall performance (Supplementary Materials, Table S3).
Group 2 has 73 accessions predominantly belonging to the CC type, which included series cultivars such as ‘Zhongzhi’, ‘Ezhi’, ‘Luozhi’, and ‘Zhuzhi’, as well as various landraces collected from provinces like Jiangxi, Anhui, and others in China. These accessions are characterized by single stems, three flowers per leaf axil, white grains, and moderate growth periods, making them highly suitable for cultivation in the Jianghuai Valley. Notably, these accessions have shown significant improvements in their tolerance to waterlogging, drought, and biotic stresses, resulting in the highest yield per unit area in China (Supplementary Materials, Table S3).
Group 3 comprised 42 accessions from the CC and CL types, consisting of notable cultivar series such as ‘Zhongzhi’, ‘Wanzhi’, and ‘Ganzhi’, along with various landraces sourced from the Yunnan and Guangxi provinces in China. These accessions are characterized by a single stem, three flowers per leaf axil, white grains, and slightly longer growth periods. They have shown great adaptability for cultivation in the Jianghuai Valley and Southern China regions. Notably, these accessions exhibit strong tolerance to waterlogging, making them well-suited for cultivation in areas with higher rainfall. However, their tolerance to drought is relatively poor, which makes them more suitable for cultivation in fields with poorer soil conditions. Despite this, they still demonstrate moderately high yields, making them a viable choice for farmers in these regions (Supplementary Materials, Table S3).

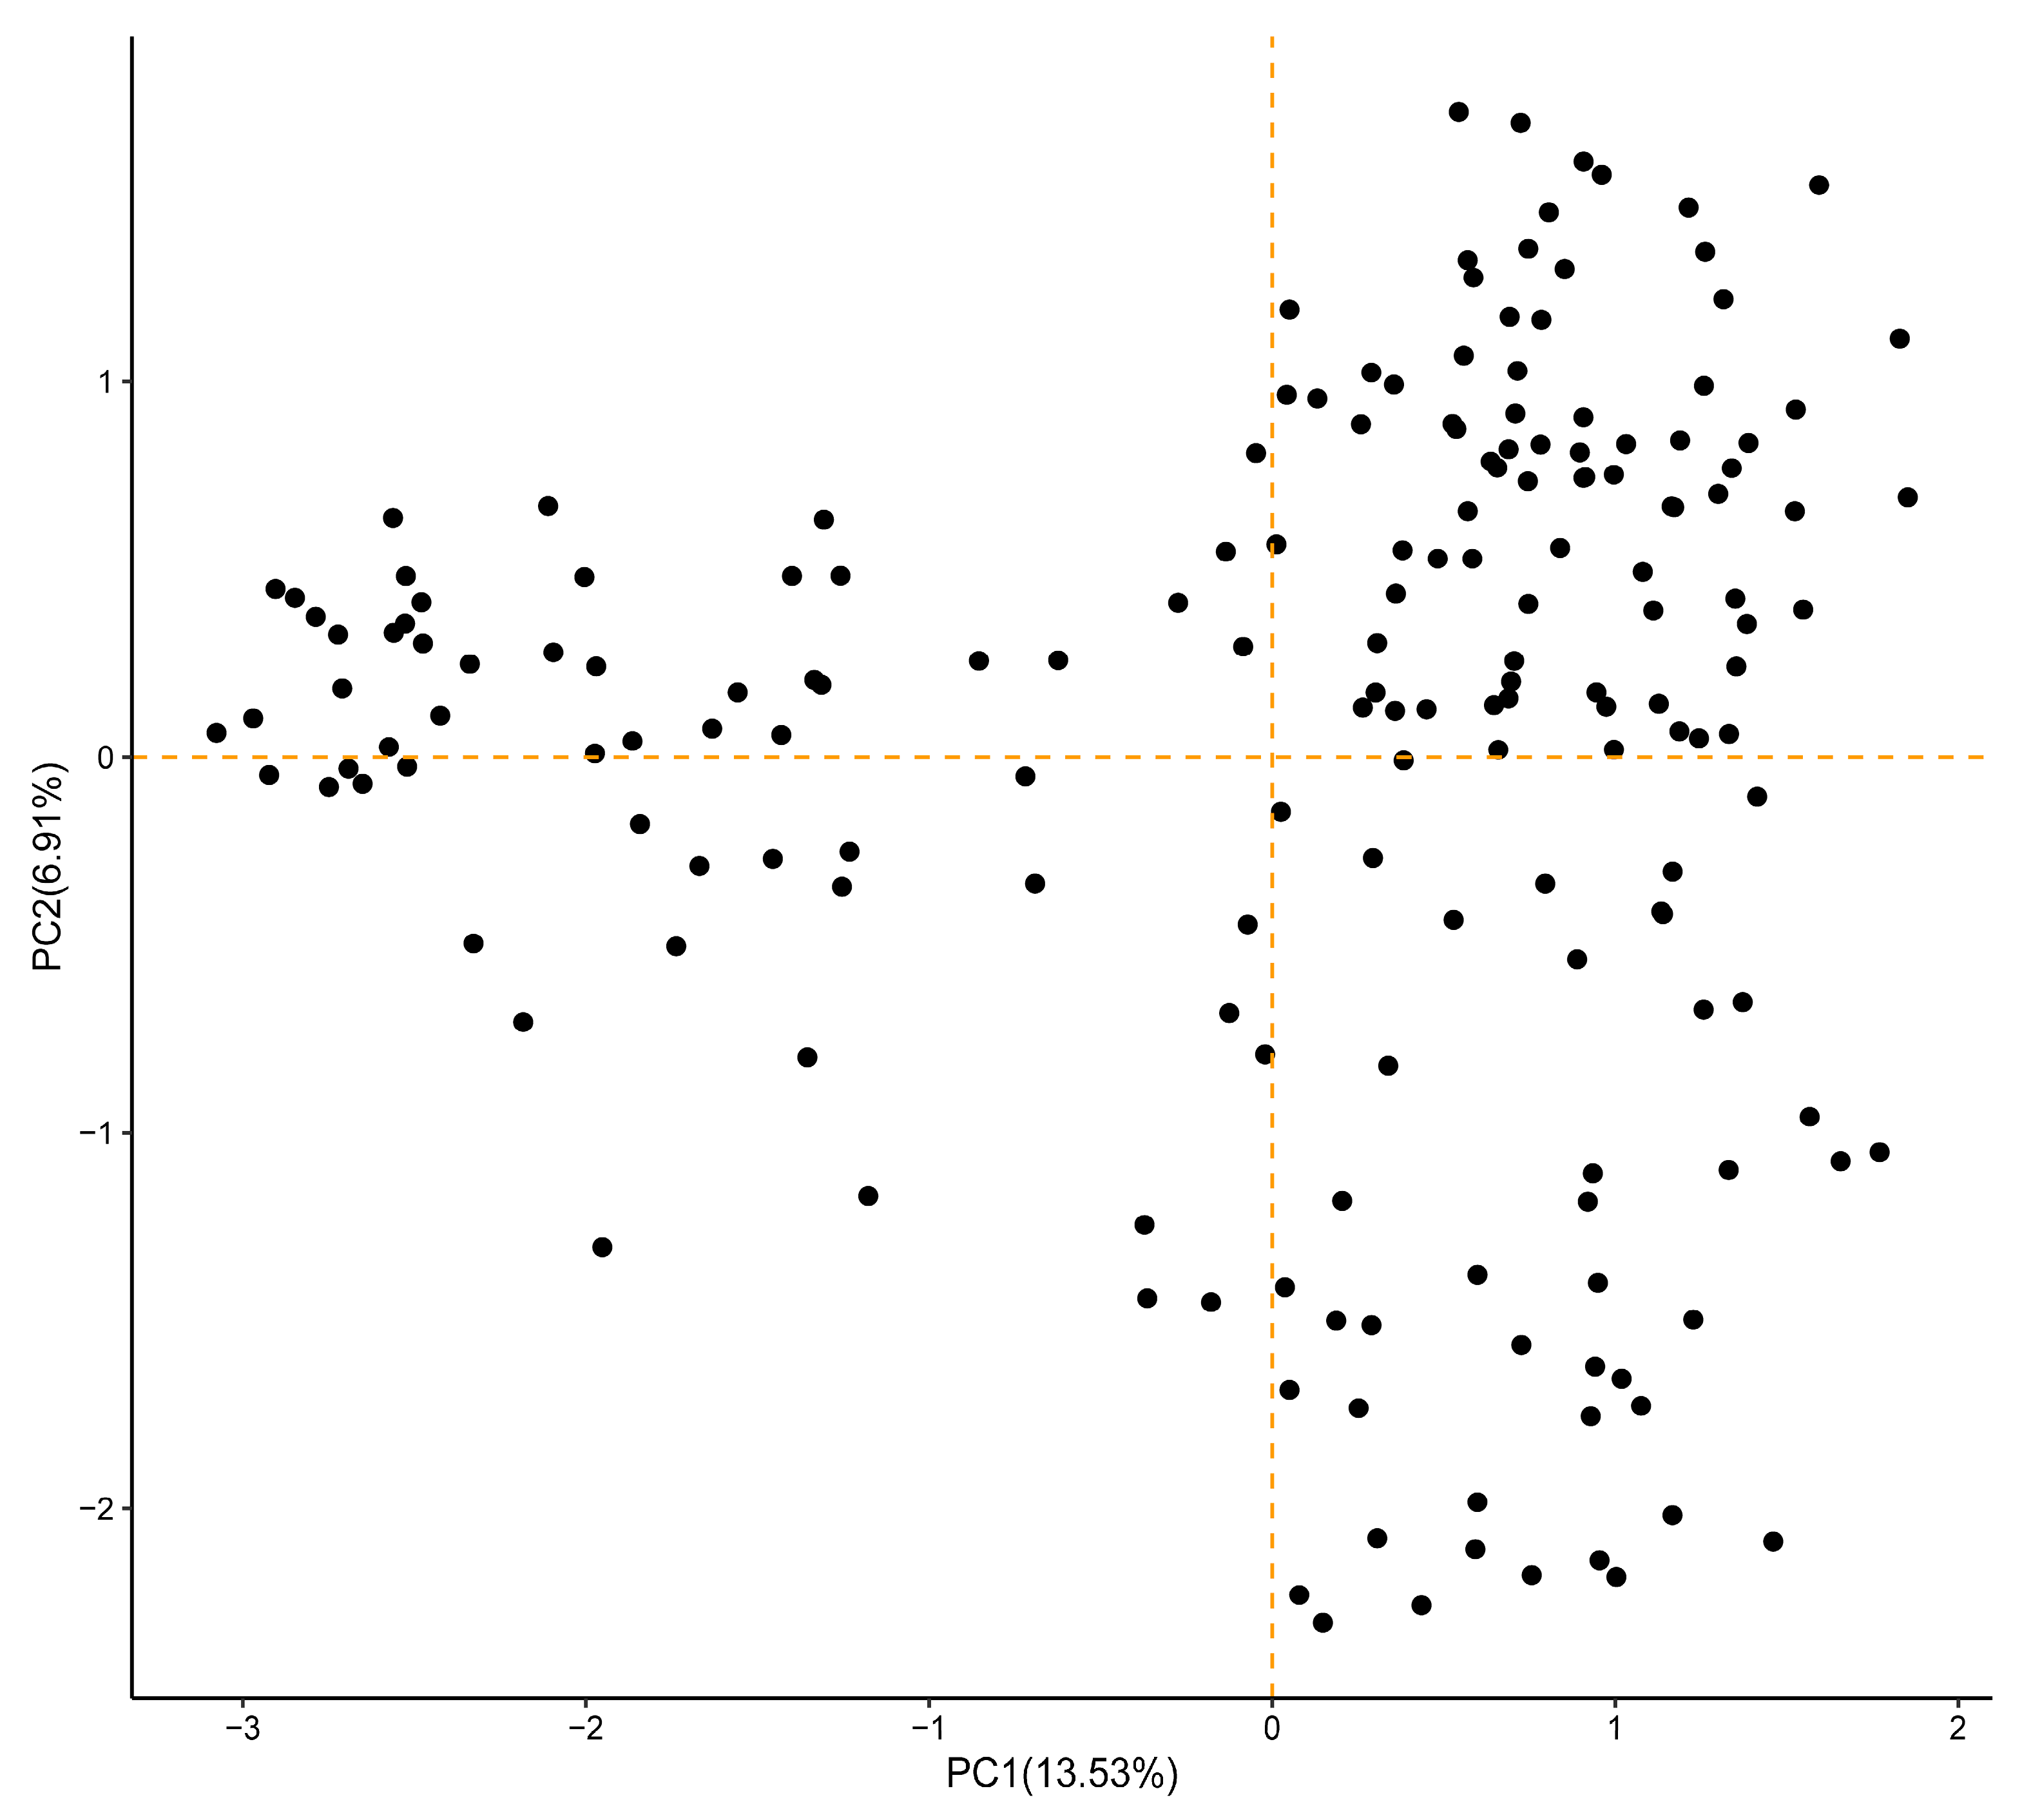
3.6. Principal Coordinate Analysis of 183 Sesame Accessions

To better visualize the relationships among the different groups of sesame accessions, principal coordinate analysis was performed based on the clustering results. The principal coordinate plot was divided into four distinct areas, denoted as I, II, III, and IV, according to the distribution of each group of accessions in Figure 6. Quadrant I primarily represented the cultivars of the ‘Zhongzhi’, ‘Ezhi’, ‘Luozhi’, and ‘Zhuzhi’ series, as well as some landraces sourced from the Jiangxi and Anhui provinces in China. These accessions exhibited close genetic distances, as evidenced by high similarity coefficients and small kinship values. The clustering of accessions in this quadrant indicated minimal genetic differences among them, with most of them being recently released cultivars. Since these cultivars were developed using common elite accessions as parents, they displayed a close genetic relationship, resulting in small genetic differences (Figure 6).
Quadrant IV predominantly consisted of cultivars from the ‘Zhongzhi’, ‘Wanzhi’, and ‘Ganzhi’ series. These accessions exhibited distinct genetic characteristics and were mainly distributed in this area of the plot. Meanwhile, quadrants II and III were occupied by Chinese landraces and exotic accessions with longer or shorter growth periods, single flowers per leaf axil, and easy branching. The majority of Chinese landraces were located in quadrant II, while the exotic accessions were assigned to quadrant III, with a few genotypes scattered throughout quadrant IV.

4. Discussion

Different cultivars of the same crop exhibit distinct characteristics in their DNA sequences. Developing a comprehensive and precise fingerprint database for cultivated crops can provide valuable identification data to support the approval of variety trials and safeguard the rights of new plant varieties. Furthermore, it can offer reliable information for monitoring the seed market and guiding adjustments in breeding strategies. China, being a major sesame producer with a high yield per unit area, experienced a significant increase in the number of registered varieties after the implementation of the new Seed Law in 2015. This surge in variety registrations, reaching 60 or more annually, resulted in chaos in the sesame seed market due to variety infringement. To protect the legitimate rights and interests of breeders, this study aimed to construct a fingerprinting platform for sesame cultivars in China. The SSR database would serve as a foundation for data-driven identification, protection, registration, management, and market monitoring of new varieties (Figure 5). Compared with previous studies conducted by Liu et al. [18] on sesame variety analysis, our study demonstrated improvements in the number of alleles, PIC values, and gene diversity (Table 1). Several factors contributed to these enhancements. Firstly, our study included a larger sample size of 183 accessions, which is twice the number of accessions in the previous research [18]. Secondly, we utilized 25 pairs of SSR primers, whereas Liu et al. [18] employed 10 pairs of AFLP primers, resulting in variations in the number and types of primers used. Lastly, our study encompassed a richer genetic background of sesame accessions, incorporating exotic accessions, landraces, and modern cultivars.
The genetic diversity of Chinese cultivars has been enriched through the utilization of genetic stocks from China and foreign countries. The average frequency of heterozygous genotypes in all the tested accessions was found to be 0.3357, while for the cultivars, it was slightly higher at 0.3379 (Table 2). These results suggest that the cultivars predominantly consist of cross combinations with relatively close relatives, as indicated by the average frequency of heterozygous genotypes being less than 0.5. Statistical analysis was conducted to examine the differences among the 183 accessions, revealing that the number of different SSR marker sites among cultivars was ≥4, with the majority concentrated between 15 and 34. Only eight pairs of combinations had 4–5 differential loci (Figure 4). As the number of released cultivars continues to rise, the presence of similar and derived varieties is also increasing. Consequently, there is a pressing need to significantly improve the number of markers and standardize DNA fingerprints. SSR markers, which are abundant and randomly distributed in the genome, have demonstrated their effectiveness in identifying various crop varieties such as soybean [30], melon [39], apple [40], and grape [41]. However, with the growing number of cultivars requiring testing, more markers and higher detection throughput are necessary, along with the implementation of integration and sharing of fingerprint data. SNP markers, a third-generation marker, offer the potential to array 50,000–90,000 markers on a chip. They can greatly enhance the accuracy of identifying the authenticity of crop varieties, enable simultaneous detection of thousands of samples, facilitate data integration analysis, and significantly reduce detection costs [42]. Therefore, the development and application of SNP markers should be prioritized for sesame variety identification.
The assessment of genetic diversity in sesame varieties in China is crucial for the development of new varieties and the effective utilization of germplasm resources. In this study, we conducted a comprehensive analysis of germplasm resources and cultivated varieties from China and other countries. By examining genetic parameters, conducting systematic clustering, and analyzing principal coordinate distribution, we gained insights into the genetic relationships among different sesame varieties. The clustering analysis revealed that the aggregation of resources from different regions intersected with each other, indicating that genetic diversity was not solely determined by geographical distribution (Figure 5; Supplementary Materials, Table S1). This finding is consistent with previous studies conducted both domestically and internationally [22,23,24,25,26]. The genetic distance among the tested sesame accessions ranged from 0.1278 to 0.8400. Notably, the new cultivar ‘Zhongzhi No.18’ developed by the Oil Crops Research Institute of CAAS showed the smallest genetic distance to the cultivar ‘Xiangzhi No.2’ from the Xiangyang Polytechnical College. On the other hand, the landraces from the Wulonghei region in Jiangxi Province exhibited the largest genetic distance from the variety ‘Zhongzhi No.13’ bred by the Oil Crops Research Institute of CAAS (Supplementary Materials, Table S1). PCA further confirmed the genetic relationships among different varieties. The cultivars belonging to the ‘Zhongzhi’, ‘Ezhi’, ‘Luozhi’, and ‘Zhuzhi’ series were found to be closely grouped. This suggests that they share a relatively narrow genetic basis and have a closer genetic distance to the landraces collected in Jiangxi and Anhui provinces of China.
In our study, we made an interesting observation regarding the clustering of the ‘Ganzhi’ series cultivars released in China. These cultivars were found to be closely grouped, suggesting that breeders have used closely related parental materials, resulting in a narrow genetic basis for the new varieties. This could be attributed to the fact that all the ‘Ganzhi’ varieties, including ‘Ganzhi No.2’, ‘Ganzhi No.5’, ‘Ganzhi No.6’, ‘Ganzhi No.7’, ‘Ganzhi No.8’, and ‘Ganzhi No.9’, are black sesame varieties derived from the black seed-coat sesame landrace in Jiangxi Province, China. For example, ‘Ganzhi No.2’ was selected from the black sesame series of the Boyang landrace, ‘Ganzhi No.5’ was selected from the Jiangxi local resource ‘Jinhuangma’ series, ‘Ganzhi No.7’ was selected from the Jinxian local resource ‘Zhaogongbian’ series, ‘Ganzhi No.8’ was selected from the Jinxian local resource ‘Jingchaima’ series, and ‘Ganzhi No.9’ was obtained through mutagenesis using 60Co-γ radiation from the Jiangxi local resource ‘Wuningheijing’.
Although sesame is a self-pollinating crop, it has a natural outcrossing rate. Foreign sesame accessions have been reported to have a natural outcrossing rate ranging from 1% to 65%, while Chinese domestic sesame varieties have a natural outcrossing rate ranging from 5.13% to 23.35% [43]. Due to years of cultivation together, these local resources may have cross-pollinated with each other, leading to the introgression of certain genes into modern varieties. In addition, some of the cultivar series, such as ‘Zhongzhi No.11’, ‘Zhongzhi No.12’, ‘Zhongzhi No.13’, ‘Yuzhi No.7’, ‘Wanzhi No.1’, and ‘Wanzhi No.2’, were found to cluster together with the ‘Wanzhi’ series (Figure 5). These varieties are all derived from ‘Yiyangbai’ or its derivative varieties, which is consistent with the findings of Yue et al. [19]. To further advance the breeding progress of sesame varieties in China, it is important to exploit the rich sesame resources preserved in the country as parental materials for cross-breeding. Additionally, efforts should be made to strengthen the crossing between varieties collected from different geographic regions. This approach can help broaden the genetic basis and enhance the genetic diversity of sesame varieties in China.
This study highlights the relatively higher genetic diversity of sesame germplasm resources in China compared with foreign resources. However, it is important to note that the limited number of foreign materials selected in this study may have influenced this finding. The majority of the 20 foreign resources included in the study originated from Asia, America, and Africa, while resources from Europe were lacking. This limited regional diversity, combined with the close geographical proximity of the selected resources, may have contributed to the observed lack of genetic diversity. When comparing the genetic distance between foreign and domestic resources, the study found that China’s sesame landraces ‘Lushibaizhima’ and ‘Beijingbawangbian’ had the closest genetic relationship with the Indian variety ‘SVPR1’. This suggests that Chinese sesame may have been introduced from India. Additionally, sesame resources such as ‘Zhushanbai’, ‘Xiniujiao’, ‘Hongmaoqiu’, ‘Vietnam NA1’, ‘Kaixianbaizhima’, Yunnan ‘Honghebaizhima’, and ‘Japan 3(32)’ were found to have genetic relationships with each other. On the other hand, the genetic relationship between ‘Hongmaoqiu’, ‘Wangmobaizhima’, and ‘T-6’ was found to be the furthest. This indicates that most of the Chinese sesame resources are not from Vietnam and Japan, which contradicts the findings of Yue et al. [19], who suggested that Chinese sesame may have been introduced from America. However, it is worth noting that the discrepancy in findings could be attributed to the limited materials used in this study.
In light of these findings, it is recommended that China strengthen the introduction of foreign resources and the distribution and utilization of domestic resources to further enhance breeding efforts and promote the development and adoption of new sesame varieties in China.

5. Conclusions

This study analyzed the genetic diversity of 183 sesame accessions using SSR markers and morphological traits. The results indicate moderate genetic diversity, with polymorphic bands and variation observed. Clustering analysis grouped sesame accessions into three distinct categories, revealing genetic relationships. Interestingly, this study found no significant difference in genetic diversity between Chinese and foreign sesame resources, highlighting the importance of conserving and utilizing both domestic and international germplasm. These findings have implications for sesame breeding, variety protection, DNA identification, and germplasm resource development.

Supplementary Materials

The following supporting information can be downloaded at: https://www.mdpi.com/article/10.3390/agriculture13101885/s1. Table S1. Variety name and origin of sesame accessions used in the present study. Table S2. SSR primer pairs used in this study. Table S3. Morphological traits for 183 sesame accessions. Table S4. Descriptive statistics and comparison of the mean for quantitative traits among three different sesame accession types. Table S5. The correlation coefficient of 56 morphological and agronomy traits in 183 sesame accessions.

Author Contributions

Z.W. and F.Z. performed the investigation, analyzed data, and drafted the manuscript. X.T., Y.Y. and T.Z. provided resources and carried out experiments and data analysis. H.L. contributed to conceptualization, supervision, funding acquisition, and manuscript editing. All authors have read and agreed to the published version of the manuscript.

Funding

This study was supported by funds from the National Natural Science Foundation of China (Grant No. 31771877), the Agriculture Research System of China (Grant No. CARS-14), and the Agricultural Science and Technology Innovation Program, CAAS (Grant No. CAAS-ASTIP-2013-OCRI).

Institutional Review Board Statement

Not applicable.

Data Availability Statement

All data generated or analyzed during this study are included in this published article and its supplementary information files, which are available from the corresponding author upon reasonable request.

Conflicts of Interest

The authors declare that they have no known competing financial interests or personal relationships that could have appeared to influence the work reported in this paper.

References

  1. Kobayashi, T.; Kinoshita, M.; Hattori, S.; Ogawa, T.; Tsuboi, Y.; Ishida, M.; Ogawa, S.; Saito, H. Development of the sesame metallic fuel performance code. Nucl. Technol. 1990, 89, 183–193. [Google Scholar] [CrossRef]
  2. Nayar, N.M.; Mehra, K.L. Sesame-its uses botany, cytogenetics, and origin. Econ. Bot. 1970, 24, 20–31. [Google Scholar] [CrossRef]
  3. Ashri, A. Sesame. In Oil Crops of the World; Roebblen, G., Downey, R.K., Ashri, A., Eds.; McGraw Hill: New York, NY, USA, 1989; pp. 375–387. ISBN 0070530815. [Google Scholar]
  4. Bhat, K.V.; Babrekar, P.P.; Lakhanpaul, S. Study of genetic diversity in Indian and exotic sesame (Sesamum indicum L.) germplasm using random amplified polymorphic DNA (RAPD) markers. Euphytica 1999, 110, 21–33. [Google Scholar] [CrossRef]
  5. Zhou, F.; Zhao, Y.Z.; Zhou, T.; Yang, Y.X.; Liu, H.Y. Progress and suggestions of national and regional trials of new sesame varieties in China in the past 40 years. Mol. Plant Breed. 2022, 20, 1383–1392. [Google Scholar]
  6. Suh, M.C.; Kim, M.J.; Hur, C.G.; Bae, J.M.; Park, Y.I.; Chung, C.H.; Kang, C.W.; Ohlrogge, J.B. Comparative analysis of expressed sequence tags from Sesamum indicum and Arabidopsis thaliana developing seeds. Plant Mol. Biol. 2003, 52, 1107–1123. [Google Scholar]
  7. Liu, H.Y.; Zhou, F.; Zhou, T.; Yang, Y.X.; Zhao, Y.Z. A novel wrinkled-leaf sesame mutant as a potential edible leafy vegetable rich in nutrients. Sci. Rep. 2022, 12, 18478. [Google Scholar] [CrossRef] [PubMed]
  8. Cho, Y.L.; Park, J.H.; Lee, C.W.; Ra, W.H.; Chung, J.W.; Lee, J.R.; Ma, K.H.; Lee, S.Y.; Lee, K.S.; Lee, M.C.; et al. Evaluation of the genetic diversity and population structure of sesame (Sesamum indicum L.) using microsatellite markers. Genes Genom. 2011, 33, 187–195. [Google Scholar] [CrossRef]
  9. Uzun, B.; Lee, D.; Donini, P.; Cagirgan, M.I. Identification of a molecular marker linked to the closed capsule mutant trait in sesame using AFLP. Plant Breed. 2003, 122, 95–99. [Google Scholar] [CrossRef]
  10. Liu, H.Y. Fresh sesame flowers are wonderful for treating warts and chilblains. Chin. Community Physician. 2005, 21, 36. [Google Scholar]
  11. Bedigian, D.; Smyth, C.; Harlan, J. Patterns of morphological variation in sesame. Econ Bot. 1986, 40, 353–365. [Google Scholar] [CrossRef]
  12. Agarwal, M.; Shrivastava, N.; Padh, H. Advances in molecular marker techniques and their applications in plant sciences. Plant Cell Rep. 2008, 27, 617–631. [Google Scholar] [CrossRef] [PubMed]
  13. Williams, J.G.; Kubelik, A.R.; Livak, K.J.; Rafalski, J.A.; Tingey, S.V. DNA polymorphisms amplified by arbitrary primers are useful as genetic markers. Nucleic Acids Res. 1990, 18, 6531–6535. [Google Scholar] [CrossRef]
  14. Safhi, F.A.; Alshamrani, S.M.; Alshaya, D.S.; Hussein, M.A.A.; Abd El-Moneim, D. Genetic diversity analysis of banana cultivars (Musa sp.) in Saudi Arabia based on AFLP marker. Curr. Issues Mol. Biol. 2023, 45, 1810–1819. [Google Scholar] [CrossRef] [PubMed]
  15. Abd-Dada, H.; Bouda, S.; Khachtib, Y.; Bella, Y.A.; Haddioui, A. Use of ISSR markers to assess the genetic diversity of an endemic plant of Morocco (Euphorbia resinifera O. Berg). J. Genet. Eng. Biotechnol. 2023, 21, 91. [Google Scholar] [CrossRef]
  16. Hamm, T.P.; Boggess, S.L.; Kandel, J.S.; Staton, M.E.; Huff, M.L.; Hadziabdic, D.; Shoemaker, D.; Adamczyk, J.J., Jr.; Nowicki, M.; Trigiano, R.N. Development and characterization of 20 genomic SSR markers for ornamental cultivars of weigela. Plants 2022, 11, 1444. [Google Scholar] [CrossRef]
  17. Feng, S.; Jiao, K.; Zhang, Z.; Yang, S.; Gao, Y.; Jin, Y.; Shen, C.; Lu, J.; Zhan, X.; Wang, H. Development of chloroplast microsatellite markers and evaluation of genetic diversity and population structure of cutleaf groundcherry (Physalis angulata L.) in China. Plants 2023, 12, 1755. [Google Scholar] [CrossRef] [PubMed]
  18. Zhong, X.; Xu, M.; Li, T.; Sun, R. Development of EST-SSRs based on the transcriptome of Castanopsis carlesii and cross-species transferability in other Castanopsis species. PLoS ONE 2023, 18, e0288999. [Google Scholar] [CrossRef]
  19. Azizi, M.M.F.; Lau, H.Y.; Abu-Bakar, N. Integration of advanced technologies for plant variety and cultivar identification. J. Biosci. 2021, 46, 91. [Google Scholar] [CrossRef]
  20. Uncu, A.Ö.; Gultekin, V.; Allmer, J.; Frary, A.; Doganlar, S. Genomic simple sequence repeat markers reveal patterns of genetic relatedness and diversity in sesame. Plant Genome. 2015, 8, 1–12. [Google Scholar] [CrossRef]
  21. Wei, W.; Qi, X.; Wang, L.; Zhang, Y.; Hua, W.; Li, D.; Lv, H.; Zhang, X. Characterization of the sesame (Sesamum indicum L.) global transcriptome using Illumina paired-end sequencing and development of EST-SSR markers. BMC Genomics. 2011, 12, 451. [Google Scholar] [CrossRef]
  22. Wu, K.; Yang, M.; Liu, H.; Tao, Y.; Mei, J.; Zhao, Y. Genetic analysis and molecular characterization of Chinese sesame (Sesamum indicum L.) cultivars using insertion-deletion (InDel) and simple sequence repeat (SSR) markers. BMC Genet. 2014, 15, 35. [Google Scholar] [CrossRef] [PubMed]
  23. Teklu, D.H.; Shimelis, H.; Tesfaye, A.; Mashilo, J.; Zhang, X.; Zhang, Y.; Dossa, K.; Shayanowako, A.I.T. Genetic variability and population structure of Ethiopian sesame (Sesamum indicum L.) germplasm assessed through phenotypic traits and simple sequence repeat markers. Plants 2021, 10, 1129. [Google Scholar] [CrossRef] [PubMed]
  24. Stavridou, E.; Lagiotis, G.; Kalaitzidou, P.; Grigoriadis, I.; Bosmali, I.; Tsaliki, E.; Tsiotsiou, S.; Kalivas, A.; Ganopoulos, I.; Madesis, P. Characterization of the genetic diversity present in a diverse sesame landrace collection based on phenotypic traits and EST-SSR markers coupled with an HRM analysis. Plants 2021, 10, 656. [Google Scholar] [CrossRef] [PubMed]
  25. Liu, W.P.; Ren, G.X.; Wen, F. Genetic diversity of sesame (Sesamum indicum L.) germplasm from Shanxi and the major planting areas in China. Chin. J. Oil Crop Sci. 2013, 35, 539–545. [Google Scholar]
  26. Yue, W.D.; Wei, L.B.; Zhang, T.D.; Li, C.; Miao, H.M.; Zhang, H.Y. Genetic diversity and population structure of germplasm resources in sesame (Sesamum indicum L.) by SSR markers. Acta Agron. Sin. 2012, 38, 2286–2296. [Google Scholar] [CrossRef]
  27. Wang, L.; Yu, S.; Tong, C.; Zhao, Y.; Liu, Y.; Song, C.; Zhang, Y.; Zhang, X.; Wang, Y.; Hua, W.; et al. Genome sequencing of the high-oil crop sesame provides insight into oil biosynthesis. Genome Biol. 2014, 15, R39. [Google Scholar] [CrossRef]
  28. Guo, G.; Pan, B.; Yi, X.; Khan, A.; Zhu, X.; Ge, W.; Liu, J.; Diao, W.; Wang, S. Genetic diversity between local landraces and current breeding lines of pepper in China. Sci. Rep. 2023, 13, 4058. [Google Scholar] [CrossRef]
  29. Pozharskiy, A.; Kostyukova, V.; Khusnitdinova, M.; Adilbayeva, K.; Nizamdinova, G.; Kapytina, A.; Kerimbek, N.; Taskuzhina, A.; Kolchenko, M.; Abdrakhmanova, A.; et al. Genetic diversity of the breeding collection of tomato varieties in Kazakhstan assessed using SSR, SCAR and CAPS markers. PeerJ 2023, 11, e15683. [Google Scholar] [CrossRef]
  30. Pardeshi, P.; Jadhav, P.; Sakhare, S.; Zunjare, R.; Rathod, D.; Sonkamble, P.; Saroj, R.; Varghese, P. Morphological and microsatellite marker-based characterization and diversity analysis of novel vegetable soybean [Glycine max (L.) Merrill]. Mol. Biol. Rep. 2023, 50, 4049–4060. [Google Scholar] [CrossRef]
  31. Zhang, X.R.; Feng, X.Y. Descriptors and Data Standard for Sesame (Sesamum indicum L.); China Agriculture Press: Beijing, China, 2006; pp. 30–47. ISBN 9787109110151. [Google Scholar]
  32. Agbagwa, I.O.; Datta, S.; Patil, P.G.; Singh, P.; Nadarajan, N. A protocol for high-quality genomic DNA extraction from legumes. Genet. Mol. Res. 2012, 11, 4632–4639. [Google Scholar] [CrossRef]
  33. Zhang, P.; Zhang, H.Y.; Guo, W.Z.; Zheng, Y.Z.; Wei, L.B.; Zhang, T.Z. Analysis of genetic diversity of sesame germplasm resources by SRAP and EST-SSR markers. Crop Sci. 2007, 33, 1696–1702. [Google Scholar]
  34. Liu, H.Y.; Zhou, F.; Zhou, T.; Yang, Y.X.; Zhao, Y.Z. Cytological characterization and molecular mapping of a novel recessive genic male sterility in sesame (Sesamum indicum L.). PLoS ONE 2018, 13, e0204034. [Google Scholar] [CrossRef] [PubMed]
  35. Ning, W.; Wei, Y.; Gao, L.; Han, C.; Gou, Y.; Fu, S.; Liu, D.; Zhang, C.; Huang, X.; Wu, S.; et al. HemI 2.0: An online service for heatmap illustration. Nucleic Acids Res. 2022, 50, W405–W411. [Google Scholar] [CrossRef] [PubMed]
  36. Metsalu, T.; Vilo, J. ClustVis: A web tool for visualizing clustering of multivariate data using principal component analysis and heatmap. Nucleic Acids Res. 2015, 43, W566–W570. [Google Scholar] [CrossRef] [PubMed]
  37. Murtagh, F.; Legendre, P. Ward’s hierarchical agglomerative clustering method: Which algorithms implement ward’s criterion? J. Classif. 2014, 31, 274–295. [Google Scholar] [CrossRef]
  38. Yeh, F.C. Population genetic analysis of co-dominant and dominant marker and quantitative traits. Belgian J. Bot. 1997, 130, 129–157. [Google Scholar]
  39. Chikh-Rouhou, H.; Mezghani, N.; Mnasri, S.; Mezghani, N.; Garcés-Claver, A. Assessing the genetic diversity and population structure of a tunisian melon (Cucumis melo L.) collection using phenotypic traits and SSR molecular markers. Agronomy 2021, 11, 1121. [Google Scholar] [CrossRef]
  40. Bakir, M.; Dumanoglu, H.; Aygun, A.; Erdogan, V.; Dost, S.E.; Gülsen, O.; Serdar, U.; Kalkisim, O.; Bastas, K. Genetic diversity and population structure of apple germplasm from Eastern Black Sea region of Turkey by SSRs. Sci. Hortic. 2022, 294, 10793. [Google Scholar] [CrossRef]
  41. Cao, S.S.; Stringer, S.; Gunawan, G.; McGregor, C.; Conner, P.J. Genetic diversity and pedigree analysis of muscadine grape using SSR markers. J. Am. Soc. Hortic. Sci. 2020, 145, 143–151. [Google Scholar] [CrossRef]
  42. Singh, S.; Mahato, A.K.; Jayaswal, P.K.; Singh, N.; Dheer, M.; Goel, P.; Raje, R.S.; Yasin, J.K.; Sreevathsa, R.; Rai, V.; et al. A 62K genic-SNP chip array for genetic studies and breeding applications in pigeonpea (Cajanus cajan L. Millsp.). Sci. Rep. 2020, 10, 4960. [Google Scholar] [CrossRef]
  43. Sun, J.; Yan, T.X.; Yue, M.W.; Rao, Y.L.; Yan, X.W.; Zhou, H.Y. Study on breeding characteristics of sesame (Sesamum indicum L.) IV: Spontaneous outcrossing rate of sesame in winter multiplication in Hainan. Jiangxi Acta Agric. 2017, 29, 17–20. [Google Scholar]
Figure 1. Performance of 183 field-grown sesame accessions during the early flowering stage in 2022.
Agriculture 13 01885 g001
Figure 2. Heatmap displaying the clustering pattern of 183 sesame accessions using 56 morpho-physiological descriptors. The hierarchical clustering heatmap was generated using qualitative and quantitative data. The color-coded scale represents an increase (red) and a decrease (blue) in the measured traits.
Agriculture 13 01885 g002
Figure 3. Distribution of heterozygous genotype frequency in 183 sesame accessions.
Agriculture 13 01885 g003
Figure 4. Distribution of different marker locus numbers obtained using pairwise comparison in 183 sesame accessions.
Agriculture 13 01885 g004
Figure 5. The dendrogram was generated using the unweighted pair group method with arithmetic averaging (UPGMA) algorithm, illustrating the genetic relationships among 183 sesame accessions. The genetic distance matrix, derived from SSR data, was used for clustering. The color-coded groups (group 1: yellow, group 2: red, group 3: blue) highlight the distinct clusters formed by the sesame accessions.
Agriculture 13 01885 g005
Figure 6. Principal coordinate analysis of 183 sesame accessions based on SSR markers. The plot was divided into four distinct areas, labeled I, II, III, and IV, based on the distribution of the accessions.
Agriculture 13 01885 g006
Table 1. Polymorphism of 25 SSR primer pairs in 183 sesame accessions.
SSR MarkerPolymorphic
Bands
SIHeHeFrPICNo. of AllelesDPMajor Allele Size and Frequencyh
SB39330.4980.3420.2370.5731.230.719130, 0.240.331
LG0330.6400.0080.4140.6161.810.813227, 0.410.448
LG2130.5540.3390.2840.5901.650.768156, 0.280.374
LG2230.5920.3140.3610.5901.740.775198, 0.360.407
LG2830.5710.3160.2820.5951.670.760155, 0.280.387
LG3130.5540.3590.2700.6011.620.762148, 0.270.370
LG5630.6350.0120.3370.6261.800.763185, 0.340.443
LG5730.6340.0170.3630.6361.800.782199, 0.360.443
LG4030.6310.0170.3840.6291.790.791211, 0.380.439
LG4630.5550.3320.2660.6171.620.749146, 0.270.371
LG6430.5640.3120.3020.5721.650.763166, 0.300.380
LG10830.2730.6800.2570.0861.260.456141, 0.260.166
LG11130.5810.3320.4190.5731.730.790230, 0.420.400
LG11530.4500.4300.2930.3861.490.681161, 0.290.295
LG11630.4070.3760.2900.3571.490.669159, 0.290.280
LG12330.4960.3360.2930.5101.620.729161, 0.290.338
LG14130.6500.0060.4370.6331.850.698240, 0.440.457
LG13130.5060.3340.3520.5071.670.760193, 0.350.351
LG14430.5410.4420.2900.5151.610.712159, 0.290.360
LG13930.6110.1300.3210.6311.750.803176, 0.320.421
LG14030.5260.5400.2590.5701.580.717142, 0.260.347
LG14830.3710.7950.3900.2961.290.522214, 0.390.219
LG14730.5430.3730.4320.4741.600.752237, 0.430.361
LG15130.3850.6380.4920.4781.420.553270, 0.490.251
LG15330.4650.3350.3700.4791.610.728203, 0.370.324
Note: SI, Shannon’s index; PIC, polymorphic information content; He, heterozygosity; HeFr, heterozygous gene frequency; DP, discrimination power; h, gene diversity.
Table 2. Comparison of genetic diversity among three different accession types.
Accession TypeNumber of AccessionsNumber of AllelesHeterozygous Genotype FrequencyGene Diversity
Chinese cultivars (CC)1011200.33790.3454
Chinese landraces (CL)621210.32190.3515
Exotic accessions (EA)201170.36670.3499
Disclaimer/Publisher’s Note: The statements, opinions and data contained in all publications are solely those of the individual author(s) and contributor(s) and not of MDPI and/or the editor(s). MDPI and/or the editor(s) disclaim responsibility for any injury to people or property resulting from any ideas, methods, instructions or products referred to in the content.

