Article

The Influence of Short-Term Tillage, Compost, and Beneficial Microbes on Soil Properties and the Productivity of Wheat and Cowpea Crops

1
Department of Soil Improvement and Conservation, Soils, Water and Environment Research Institute, Agricultural Research Center, Giza 12112, Egypt
2
Department of Biology, Faculty of Science and Arts, King Khalid University, Mohail 61321, Saudi Arabia
3
Department of Agricultural Microbiology, Soils, Water and Environment Research Institute Agricultural Research Center, Giza 12112, Egypt
*
Author to whom correspondence should be addressed.
Agriculture 2023, 13(10), 1857; https://doi.org/10.3390/agriculture13101857
Submission received: 17 August 2023 / Revised: 14 September 2023 / Accepted: 20 September 2023 / Published: 22 September 2023

Abstract

:
Tillage systems comprise physical, chemical, and biological modification processes that influence soil properties. Soil cultivation aims to create favorable conditions for the development and growth of crops, as evident in their yields. Three growing seasons (winter 2019/2020 (wheat), summer 2020 (cowpea), and winter 2020/2021 (wheat)) were studied in field experiments in Sidi Salem, Kafr El-Sheikh, Egypt, to investigate the effects of soil tillage and the application of organic and beneficial microbes on various biological, chemical, and physical properties of soil and its productivity. Three replicates of the experimental treatments were set up in a split-plot design, in which there were four main plots: conventional soil tillage (ST) treatment for all three seasons (ST1); tillage in the first and second seasons (ST2); tillage only in the first season (ST3); and no tillage for all three seasons (ST4). However, the subplots (soil additives) were conditioned as follows: without treatment (control, T1); compost (C, T2); beneficial microorganisms (BM, T3); and combination (C + BM, T4). The biological property results showed that ST4T4 treatment produced high levels of microbial communities (bacteria, fungi, and actinomycetes), as well as high levels of soil enzyme activity (dehydrogenase, urease, and phosphatase), during the three growing seasons. However, the second season produced high numbers and dry weights of cowpea plants’ nodules. Additionally, changes in the chemical and physical properties showed that the application of various soil tillage treatments during the examined seasons led to significant increases in electrical conductivity (ECe, dSm−1), bulk density (BD, kg m−3), and soil infiltration rate (IR, cm h−1), following the trend of ST4 > ST3 > ST2 > ST1. In contrast, the results revealed decreases in the exchangeable sodium percentage (ESP, %), porosity (PO, %), soil aggregates (stable aggregates and optimal-sized aggregates, %), and soil penetration resistance (SPRa, Mpa). The combination treatment (ST4T4) provided the best yields, with grain yields of 4.991 and 5.325 tons ha−1 and straw yields of 5.214 and 5.338 tons ha−1 in the first and third seasons (wheat), respectively. Cowpea plants showed the same pattern in the second season. Therefore, improvements in soil properties and enhancements in biological activity help maintain its productivity and fertility through simplified tillage processes that reduce interference with the soil surface layer.

1. Introduction

Human health and environmental sustainability are related to soil quality. As a result, it is necessary to assess how agroecosystems affect soil quality [1]. The different characteristics of the soil (physical, chemical, and biological), which are influenced by environmental factors and soil management [2,3], make soil quality difficult to define and quantify. According to [4], a healthy soil is one that “...continually has the capacity to sustain biological productivity, maintain the quality of the air, water and environments, which due to promote plant, animal, and human health”. On the other hand, crop management is a biotic factor that modifies soil microorganisms and their processes by altering the quantity and quality of plant residues that are introduced into the soil, the tillage technique used, the distribution of seasonal and spatial crop residues, the proportion of above- and below-ground inputs, and the nutrient inputs [5].
The assimilation of residues, moisture retention, microorganisms, pH, structure, and bulk density are all factors that tillage can affect positively or negatively [6]. Thus, by reducing the turnover rate of macro-aggregates, enhancing the physical protection of particulate organic material, and minimizing soil to residue contact, reducing tillage or introducing no-tillage (NT) has the potential to reduce the amount of soil organic carbon (SOC) lost [7]. The adoption of no-tillage systems has grown throughout the world due to the desire to cut costs, to plant winter crops quickly, and the alleged environmental advantages. However, the primary goal of using no-plowing tillage is to lower production costs while maintaining or increasing yields and reducing costs by up to 20% in the form of time and equipment savings [8,9]. According to [10], how sustainably soil resources are used depends on the properties of the soil, which are influenced by soil tillage (ST). Using tillage properly might reduce soil-related restrictions; however, doing so incorrectly can result in a number of unfavorable processes. Alternative techniques have been developed to increase soil organic matter and improve soil quality while minimizing tillage and using renewable organic resources. No-tillage (NT) and reduced-tillage systems (RTS) are techniques that could preserve and enhance soil quality [11,12,13].
Compost is an organic fertilizer source that has been found to increase soil quality and soil organic matter (SOM); its addition to soils can modify soil biological characteristics [12,14]. Additionally, compost treatment could enhance soil aeration, drainage, and aggregate stability [15], and drastically change soil bulk density [16]. According to [17], compost treatment enhances soil biological properties such as the variety of microorganisms, biomass C and N, soil respiration, and enzymatic activities. As a result, adding compost to the soil could have a significant impact on soil fertility and health. For example, [18] reported that employing no-tillage systems of maize and of maize with soybean reduced N2O emissions by 40% and 57% when utilizing moldboard and chisel ploughs, respectively.
Beneficial microbes regulate the main processes that take place in soil, including the cycling of biogeochemicals, stimulation of plant development, decomposition of organic matter, and the different interactions with physical processes [19]. During the decomposition of green manures and plant residues, different microbial communities perform particular activities. Due to their great sensitivity to environmental changes and close relationship to the soil and ecosystem, soil microbial parameters are important markers of changes in soil health under various soil management practices [20].
No-tillage and organic fertilizer are examples of conservation–agriculture practices that can significantly influence the biochemical characteristics of soils, the activities of the soil microbial population, and the health of the soil [21,22]. Reduced tillage, compost, and mineral fertilizers have been demonstrated to alter the microbial structure and biochemical characteristics of soil [23,24]. Tillage typically favors aerobic species with rapid metabolic rates typical of bacterial species in soil microbial communities. According to earlier research, the ratios of fungi to bacteria were reduced while moving from a no-tillage system to a disc or plough management system [25].
To date, this is the first study that has been performed on the effects of zero-tillage and organic application in the Sidi Salem region, Kafr El-Sheikh, where the aim of farmers is to avoid issues with soil compaction, poor drainage, and aeration that may arise in the absence of tillage under clayey soil conditions. Consequently, the purpose of this three-season study was to assess the effects of tillage, and the individual or combined application of compost and beneficial microorganisms, on some biological properties (microbial community, number and dry weight of nodules of cowpea, and soil enzymes activity), chemical properties (ECe and ESP), physical properties (bulk density, soil porosity soil aggregates, soil penetration, and soil infiltration rate), and the productivity of wheat and cowpea plants.

2. Materials and Methods
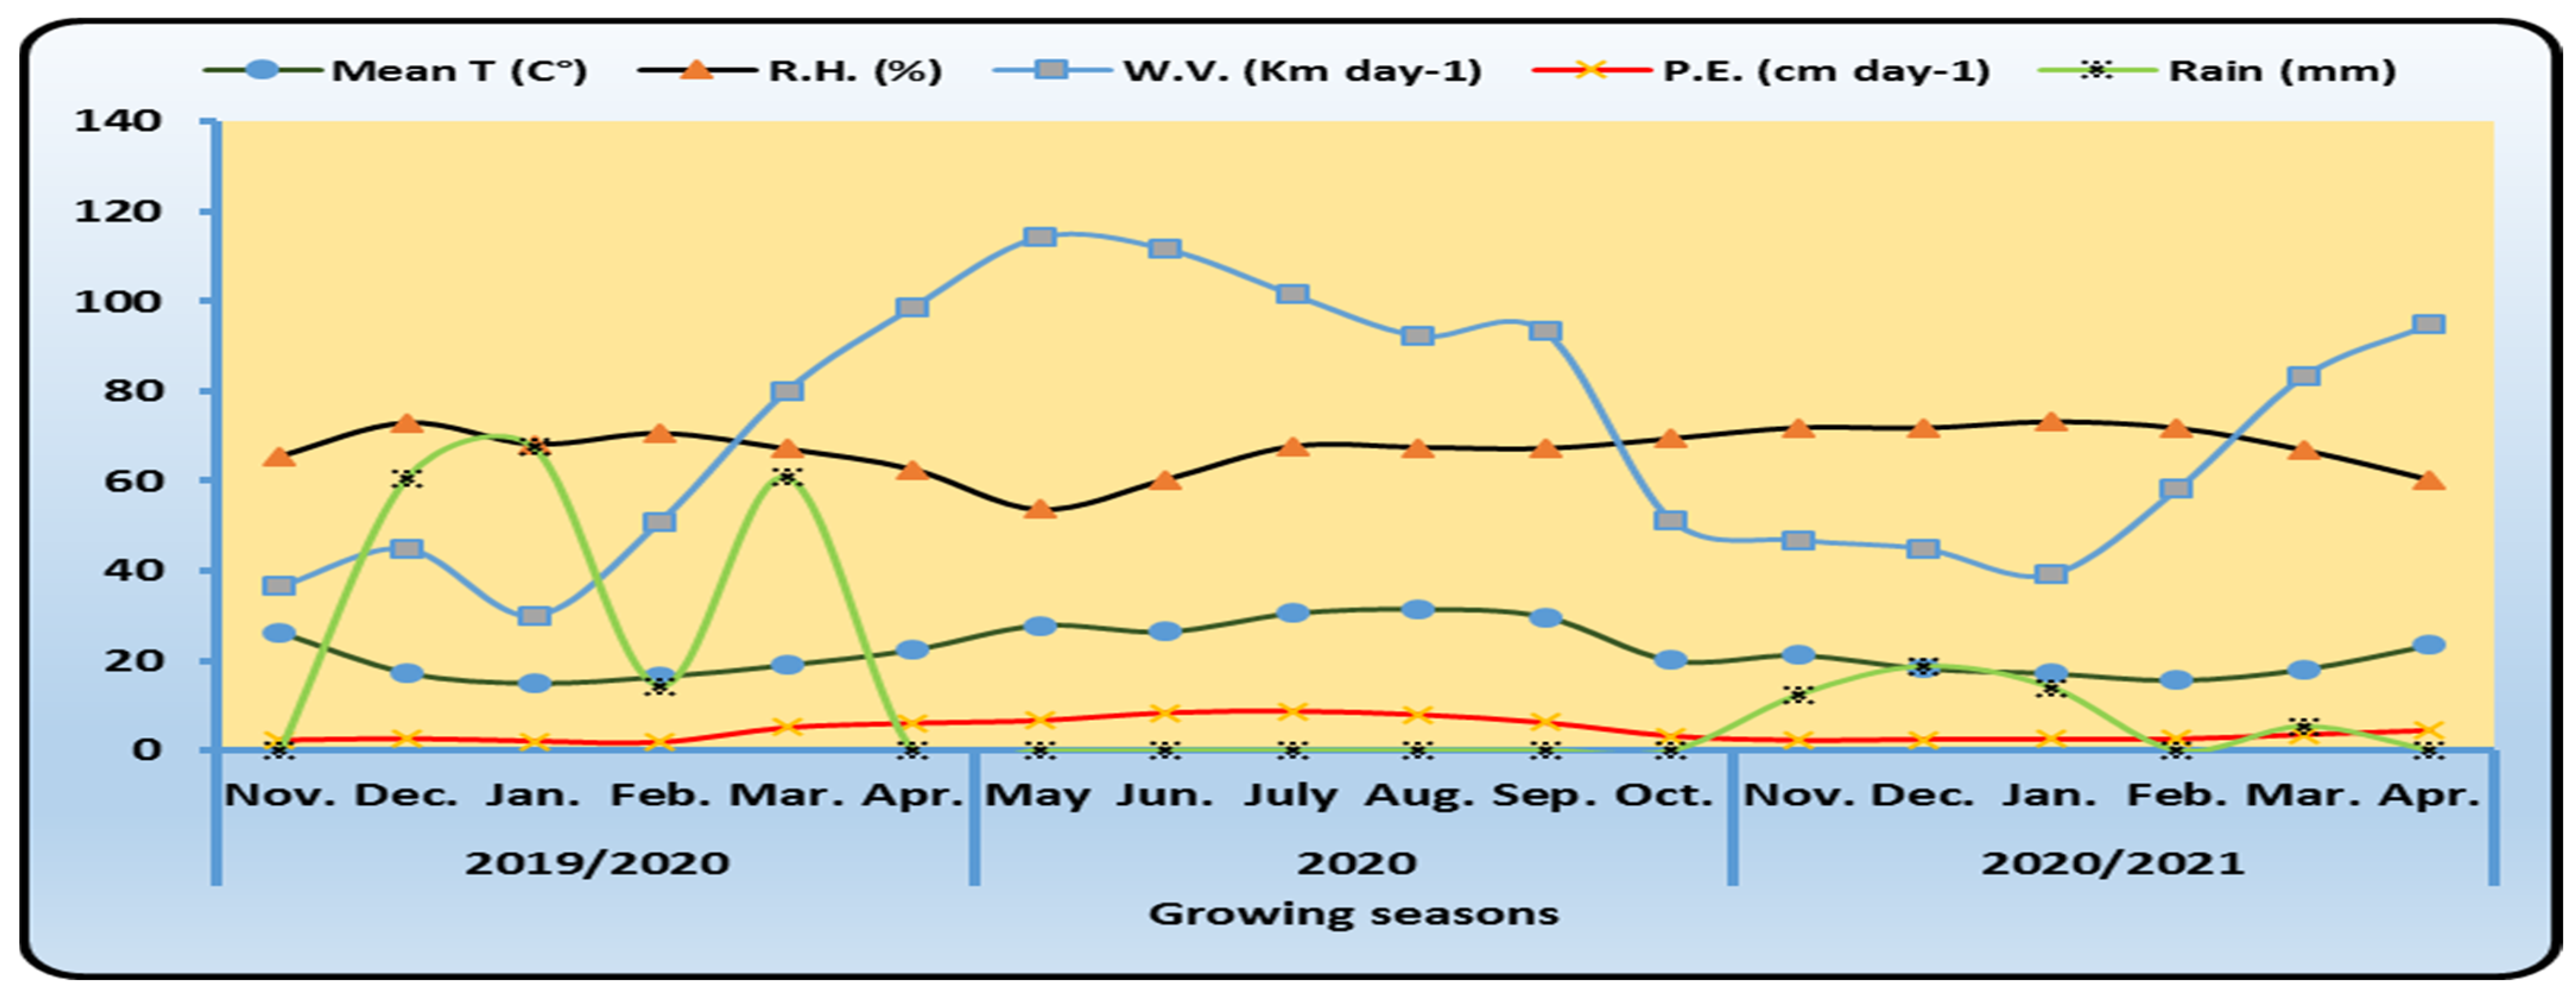
2.1. Location

For three growing seasons—winter 2019/2020 (wheat, Cv. Sakha-95), summer 2020 (cowpea, Cv. Kafrelsheikh), and winter 2020/2021 (wheat, Cv. Sakha-95)—in the Sidi Salem region (31°18′57″ N latitude and 30°48′08″ E longitude), Kafr El-Sheikh, Egypt, field experiments were carried out to examine the impact of soil tillage and the application of organic and beneficial microbes on various characteristics of the soil (physical, chemical, and biological) and its productivity. To conduct various physical and chemical analyses, soil samples (3 replicates) were taken from the experimental site at 3 successive depths (0–20, 20–40, and 40–60 cm). The key results are shown in Table 1; the biological data are presented in Table 2. The region has a semi-arid climate, is 170 km north of Cairo, and is situated at an altitude roughly 6 m above sea level. Figure 1 depicts the weather information for the location during the growing seasons.

2.2. Compost and Beneficial Microorganisms

Compost (C) and beneficial microorganisms (BM) were applied as soil supplements, provided by the Bacterial Laboratory, SWERI, Sakha Research Station, Egypt. According to [14], compost was applied to the soil at a rate of 10 tons ha−1 during the ploughing process at a depth of 20 cm for the tillage treatments and spread over the soil surface for the no-tillage treatments. Table 3 details the compost analysis that was conducted. For BM, two strains of Bradyrhizobium sp. (TAL-169) and Azospirillum lipoferum SP2 were used as beneficial microbes. Bradyrhizobium sp. was cultivated on yeast extract mannitol medium [26], and A. lipoferum was cultured on a semi-solid malate medium [27]. Using 50 g of the sterilized carrier and 100 mL of 108 CFU mL−1 from each culture, a combination of strains (1:1) was created as peat-based inoculums and mixed with the seeds for 20 min before application on a plastic sheet out of the direct sun.

2.3. Field Experiment

Prior to the start of the experiment, the field (48 plots) had been prepared for a winter wheat–summer cowpea rotation system. The experimental design consisted of a split-plot design with three replicates. There were four main plots: conventional soil tillage (ST) for three seasons; tillage in the first and second seasons; tillage in the first season; and no tillage for three seasons. The soil was plowed to a depth of 20 cm (El Nasr Automotive Manufacturing Co., Cairo, Egypt). The subplots (soil supplements) were conditioned as follows: without treatment (control), compost (C), beneficial microorganisms (BM), and C + BM, as shown in Table 4.
Wheat seeds were obtained from the Field Crops Research Institute, SARS, Kafr El-Sheikh, Egypt, which were sown across seasons following standard drilling methods on 20 November 2019 and 25 November 2020 at a rate of 140 kg ha−1. Each plot for the soil tillage treatments had 20 rows, 3 m wide and 3.5 m long, with a row spacing of 15 cm; the distance between replications was 1 m. During soil tillage, P fertilizer was added at a rate of 360 kg ha−1 as calcium superphosphate (15.5% P2O5), while K fertilizer was added at a rate of 120 kg ha−1 as potassium sulfate (48% K2O). Urea (46.5% N) was applied at 2 distinct rates: full dose (360 kg ha−1) for most treatments; two-thirds of a full dose (240 kg ha−1) split into 2 equal doses (before the first and second irrigations) for BM-inoculated treatments.
Cowpea seeds were obtained from the Horticulture Research Institute, SARS, Kafr El-Sheikh, Egypt, and sown on 20 May 2020, at a rate of 75 Kg ha−1. For soil tillage treatments, each plot included 5 ridges that were 4 m long and 60 cm apart. Three seeds were planted in each hole with a one-meter gap between replications. P and K were spread and integrated at rates of 360 kg and 120 kg ha−1, respectively, during soil tillage. Urea was applied at 2 distinct rates: full dosage (100 kg ha−1) for most treatments; one-third of a full dose (35 kg ha−1) split into 2 equal doses (before the first and second irrigations) for BM-inoculated treatments.

2.4. Measurements and Analyses

2.4.1. Estimations of the Microbial Community and Soil Enzymes

After 45 days from sowing, 10 g soil samples (rhizosphere) from each plot were collected in a bottle containing 90 mL of sterile water and shaken for 30 min at 150 rpm. According to [28], TCB was estimated using soil extract agar media, TCF was estimated using Martin’s medium, and TCA was estimated using Jensen’s medium. All microbial populations were expressed as the CFU (log 10) g−1 dry soil. Additionally, the number and dry weight of nodules (mg plant−1) were determined for cowpea plants. According to [29], soil samples were spectrophotometrically tested for dehydrogenase activity (mg TPF g−1 soil day−1) by reducing 2, 3, 5-triphenylotetrazolium chloride (TTC) to triphenyl formazon (red). The amount of ammonium produced by urea hydrolysis in soil was used to calculate the urease activity (mg NH4+-N g−1 soil day−1) of soil samples [30]. According to [31], the phosphatase activity (μg pnp g−1 soil h−1) of soil samples was assessed by hydrolyzing p-nitro-phenol phosphate to p-nitro-phenol (yellow).

2.4.2. Chemical and Physical Properties of Soil

After harvesting for all treatments, soil samples were taken from 3 successive depths (0–20, 20–40, and 40–60 cm) for physical and chemical investigation. According to [32], the salinity of saturated soil paste extract (ECe) and the exchangeable sodium percentage (ESP) were calculated. Using the core sample procedure outlined in [33], soil bulk density [34] and soil porosity were calculated through the following equation = (1 − (Bulk Density/Particle Density) × 100. The penetration resistance was measured using a cone penetrometer [35]. The infiltration rate was calculated using a double-cylinder infiltrometer [36]. Aggregate stability was determined using the sieve method [37].

2.5. Statistical Analysis

Data were statistically analyzed using Co Stat statistical software, version 6.303. The various treatments were compared using ANOVA. Multiple comparisons were performed via Tukey’s range tests at p ≤ 0.05 [38]. Data are presented as the mean ± SD and the Excel program, Office 2016 was used to prepare the figures for the manuscript.

3. Results

3.1. Biological Properties

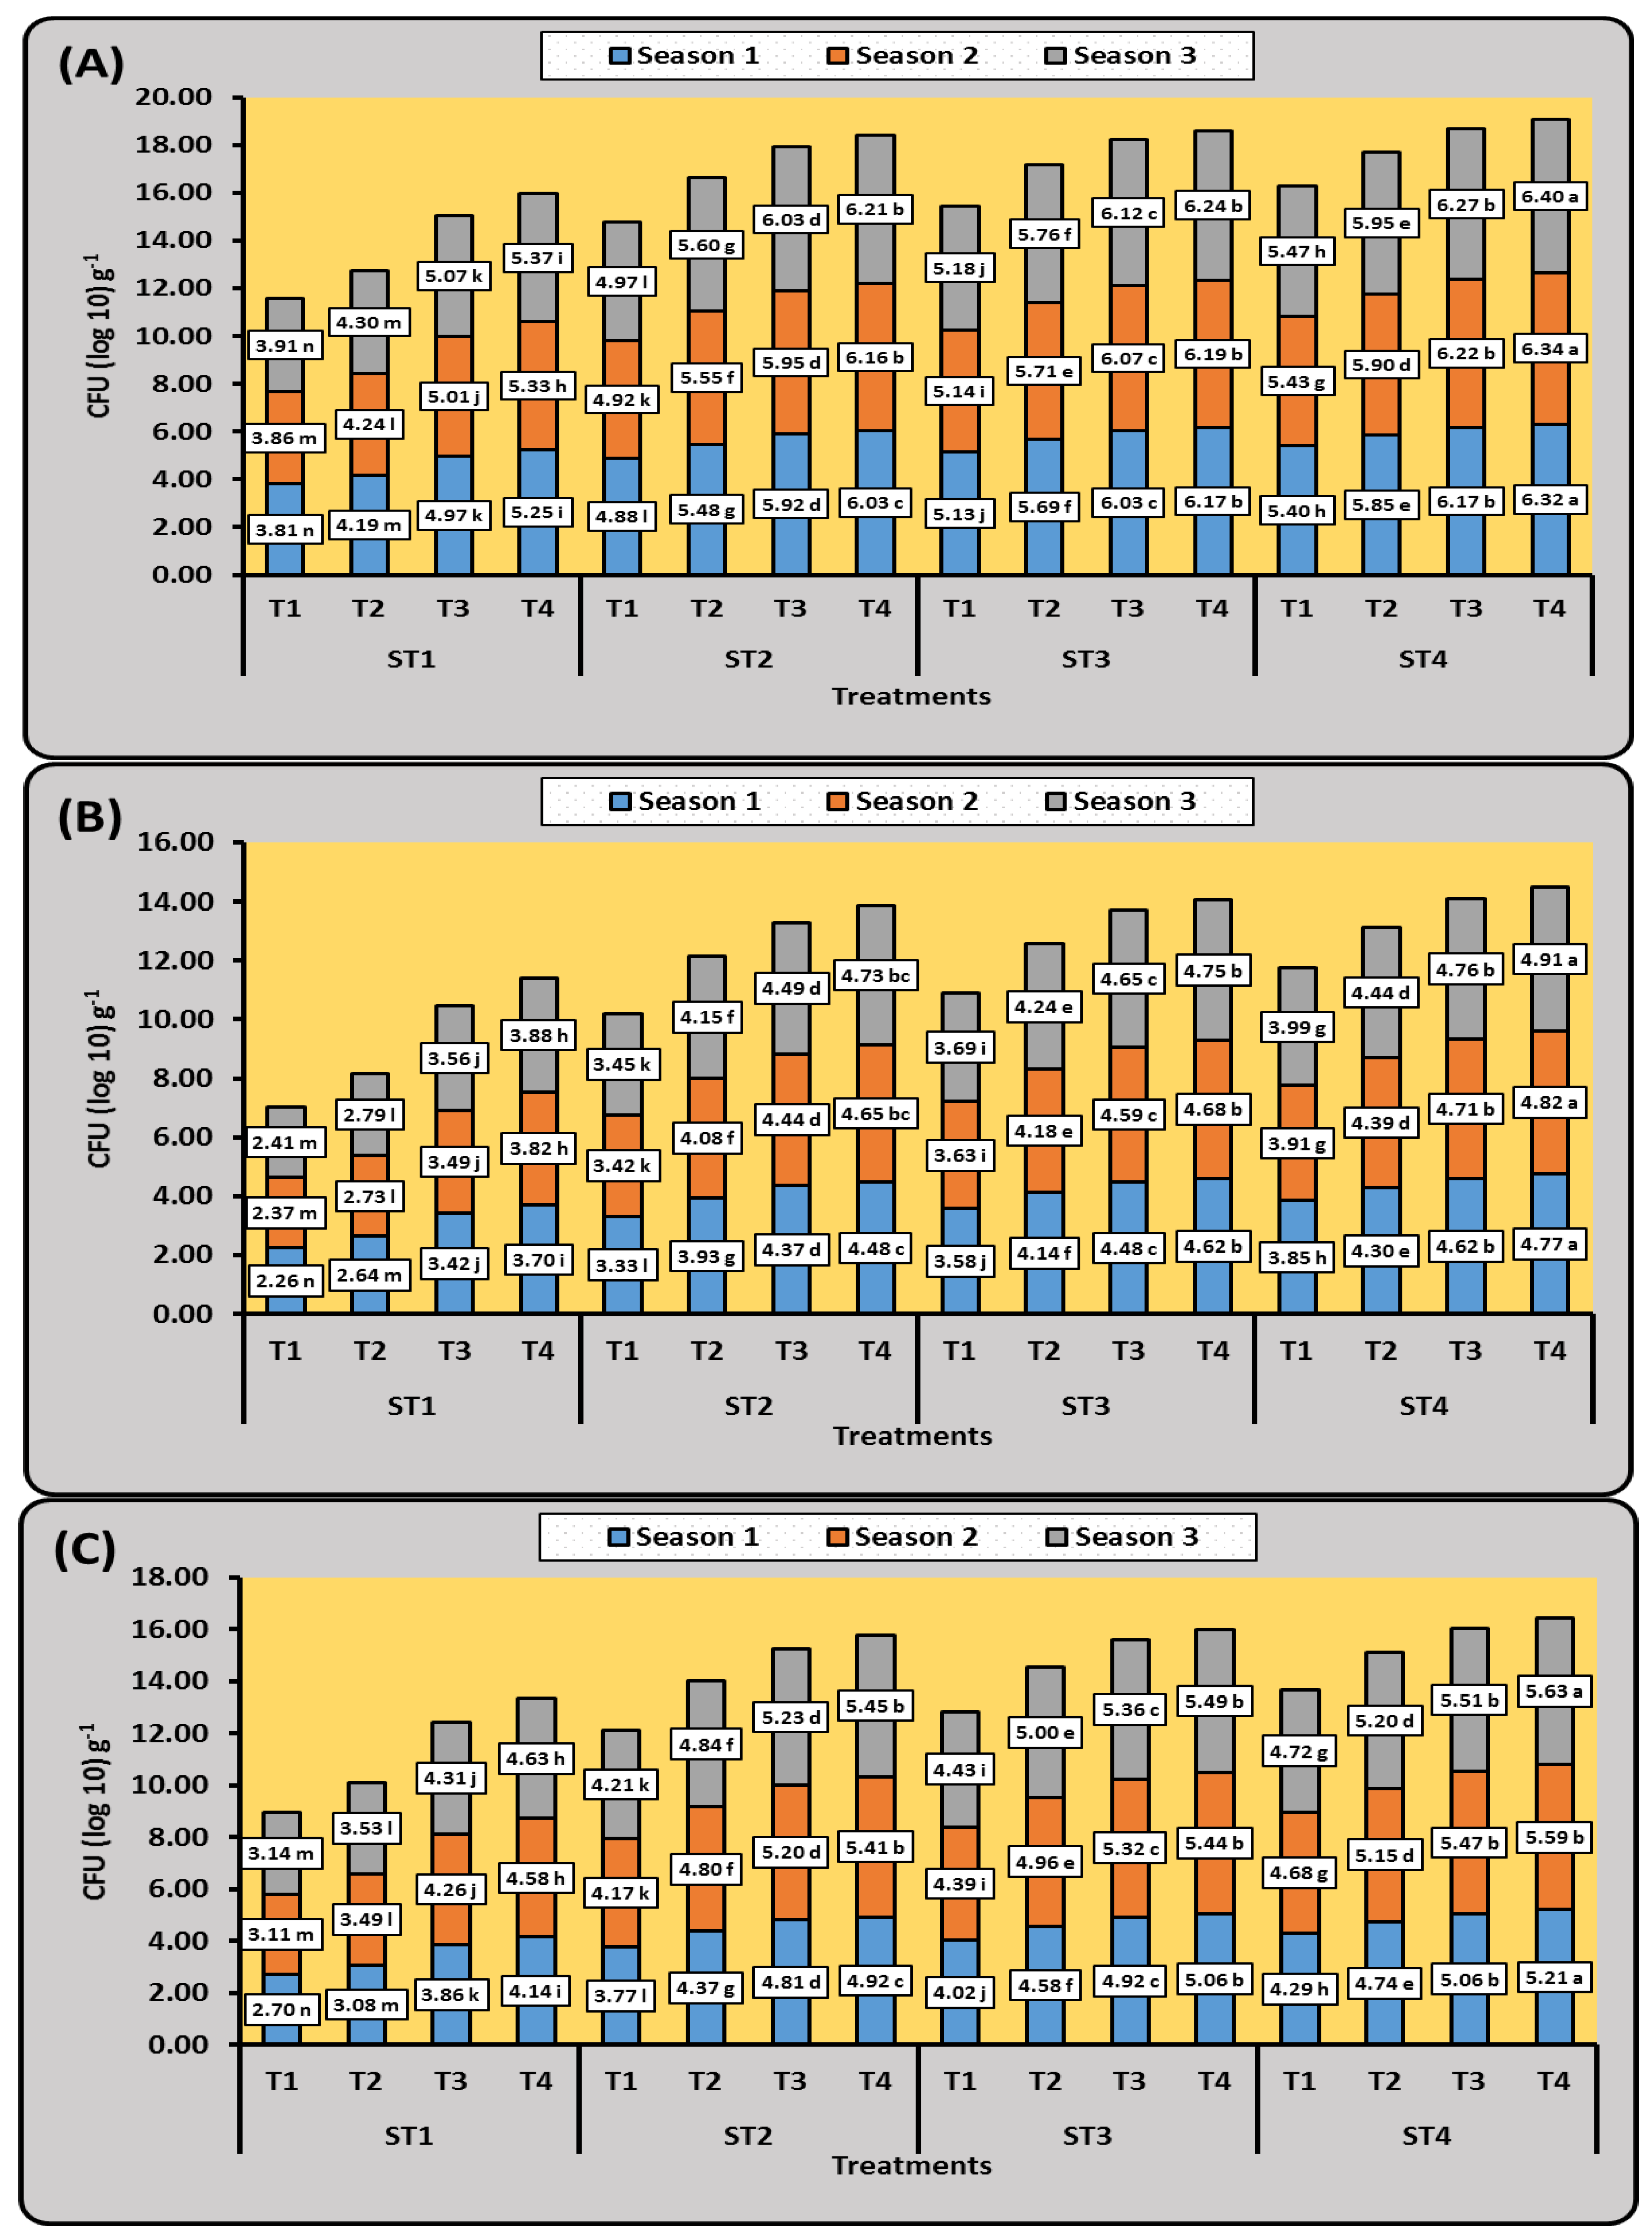
3.1.1. Microbial Community

In comparison with no-tillage treatments during the three growing seasons, soil tillage conditions resulted in a considerable reduction in the soil microbial structure. In terms of the overall counts of bacteria, fungi, and actinomycetes, there was also a significant interaction between the tillage and soil additives (Figure 2). Concisely, during the course of the experiment, soil treatments and soil tillage conditions dramatically affected the soil microbial population 45 days after seed sowing. Comparing the ST4 treatment (no-tillage) with other distinct tillage treatments, the ST4 treatment exhibited high microbial community levels (Figure 2). On the other hand, the dual application of BM + C to ST4 (no-tillage) significantly enhanced the total counts of bacteria (6.32, 6.34, and 6.40 Log CFU g−1; Figure 2A), the total counts of fungi (4.77, 4.82, and 4.91 Log CFU g−1; Figure 2B), and the total counts of actinomycetes (5.21, 5.59, and 5.63 Log CFU g−1; Figure 2C) during the three growing seasons, respectively, compared with the control.

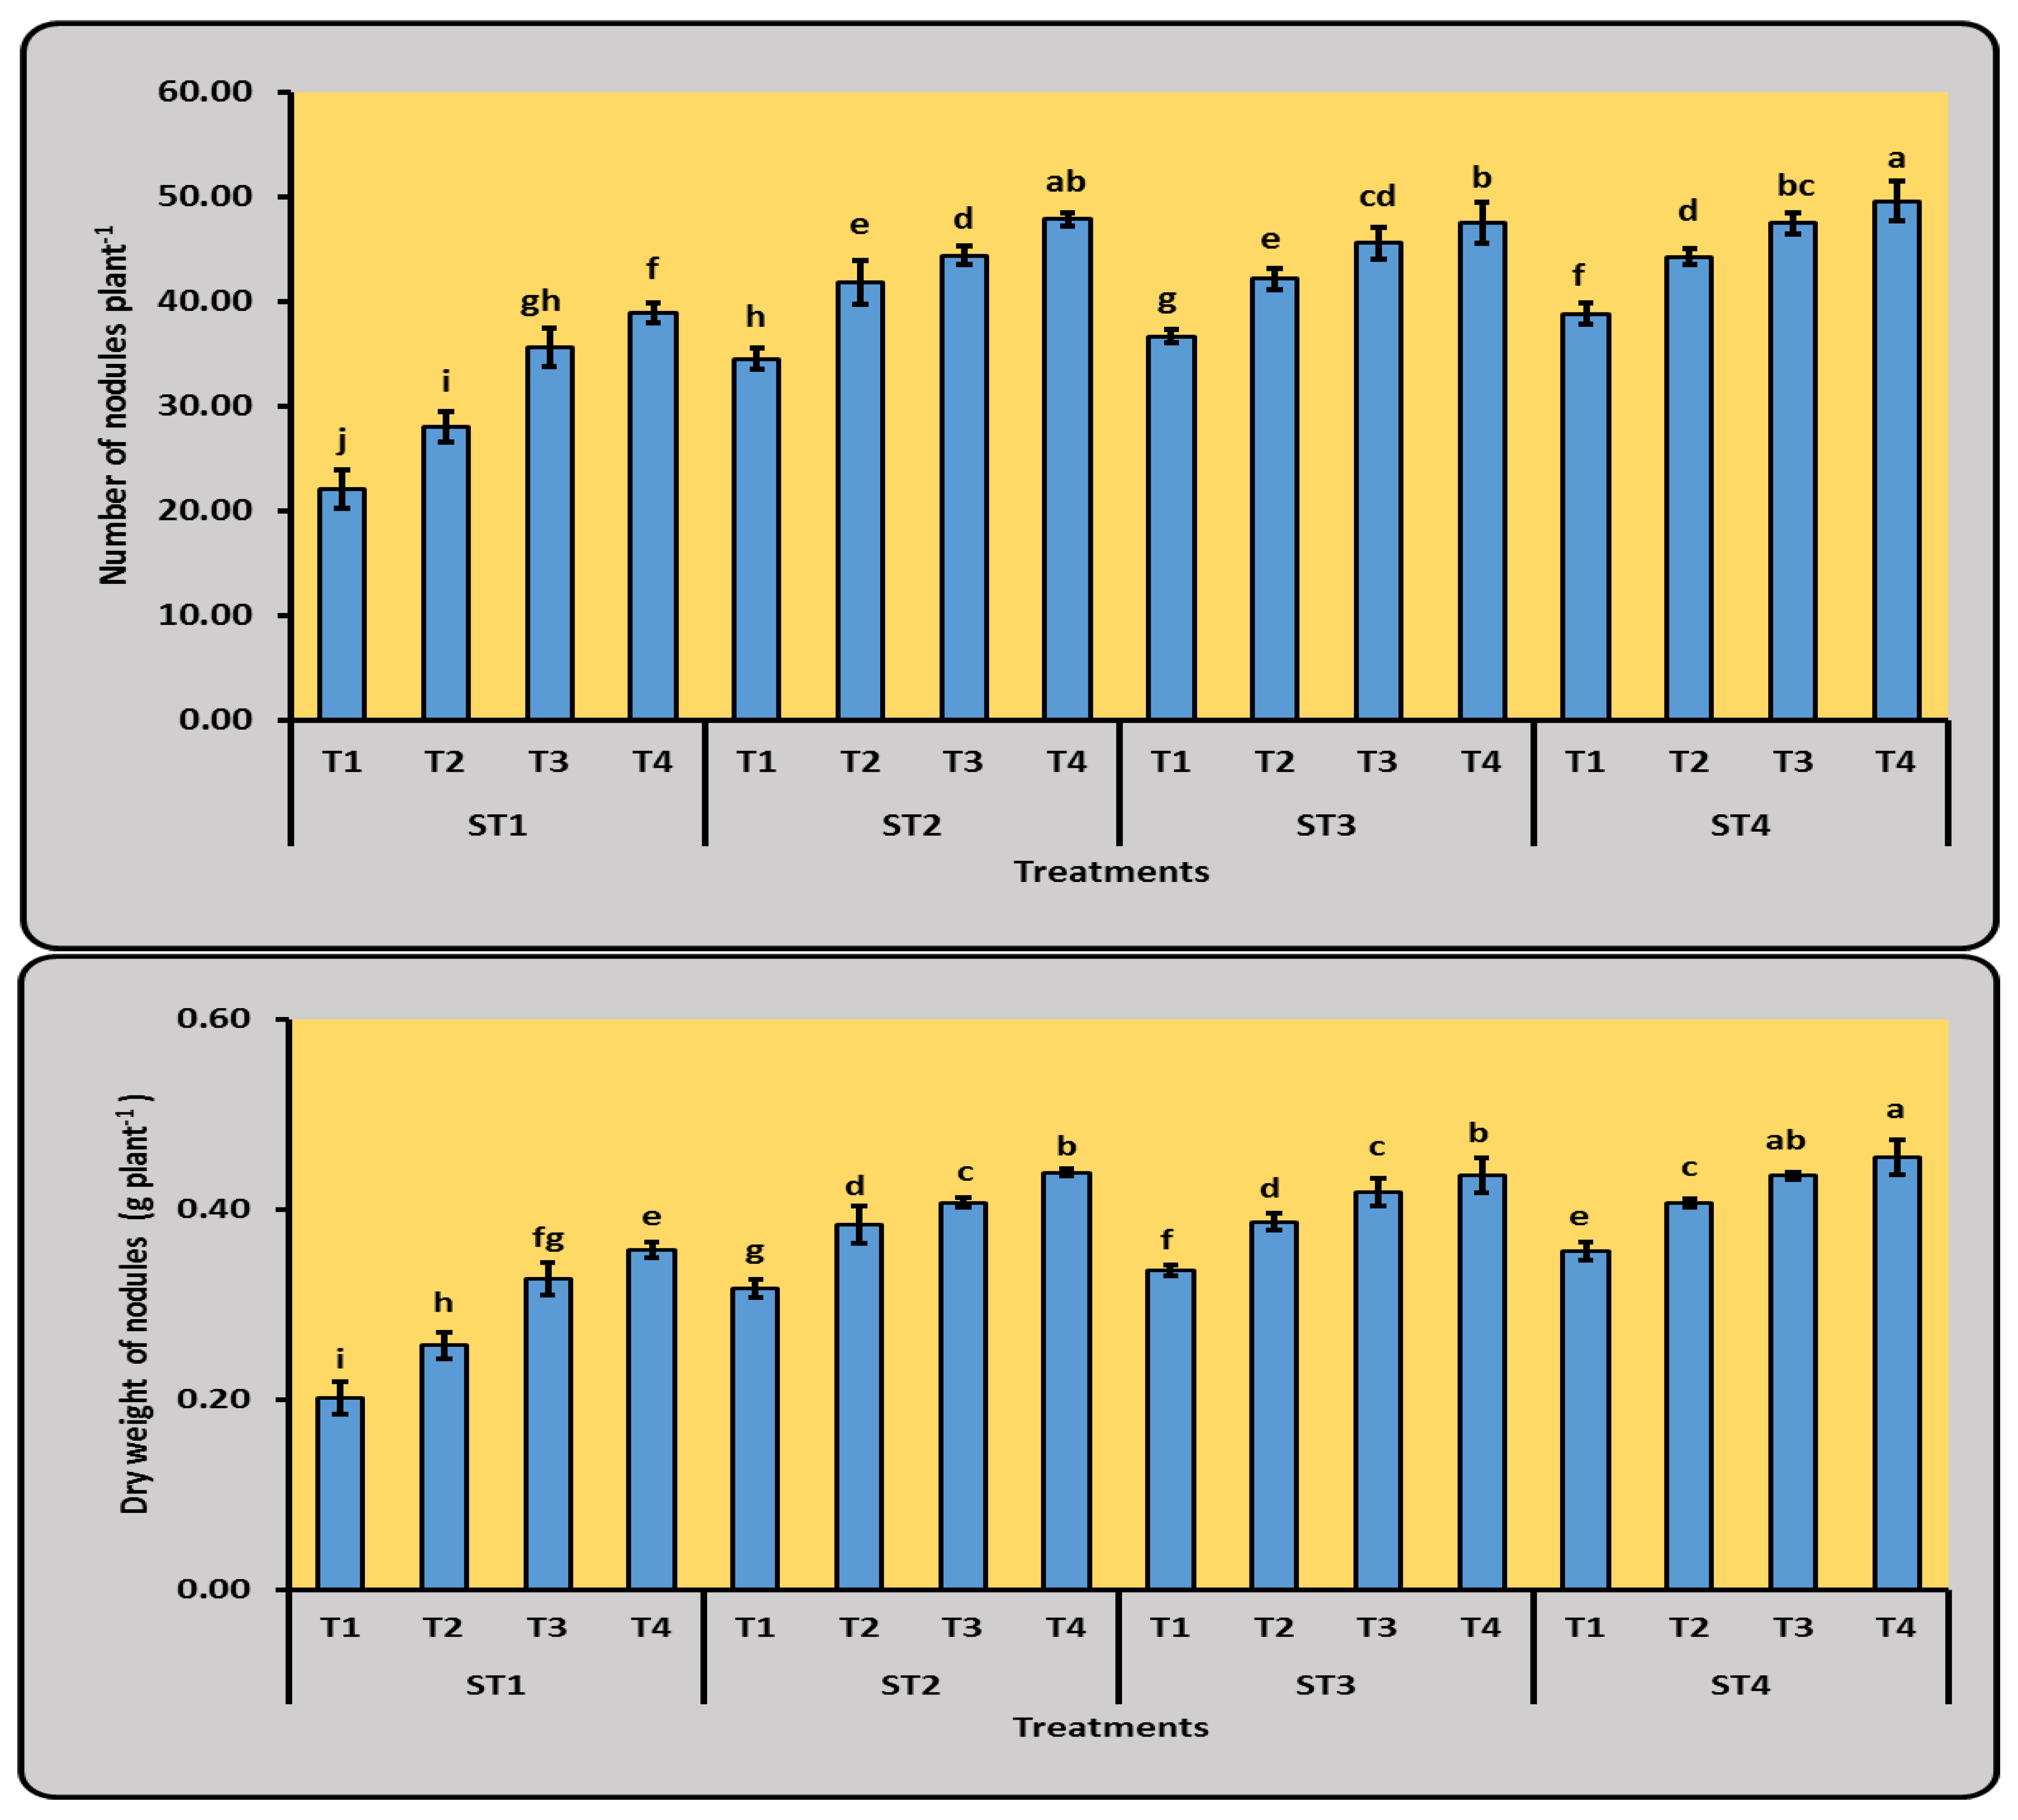
3.1.2. Number and Dry Weight of Nodules of Cowpea Plants

Figure 3 displays the number of nodules and dry weight of cowpea plants 45 days after planting that developed under various soil tillage and soil additive treatments. Under various soil tillage conditions, co-treatment with BM + C generally enhanced the number of nodules and dry weight of nodules per plant compared with BM, C, and control treatments. The number and dry weight of cowpea nodules were significantly affected by the interaction between the various soil tillage treatments and soil additives during the second growing season (Figure 3). In comparison with other treatments, the ST4T4 treatment (no-tillage and soil additives with BM + C) recorded high values of 49.57, followed by 47.83 for ST3T4 (tillage for the first season only + soil additives with BM + C), 47.50 for ST2T4 (tillage for the first and second seasons only + soil additives with BM + C), and 38.90 for ST1T4 (tillage for all seasons + soil additives with BM + C) (Figure 3). The same pattern was observed for the dry weight of nodules, which followed the trend of ST4 > ST3 > ST2 > ST1 for soil tillage treatments and T4 > T3 > T2 > T1 for soil additive treatments (Figure 3).

3.1.3. Soil Enzymes Activities

During the three growing seasons, the activity of soil dehydrogenase (mg TPF g−1 dry soil d−1), urease (mgNH4+ g−1 dry soil d−1), and phosphatase (μg pnp g−1 soil h−1) enzymes was dramatically reduced after applying soil tillage (Table 5). In the first season (wheat), second season (cowpea), and third season (wheat), dehydrogenase enzyme activity increased with the application of BM + C (T4) treatment by 216.00, 224.02, and 232.86 mg TPF g−1 dry soil d−1, respectively, compared with the control treatment (T1) under no-tillage treatment (ST4). On the other hand, the highest value of urease enzyme activity was 138.00, followed by 106.00 and 89.76 mgNH4+ g−1 dry soil d−1 for the ST4T4 treatment (no-tillage + BM + C), followed by the ST4T3 treatment (BM) and the ST4T2 treatment (C), over the control treatment (ST4T1) in the first season (Table 5).
In the second and third seasons, the same pattern was observed (Table 5). Additionally, in comparison with the other investigated treatments, the T4 treatment (BM + C) effectively enhanced the phosphatase enzyme activity by 5.16, 5.01, 4.87, and 4.09 μg pnp g−1 soil h−1 for ST4, ST3, ST2, and ST1, respectively, in the first season. In the second and third seasons, comparable findings were found (Table 5).

3.2. Chemical Properties of Soil

ECe and ESP

The results shown in Table 6 generally indicate that soil tillage and soil additives had an impact on the analyzed chemical characteristics of the soil (ECe and ESP), which exhibited a substantial decrease. The application of various soil tillage treatments during the examined seasons led to a significant increase in ECe, with ST4 being followed by ST3 > ST2 > ST1. On the other hand, during the identical treatments (soil tillage), ESP data showed a considerable drop. In contrast, compared with control plants over the growing seasons, the administration of the combined application or individual soil supplements considerably improved the soil ECe and ESP (Table 6).
In the first season, soil EC (dS m−1) dramatically decreased from 4.12 (control, T1) to 2.86 (C, T2), 3.22 (BM, T3), and 2.45 (C + BM, T4). When soil tillage was used throughout all seasons (ST1), a similar tendency was also seen in the second and third seasons. The optimum treatment for ESP, however, was a combined regimen (C + BM, T4). For instance, the first seasons showed the lowest values for ST1, ST2, ST3, and ST4 at 10.21, 10.08, 9.97, and 12.32%, respectively (Table 6).

3.3. Physical Properties of Soil

3.3.1. Soil bulk Density and Soil Porosity

The data (Table 7) demonstrated that, under various soil tillage settings during the examined growth seasons, soil additive treatments significantly affected soil bulk density and soil porosity. Different soil tillage treatments resulted in a noticeable increase in soil bulk density (kg m−3), with ST4 achieving the greatest values when compared with the other soil tillage treatments. On the other hand, under the key treatments (ST1, ST2, ST3, and ST4), soil porosity (%) showed a considerable decline.
In comparison with the other examined treatments at ST4 over the first, second, and third seasons, soil supplements (combined, T4) recorded values of 1.351, 1.353, and 1.362 kg m−3 for soil bulk density and 44.02%, 48.94%, and 48.59% soil porosity, respectively (Table 7). For soil bulk density, soil supplements were often organized as T4 (C + BM) < T3 (BM) < T2 (C) < T1 (control), and for soil porosity, T4 (C + BM) > T3 (BM) > T2 (C) > T1 (control).

3.3.2. Soil Aggregates

After three growing seasons, there was a substantial (p ≤ 0.05) interaction effect between tillage and soil additives on soil aggregates (%). Total stable aggregates and optimal-sized aggregates were significantly impacted by the tillage strategy (Table 8). In comparison with other soil tillage treatments, full-tillage (ST1) treatment produced the greatest values of total stable aggregates and optimal-sized aggregates. When compared with the control treatment (T1) under full-tillage treatment (ST1), the application of BM + C (T4) treatment recorded the highest values of 42.92%, 43.55%, and 44.41% for total stable aggregates in the first (wheat), second (cowpea), and third (wheat) seasons, respectively.
However, for ST1T4 treatments (tillage + BM + C), ST1T2 treatments (tillage + C), and ST1T3 treatments (tillage + BM), compared with the control treatment (ST1T1), the maximum values of optimal-sized aggregates were 24.73%, 23.59%, 20.76%, and 19.53%. The second and third growth seasons both showed similar patterns (Table 8).

3.3.3. Soil Penetration Resistance (SPRa) and Soil Infiltration Rate (IR)

The soil penetration resistance (SPRa) and infiltration rate (IR) values over the three growth seasons (wheat, cowpea, and wheat) that were impacted by various soil tillage and soil additive treatments are shown in Table 9. Under different soil tillage scenarios, SPRa results increased as the number of soil tillage operations increased (ST1 > ST2 > ST3 > ST4); however, the opposite transpired in the results for IR (ST1 < ST2 < ST3 < ST4). In comparison with BM, C, and control treatments, the SPRa achieved 1.089, 1.152, and 1.253 Mpa and the IR reached 0.803, 0.781, and 0.752 cmh−1 in the first, second, and third seasons under ST4 treatment, respectively (Table 9).

3.4. Yield of Wheat and Cowpea

According to the results detailed in Table 10, soil tillage practices and soil additives had the greatest impacts on the production of wheat and cowpea (grain and straw, ton ha−1) during the three growing seasons. When compared with a single treatment and the control, the combination treatment (no-tillage + BM + C, ST4T4) produced the highest grain yields of 4.991 and 5.325 for wheat. The straw yield also followed a similar trend, reaching 5.214 and 5.338 in the first and third seasons, respectively (Table 10).
In terms of cowpea yield (Table 10), a different increase was observed in the dual treatment under ST4 (no-tillage) compared with control and other studied treatments, where recorded yields of grain and straw for the second seasons were 4.188 and 4.513 ton ha−1 under the T4 treatment (BM + C), 3.782 and 3.480 ton ha−1 under the T3 treatment (BM), and 3.840 and 3.528 ton ha−1 under the T2 treatment (C).

4. Discussion

Crop growth and soil fertility have been shown to be significantly improved by soil tillage techniques and soil additives. The three growing seasons studied here assessed the combined impacts of compost and advantageous microorganisms on the microbial communities, enzyme activities, and physicochemical properties of the soil. Our findings support the hypothesis that beneficial microorganisms and compost can improve the microbial activity in wheat and cowpea plant rhizospheres, as reflected in the various soil properties and yield.
Farmland ecosystems evolve, in part, due to the role played by soil microbes. In addition to being the primary factor in encouraging and maintaining material circulation and energy flow, microbes are the primary force behind the movement of soil nutrients and organic matter [39]. Figure 2 indicates that the ST4T4 treatment cultured a larger microbial community than the other treatments.
The plausible explanation is that no-tillage treatments induced less mechanical soil disturbance and higher surface soil water content, which promoted the restoration of soil microbial genotypes under favorable conditions. As a result, short-term modifications to agricultural practices can alter the traits of soil microbial communities [40]. Similar results were found by [12], who observed that the application of soil additives, such as farmyard manure and compost under no-tillage conditions, dramatically boosted soil microbial populations. This may be due to the fact that the addition of organic fertilizer increases the organic matter content of soil and enhances its characteristics, which, in turn, boosts the diversity of microbial communities and metabolic activities in the soil [41,42,43].
Legume crops always exhibited a positive trend, which encouraged soil microbial activities, and always had a favorable impact on the release of crucial nutrients into the soil that are necessary for both plant and microbial growth [44]. According to [45], the cultivation of legume plants (chickpea, lentil, and lathyrus) with bio-mulching (maize stalk mulch + paddy straw (5 t ha−1)), combined with no tillage, will not only boost the soil microbial communities but also improve the soil fertility status.
Soil enzymatic activity, which fluctuates with farming practices and fertilization, is a sensitive indicator of environmental changes. The soil’s organic matter content and environmental conditions, which are crucial in regulating the overall nutrient cycle and availability, influence variations in enzyme activity [46,47,48].
By combining soil additions with no-tillage farming practices, the enzyme activities of soil dehydrogenase, urease, and phosphatase were considerably improved (Table 5). Soil dehydrogenase activity is crucial because it indicates the biological activity of soil microflora, which is influenced by a number of soil-related variables, including moisture content, redox potential, and organic matter concentration [49]. According to [13], the soils used for organic farming and those with minimal tillage exhibit the highest levels of dehydrogenase activity, which helps to maintain soil fertility and produce stable crops because they use less mineral fertilizer. In the no-tillage practice, the co-application of compost and BM created favorable circumstances for increased urease activity (Table 5). According to [50], applying manure to soil increases urease activity and combats soil compaction. According to research presented in [12], applying compost and farmyard manure to sunflower fields without tillage significantly increases the activity of the urease enzyme. In a maize–soybean rotation that has been in place for 18 years in eastern Canada, [51] found that the activity of alkaline phosphatase was higher under no-tillage (NT) management than moldboard plough (MP) management during the maize growing season. The increased hydrolysis of organically bound phosphate into free ions, which plants can absorb, may be caused by increased phosphatase activity.
According to the results, the combined application or individual soil supplements considerably improved the soil ECe and ESP under ST4 treatment (no-tillage), as shown in (Table 6). Increases in soil EC and decreases in ESP can both result in declines in soil quality. The surface soil in this system is not mixed with the deeper layers; therefore, the greater level of EC can be attributed to salt buildup in the soil. In comparison with a conventional tillage (CT) system, [52] discovered that a minimum tillage (MT) system had higher soil EC. However, [53] determined that the EC under the no-tillage method was higher than the EC under the MT and CT systems; they were unable to distinguish between the MT and CT systems. According to [54], the tillage system has no appreciable short-term impact on soil EC. At deeper soil layers (5–15 and 15–30 cm), EC levels were not significantly affected by the tillage system [55].
The soil bulk density (kg m−3) increased noticeably as a result of various soil tillage practices, with ST4 exhibiting the highest values when compared with the other soil tillage practices. In addition, soil porosity (%) showed significant decreases under the key treatments: ST1, ST2, ST3, and ST4 (Table 7). The short-term increase in soil BD with less tillage is mostly caused by minimal or no mechanical rupture and the subsequent compaction of the soil surface layer. Decreases in mechanical rupture and the subsequent compactions of soil surface layers are the main factors contributing to increases in soil BD under reduced tillage in the short term [56,57].
No-tillage systems have been widely used because of their known benefits to soil properties, including improvements in moisture content, reductions in temperature oscillations, the prevention of water and wind erosion, and increases in soil BD [58,59], which are consistent with the findings of this study. Additionally, [60] reported that the addition of inorganic fertilizers results in a reduction in BD, which is attributable to the increase in nutrients in the soil, particularly the content of organic matter. Moreover, in line with our findings, conservation tillage tends to increase connectivity and pore dispersion due to biological activity, which means that plant root growth and water infiltration may not be significantly constrained [61].
The total stable aggregates and the optimal-sized aggregates were strongly impacted by the tillage method, according to the interaction effect of tillage and soil additives on the percentage of soil aggregates (Table 8). Some of the effects of tillage on soil qualities that have been mentioned are related to how crop residues are integrated into the system, which means that tillage intensity influences both the quantity and depth of incorporated residues. In fact, because it mixes crop residue into the soil, disturbs soil aggregates, and increases soil aeration, vigorous tillage can decrease the storage of soil nutrients [62].
Taylor [41] found that the soil fauna is irritated by the frequent application of soil additives (mineral fertilizers) on the soil surface, which reduces pore formation and aggregate stability and results in higher bulk density and poorer moisture retention.
The SPRa results improved as more soil tillage operations were conducted under various soil tillage conditions, following the trend of ST1 > ST2 > ST3 > ST4. However, the opposite was true in the IR results: ST1 < ST2 < ST3 < ST4 (Table 9). In a similar study [63], there was greater penetration resistance with no tillage than with conventional tillage. Furthermore, soils that received a high application of NPK fertilizer demonstrated a greater penetration resistance of sandy clay loam under reduced tillage than soils that received a medium or low application, according to the research presented in [64]. Under both no-tillage and conventional tillage scenarios, a further impact of soil moisture content on penetration resistance was observed at soil depths between 30 and 35 cm. It has been posited that high penetration resistance is induced by encouraging the growth of more plant roots that use more moisture at this depth or by utilizing a plough pan or residual plough pan [41].
Our findings, detailed in Table 10, show that over the three growing seasons, soil tillage techniques and soil additives had the greatest effects on the yields of wheat and cowpea (grain and straw, ton ha−1); the combination treatment (BM + C) performed the best, with the highest grains and straw yields. According to [65], increased grain N uptake under decreased tillage systems with no N constraints leads to higher grain yields. In [66], the effect of tillage and N application on maize output was assessed; the findings indicated that decreased tillage systems required greater N application to produce their highest possible grain yield. Similarly to conventional tillage systems, reduced tillage requires the application of 16–55 kg ha−1 more N to reach its maximum grain yield, according to [67].
As long as organic fertilizer compensates for the lower nitrate and nitrogen levels typically found under limited tillage compared with conventional tillage systems, [68] reported that equivalent yields of wheat and maize can be achieved under various tillage management conditions. Wheat and cowpea grain yields were significantly affected by the interaction between tillage and soil additive rates (p ≤ 0.05). According to [55], the highest grain production was obtained using a minimum tillage system with the application of 250 kg of nitrogen per hectare, which is 38% more nitrogen than a conventional tillage system requires at the same rate. Therefore, better understanding of the interactions between specific cropping systems and other crop management practices, their resulting changes in soil microbial ecology, and their roles and effects on crop health and productivity is required for the creation of more efficient and sustainable crop production systems.

5. Conclusions

In developing countries, the trend towards reducing tillage operations is inevitable in sustainable agriculture in order to preserve crop yields as well as to preserve the chemical, physical, and biological properties of soil.
Based on the results of our short-term study, the combination treatment (no-tillage + C + BM, ST4T4) provided high levels of microbial communities, increased numbers and dry weights of cowpea plants’ nodules, and increased soil enzymes during the three growing seasons. Additionally, the application of different soil tillage treatments during the analyzed seasons resulted in considerable increases in electrical conductivity, bulk density, and soil infiltration rate, following the trend of ST4 > ST3 > ST2 > ST1, which was reflected in the productivity of the wheat and cowpea plants. However, the percentage of exchangeable sodium, the porosity of the soil, the aggregates, and the soil penetration resistance were found to be inversely related. In order to investigate the potential impact of reduced tillage on soil attributes, the study of wheat–cowpea systems should be continued in the longer term. Through streamlined tillage procedures that cause less interference with the soil surface layer, improvements in soil characteristics and enhancements in biological activity aid in maintaining the productivity and fertility of soil.

Author Contributions

Conceptualization, M.M.A., M.E., M.A. and A.E.-D.O.; methodology, M.M.A., M.A. and A.E.-D.O.; software, M.M.A. and A.E.-D.O.; validation, M.M.A., M.E., M.A. and A.E.-D.O.; formal analysis, M.M.A. and A.E.-D.O.; investigation, M.M.A. and A.E.-D.O.; resources, M.M.A., M.A. and A.E.-D.O. data curation, M.M.A. and A.E.-D.O.; writing—original draft preparation, M.M.A. and A.E.-D.O.; writing—review and editing, M.M.A. and A.E.-D.O.; visualization, M.M.A., M.E., M.A. and A.E.-D.O.; supervision, M.M.A. and A.E.-D.O.; project administration, M.M.A. and A.E.-D.O.; funding acquisition, M.E. All authors have read and agreed to the published version of the manuscript.

Funding

This research received no external funding.

Data Availability Statement

The study did not report any data.

Acknowledgments

The authors extend their appreciation to the Deanship of Scientific Research at King Khalid University for funding this study through the Large Groups Project under grant number RGP2/164/44. All of the authors are grateful for the support provided by the Faculty of Agriculture, Benha University, Egypt and the Soils, Water, and Environment Research Institute (SWERI), Agriculture Research Center (ARC), Egypt.

Conflicts of Interest

The authors declare no conflict of interest.

References

  1. Janke, R.R.; Papendick, R.I. Preface. In Defining Soil Quality for a Sustainable Environment; Soil Science Society of America and American Society of Agronomy; Doran, J.W., Coleman, D.C., Bezdicek, D.F., Stewart, B.A., Eds.; Madison: New York, NY, USA, 1994. [Google Scholar]
  2. Fuentes, M.; Govaerts, B.; De Leon, F.; Hidalgo, C.; Dendooven, L.; Sayre, K.D.; Etchevers, J. Fourteen years of applying zero and conventional tillage, crop rotation and residue management systems and its effect on physical and chemical soil quality. Eur. J. Agron. 2009, 30, 228–237. [Google Scholar] [CrossRef]
  3. So, H.B.; Grabski, A.; Desborough, P. The impact of 14 years of conventional and no-till cultivation on the physical properties and crop yields of a loam soil at Grafton NSW, Australia. Soil Tillage Res. 2009, 104, 180–184. [Google Scholar] [CrossRef]
  4. Govaerts, B.; Mezzalama, M.; Sayre, K.D.; Crossa, J.; Lichter, K.; Troch, V.; Vanherck, K.; De Corte, P.; Decker, J. Long-term consequences of tillage, residue management, and crop rotation on selected soil micro-flora groups in the subtropical highlands. Appl. Soil Ecol. 2008, 38, 197–210. [Google Scholar] [CrossRef]
  5. Kandeler, E.; Tscherko, D.; Spiegel, H. Long-term monitoring of microbial biomass, N mineralisation and enzyme activities of a Chernozem under different tillage management. Biol. Fertil. Soils 1999, 28, 343–351. [Google Scholar] [CrossRef]
  6. Bekele, D. The Effect of Tillage on Soil Moisture Conservation: A Review. Int. J. Res. Stud. Comput. 2020, 6, 30–41. [Google Scholar]
  7. Page, K.L.; Dang, Y.P.; Dalal, R.C. The ability of conservation agriculture to conserve soil organic carbon and the subsequent impact on soil physical, chemical, and biological properties and yield. Front. Sustain. Food Syst. 2020, 4, 31. [Google Scholar] [CrossRef]
  8. Mitchell, J.P.; Carter, L.M.; Reicosky, D.C.; Shrestha, A.; Pettygrove, G.S.; Klonsky, K.M.; Marcum, D.B.; Chessman, D.; Roy, R.; Hogan, P.; et al. A history of tillage in California’s Central Valley. Soil Tillage Res. 2016, 157, 52–64. [Google Scholar] [CrossRef]
  9. Khurshid, K.; Iqbal, M.; Arif, M.S.; Nawaz, A. Effect of tillage and mulch on soil physical properties and growth of maize. Int. J. Agric. Biol. 2006, 8, 593–596. [Google Scholar]
  10. Adugna, O. Effects of tillage practices and cropping system on soil physical properties and in-situ water conservation in clay loam of Assosa, Ethiopia. Int. J. Agric. Res. Rev. 2019, 7, 794–802. [Google Scholar]
  11. Ulrich, S.; Tischer, S.; Hofmann, B.; Christen, O. Biological soil properties in a long-term tillage trial in Germany. J. Plant Nutr. Soil Sci. 2010, 173, 483–489. [Google Scholar] [CrossRef]
  12. Mohammadi, K.; Heidari, G.; Javaheri, M.; Karimi Nezhad, M.T. Soil microbial response to tillage systems and fertilization in a sunflower rhizosphere. Arch. Geonomy Soil Sci. 2013, 59, 899–910. [Google Scholar] [CrossRef]
  13. Szostek, M.; Szpunar-Krok, E.; Pawlak, R.; Stanek-Tarkowska, J.; Ilek, A. Effect of different tillage systems on soil organic carbon and enzymatic activity. Agronomy 2022, 12, 208. [Google Scholar] [CrossRef]
  14. Aiad, M. Productivity of heavy clay soils as affected by some soil amendments combined with irrigation regime. Environ. Biodivers. Soil Secur. 2019, 3, 147–162. [Google Scholar] [CrossRef]
  15. Duong, T.T.; Penfold, C.; Marschner, P. Amending soils of different texture with six compost types: Impact on soil nutrient availability, plant growth and nutrient uptake. Plant Soil 2012, 354, 197–209. [Google Scholar] [CrossRef]
  16. Brown, S.; Cotton, M. Changes in soil properties and carbon content following compost application: Results of on-farm sampling. Compost. Sci. Util. 2011, 19, 87–96. [Google Scholar] [CrossRef]
  17. Chang, E.H.; Wang, C.H.; Chen, C.L.; Chung, R.S. Effects of long-term treatments of different organic fertilizers complemented with chemical N fertilizer on the chemical and biological properties of soils. Soil Sci. Plant. Nutr. 2014, 60, 499–511. [Google Scholar] [CrossRef]
  18. Omonode, R.A.; Smith, D.R.; Gal, A.; Vyn, T.J. Soil nitrous oxide emissions in corn following three decades of tillage and rotation treatments. Soil Sci. Soc. Am. J. 2011, 75, 152–163. [Google Scholar] [CrossRef]
  19. Chavarría, D.N.; Verdenelli, R.A.; Serri, D.L.; Restovich, S.B.; Andriulo, A.E.; Meriles, J.M.; Vargas-Gil, S. Effect of cover crops on microbial community structure and related enzyme activities and macronutrient availability. Eur. J. Soil Biol. 2016, 76, 74–82. [Google Scholar] [CrossRef]
  20. Tian, Y.; Zhang, X.; Wang, J.; Gao, L. Soil microbial communities associated with the rhizosphere of cucumber under different summer cover crops and residue management: A 4-year field experiment. Sci. Hortic. 2013, 150, 100–109. [Google Scholar] [CrossRef]
  21. Capo-Bauca, S.; Marques, A.; Llopis-Vidal, N.; Bota, J.; Baraza, E. Long-term establishment of natural green cover provides agroecosystem services by improving soil quality in a Mediterranean vineyard. Ecol. Eng. 2019, 127, 285–291. [Google Scholar] [CrossRef]
  22. Saikia, R.; Sharma, S.; Thind, H.S.; Sidhu, H.S.; Yadvinder, S. Temporal changes in biochemical indicators of soil quality in response to tillage, crop residue and green manure management in a rice-wheat system. Ecol. Indic. 2019, 103, 383–394. [Google Scholar] [CrossRef]
  23. Nunes, M.R.; Karlen, D.L.; Veum, K.S.; Moorman, T.B.; Cambardella, C.A. Biological soil health indicators respond to tillage intensity: A US metaanalysis. Geoderma 2020, 369, 114335. [Google Scholar] [CrossRef]
  24. Sharma, S.; Dhaliwal, S.S. Conservation agriculture based practices enhanced micronutrients transformation in earthworm cast soil under rice-wheat cropping system. Ecol. Eng. 2021, 163, 106195. [Google Scholar] [CrossRef]
  25. Wortman, S.E.; Drijber, R.A.; Francis, C.A.; Lindquist, J.L. Arable weeds, cover crops, and tillage drive soil microbial community composition in organic cropping systems. Appl. Soil Ecol. 2013, 72, 232–241. [Google Scholar] [CrossRef]
  26. Vincent, J.M. A Manual for the Practical Study of Root-Nodule Bacteria; Blackwell: Oxford, UK, 1970. [Google Scholar]
  27. Döbereiner, J.; Day, J.M. Associative Symbiosis in Tropical Grasses: Characterization of Microorganisms and Dinitrogen Fixing Sites in Sysposium on Nitrogen Fixation; Washington State University Press: Washington, WA, USA, 1976. [Google Scholar]
  28. Allen, O.N. Experiments in Soil Bacteriology; Wisconsin Univeristy Press: Madison, WI, USA, 1959; p. 202. [Google Scholar]
  29. Casida, L.E.; Klein, D.A.; Snatoro, T. Soil dehydrogenase activity. Soil Sci. 1964, 98, 371–376. [Google Scholar] [CrossRef]
  30. Pancholy, S.K.; Rice, E.L. Soil enzymes in relation to old succession: Amylase, invertase, cellulose, dehydrogenase and urease. Soil Sci. Soc. Am. Proc. 1973, 37, 47–50. [Google Scholar] [CrossRef]
  31. Tabatabai, M.A. Soil enzymes. In Methods of Soil Analysis. Part 2: Chemical and Microbiological Properties; Page, A.L., Miller, R.H., Keeney, D.R., Eds.; American Society of Agronomy: Madison, WI, USA, 1982; pp. 903–948. [Google Scholar]
  32. Page, A.L.R.; Miller, H.; Keeney, D.R. Methods of Soil Analysis. Part 2: Chemical and Microbiological Properties, 2nd ed.; Agronomy Monograph No. 9; ASA, CSSA & SSSA: Madison, WI, USA, 1982. [Google Scholar]
  33. Campbell, D.J. Determination and use of bulk density in relation to soil compaction. In Soil Compaction in Crop Production; Soane, B.D., van Ouwerkerk, C., Eds.; Elsevier: London, UK; Amsterdam, The Netherlands, 1994. [Google Scholar]
  34. Garcia, G. Soil Water Engineering Laboratory Manual; Colorado State University Department of Agriculture and Chemical Engineering: Fortcollins, CO, USA, 1978. [Google Scholar]
  35. Anderson, G.; Pidgeon, J.D.; Spencer, H.B.; Parks, R. A new hand-held recording penetrometer for soil studies. J. Soil Sci. 1980, 31, 279–296. [Google Scholar] [CrossRef]
  36. Tricker, A.S. The infiltration cylinder: Some comments on its use. J. Hydrol. 1978, 36, 383–391. [Google Scholar] [CrossRef]
  37. Kemper, W.D.; Rosenau, R.C. Aggregate stability and size distribution. In Methods of Soil Analysis. 1986, Part I (425–442); Klute, A., Campbell, G.S., Jacson, R.D., Mortland, M.M., Nielsen, D.R., Eds.; ASA, CSSA & SSSA: Madison, WI, USA.
  38. Gomez, K.A.; Gomez, A. Statistical Procedure for Agricultural Research—Hand Book; John Wiley & Sons: New York, NY, USA, 1984. [Google Scholar]
  39. Nyambo, P.; Thengeni, B.; Chiduza, C.; Araya, T. Tillage, crop rotation, residue management and biochar influence on soil chemical and biological properties. S. Afr. J. Plant Soil 2021, 38, 390–397. [Google Scholar] [CrossRef]
  40. Minoshima, H.; Jackson, L.E.; Cavagnaro, T.R.; Sánchez-Moreno, S.; Ferris, H.; Temple, S.R.; Goyal, S.; Mitchell, J.P. Soil food webs and carbon dynamics in response to conservation tillage in California. Soil Sci. Soc. Am. J. 2007, 71, 952–963. [Google Scholar] [CrossRef]
  41. Taylor, T.S.; Titshall, L.W.; Hughes, J.C.; Thibaud, G.R. Effect of tillage systems and nitrogen application rates on selected physical and biological properties of a clay loam soil in KwaZulu-Natal, South Africa. S. Afr. J. Plant Soil 2012, 29, 47–52. [Google Scholar] [CrossRef]
  42. Xing, P.F.; Wu, X.S.; Gao, S.C.; Li, H.J.; Zhao, T.K.; Zhou, X.L.; Shen, D.L.; Sun, J.D. Effects of different fertilization on soil microbial community and functional diversity in maize-wheat crop rotation. J. Microbiol. 2016, 36, 22–29. [Google Scholar]
  43. Zhang, D.; Yang, X.; Wang, Y.; Zong, J.; Ma, J.; Li, C. Changes in soil organic carbon fractions and bacterial community composition under different tillage and organic fertiliser application in a maize−wheat rotation system. Acta Agric. Scand. Sect. B Soil Plant Sci. 2020, 70, 457–466. [Google Scholar] [CrossRef]
  44. Roldán, A.; Caravaca, F.; Hernández, M.T.; Garcıa, C.; Sánchez-Brito, C.; Velásquez, M.; Tiscareno, M. No-tillage, crop residue additions, and legume cover cropping effects on soil quality characteristics under maize in Patzcuaro watershed (Mexico). Soil Tillage Res. 2003, 72, 65–73. [Google Scholar] [CrossRef]
  45. Dey, J.K.; Saren, B.K.; Debnath, A.; Gudade, B.A.; Singh, S.; Kumar, A.; Palai, J.B.; Gaber, A.; Hossain, A. Productivity and Nutrient Dynamic of Legume in a Maize-legume Cropping System are Influenced by Biomulches Under No-tillage System. Int. J. Plant Prod. 2022, 16, 531–545. [Google Scholar] [CrossRef]
  46. Chen, C.R.; Condron, L.M.; Davis, M.R.; Sherlock, R.R. Seasonal changes in soil phosphorus and associated microbial properties under adjacent grassland and forest in New Zealand. For. Ecol. Manag. 2003, 177, 539–557. [Google Scholar] [CrossRef]
  47. Bieli´nska, E.; Mocek-Płóciniak, A. Impact of the Tillage System on the Soil Enzymatic Activity. Arch. Environ. Prot. 2012, 38, 75–82. [Google Scholar] [CrossRef]
  48. Tomkowiak, A.; Starzyk, J.; Kosicka-Dziechciarek, D.; Karwatka, K. The influence of tillage systems on the microbiological conditions of soil. Nauka Przyr. Technol. 2017, 11, 355–364. [Google Scholar]
  49. Yang, L.; Li, T.; Li, F.; Lemcoff, J.H.; Cohen, S. Fertilization regulates soil enzymatic activity and fertility dynamics in a cucumber field. Sci. Hortic. 2008, 116, 21–26. [Google Scholar] [CrossRef]
  50. Shirani, H.; Hajabbasi, M.A.; Afyuni, M.; Hemmat, A. Effects of farmyard manure and tillage systems on soil physical properties and corn yield in central Iran. Soil Tillage Res. 2002, 68, 101–108. [Google Scholar] [CrossRef]
  51. Shi, Y.; Lalande, R.; Hamel, C.; Ziadi, N.; Gagnon, B.; Hu, Z. Seasonal variation of microbial biomass, activity, and community structure in soil under different tillage and phosphorus management practices. Biol. Fertil. Soils 2013, 49, 803–818. [Google Scholar] [CrossRef]
  52. Alijani, K.; Bahrani, M.; Kazemeini, A. Short-term responses of soil and wheat yield to tillage, corn residue management and nitrogen fertilization. Soil Tillage Res. 2017, 124, 78–82. [Google Scholar] [CrossRef]
  53. Perez-Brandán, C.; Arzeno, J.L.; Huidobro, J.; Grümberg, B.; Conforto, C.; Hilton, S.; Bending, G.D.; Meriles, J.M.; Vargas-Gil, S. Long-term effect of tillage systems on soil microbiological, chemical and physical parameters and the incidence of charcoal rot by Macrophomina phaseolina (Tassi) Goid in soybean. Crop Prot. 2012, 40, 73–82. [Google Scholar] [CrossRef]
  54. Naderi, R.; Ghadiri, H. Nitrogen, manure and municipal waste compost effects on yield and photosynthetic characteristics of corn (Zea mays L.) under weedy conditions. J. Biol. Environ. Sci. 2013, 7, 141–151. [Google Scholar]
  55. Moinoddini, S.S.; Koocheki, A.; Mahalati, M.N.; Borzooei, A. Tillage and N application effects on crop yield, N uptake and soil properties in a corn-based rotation. Arch. Agron. Soil Sci. 2017, 63, 1150–1162. [Google Scholar] [CrossRef]
  56. Balesdent, J.; Chenu, C.; Balabane, M. Relationship of soil organic matter dynamics to physical protection and tillage. Soil Tillage Res. 2000, 53, 215–230. [Google Scholar] [CrossRef]
  57. Ozpinar, S.; Ozpinar, A. Tillage effects on soil properties and maize productivity in western Turkey. Arch. Agron. Soil Sci. 2015, 61, 1029–1040. [Google Scholar] [CrossRef]
  58. Franchini, J.C.; Crispino, C.C.; Souza, R.A.; Torres, E.; Hungria, M. Microbiological parameters as indicators of soil quality under various soil management and crop rotation systems in southern Brazil. Soil Tillage Res. 2007, 92, 18–29. [Google Scholar] [CrossRef]
  59. Gil, V.S.; Becker, A.; Oddino, C.; Zuza, M.; Marinelli, A.; March, G. Field trial assessment of biological, chemical, and physical responses of soil to tillage intensity, fertilization, and grazing. Environ. Manag. 2009, 44, 378–386. [Google Scholar]
  60. Hati, K.M.; Swarup, A.; Dwivedi, A.K.; Misra, A.K.; Bandyopadhyay, K.K. Changes in soil physical properties and organic carbon status at the topsoil horizon of a vertisol of central India after 28 years of continuous cropping, fertilization and manuring. Agric. Ecosyst. Environ. 2007, 119, 127–134. [Google Scholar] [CrossRef]
  61. Kay, B.D.; VandenBygaart, A.J. Conservation tillage and depth stratification of porosity and soil organic matter. Soil Tillage Res. 2002, 66, 107–118. [Google Scholar] [CrossRef]
  62. Al-Kaisi, M.M.; Yin, X.; Licht, M.A. Soil carbon and nitrogen changes as affected by tillage system and crop biomass in a cornsoybean rotation. Appl. Soil Ecol. 2005, 30, 174–191. [Google Scholar] [CrossRef]
  63. Osunbitan, J.A.; Oyedele, D.J.; Adekalu, K.O. Tillage effects on bulk density, hydraulic conductivity and strength of a loamy sand soil in southwestern Nigeria. Soil Tillage Res. 2005, 82, 57–64. [Google Scholar] [CrossRef]
  64. Ishaq, M.; Ibrahim, M.; Lal, R. Tillage effects on soil properties at different levels of fertilizer application in Punjab, Pakistan. Soil Tillage Res. 2002, 68, 93–99. [Google Scholar] [CrossRef]
  65. Halvorson, A.D.; Black, A.L.; Krupinsky, J.M.; Merrill, S.D. Dryland winter wheat response to tillage and nitrogen within an annual cropping system. Agron. J. 1999, 91, 702–707. [Google Scholar] [CrossRef]
  66. Liu, K.; Wiatrak, P. Corn production response to tillage and nitrogen application in dry-land environment. Soil Tillage Res. 2012, 124, 138–143. [Google Scholar] [CrossRef]
  67. Archer, D.W.; Halvorson, A.D.; Reule, C.A. Economics of irrigated continuous corn under conventional-till and no-till in northern Colorado. Agron J. 2008, 100, 1166–1172. [Google Scholar] [CrossRef]
  68. Alvaresz, R.; Steinbach, H.S. A review of the effects of tillage systems on some soil physical properties, water content, nitrate availability and crops yield in the Argentine pampas. Soil Tillage Res. 2009, 104, 1–15. [Google Scholar] [CrossRef]
Figure 1. Meteorological data from winter 2019/2020, summer 2020, and winter 2020/2021 growing seasons. R.H.: relative humidity (%); W.V.: wind velocity (at 2 m height); P.E.: pan evaporation.
Agriculture 13 01857 g001
Figure 2. The impact of soil tillage and soil treatments on the microbial community in the wheat and cowpea rhizospheres over the course of three growing seasons: (A) bacteria; (B) fungi; (C) actinomycetes (CFU log10 g−1), a–n: Duncan’s letters.
Agriculture 13 01857 g002
Figure 3. The impact of soil tillage and soil treatments on the number and dry weight of nodules in cowpea plants during the second growing season; a–j: Duncan’s letters.
Agriculture 13 01857 g003
Table 1. Physical and chemical properties of the studied soil before the experiment.
Soil Depth (cm)SandSiltClayTxpHCaCO3
(%)
EC
(dS m−1)
ESP (%)OM
(g Kg−1)
(%)
0–2015.6526.3158.04clay8.021.854.1213.1117.4
20–4018.7525.1056.15clay8.111.984.1413.1516.9
40–6018.9524.9556.10clay8.132.104.1613.1815.5
Soil Depth (cm)CEC
(cmole kg−1)
FCWPAWTSAOSABD
(kg m−3)
PR
(Mpa)
IR
(cm h−1)
(%)
0–2031.4544.1521.9122.2437.1119.781.3701.2400.75
20–4030.1141.1920.0821.1136.6120.051.3721.241
40–6029.5539.2519.0320.2235.4518.771.3751.242
Tx: texture; pH: determined in suspension (1 soil: 2.5 water); EC: electrical conductivity; ESP: exchangeable sodium percent; CEC: cation exchange capacity; OM: organic matter; FC: field capacity; WP: wilting point; AW: available water; BD: bulk density; TSA: total stable aggregates; OSA: optimal-sized aggregates; PR: penetration resistances; IR: infiltration rate.
Table 2. Biological properties of the studied soil before the experiment.
Soil Depth (cm)TCBTCFTCADHA
(mg TPF g−1 Soil Day−1)
URE
(NH4+-N g−1 Soil Day−1)
PHOS
(μg pnp g−1 Soil h−1)
0–20109 × 10666 × 10381 × 10578.9245.283.19
TCB, TCF, and TCA: total count of bacteria, total count of fungi, and total count of actinomycetes, respectively; DHA: dehydrogenase; URE: urease; PHOS: phosphatase.
Table 3. Physical, chemical, and biological characteristics of the used compost.
ParametersValue
pH8.26
EC (dS m−1)4.55
Organic carbon (%)20.71
Bulk density (kg m3)560
Moisture content (%)37
C/N ratio15.11
N (%)1.42
P (%)0.55
K (%)1.73
Germination (%)92.45
TCB102 × 106
TCF34 × 103
TCA69 × 105
E. coli0.0
Salmonella sp.0.0
Shegella sp.0.0
TCB: total count of bacteria; TCF: total count of fungi; TCA: total count of actinomycetes.
Table 4. Layout of the experimental treatments.
Main PlotSubplot
Soil TillageFirst Season (Wheat)Second Season
(Cowpea)
Third Season
(Wheat)
Soil Supplements
ST1TillageTillageTillageControl
C
BM
C + BM
ST2TillageTillageNo-tillageControl
C
BM
C + BM
ST3TillageNo-tillageNo-tillageControl
C
BM
C + BM
ST4No-tillageNo-tillageNo-tillageControl
C
BM
C + BM
C: compost; BM: beneficial microorganisms.
Table 5. The impact of soil tillage and soil additives on soil enzyme activities in the wheat and cowpea rhizosphere over the course of three growing seasons.
TreatmentsDHA (mg TPF g−1 Soil Day−1)URA (mg NH4+-N g−1 Soil Day−1)PHOS (μg pnp g−1 Soil h−1)
First SeasonSecond SeasonThird SeasonFirst SeasonSecond SeasonThird SeasonFirst SeasonSecond SeasonThird Season
ST1T150.00 ± 4.58 l58.02 ± 4.62 n65.41 ± 6.01 n45.33 ± 1.53 k50.18 ± 0.58 j55.12 ± 0.53 j2.65 ± 0.14 n3.74 ± 0.15 l4.55 ± 0.32 j
T274.00 ± 2.65 k80.35 ± 2.65 m89.00 ± 2.16 m58.33 ± 3.51 j62.18 ± 2.52 i67.03 ± 2.11 i3.03 ± 0.04 m4.15 ± 0.14 k5.15 ± 0.24 i
T384.00 ± 4.00 j91.68 ± 4.73 l100.62 ± 6.87 l71.33 ± 3.79 i74.84 ± 3.79 h79.74 ± 3.95 h3.81 ± 0.16 k4.95 ± 0.14 i5.93 ± 0.14 g
T480.00 ± 3.00 jk86.35 ± 3.00 lm96.94 ± 1.00 l89.00 ± 3.61 f93.51 ± 3.61 e98.32 ± 3.46 e4.09 ± 0.03 i5.23 ± 0.05 g6.21 ± 0.15 f
ST2T1104.67 ± 5.51 i111.35 ± 4.58 k118.94 ± 3.99 k57.00 ± 2.65 j60.18 ± 3.21 i64.95 ± 3.31 i3.72 ± 0.09 l4.81 ± 0.16 j5.43 ± 0.37 h
T2147.33 ± 5.69 f153.68 ± 5.69 h162.40 ± 7.09 h71.00 ± 2.00 i76.18 ± 3.06 h81.08 ± 2.82 h4.32 ± 0.05 g5.44 ± 0.15 f6.48 ± 0.12 de
T3169.33 ± 5.51 d175.02 ± 5.13 f183.46 ± 5.94 f82.67 ± 3.21 g87.18 ± 3.21 f92.02 ± 3.44 f4.76 ± 0.14 d5.85 ± 0.26 d6.85 ± 0.05 b
T4184.33 ± 4.16 c190.02 ± 3.79 d198.06 ± 3.51 cd97.00 ± 2.00 d102.18 ± 3.06 d107.21 ± 3.20 d4.87 ± 0.05 c6.09 ± 0.28 bc7.13 ± 0.16 a
ST3T1122.33 ± 5.51 h128.68 ± 5.51 j136.79 ± 4.46 j68.67 ± 2.52 i72.51 ± 1.73 h77.44 ± 1.65 h3.97 ± 0.04 j5.07 ± 0.14 h6.12 ± 0.14 fg
T2158.33 ± 4.04 e164.68 ± 4.04 g173.57 ± 5.23 g77.67 ± 3.51 h82.18 ± 3.51 g86.94 ± 3.44 g4.53 ± 0.13 f5.60 ± 0.18 e6.58 ± 0.18 cd
T3176.00 ± 3.61 d183.35 ± 2.00 e192.06 ± 3.56 de92.67 ± 3.51 e98.84 ± 4.16 d103.62 ± 4.22 d4.87 ± 0.09 c6.01 ± 0.14 c7.00 ± 0.15 ab
T4201.33 ± 3.51 b212.35 ± 1.73 b220.26 ± 3.34 b124.33 ± 3.51 b129.84 ± 3.21 b134.75 ± 3.60 b5.01 ± 0.13 b6.10 ± 0.22 bc7.13 ± 0.16 a
ST4T1134.33 ± 4.16 g140.68 ± 4.16 i147.61 ± 4.12 i76.33 ± 2.08 h80.51 ± 2.00 g85.49 ± 2.14 g4.24 ± 0.15 h5.31 ± 0.18 g6.32 ± 0.05 ef
T2172.00 ± 4.58 d178.35 ± 4.58 ef186.82 ± 4.71 ef89.67 ± 3.06 ef94.18 ± 3.06 e99.25 ± 2.86 e4.69 ± 0.03 e5.79 ± 0.14 d6.80 ± 0.18 bc
T3190.00 ± 3.61 c196.35 ± 3.61 c205.19 ± 4.97 c106.00 ± 4.36 c111.84 ± 4.93 c116.53 ± 4.94 c5.01 ± 0.15 b6.11 ± 0.23 b7.11 ± 0.17 a
T4216.00 ± 5.57 a224.02 ± 5.51 a232.86 ± 6.40 a138.00 ± 4.58 a143.51 ± 5.29 a148.33 ± 5.39 a5.16 ± 0.16 a6.21 ± 0.13 a7.20 ± 0.14 a
F-test
Main******************
Sub main******************
Interaction******************
Duncan’s test revealed significant differences between treatments in the means designated by different letters (p ≤ 0.05). The values are the means and standard deviations (SD) of triplicates. DHA: dehydrogenase; URA: urease; PHOS: phosphatase; ST1: tillage for three seasons; ST2: tillage for two seasons; ST3: tillage for one seasons; ST4: no-tillage; T1: control; T2: compost; T3: beneficial microbes; T4: combination; **: highly significant.
Table 6. The impact of soil tillage and soil additives on soil chemical properties in the wheat and cowpea plants over the course of three growing seasons.
Treatments ECe (dSm−1)ESP (%)
First SeasonSecond SeasonThird SeasonFirst SeasonSecond SeasonThird Season
ST1T14.12 ± 0.01 b4.19 ± 0.02 c4.25 ± 0.02 c13.07 ± 0.5 b12.46 ± 0.09 c11.06 ± 0.03 h
T22.86 ± 0.01 i2.88 ± 0.01 m2.95 ± 0.02 L12.36 ± 0.05 b12.01 ± 0.13 e11.47 ± 0.16 e
T33.22 ± 0.02 f3.23 ± 0.02 k3.21 ± 0.01 j12.23 ± 0.03 b12.21 ± 0.01 d11.85 ± 0.01 c
T42.45 ± 0.01 j2.46 ± 0.01n2.49 ± 0.02 n10.21 ± 0.10 c11.02 ± 0.07 h10.59 ± 0.07 i
ST2T14.11 ± 0.01 b4.14 ± 0.02 d4.23 ± 0.02 c13.20 ± 0.09 b12.67 ± 0.06 b12.11 ± 0.06 b
T22.90 ± 0.01 h2.98 ± 0.02 L3.19 ± 0.02 k12.53 ± 0.05 b11.99 ± 0.11 d11.14 ± 0.05 g
T33.21 ± 0.01 f3.25 ± 0.02 k3.35 ± 0.02 i12.25 ± 0.03 b12.23 ± 0.01 d11.80 ± 0.01 c
T42.41 ± 0.03 k2.47 ± 0.02 n2.81 ± 0.02 m10.08 ± 0.02 c10.79 ± 0.09 i9.64 ± 0.11 k
ST3T14.12 ± 0.01 b4.30 ± 0.04 b4.45 ± 0.02 b12.91 ± 0.08 b12.15 ± 0.10 d11.52 ± 0.01 de
T22.87 ± 0.01 i3.70 ± 0.04 h3.80 ± 0.04 f12.39 ± 0.03 b10.36 ± 0.04 j9.86 ± 0.04 j
T33.26 ± 0.02 e3.85 ± 0.06 f3.92 ± 0.04 e12.15 ± 0.02 b11.85 ± 0.04 f11.40 ± 0.04 f
T42.41 ± 0.03 k3.41 ± 0.02 j3.56 ± 0.02 g9.97 ± 0.03 c8.77 ± 0.03 k8.25 ± 0.03 l
ST4T14.26 ± 0.03 a4.41 ± 0.06 a4.55 ± 0.02 a15.08 ± 0.08 a14.33 ± 0.20 a13.62 ± 0.08 a
T23.31 ± 0.03 d3.78 ± 0.02 g3.80 ± 0.04 f13.07 ± 0.09 b11.96 ± 0.04 e11.54 ± 0.08 d
T33.46 ± 0.03 c3.95 ± 0.02 e4.11 ± 0.02 d13.60 ± 0.05 ab12.50 ± 0.04 c11.81 ± 0.04 c
T43.12 ± 0.04 g3.45 ± 0.04 i3.50 ± 0.04 h12.32 ± 0.08 b11.58 ± 0.15 g11.11 ± 0.06 gh
F-test
Main**************
Sub main**************
Interaction**************
Duncan’s test revealed significant differences between treatments in the means designated by different letters (p ≤ 0.05). Values are the means and standard deviations (SD) of triplicates. ECe: electrical conductivity; ESP: exchangeable sodium percentage; ST1–ST4: as shown in Table 5; T1–T4: as shown in Table 5; **: high significant.
Table 7. The impact of soil tillage and soil treatments on soil bulk density and soil porosity in the wheat and cowpea plants over the course of three growing seasons.
Treatments Soil Bulk Density (kg m−3)Soil Porosity (%)
First SeasonSecond SeasonThird SeasonFirst SeasonSecond SeasonThird Season
ST1T11.383 ± 0.006 b1.372 ± 0.004 c1.362 ± 0.004 d47.78 ± 0.23 g48.22 ± 0.15 f48.60 ± 0.15 e
T21.362 ± 0.004 e1.352 ± 0.004 e1.332 ± 0.004 g48.59 ± 0.15 b48.97 ± 0.15 d49.72 ± 0.15 b
T31.383 ± 0.006 b1.361 ± 0.003 d1.352 ± 0.004 e47.78 ± 0.23 g48.61 ± 0.11 e48.98 ± 0.15 d
T41.333 ± 0.005 g1.331 ± 0.002 h1.322 ± 0.005 h49.69 ± 0.20 b49.77 ± 0.07 a50.1 ± 0.19 a
ST2T11.381 ± 0.002 c1.372 ± 0.005 c1.383 ± 0.005 b47.88 ± 0.07 f48.22 ± 0.20 f47.81 ± 0.19 g
T21.371 ± 0.002 d1.363 ± 0.005 d1.362 ± 0.005 d48.26 ± 0.07 d48.56 ± 0.20 e48.59 ± 0.19 e
T31.382 ± 0.004 c1.372 ± 0.004 c1.383 ± 0.005 b47.84 ± 0.15 fg48.20 ± 0.17 f47.81 ± 0.19 g
T41.331 ± 0.002 gh1.333 ± 0.005 g1.342 ± 0.005 f49.77 ± 0.07 a49.69 ± 0.20 b49.34 ± 0.18 c
ST3T11.380 ± 0.002 c1.392 ± 0.005 a1.382 ± 0.005 b47.89 ± 0.08 f47.47 ± 0.20 h47.84 ± 0.15 g
T21.371 ± 0.003 d1.362 ± 0.005 d1.373 ± 0.005 c48.25 ± 0.11 e48.59 ± 0.19 e48.18 ± 0.20 f
T31.381 ± 0.003 c1.392 ± 0.005 a1.382 ± 0.005 b47.88 ± 0.12 f47.46 ± 0.19 h47.83 ± 0.15 g
T41.332 ± 0.004 gh1.341 ± 0.004 f1.353 ± 0.004 e49.73 ± 0.15 ab49.37 ± 0.15c48.94 ± 0.20 d
ST4T11.392 ± 0.004 a1.393 ± 0.005 a1.392 ± 0.005 a47.45 ± 0.17 h47.43 ± 0.20 h47.47 ± 0.15 h
T21.391 ± 0.004 a1.393 ± 0.005 b1.383 ± 0.005 b48.23 ± 0.15 e48.18 ± 0.20 f47.81 ± 0.19 g
T31.372 ± 0.004 d1.373 ± 0.005 c1.383 ± 0.005 b47.45 ± 0.17 h47.81 ± 0.19 g47.81 ± 0.19 g
T41.351 ± 0.002 f1.353 ± 0.005 e1.362 ± 0.005 d44.02 ± 0.08 c48.94 ± 0.20 d48.59 ± 0.19 e
F-test
Main**************
Sub main**************
Interaction**************
Duncan’s test revealed significant differences between treatments in the means designated by different letters (p ≤ 0.05). Values are the means and standard deviations (SD) of triplicates. ST1–ST4: as shown in Table 5; T1–T4: as shown in Table 5; **: highly significant.
Table 8. The impact of soil tillage and soil additives on total stable aggregates and optimal-sized aggregates in the wheat and cowpea plants over the course of three growing seasons.
Treatments Total Stable Aggregates (%)Optimal-Sized Aggregates (%)
First SeasonSecond SeasonThird SeasonFirst SeasonSecond SeasonThird Season
ST1T136.39 ± 1.39 fg36.91 ± 1.38 f37.43 ± 1.37 f19.53 ± 1.10 f19.79 ± 1.10 h20.05 ± 1.01 e
T241.32 ± 1.31 b41.88 ± 1.30 b42.44 ± 1.29 b23.59 ± 1.03 b23.87 ± 1.02 b24.15 ± 1.01 b
T337.71 ± 0.48 e38.27 ± 0.47 e38.83 ± 0.45 e20.76 ± 0.40 e21.04 ± 0.41 ef21.32 ± 0.40 d
T442.92 ± 1.05 a43.55 ± 1.01 a44.41 ± 0.98 a24.73 ± 0.34 a25.10 ± 0.34 a25.47 ± 0.31 a
ST2T134.32 ± 1.09 i34.84 ± 1.08 h35.24 ± 1.02 h18.27 ± 1.06 g18.53 ± 1.05 i18.73 ± 1.03 f
T239.04 ± 1.39 d39.60 ± 1.30 d39.60 ± 1.28 d22.56 ± 1.02 c22.84 ± 1.01 c22.84 ± 0.98 c
T335.71 ± 1.45 gh36.27 ± 1.40 fg36.27 ± 1.35 g19.97 ± 1.00 f20.25 ± 0.99 gh20.25 ± 0.94 e
T439.91 ± 2.00 c40.66 ± 2.0 c40.66 ± 1.98 c23.48 ± 0.84 b23.86 ± 0.81 b23.86 ± 0.80 b
ST3T136.31 ± 0.39 fg35.91 ± 0.38 g35.47 ± 0.39 h20.67 ± 0.13 e20.47 ± 0.12 fgh20.23 ± 0.12 e
T238.74 ± 1.20 d38.34 ± 1.11 e37.90 ± 1.01 f21.81 ± 0.65 d21.61 ± 0.61 de21.39 ± 0.60 d
T338.45 ± 0.69 d38.05 ± 0.68 e37.57 ± 0.66 f20.76 ± 1.14 e20.56 ± 1.11 fg20.34 ± 1.01 e
T438.90 ± 2.31 d38.50 ± 2.28 e38.02 ± 2.18 f21.99 ± 0.79 d21.79 ± 0.75 d21.55 ± 0.74 d
ST4T130.06 ± 1.21 k29.66 ± 1.12 j29.22 ± 1.01 k15.87 ± 1.12 h15.67 ± 1.01 k15.45 ± 0.98 h
T235.10 ± 2.41 h34.70 ± 2.31 h34.26 ± 2.01 i20.53 ± 1.85 e20.33 ± 1.83 gh20.11 ± 1.80 e
T332.12 ± 1.27 j31.72 ± 1.25 i31.28 ± 1.04 j17.83 ± 0.44 g17.63 ± 0.43 j17.41 ± 0.41 g
T436.71 ± 2.04 f36.31 ± 1.95 fg35.87 ± 1.41 gh21.67 ± 0.66 d21.47 ± 0.65 de21.25 ± 0.64 d
F-test
Main**************
Sub main**************
Interaction**************
Duncan’s test revealed significant differences between treatments in the means designated by different letters (p ≤ 0.05). Values are the means and standard deviations (SD) of triplicates. ST1–ST4: as shown in Table 5; T1–T4: as shown in Table 5; **: highly significant.
Table 9. Mean values of soil penetration resistance (SPRa) and soil infiltration (IR) as affected by both tillage and soil additives over the course of three growing seasons.
Treatments SPR (Mpa)IR (cmh−1)
First SeasonSecond SeasonThird SeasonFirst SeasonSecond SeasonThird Season
ST1T11.242 ± 0.004 a1.131 ± 0.003 h1.060 ± 0.020 l0.753 ± 0.004 g0.761 ± 0.003 e0.782 ± 0.004 f
T21.130 ± 0.020 d0.983 ± 0.005 l0.892 ± 0.004 m0.853 ± 0.005 c0.862 ± 0.004 b0.912 ± 0.004 c
T31.231 ± 0.002 a1.122 ± 0.005 i1.050 ± 0.010 l0.763 ± 0.005 f0.761 ± 0.004 e0.793 ± 0.005 e
T41.050 ± 0.020 f0.952 ± 0.004 m0.801 ± 0.002 n0.982 ± 0.004 b1.016 ± 0.041 a1.086 ± 0.011 a
ST2T11.241 ± 0.004 a1.184 ± 0.007 e1.243 ± 0.005 f0.753 ± 0.004 g0.761 ± 0.003 e0.752 ± 0.005 h
T21.151 ± 0.101 d1.073 ± 0.010 j1.173 ± 0.005 j0.853 ± 0.005 c0.862 ± 0.004 b0.853 ± 0.005 d
T31.231 ± 0.003 a1.173 ± 0.005 f1.232 ± 0.003 g0.763 ± 0.005 f0.761 ± 0.003 e0.761 ± 0.003 g
T41.050 ± 0.020 f1.040 ± 0.020 k1.124 ± 0.007 k0.982 ± 0.004 b1.016 ± 0.041 a0.982 ± 0.004 b
ST3T11.241 ± 0.002 a1.213 ± 0.006 d1.293 ± 0.005 c0.752 ± 0.005 g0.702 ± 0.004 f0.683 ± 0.005 j
T21.150 ± 0.103 cd1.133 ± 0.005 h1.222 ± 0.004 h0.853 ± 0.005 c0.782 ± 0.004 d0.753 ± 0.005 h
T31.231 ± 0.004 a1.223 ± 0.005 c1.255 ± 0.006 e0.752 ± 0.005 g0.702 ± 0.004 f0.682 ± 0.004 j
T41.050 ± 0.020 ef1.123 ± 0.005 i1.192 ± 0.004 i0.993 ± 0.005 a0.803 ± 0.005 c0.782 ± 0.004 f
ST4T11.180 ± 0.020 bc1.232 ± 0.004 b1.334 ± 0.007 a0.702 ± 0.004 h0.683 ± 0.005 g0.653 ± 0.005 l
T21.123 ± 0.006 d1.183 ± 0.007 e1.273 ± 0.005 d0.782 ± 0.004 e0.753 ± 0.005 e0.712 ± 0.005 i
T31.186 ± 0.010 b1.253 ± 0.005 a1.323 ± 0.008 b0.702 ± 0.004 h0.683 ± 0.005 g0.663 ± 0.005 k
T41.089 ± 0.011 e1.152 ± 0.004 g1.253 ± 0.006 e0.803 ± 0.005 d0.781 ± 0.002 d0.752 ± 0.004 h
F-test
Main**************
Sub main**************
Interaction**************
Duncan’s test revealed significant differences between treatments in the means designated by different letters (p ≤ 0.05). Values are the means and standard deviations (SD) of triplicates. ST1–ST4: as shown in Table 5; T1–T4: as shown in Table 5; **: highly significant.
Table 10. The impact of soil tillage and soil additives on the yield (grain and straw) of wheat and cowpea plants over the course of three growing seasons.
Treatments First Season (Wheat, Ton ha−1)Second Season (Cowpea, Ton ha−1)Third Season (Wheat, Ton ha−1)
GrainStrawGrainStrawGrainStraw
ST1T14.897 ± 0.003 g4.920 ± 0.010 i3.816 ± 0.022 i4.017 ± 0.012 g5.171 ± 0.004 j5.177 ± 0.011 k
T24.935 ± 0.005 d5.252 ± 0.016 c4.106 ± 0.008 c4.462 ± 0.012 e5.214 ± 0.007 f5.220 ± 0.005 g
T34.922 ± 0.008 e5.065 ± 0.010 g3.940 ± 0.004 e4.335 ± 0.014 f5.197 ± 0.003 g5.202 ± 0.006 i
T44.983 ± 0.007 b5.313 ± 0.004 a3.861 ± 0.010 g3.645 ± 0.008 i5.266 ± 0.004 c5.309 ± 0.006 c
ST2T14.892 ± 0.003 g4.920 ± 0.010 i3.816 ± 0.027 i4.0128 ± 0.016 h4.857 ± 0.003 l4.943 ± 0.007 l
T24.937 ± 0.008 d5.248 ± 0.004 c4.099 ± 0.010 d4.461 ± 0.016 d5.230 ± 0.005 e5.242 ± 0.007 f
T34.920 ± 0.010 e5.061 ± 0.020 g3.926 ± 0.006 f4.329 ± 0.004 f5.183 ± 0.007 h5.215 ± 0.004 h
T44.990 ± 0.060 a5.288 ± 0.004 b4.11 ± 0.012 b4.507 ± 0.004 c5.259 ± 0.001 d5.283 ± 0.007 d
ST3T14.893 ± 0.006 g4.924 ± 0.012 i3.232 ± 0.010 l3.468 ± 0.008 j4.619 ± 0.006 m4.634 ± 0.005 m
T24.937 ± 0.003 d5.233 ± 0.012 d3.926 ± 0.020 f4.351 ± 0.012 e5.196 ± 0.004 g5.245 ± 0.005 e
T34.922 ± 0.008 e5.059 ± 0.004 g3.837 ± 0.006 h4.015 ± 0.006 gh5.181 ± 0.004 hi5.214 ± 0.006 h
T44.993 ± 0.006 a5.286 ± 0.008 b4.186 ± 0.006 a4.788 ± 0.006 a5.306 ± 0.003 b5.346 ± 0.004 a
ST4T14.123 ± 0.007 h4.269 ± 0.012 j3.357 ± 0.004 k3.367 ± 0.006 m4.400 ± 0.010 n4.450 ± 0.005 n
T24.954 ± 0.006 c5.133 ± 0.014 f3.840 ± 0.010 h3.528 ± 0.008 j5.180 ± 0.005 i5.220 ± 0.005 g
T34.907 ± 0.003 f5.049 ± 0.004 h3.782 ± 0.005 j3.489 ± 0.004 l5.156 ± 0.010 k5.189 ± 0.001 j
T44.991 ± 0.004 a5.214 ± 0.012 e4.188 ± 0.010 a4.513 ± 0.008 b5.325 ± 0.005 a5.338 ± 0.002 b
F-test
Main**************
Sub main**************
Interaction**************
Duncan’s test revealed significant differences between treatments in the means, designated by different letters (p ≤ 0.05). Values are the means and standard deviations (SD) of triplicates. ST1–ST4: as shown in Table 5; T1–T4: as shown in Table 5; **: highly significant.
Disclaimer/Publisher’s Note: The statements, opinions and data contained in all publications are solely those of the individual author(s) and contributor(s) and not of MDPI and/or the editor(s). MDPI and/or the editor(s) disclaim responsibility for any injury to people or property resulting from any ideas, methods, instructions or products referred to in the content.

