Article

Yolov5s-CA: An Improved Yolov5 Based on the Attention Mechanism for Mummy Berry Disease Detection

1
College of Computer Science, Chongqing University of Posts and Telecommunications, Chongqing 400065, China
2
College of Automation, Chongqing University of Posts and Telecommunications, Chongqing 400065, China
3
School of Biology and Ecology, University of Maine, Orono, ME 04469, USA
4
Climate Change Institute, University of Maine, Orono, ME 04469, USA
5
Cooperative Extension, University of Maine, Orono, ME 04469, USA
*
Author to whom correspondence should be addressed.
Agriculture 2023, 13(1), 78; https://doi.org/10.3390/agriculture13010078
Submission received: 4 November 2022 / Revised: 22 December 2022 / Accepted: 23 December 2022 / Published: 27 December 2022
(This article belongs to the Special Issue Engineering Innovations in Agriculture)

Abstract

:
Early detection and accurately rating the level of plant diseases plays an important role in protecting crop quality and yield. The traditional method of mummy berry disease (causal agent: Monilinia vaccinii-corymbosi) identification is mainly based on field surveys by crop protection experts and experienced blueberry growers. Deep learning models could be a more effective approach, but their performance is highly dependent on the volume and quality of labeled data used for training so that the variance in visual symptoms can be incorporated into a model. However, the available dataset for mummy berry disease detection does not contain enough images collected and labeled from a real-field environment essential for making highly accurate models. Complex visual characteristics of lesions due to overlapping and occlusion of plant parts also pose a big challenge to the accurate estimation of disease severity. This may become a bigger issue when spatial variation is introduced by using sampling images derived from different angles and distances. In this paper, we first present the “cut-and-paste” method for synthetically augmenting the available dataset by generating additional annotated training images. Then, a deep learning-based object recognition model Yolov5s-CA was used, which integrates the Coordinated Attention (CA) module on the Yolov5s backbone to effectively discriminate useful features by capturing channel and location information. Finally, the loss function GIoU_loss was replaced by CIoU_loss to improve the bounding box regression and localization performance of the network model. The original Yolov5s and the improved Yolov5s-CA network models were trained on real, synthetic, and combined mixed datasets. The experimental results not only showed that the performance of Yolov5s-CA network model trained on a mixed dataset outperforms the baseline model trained with only real field images, but also demonstrated that the improved model can solve the practical problem of diseased plant part detection in various spatial scales with possible overlapping and occlusion by an overall precision of 96.30%. Therefore, our model is a useful tool for the estimation of mummy berry disease severity in a real field environment.

1. Introduction

In agriculture, plant diseases cause an estimated 10–15% annual loss of the world’s major crops [1]; 70–80% of these diseases are caused by pathogenic fungi that have an adverse effect on crop growth, quality and yield. Therefore, disease management is important to agricultural systems including the wild lowbush blueberry production system. Wild blueberry (mainly Vaccinium angustifolium Aiton) is a perennial shrub that spreads by underground rhizomes, with aerial shoots occurring every 2–30 cm. Wild blueberry plants are not planted [2,3] but grow naturally in rocky hills and sandy fields, and are managed to form a carpet for berry production [4]. Wild blueberry is one of the most important crops in Maine, USA, and the Canadian provinces of Quebec and the Maritimes, and the crop is a major source of income for growers in the regions [5,6]. The state of Maine is one of the largest producers of wild blueberries of the world, accounting for 97% of the total production in the US [7,8,9]. The yield and quality of blueberries are impacted by several factors, but one of the most important is mummy berry disease caused by the fungus Monilinia vaccinii-corymbosi [10]. Monilinia vaccinii-corymbosi ascospores attack opening flower clusters and axillary buds in the spring and kills infected tissues [11]. These tissues then produce secondary asexual spores that infect healthy flowers and the fungus colonizes the developing fruit. High levels of infection can kill up to 90% of the leaves and flower buds during the early part of the growing season [10,12]. The infection of the developing fruit directly affects yield and the loss of flowers and leaves can indirectly reduce yield [8]. The loss of yield (berry weight harvested) can be substantial and poses an economic challenge to growers.
The current method of early warning monitoring for mummy berry disease is based on the prediction of potential infection periods determined by weather conditions and development stages of the plants and fungus [13]. If a high likelihood of infection is predicted, based on the duration of leaf wetness and suitable air temperature, growers are advised to protect their crops from infection with the application of fungicides [14]. Follow-up field scouting by crop protection experts and experienced blueberry growers is often implemented to determine the effectiveness of forecasting infection and fungicide applications. However, monitoring for the presence and rating the level of disease is extremely time-consuming and labor-intensive since infected plants can be scattered in patches around the field and so typically multiple transects are used to observe many individual stems across a field. It can also be prone to error due to confusion between mummy berry disease symptoms and those from frost damage or other diseases such as Botrytis blight. These are some of the main reasons why researchers are looking for alternative methods to identify diseases in the field [15,16,17]. Previous studies involving other crops and diseases using traditional machine learning algorithms have mainly relied on manual extraction of features from image texture, color and shape [18] to locate disease. However, the symptoms of the same disease may have different visual characteristics, such as during different stages of infection, when infecting flowers, leaves or fruit, and possible occlusions and high spatial variations among individual plants. Therefore, when there is variation in environmental conditions and symptom traits, the generalization ability of these algorithms decreases significantly.
In recent years, with the rapid advancement of computer vision techniques and deep learning, various methods of plant disease detection and classification techniques have been developed in agriculture resulting in highly accurate results [16,19,20]. Despite its success in achieving superior performance in plant disease detection, deep neural network architectures depend heavily on the availability of large quantities of training data that are characterized by variation to accurately “learn the breadth of behavior” for proper training of a model. However, the available dataset for wild blueberry plant disease detection does not contain the abundance of images collected and labeled from a real-field environment which is essential for making highly accurate models [19]. Levels of mummy berry symptoms vary by field characteristics, weather, and inoculum level and symptoms of the first stage of infection of leaves and flower buds only last for one to three weeks depending upon the field and weather. Clean and background-free images of diseased and healthy plant parts also are difficult to obtain in blueberry fields. Accurately labeling images for model training is also very labor-intensive. To address the problem of data scarcity in training deep learning models, researchers have proposed various techniques to generate synthetic images based on the available dataset to obtain diverse and inexpensive training data [21,22] rather than field collecting and annotating training images which is an expensive and time-consuming task.
Although computer vision techniques have greatly improved for plant disease detection, practical problems such as the small size of lesions, occlusion of shoots, interference of complex background, uncontrollable light conditions in fields, etc., remain unsolved for mummy berry disease identification. For instance, masses of conidia (a sign on leaves and flowers of primary mummy berry infection) on blueberry shoots are tiny (<33 µm long; in [11] and only account for a very small portion of a field taken image, which makes it unlikely to be automatically identified by computer vision techniques. Moreover, the much branched and dense structure of blueberry bushes often occlude small diseased plant parts such as those exhibiting conidia. Multiple shoots or branches also complicate the background of field-taken images, which also poses a challenge to disease detection. An example of field-taken images of mummy berry disease and conidia on shoots are shown in Figure 1. In addition, disease traits (such as size, color, and portion) in the field obtained sample images for disease detection and severity rating may vary considerably due to the changes in camera shooting angle and distance. These highly spatial variations could inevitably degrade the performance of identification, despite the most advanced object detection algorithms having been employed [23].
In deep learning, as in human vision, the attention mechanism tends to focus on key regions of the input objects by ignoring irrelevant information. Recent studies have demonstrated the remarkable effectiveness of attention-based methods for boosting deep learning networks and have proven their usefulness in a variety of computer vision tasks, such as object detection [20,24,25]. CBAM [26] is a widely used attention mechanism that combines channel and spatial attention. SE [27], on the other hand, focuses on the relationship between channels to learn each image feature based on the loss function, increases the weight of relevant image features, and decreases the weight of irrelevant image features to achieve the best results. In plant disease detection, the lightness of the model determines whether it can be deployed to embedded devices, which is of great importance for growers to monitor the growth and disease status of blueberries in real-time in the field [15]. Considering the limited computational power and storage capacity of mobile or embedded devices, SE and CBAM attention mechanisms are still the most popular attention methods. However, SE neglects the importance of location information and CBAM only captures local relationships and cannot model long-range dependencies essential for capturing object structure in visual tasks [28]. In contrast, coordinate attention (CA) considers both inter-channel relationships and position information.
Therefore, in order to overcome the problems in the current plant disease detection methods, and solve the limitation of data scarcity for mummy berry disease detection of the wild blueberry plant in a real-field environment, we have implemented the cut and paste method [29] for synthetically augmenting the available dataset to generate annotated training images for object detection tasks, which reduces the effort required to collect and manually annotate huge datasets. Thereafter, we improved the backbone of the original Yolov5s network model by integrating the lightweight coordinate attention (CA) module to effectively highlight the important features by capturing the channel and location information to improve a mummy berry disease detection network model in a real natural field environment with little extra computational cost. The main contributions of this study are summarized as follows:
  • The coordinate attention (CA) module is integrated into a Yolov5s backbone. This allows the network to increase the weight of key features and pay more attention to visual features related to disease to improve the performance of disease detection in various spatial scales.
  • The loss function, General Intersection over Union (GIoU), is replaced by the loss function, Complete Intersection over Union (CIoU) to enhance bounding box regression and localization performance in identifying diseased plant parts with a complex background.
  • A synthetic dataset generation method is presented that can reduce the effort of collecting and annotating large datasets and boost the performance of identification by artificially increasing available features in deep model training.

2. Related Work

The scope of the research presented in this article is related to the use of data augmentation processes to create synthetic image datasets and object detection models to identify mummy berry disease affecting wild blueberry productivity. Thus, the literature review presented in this section is divided into two subsections. The first subsection lists the techniques reported in the literature on the use of data augmentation to create synthetic image datasets, while the second subsection details the various machine learning and deep learning algorithms reported in the literature for plant disease identification.

2.1. Data Augmentation

To build robust deep-learning models, it is important to ensure that validation error during training is minimized with the training error. The approach that has been reported in the literature to be successful is the data augmentation technique [30].
Recently, a method of data augmentation crop-and-paste has become popular in object detection [31] and instance segmentation. Khoreva et al. [32] used the cut-and-paste method to generate pairs of synthetic images for video object segmentation. However, object positions are sampled uniformly and changes between image pairs need only be guaranteed to be kept small, which does not work for image-level instance segmentation. A copy–paste method was proposed by Ghiasi et al. [33], which randomly selects a segment object and pastes it at a random location onto the background image data without considering its visual state. The high performance and efficiency of this method was experimentally verified. The authors of [34] presented a simple yet effective approach that took an object detection VOC2007 dataset and cut out objects according to their ground truth labels and pasted them onto images with different backgrounds. With this naive approach, the authors showed a significant improvement in object detection models such as YOLO [35] and SSD [36]. Khalil et al. [37] proposed a new method for augmenting annotated training datasets used for object detection tasks, which aims at relocating objects based on their segmentation masks to a new background that comprise changes in the property of the object such as: image spatial location, surrounding context, and scale. In [31], the authors proposed a context model to place segmented objects at backgrounds with proper context. They demonstrated that this technique can improve object detection on a Pascal VOC dataset. However, the method requires extra model training and off-line data preprocessing. A method of annotated instance masks with a location probability map is explored in [38] to augment the training dataset that can effectively improve the generalization ability of the dataset. Abayomi-Alli et al. [39] proposed a novel histogram transformation approach that improved the accuracy of deep learning models by generating synthetic images from low-quality test images to enhance the number of images in a cassava leaf disease dataset by applying Gaussian blurring, motion blurring, resolution down-sampling, and overexposure with a Modified MobileNetV2 neural network model. Nair and Hinton [40] expanded and enriched their training data by random crop and horizontal reflection. They also applied PCA (principal component analysis) on the color space to change the intensity of the RGB channel (red, green, blue color model). Furthermore, geometric and color transformation were also performed on the dataset. However, the method is based upon simple transformations and cannot simulate higher levels of complexity inherent in the field environment.
Other recent works on image analysis [41,42] built and trained models on purely synthetic rendered 2D and 3D scenes. However, it is difficult to guarantee that models trained on synthetic images will generalize well to real field-collected data, as the process introduces significant changes in image statistics. To solve this problem, Gupta et al. [43] adopted a different approach by embedding real segmented objects into natural images. This reduces the presence of artifacts. The authors in [44] estimated the scene geometry and spatial orientation before synthetically placing objects to generate realistic training examples for the task of object instance detection.

2.2. Deep Learning for Plant Disease Detection

With the aim of developing effective plant disease detection systems, there has been an increasing number of research studies focused on plant disease classification and detection in recent years. Qu and Sun [15] proposed a lightweight deep learning model that can be deployed on embedded devices to detect mummy berry disease in a real environment. The model uses MobileNetV1 as the main network and adopts multi-scale feature extraction which combines dilated and depth-wise convolution in a parallel manner. In addition, at the end of the model, a feature filtering module-based channel attention mechanism is employed to improve classification performance. Fuentes et al. [45] presented a method of detection and identification of diseases and pests of tomatoes captured by camera equipment with different levels of resolution. To find a suitable deep learning architecture, the Fuentes et al. study combined three main families of detectors: fast region-based convolutional neural network (FAST R-CNN), region-based fully convolutional network (R-FCN), and single shot multibox detector (SSD) with VGG net and residual net to effectively identify nine different types of diseases and pests. Roy and Bhaduri [46] developed a deep learning based multi-class apple plant disease detection method and achieved 91.2% mean average precision and 95.9% a F1-score. The model was modified to optimize accuracy and validated by detecting diseases under complex orchard scenarios. Qi et al. [20] proposed a method for the recognition of tomato virus disease based on an improved SE-Yolov5 network model. A squeeze-and-excitation (SE) module was added to a Yolov5 model to focus the network on the effective features of tomato virus visual features. This approach improved the performance of the network.

3. Materials and Methods

In this section, we briefly present a field-collected image dataset that was used for model training and evaluation, as well as for generating synthetic images. We then introduced the system of synthetic dataset generation methods for object detection tasks. This section concludes with the description of an improved Yolov5 model based on attention mechanism and evaluation metrics.

3.1. Data Source

The first step in developing a deep learning model is to prepare a dataset. As the primary source of data in this study, images of healthy and diseased flowers, fruits, and leaves of the blueberry crop in a field environment with complex backgrounds were obtained from the University of Maine wild blueberry experimental fields at Blueberry Hill Farm, Jonesboro, ME, USA [47]. However, the total number of field images collected for training a deep learning network was not adequate. Therefore, to achieve high performance and reduce the risk of overfitting a predictive model for mummy berry disease detection, we first produced annotated synthetic images with a complex background that mimicked real field situations. Then we collected blueberry images with mummy berry disease from online sources such as the National Ecological Observatory Network (www.bugwood.org, accessed on 23 April 2022), and Google Images (www.google.com, accessed on 2 May 2022) to incorporate variety in training images, as deep learning models show enhanced results and higher generalization ability on the availability of a large dataset. A total of 459 field images of blueberries with mummy berry disease were obtained from the University of Maine wild blueberry experimental fields and online sources. Based on field images, a total of 1661 annotated images were produced by the synthetic data generation method (Table A1 in Appendix).

3.2. Synthetic Data Generation

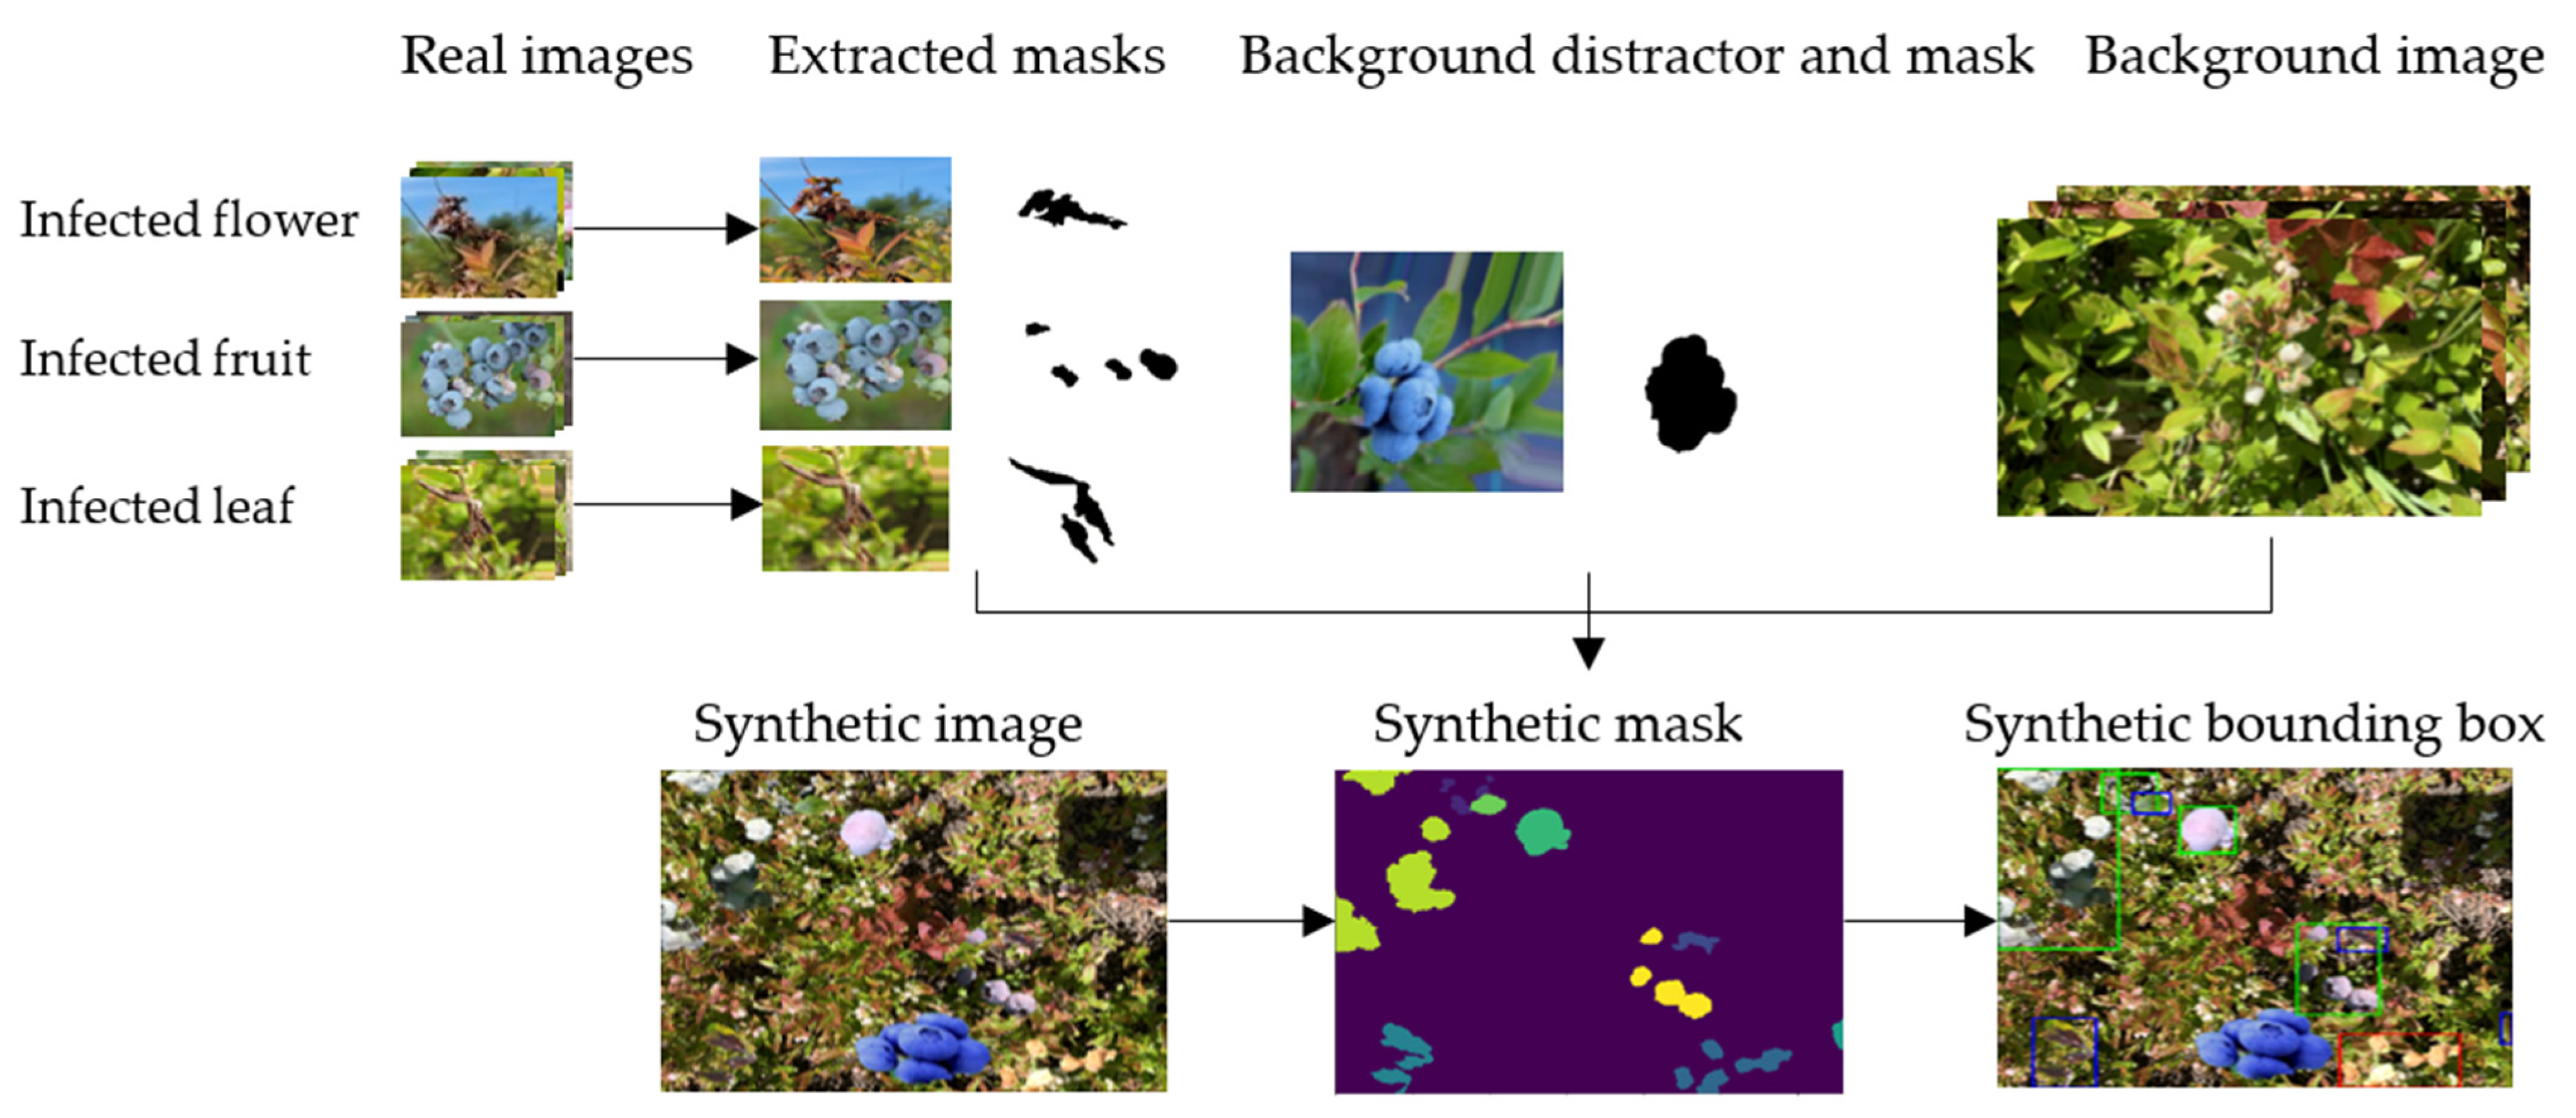
In this study, we applied the cut and paste technique [29] to create synthetic images and related annotations by random scaling, rotation, and adding segmented images of interest to the background. Unlike Mixup and CutMix, our method only copied the exact pixels that corresponded to an object, as opposed to all the pixels in the object’s bounding box. To generate a synthetic dataset with our cut and paste method, we randomly selected images of 55 flowers, 48 fruits, and 58 leaves of diseased blueberry plant tissue from the field dataset (discussed in Section 3.1) and created masks. Then a total of 83 “healthy” background photographic images with only healthy uninfected flowers and leaves were collected in a lowbush blueberry field at the University of Maine, Blueberry Hill Farm (Jonesboro, ME, USA). In order to make the background more complex, seven distractor object images of healthy fruits were obtained from online sources, and then masks were created. Objects of interest masks were created using Adobe Photoshop software, unlike a previous study [29] that automated this process by training a machine learning model to segment and extract the objects.
Once the image data was ready, we randomly selected the background image and resized it to 1080 × 1320 pixels and 1320 × 1080 pixels, vertically and horizontally, respectively. Then, to make the background of the synthetic dataset diverse, we randomly selected at most 10 segmented distractor images and randomly resized, rotated and added them to the background iteratively. Under field conditions in agriculture production systems, occlusion problems are common challenges that need to be considered. Hence, in generating a synthetic dataset, a newly added image can partially or fully overlap a previously added image. Therefore, to control the degree of overlap and include cases of occlusion in the synthetic dataset, the threshold value for the degree of overlap was set at 25%. Finally, in an iterative process, we randomly chose a maximum of 15 segmented images of diseased leaves, flowers, and fruits and randomly resized and rotated them, and then added the new background images on top of the background distractor images (see Figure 2).

3.3. Coordinate Attention Module

When detecting mummy berry disease, the infection can be randomly distributed on the plant stem, resulting in a mixture of overlapping occlusions, and the infected region may occupy a relatively small proportion of the image area, leading to missed or incorrect detection. In our study, we introduce the coordinate attention (CA) module to help the deep learning model focus on the most significant information related to infection and ignore minor features. The CA mechanism is an efficient and lightweight module that embeds position information into the attention map. The model can obtain information about a large area without introducing additional computational costs. The coordinate attention block can be considered a computational unit that increases the expressive power of the learned features. It takes an intermediate feature tensor: X = [ x 1 , x 2 , , x C ] C   ×   H   ×   W as input; and outputs a transformed tensor with enhanced representations: Y = [ y 1 , y , , y C ] of the same size to X .
In the structure of the coordinate attention module, the operation is divided into two steps: (1) coordinate information embedding; and (2) coordinate attention generation (Figure 3). The first step factors global pooling as given in Equation (1) into two 1D feature encoding operations that encode each channel along the horizontal and vertical directions, respectively.
z c h ( h ) = 1 W 0     i   <   W x c ( h , i )   z c w ( w ) = 1 H 0     i   <   H x c ( j , w )
where X denotes the input, z c h ( h ) and z c w ( w ) indicate the outputs of the c th channel at height h and width w , respectively. The second step concatenates the feature maps produced and sends them to the shared 1 × 1 convolutional transformation F 1 to obtain the intermediate feature map, f , as formulated in Equation (2),
f = δ ( F 1 ( [ Z h , Z w ] ) )
where [. , .] denotes the concatenation operation along the spatial dimension, and δ is a non-linear activation function. The feature map f is then split along the spatial dimension into two separate tensors f h and f w , followed by another two 1 × 1 convolutional functions F h and F w , which are determined by Equation (3),
g h = σ ( F h ( f h ) ) , g w = σ ( F w ( f w ) )
where σ denotes the sigmoid activation function. The final attention weight Y is generated according to Equation (4),
y c ( i , j ) = x c ( i , j ) × g c h ( i ) × g c w ( j )
Therefore, in this study, we integrated the coordinate attention (CA) module on the Yolov5 backbone. This offers three obvious advantages: (1) it captures cross-channel and position-sensitive information that helps models accurately locate and recognize objects of interest; (2) having a lightweight property that is less lightweight than other attention mechanisms [26,27]; and (3) flexibility to be plugged into object detection models such as Yolov5 with little additional computational overhead.

3.4. Yolov5 Method

Object detection is a computer vision technique for locating instances of a certain class of objects in an image. Recent object detection methods can be categorized into two main types: one-stage and two-stage. One-stage methods prioritize inference speed and include a series of YOLO detection methods [15,35,48,49,50], SSD [36,51], and RetinaNet [52]. Typical two-stage methods prioritize detection accuracy and include R-CNN [53], Fast R-CNN [54], Mask R-CNN [55], Cascade R-CNN [56], and others.
Yolov5 is the latest generation of one-stage object detection network models of the YOLO series proposed by Ultralytics in May 2020 see [57]. Based on the network depth and width of feature maps, Yolov5 can be divided into four models, namely Yolov5s, Yolov5m, Yolov5l, and Yolov5x [23]. Compared with two-stage detection network models, Yolov5 greatly improves the running speed of the model while maintaining detection accuracy. This not only meets the needs of real-time detection, but also has the advantage of a small structure size. The Yolov5 network model is an improved model based on Yolov3 with improvements such as multi-scale prediction, which can simultaneously detect images of different sizes [20]. Therefore, we proposed a lightweight mummy berry disease detection network model based on Yolov5s by improving the network backbone with an attention mechanism. The architecture of the improved Yolov5s-CA network model is shown in Figure 3.

3.5. Improvement of Yolov5s-CA Network Model

Figure 3 shows the structure of the improved Yolov5s-CA network model to detect mummy berry disease. It can be seen that a lightweight module CA [28] was introduced into the backbone of Yolov5s to strengthen the feature representation ability of the network and select useful information, which enhances detection performance. The network structure of Yolov5s-CA consists of four parts: input, backbone, neck, and head.
The backbone of the Yolov5s-CA network model contains Conv, C3, CA, and Spatial Pyramid Pooling Fusion (SPPF). The Conv is the basic convolution unit, which performs two-dimensional convolution, regularization, and activation operations on the input. The C3 module is located in both the backbone and neck. The C3 module with a shortcut structure is implemented in the backbone of the network. It divides the input tensor equally into two branches and performs convolution operations. One branch passes through a Conv module and then passes through multiple residual structures to avoid degradation problems in the deep computational process. The other branch directly combines the two branches to form a Conv module. As shown in Figure 4, the CA modules are integrated into the backbone following the C3 module to highlight and select the most important disease-related visual features and improve the representation ability of the object detection model to detect mummy berry disease in a field environment. The last layer of the backbone, Spatial Pyramid Pooling Fast (SPPF), shown in Figure 5, comprises three MaxPool layers of 5 × 5 kernel sizes in series and passes the input through the MaxPool layers in turn and performs a concatenation operation on the output before performing a Conv operation. The SPPF structure can achieve similar feature ex-traction results as SPP, but SPPF runs faster. The image can learn features at multiple scales with the help of MaxPool layers and jump connections, and then increase the representativeness of the feature map by combining global and local features.
The neck module is a feature aggregation layer between the head and the backbone. It collects as much information as possible from the backbone before feeding it to the head. It consists of two parts: the Feature Pyramid Network (FPN) and the Path Aggregation Network (PAN). The FPN structure transmits semantically robust features from the top-down, while the PAN transmits information in a bottom-up pyramid to strengthen the feature representation capabilities of the network model. In addition, C3 modules were added to enhance the network’s feature extraction capability, and the C3 at the neck replaces the residual structure with multiple Conv modules.
The head outputs a vector containing the object category probability, the object scores, and the position of the bounding box. The loss function of Yolov5s consists of three parts: the confidence loss, the classification loss and the position loss of the target and prediction box. The original Yolov5s uses GIoU_loss as a bounding box regression loss function to evaluate the distance between the predicted box and the ground truth box. It can be expressed in the following formulae represented in Equations (5)–(7).
I o U = A B A B
G I o U = I o U A c u A c
L G I o U = 1 G I o U
where A is the predicted box, B is the ground truth box,   I o U represents the intersection ratio of the predicted box and the ground truth box, A c represents the intersection of the predicted box and the ground truth box, u represents the smallest circumscribed rectangle of the predicted box and the ground truth box, and L G I o U is the G I o U Loss.
Compared with the IoU_loss function, the GIoU loss function can solve the problem of non-overlapping bounding boxes. However, GIoU loss cannot solve the problem that the prediction frame is inside the target frame and the size of the prediction frame is the same. On the other hand, CIoU loss considers the scale information of the aspect ratio of the bounding box and measures it from the three viewpoints: (1) overlapping area, (2) center point distance, and (3) aspect ratio, which makes the prediction box regression more efficient. Therefore, in this study, we use CIoU loss as the regression loss function represented in Equations (8)–(10).
L l o c = 1 I o U I ( B , B g t ) + d 2 c 2 + a v
a = v 1 I o U + v
v = 4 π 2 ( a r c t a n , w g t h g t a r c t a n w h ) 2
where w is the width and h is the height of the prediction box and w g t and h g t are the width and height of the ground truth box, respectively.

3.6. Model Evaluation

Three metrics were used to evaluate the performance of the models. First, we used precision (P), defined as the proportion of true positives to the total number of positive detections (Equation (11)). Second, we used recall (R), defined as the proportion of true positives to the total number of actual objects (Equation (12)). Third, mean average precision (mAP@0.5) was used, which represents the mean value of AP for different categories with a threshold of 0.5% when m AP (Equation (13)) is converted to percent.
P r e c i s i o n = T P T P + F P
R e c a l l = T P T P + F N
m A P = A P n
In Equations (11)–(13), TP is the number of correctly detected disease regions, FP is the number of healthy regions of plants that have not been detected as having disease, FN is the number of incorrectly detected disease regions, AP is the area under the precision-recall curve and n is the number of classes.
The experiments were carried out following the improved Yolov5s-CA model (Figure 3). To implement the mummy berry disease detection model, we used Pytorch version 1.11.0. The code was written, edited, and run using Google Colab Pro’s notebook, a subscription-based service provided by Google Research that allows users to write and run Python code in web browsers. The hardware configuration that we used was: NVIDIA Tesla P100 GPU, 16 GB RAM, 127 GB hard disk, and CUDA version 11.2. The hyperparameters of the two models were set uniformly. The initial learning rate of the model was set to 0.01, and the momentum of the learning rate to 0.9. The batch size was set to process 16 images per iteration. The resolution of the input image was set to 640 × 640 pixels, and the number of epochs was set to 300. The training, validation, and test set images were in the ratio of 8:1:1 with no overlap between the three sets. To demonstrate the effectiveness of improving the original Yolov5s, we conducted experiments with and without modifying the backbone of Yolov5s with an attention mechanism. Each experiment was validated on the field-collected test dataset.

4. Results

We designed and conducted five experiments. The first experiment was designed to compare the two Yolov5s models (Yolov5s vs. Yolov5s-CA) on disease detection when they were only trained on the field-collected data. The second experiment compared the two models when they were trained only on the synthetic data. The third experiment compared the two models when they were trained on a combined dataset of synthetic and field-collected data. The fourth experiment compared the detection speeds of the two models. The fifth experiment compared the detection of the two models at different spatial scales (camera shooting distances).

4.1. Comparison of Disease Detection Models Trained Only on the Field-Collected Dataset

This experiment developed a baseline model by evaluating the effect of varying the amount of training data on the model’s performance. To this end, the improved Yolov5s-CA and Yolov5s models were evaluated only on field-collected images. The precision of the Yolov5s-CA model is 70.2%, the recall is 61.3% and mAP@0.5 is 65.8%, which shows an increase of 2.7%, 0.5% and 1.1% in precision, recall and mAP@0.5, respectively, compared to the Yolov5s model (Table 1). Increasing the amount of the field-collected training data from 10–100% in all cases leads to an increase in the performance of the model (Figure 6).
The comparison of experimental indicators shows that the performance of the improved Yolov5s-CA model is higher than Yolov5s, which confirms the effectiveness of integrating the attention mechanism on the backbone of the Yolov5s model. This approach suppresses less important features and improves the rate of correct detection.

4.2. Comparison of Disease Detection Models Trained Only on the Synthetic Dataset

This experiment evaluated models trained exclusively with synthetically generated images, in contrast to the results in Section 4.1 illustrating the performance of the models trained only on a limited number of field-collected images. We created a synthetic dataset containing 1661 images (method in Section 3.2). Similar to Section 4.1, we varied the amount of synthetic training images to investigate their effect on model performance (Figure 6). Increasing the training data size to more than 80% of the total available images has no contribution in terms of improving the performance of the model. Compared with Yolov5s, the recall of the improved Yolov5s-CA model increased by 4.9%; however, precision and mAP@0.5 values decreased by 5.9% and 0.4%, respectively (Table 2).
Moreover, as illustrated in Table 1 and Table 2, when the precision, recall and mAP@0.5 values of models trained on field-collected and synthetic datasets are compared, a model trained only on a synthetic dataset generalized poorly compared to the field-collected dataset. This suggests that, although synthetic images are fast to generate, the domain gap between the synthetic and the field-collected data prevents the disease detection model trained only on the synthetic dataset from achieving the same performance as the field-trained models.

4.3. Comparison of Disease Detection Models Trained on a Combination of Synthetic and Field-Collected Datasets

In this experiment, we explored the effects of varying the amount of field-collected and synthetic data in mixed model training datasets. We evaluated the models on 10%, 25%, 40%, 55%, and 70% field-collected images with 80% synthetic images. The aim is to achieve baseline detection performance with less field-collected data and more synthetic data. The evaluation results are shown in Table 3.
The improved Yolov5s-CA and Yolov5s models were trained on the mixed datasets, and precision, recall and mAP@0.5 values were calculated for the two models. The precision of the Yolov5s-CA model is 71.4%, the recall is 59.2% and mAP@0.5 is 66.3% (Table 3), which indicates an increase in precision, recall and mAP@0.5 by 8.8%, 3.3%, and 5.2%, respectively, compared to Yolov5s model. Figure 7, Figure 8 and Figure 9 show comparative results of the model prediction.
In addition, when the number of field-collected images in the training datasets increased, a slight increase in the experimental indicators of the models was observed. In particular, the mixed model trained on 70% of field-collected images had a better detection performance and outperforms the baseline model trained on only field-collected images (see Section 4.1 with 1.2% precision and 0.5% mAP@0.5).

4.4. Comparison of Detection Speed of the Models

We compared the detection speed of the improved Yolov5s-CA and the original Yolov5s model (Table 4). The predicted inference speeds of the Yolov5s-CA model are 11.4 ms, 12.3 ms, and 11.9 ms, which are 2.3 ms, 1.6 ms, and 1.4 ms longer than the Yolov5s for the field-collected, synthetic, and mixed datasets, respectively. In addition, despite the increase in the parameters of the model, the size of Yolov5s-CA model is only 0.1 MB larger than the Yolov5s model. The detection speed or frames per second (FPS) of the Yolov5s-CA model was slightly lower, but had an improved performance compared to the Yolov5s model (Table 4). Therefore, the improved Yolov5s-CA model can ensure real-time performance with relatively little additional detection time and nearly no computational overhead.

4.5. Comparison of Detection at Different Spatial Scales

To compare the detection results of the models, nine images similar to those shown in Figure 7, Figure 8 and Figure 9 were selected from the test set as these images represented detection scenarios at different spatial scales (camera shooting distances) in the dataset. In the figures, the labels fl, fr, and lf represent infected flower, infected fruit, and infected leaf, respectively. The improved Yolov5s-CA network model proposed in this study was the superior model to detect diseased plant parts at different camera shooting distances (Figure 7, Figure 8 and Figure 9). There is almost no difference between the improved network model and Yolov5s in detecting large target plant parts taken at close distances (Figure 7a–f). The detection results focused on the plant stem (Figure 8a–f) show that there is a difference between the two network models in detecting small plant parts from the image. As shown in Figure 8d–f, the improved network model can accurately detect small target plant parts with occlusion which could not be detected by the original Yolov5s model. For the clone-level detection results shown in Figure 9a–f between the two models, the Yolov5s model has more wrong and missed detections than the improved network model. In Figure 9a, Yolov5s predicted two wrong detection and nine correct detections, while the improved network model in Figure 9d predicted thirteen correct detections with one wrong detection. Both models predicted three correct detections in Figure 9b,e, but Yolov5s predicted two wrong detections while the improved network model had only one wrong detection. Additionally, in Figure 9f, the improved network model predicted twelve correct detections, while, Yolov5s predicted eight correct detections (Figure 9c). However, although the improved model still has satisfactory detection ability with some degree of occlusion, and overlap of leaves, as shown in Figure 9c,f, both models failed to detect small diseased leaves in the image at long distances.
To further verify the effectiveness of the improved Yolov5s-CA model proposed in the present study, nine test sets representing different spatial scale detection scenarios were analyzed (Table 5). There were 78 mummy berry disease objects in nine test sets. The number of objects detected by these methods was 47 and 54 for Yolov5s and Yolov5s-CA, respectively, of which mummy berry disease was 41 for Yolov5s and 52 for Yolov5s-CA. The recall rate, accuracy, and misdetection rate of the methods were 52.56%, 87.23%, and 12.77% for Yolov5s and 66.67%, 96.30%, and 3.70% for the improved Yolov5s-CA.
From Table 5 and Figure 8d–f, it can be seen that the detection is the best in the plant stem scenario with a recall and precision rate of 80.95% and 100.00%, respectively. The plant parts taken at close distances are also accurately detected. Both methods can correctly detect plant parts in the image and their recall rate is 77.78%. In addition, the proposed method can effectively detect mummy berry disease objects at a long distance in the clone with, a recall rate of 58.33%,and a precision of 93.33%.
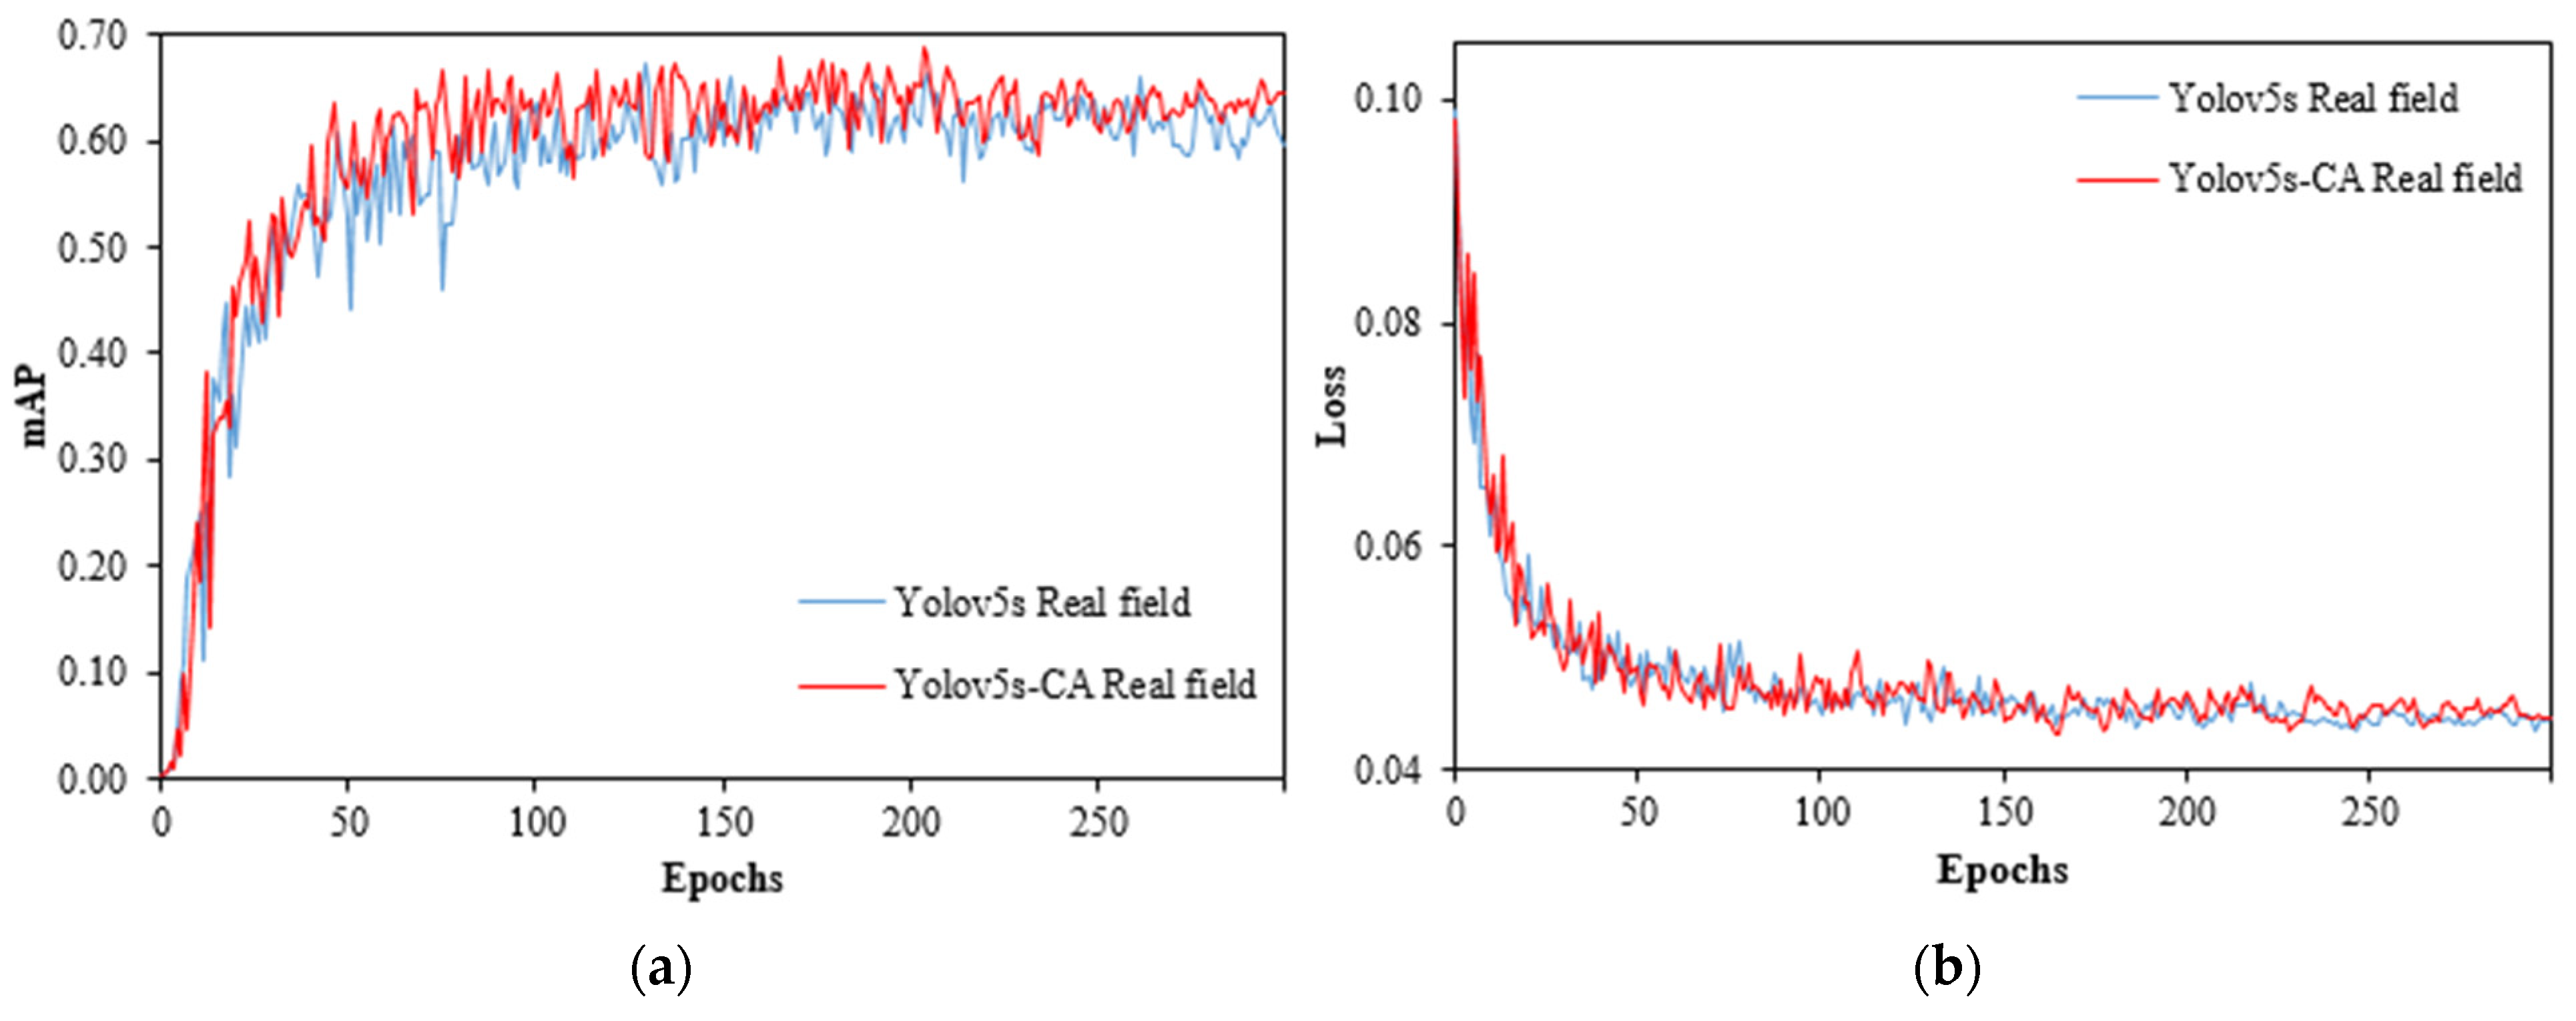
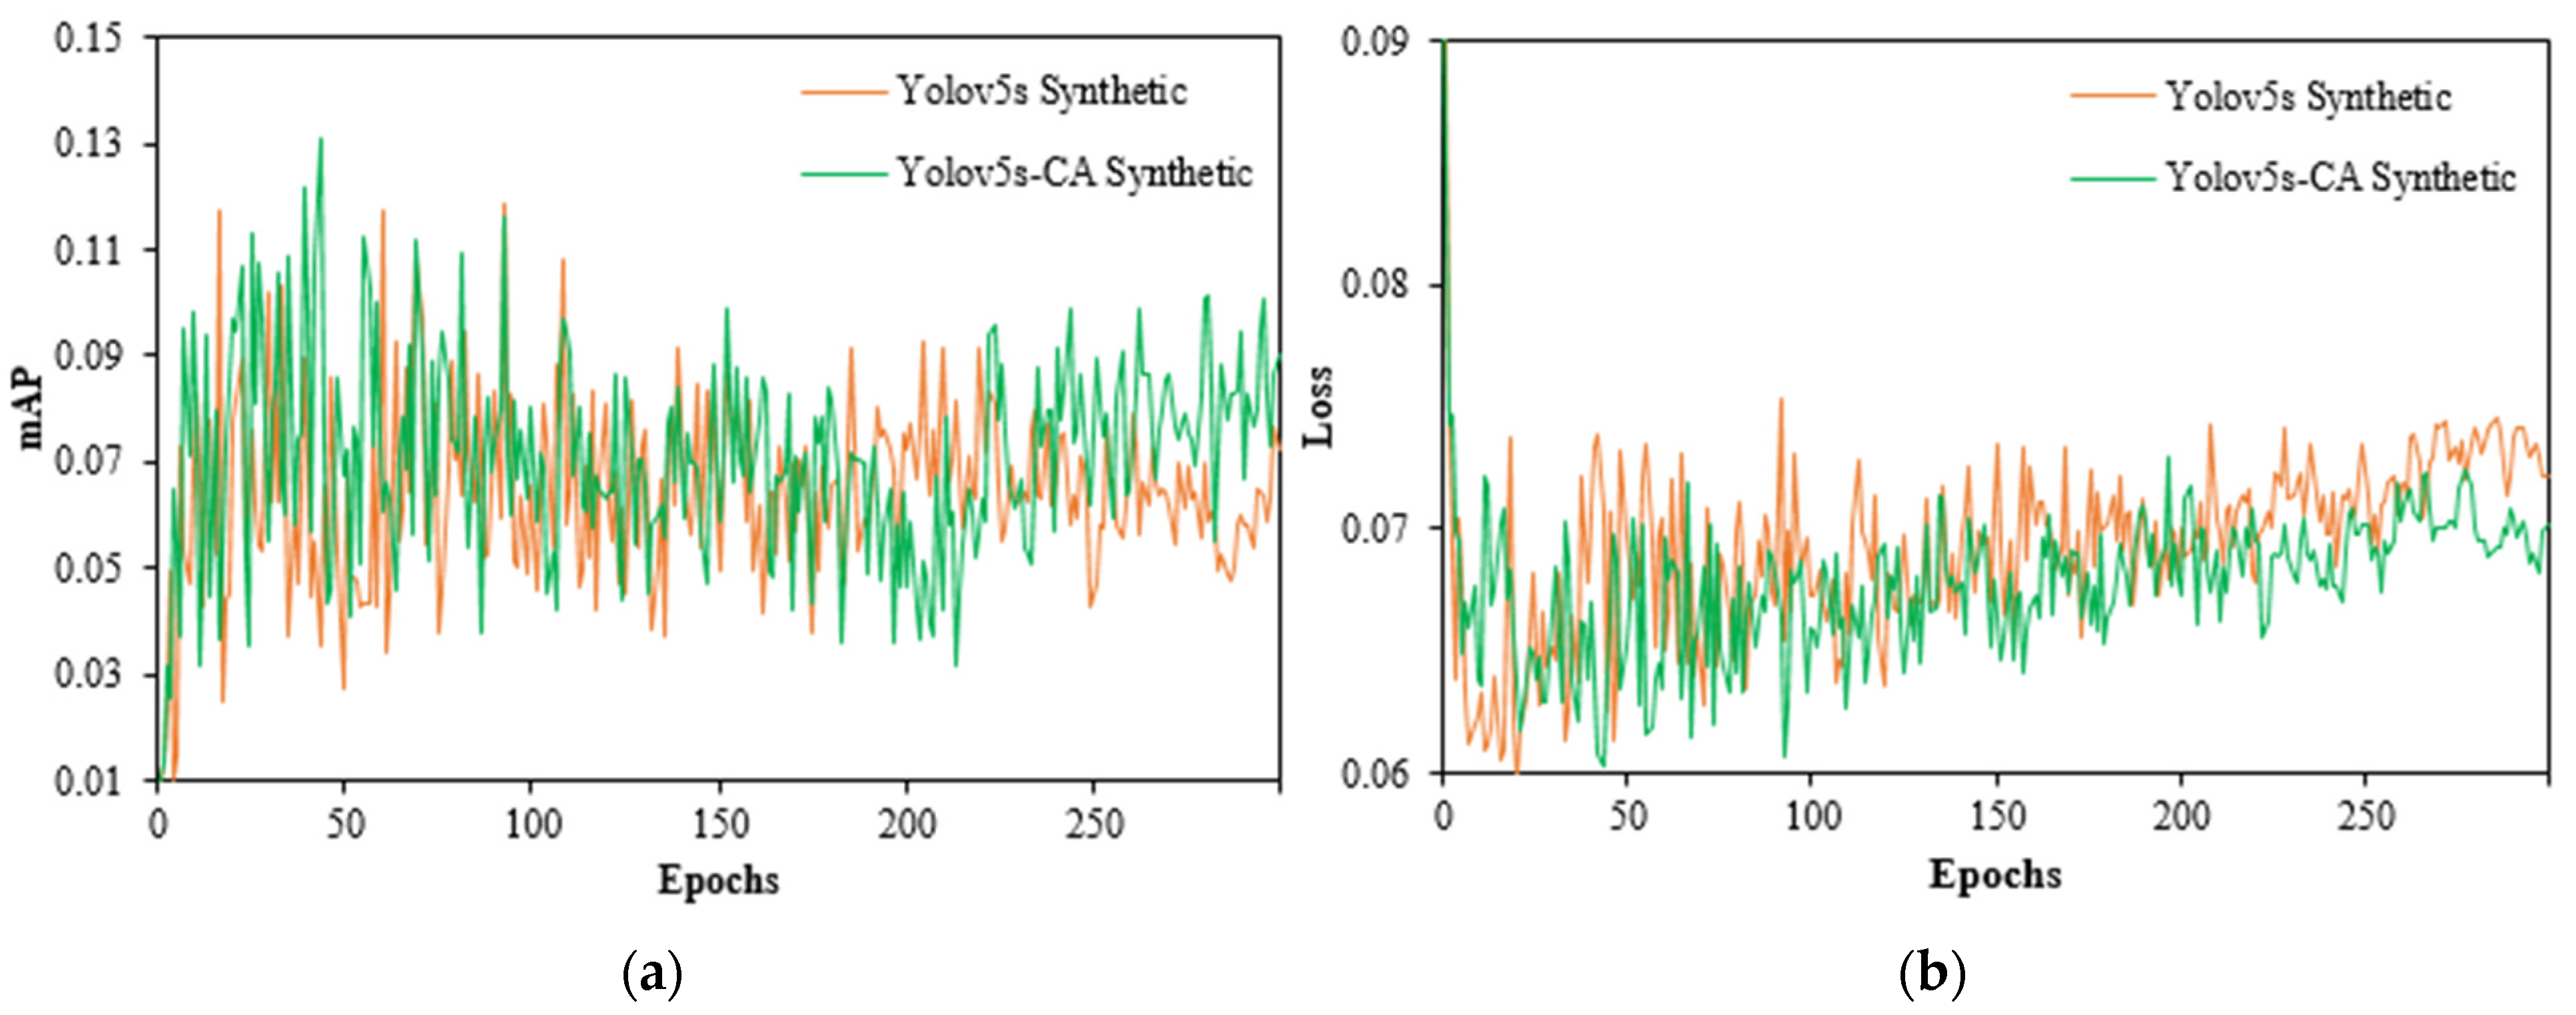
The loss and mAP curves for the two network models tested in the present study are shown in Appendix A. The loss curves of both models had a downward trend and the values of the loss function decreased rapidly when tested against the real field and mixed datasets (Figure A1b and Figure A3b). However, when the network iterations reach approximately 150, the loss curves gradually exhibited a slowed rate of change and stabilized. In contrast, the loss curves in Figure A2b using the synthetic dataset had a downward trend, but only after approximately 25 iterations, the loss curves showed an upward trend indicating noisy movements and no improvement in the values of the loss function. Analysis of the loss function from Figure A1 and Figure A3 shows that the integrated attention module on the Yolov5s backbone can effectively accelerate the network convergence speed and improve the model performance.

5. Discussion

In the present study, a deep learning model based on the improved Yolov5s for automatic detection of mummy berry disease in a real wild blueberry field environment is proposed. In order to highlight important information that is relevant to the current task and improve the effectiveness of the network model, the coordinate attention (CA) module was introduced on the backbone structure of the original Yolov5s. In addition, to overcome the problem of data scarcity, we present a method for generating synthetic training images for object detection models, which greatly reduces the effort required to collect and annotate large datasets.
The overall performance of the improved network model was better than the original Yolov5s. A one-way ANOVA test on precision found a significant difference between the means of the two network models (F(1299) = 18.069, p < 0.001). The precision of the improved network model reached 71.4%, which is 1.2% higher than Yolov5s precision. This result is consistent with previous studies conducted to recognize plant diseases. Yan et al. [58] compared the original Yolov5s network model with the improved Yolov5s for real-time apple disease target detection, and the improved Yolov5s model mAP@0.5 increased by 5.1%. Similar results and comparisons with Yolov5 models were shown in a study [59], where the authors found that with the joint efforts of the coordinate attention module and Softpool pooling, the multi-scale feature fusion (MFF) convolutional neural network (CNN) obtained the optimal detection accuracy with a 1.6% improvement compared to Yolov5s. Another study [60] developed an accurate apple fruitlet detection method with a small model size and the channel pruned Yolov5s model provided an effective method to detect apple fruitlets under different conditions. For tomato disease detection, the study in [20] used a mobile phone to collect images of tomato disease in a greenhouse and the improved SE-Yolov5 [email protected] was 1.78% higher than the Yolov5 model.
The performance of our improved network model was evaluated on the field-collected, synthetic and mixed datasets. Compared to training the object detection model only on synthetic images, we found a detection model with satisfactory performance on field-collected images, but a significant increase in performance was achieved when trained on a mixed dataset of field-collected and synthetic images. Our proposed Yolov5s-CA network model trained on a mixed dataset of 70% real field images and 80% of synthetic images outperformed, by 1.2% precision and 0.5% mAP@0.5 values, the baseline model trained using only field-collected images. The results indicated that labeled real-world field-collected datasets are key to improving performance by overcoming domain gaps when training a plant disease detection model with synthetic datasets.
The improved Yolov5s network model has improved disease prediction performance under a certain degree of occlusion, leaf overlap, and different spatial scale scenarios (Table 5, Figure 7, Figure 8 and Figure 9 and Figure A4). This is because the integrated coordinate attention (CA) mechanism at the backbone of the Yolov5s network model suppresses less relevant information and highlights key disease-related visual features to help identify mummy berry disease in a field environment. The lightweight coordinate attention (CA) module captures long-term dependencies in one space, retains accurate disease location information in the other, and forms a pair of direction-aware and position-aware feature maps, which can help the model locate and identify potential targets more precisely and enhance the representation capability of effective information. In addition, the CIoU loss used in this study takes into account the overlap area, the center point distance and the aspect ratio similarity between the actual box and the prediction box, which improves the network’s regression accuracy and sensitivity to small disease organs [61]. The advantages of our method become even more obvious when dealing with scenarios of large spatial scale where a huge number of interacting and overlapping plant parts are present in a clone level image. Therefore, the effectiveness of the improved network model for mummy berry disease detection makes it clearly better than the l Yolov5s family and meets the needs of real-time detection of mummy berry disease under field conditions.
In general, promising results were obtained for training object detection models by combining a small number of field-collected images with synthetic datasets. The presented synthetic image generation method is essential when the collection and annotation of a large dataset are expensive and/or prohibitive. In addition, the coordinate attention (CA) module integrated into the Yolov5s backbone has contributed to the detection of mummy berry disease in a commercial lowbush blueberry field environment by efficiently discriminating important features.

6. Conclusions

This study focused on detecting mummy berry disease in a real natural environment based on the deep learning method and proposed an improved Yolov5s network model. By integrating the coordinate attention module into the backbone of Yolov5s, the visual features associated with mummy berry disease are well focused and extracted, which boosts the performance of the model in identifying disease symptoms. In addition, we presented the cut-and-paste method for synthetically augmenting the available dataset to generate annotated training images which greatly reduces the effort required to collect and annotate large datasets. To test the generalization ability of the improved network model and prove the usefulness of the synthetic dataset to enhance the performance of deep learning-based object detection models, quantitative performance comparisons of the improved network model and Yolov5s trained on field-collected, synthetic and mixed datasets were conducted (Table 1, Table 2 and Table 3). Compared to the baseline model with a 100% real field dataset, the synthetic dataset combined with 70% of real field outperformed the baseline model (Table 3). In all three datasets tested, the overall performance of the improved Yolov5s-CA network model is superior to that of the Yolov5s model with only slightly higher computational costs. Moreover, the improved Yolov5s network model has improved the disease prediction performance in occlusion, leaf overlaps, and different spatial scales. In general, the effectiveness of the improved network model for mummy berry disease detection is better than the original Yolov5s and meets the needs of real-time detection of mummy berry disease under field conditions. However, as the synthetic data generation process and the network model were trained on small numbers of field-collected images with limited variability in disease symptoms and camera shooting distances, some missed or incorrect detection cases were observed. In addition, the presented cut–paste synthetic data generation method is highly influenced by the quality of segmentation of the object from the image.
In the future, taking images using high-resolution cameras at different shooting distances will contribute to creating a more robust model, as well as solving the limitations of missed or incorrect detection over different occlusions and spatial scales. Furthermore, we will automate the segmentation process to extract the object from the image. Finally, we will work on implementing the models to run on a cloud server so that web and mobile applications can access it to make predictions.

Author Contributions

E.Y.O.: Conceptualization, methodology, software, formal analysis, writing—original draft preparation. H.Q.: conceptualization, methodology, formal analysis, writing—original draft preparation and review and editing, supervision, project administration, funding acquisition. Y.-J.Z.: writing—review and editing, data curation. S.A.: field collection of images, writing—review and editing. F.D.: writing—review and editing. All authors have read and agreed to the published version of the manuscript.

Funding

We acknowledge funding by the National Natural Science Foundation of China (61871061). This also a publication of the Project of Advanced Scientific Research Institute of CQUPT under Grant E011A2022329. YJZ is supported by the USDA National Institute of Food and Agriculture (Hatch Project number ME0-22021) through the Maine Agricultural & Forest Experiment Station.

Institutional Review Board Statement

Not applicable.

Informed Consent Statement

Not applicable.

Data Availability Statement

The dataset is available upon request from the corresponding author at [email protected].

Conflicts of Interest

The authors declare no conflict of interest.

Appendix A

Figure A1. Experimental results of each model on the field-collected dataset. (a) mAP@0.5 curves for the real field dataset. (b) Loss curves for the real field dataset.
Agriculture 13 00078 g0a1
Figure A2. Experimental results of each model on the synthetic dataset. (a) mAP@0.5 curves for the synthetic dataset. (b) Loss curves for the synthetic dataset.
Agriculture 13 00078 g0a2
Figure A3. Experimental results of each model on the mixed dataset. (a) mAP@0.5 curves for the mixed dataset. (b) Loss curves for the mixed dataset.
Agriculture 13 00078 g0a3
Figure A4. Comparison of correct detection between the Yolov5s and Yolov5s-CA models.
Agriculture 13 00078 g0a4
Table A1. Number of images in each data subset.
Train ValidationTest
Real field 3674646
Synthetic1661--

References

  1. Chatterjee, S.; Kuang, Y.; Splivallo, R.; Chatterjee, P.; Karlovsky, P. Interactions among Filamentous Fungi Aspergillus Niger, Fusarium Verticillioides and Clonostachys Rosea: Fungal Biomass, Diversity of Secreted Metabolites and Fumonisin Production. BMC Microbiol. 2016, 16, 83. [Google Scholar] [CrossRef] [PubMed] [Green Version]
  2. Asare, E.; Hoshide, A.K.; Drummond, F.A.; Criner, G.K.; Chen, X. Economic Risk of Bee Pollination in Maine Wild Blueberry, Vaccinium Angustifolium. J. Econ. Entomol. 2017, 110, 1980–1992. [Google Scholar] [CrossRef] [PubMed] [Green Version]
  3. Tasnim, R.; Calderwood, L.; Tooley, B.; Wang, L.; Zhang, Y.-J. Are Foliar Fertilizers Beneficial to Growth and Yield of Wild Lowbush Blueberries? Agronomy 2022, 12, 470. [Google Scholar] [CrossRef]
  4. Seireg, H.R.; Omar, Y.M.K.; Abd El-Samie, F.E.; El-Fishawy, A.S.; Elmahalawy, A. Ensemble Machine Learning Techniques Using Computer Simulation Data for Wild Blueberry Yield Prediction. IEEE Access 2022, 10, 64671–64687. [Google Scholar] [CrossRef]
  5. Hanes, S.P.; Collum, K.K.; Hoshide, A.K.; Asare, E. Grower Perceptions of Native Pollinators and Pollination Strategies in the Lowbush Blueberry Industry. Renew. Agric. Food Syst. 2015, 30, 124–131. [Google Scholar] [CrossRef]
  6. Drummond, F. Reproductive Biology of Wild Blueberry (Vaccinium Angustifolium Aiton). Agriculture 2019, 9, 69–80. [Google Scholar] [CrossRef] [Green Version]
  7. Strik, B.C.; Yarborough, D. Blueberry Production Trends in North America, 1992 to 2003, and Predictions for Growth. Horttechnology 2005, 15, 391–398. [Google Scholar] [CrossRef]
  8. Jones, M.S.; Vanhanen, H.; Peltola, R.; Drummond, F. A Global Review of Arthropod-Mediated Ecosystem-Services in Vaccinium Berry Agroecosystems. Terr. Arthropod Rev. 2014, 7, 41–78. [Google Scholar] [CrossRef]
  9. Obsie, E.Y.; Qu, H.; Drummond, F. Wild Blueberry Yield Prediction Using a Combination of Computer Simulation and Machine Learning Algorithms. Comput. Electron. Agric. 2020, 178, 105778. [Google Scholar] [CrossRef]
  10. Penman, L.N.; Annis, S.L. Leaf and Flower Blight Caused by Monilinia Vaccinii-Corymbosi on Lowbush Blueberry: Effects on Yield and Relationship to Bud Phenology. Phytopathology 2005, 95, 1174–1182. [Google Scholar] [CrossRef]
  11. Batra, L.R. Monilinia Vaccinii-Corymbosi (Sclerotiniaceae): Its Biology on Blueberry and Comparison with Related Species. Mycologia 1983, 75, 131–152. [Google Scholar] [CrossRef]
  12. Mcgovern, K.B.; Annis, S.L.; Yarborough, D.E. Efficacy of Organically Acceptable Materials for Control of Mummy Berry Disease on Lowbush Blueberries in Maine. Int. J. Fruit Sci. 2012, 12, 188–204. [Google Scholar] [CrossRef]
  13. Annis, S.L.; Slemmons, C.R.; Hildebrand, P.D.; Delbridge, R.W. An Internet-Served Forecast System for Mummy Berry Disease in Maine Lowbush Blueberry Fields Using Weather Stations with Cellular Telemetry. In Proceedings of the Phytopathology; The American Phytopathological Society: Saint Paul, MN, USA, 2013; Volume 103, p. 8. [Google Scholar]
  14. Annis, S.; Schwab, J.; Tooley, B.; Calderwood, L. 2022 Pest Management Guide: Disease. 2022. Available online: https://extension.umaine.edu/blueberries/wp-content/uploads/sites/41/2022/02/2022-fungicide-chart.pdf (accessed on 25 September 2022).
  15. Wang, X.; Liu, J.; Zhu, X. Early Real-Time Detection Algorithm of Tomato Diseases and Pests in the Natural Environment. Plant Methods 2021, 17, 43. [Google Scholar] [CrossRef]
  16. Singh, V.; Misra, A.K. Detection of Plant Leaf Diseases Using Image Segmentation and Soft Computing Techniques. Inf. Process. Agric. 2017, 4, 41–49. [Google Scholar] [CrossRef] [Green Version]
  17. Qu, H.; Sun, M. A Lightweight Network for Mummy Berry Disease Recognition. Smart Agric. Technol. 2022, 2, 100044. [Google Scholar] [CrossRef]
  18. Sullca, C.; Molina, C.; Rodríguez, C.; Fernández, T. Diseases Detection in Blueberry Leaves Using Computer Vision and Machine Learning Techniques. Int. J. Mach. Learn. Comput. 2019, 9, 656–661. [Google Scholar] [CrossRef] [Green Version]
  19. Arsenovic, M.; Karanovic, M.; Sladojevic, S.; Anderla, A.; Stefanovic, D. Solving Current Limitations of Deep Learning Based Approaches for Plant Disease Detection. Symmetry 2019, 11, 939. [Google Scholar] [CrossRef] [Green Version]
  20. Qi, J.; Liu, X.; Liu, K.; Xu, F.; Guo, H.; Tian, X.; Li, M.; Bao, Z.; Li, Y. An Improved YOLOv5 Model Based on Visual Attention Mechanism: Application to Recognition of Tomato Virus Disease. Comput. Electron. Agric. 2022, 194, 106780. [Google Scholar] [CrossRef]
  21. Dewi, C.; Chen, R.-C.; Liu, Y.-T.; Jiang, X.; Hartomo, K.D. Yolo V4 for Advanced Traffic Sign Recognition with Synthetic Training Data Generated by Various GAN. IEEE Access 2021, 9, 97228–97242. [Google Scholar] [CrossRef]
  22. Abbas, A.; Jain, S.; Gour, M.; Vankudothu, S. Tomato Plant Disease Detection Using Transfer Learning with C-GAN Synthetic Images. Comput. Electron. Agric. 2021, 187, 106279. [Google Scholar] [CrossRef]
  23. Ultralytics. Yolov5. Available online: https://github.com/ultralytics/yolov5 (accessed on 18 July 2022).
  24. Shi, C.; Lin, L.; Sun, J.; Su, W.; Yang, H.; Wang, Y. A Lightweight YOLOv5 Transmission Line Defect Detection Method Based on Coordinate Attention. In Proceedings of the 2022 IEEE 6th Information Technology and Mechatronics Engineering Conference (ITOEC), Chongqing, China, 4–6 March 2022; Volume 6, pp. 1779–1785. [Google Scholar]
  25. Guo, R.; Zuo, Z.; Su, S.; Sun, B. A Surface Target Recognition Algorithm Based on Coordinate Attention and Double-Layer Cascade. Wirel. Commun. Mob. Comput. 2022, 2022, 6317691. [Google Scholar] [CrossRef]
  26. Woo, S.; Park, J.; Lee, J.-Y.; Kweon, I.S. Cbam: Convolutional Block Attention Module. In Proceedings of the European Conference on Computer Vision (ECCV), Munich, Germany, 8–14 September 2018; pp. 3–19. [Google Scholar]
  27. Hu, J.; Shen, L.; Sun, G. Squeeze-and-Excitation Networks. In Proceedings of the IEEE Conference on Computer Vision and Pattern Recognition, Salt Lake City, UT, USA, 18–22 June 2018; pp. 7132–7141. [Google Scholar]
  28. Hou, Q.; Zhou, D.; Feng, J. Coordinate Attention for Efficient Mobile Network Design. In Proceedings of the IEEE/CVF Conference on Computer Vision and Pattern Recognition, Nashville, TN, USA, 20–25 June 2021; pp. 13713–13722. [Google Scholar]
  29. Dwibedi, D.; Misra, I.; Hebert, M. Cut, Paste and Learn: Surprisingly Easy Synthesis for Instance Detection. In Proceedings of the IEEE International Conference on Computer Vision, Venice, Italy, 22–29 October 2017; pp. 1301–1310. [Google Scholar]
  30. Shorten, C.; Khoshgoftaar, T.M. A Survey on Image Data Augmentation for Deep Learning. J. Big Data 2019, 6, 1–48. [Google Scholar] [CrossRef]
  31. Dvornik, N.; Mairal, J.; Schmid, C. Modeling Visual Context Is Key to Augmenting Object Detection Datasets. In Proceedings of the European Conference on Computer Vision (ECCV), Munich, Germany, 8–14 September 2018; pp. 364–380. [Google Scholar]
  32. Khoreva, A.; Benenson, R.; Ilg, E.; Brox, T.; Schiele, B. Lucid Data Dreaming for Video Object Segmentation. Int. J. Comput. Vis. 2019, 127, 1175–1197. [Google Scholar] [CrossRef] [Green Version]
  33. Ghiasi, G.; Cui, Y.; Srinivas, A.; Qian, R.; Lin, T.-Y.; Cubuk, E.D.; Le, Q.V.; Zoph, B. Simple Copy-Paste Is a Strong Data Augmentation Method for Instance Segmentation. In Proceedings of the IEEE/CVF Conference on Computer Vision and Pattern Recognition, Nashville, TN, USA, 20–25 June 2021; pp. 2918–2928. [Google Scholar]
  34. Rao, J.; Zhang, J. Cut and Paste: Generate Artificial Labels for Object Detection. In Proceedings of the International Conference on Video and Image Processing, Singapore, 27–29 December 2017; pp. 29–33. [Google Scholar]
  35. Redmon, J.; Farhadi, A. YOLO9000: Better, Faster, Stronger. In Proceedings of the IEEE Conference on Computer Vision and Pattern Recognition, Honolulu, HI, USA, 21–26 July 2017; pp. 7263–7271. [Google Scholar]
  36. Liu, W.; Anguelov, D.; Erhan, D.; Szegedy, C.; Reed, S.; Fu, C.-Y.; Berg, A.C. Ssd: Single Shot Multibox Detector. In Proceedings of the European Conference on Computer Vision, Amsterdam, The Netherlands, 11–14 October 2016; pp. 21–37. [Google Scholar]
  37. Khalil, O.; Fathy, M.E.; El Kholy, D.K.; El Saban, M.; Kohli, P.; Shotton, J.; Badr, Y. Synthetic Training in Object Detection. In Proceedings of the 2013 IEEE International Conference on Image Processing, Melbourne, VIC, Australia, 15–18 September 2013; pp. 3113–3117. [Google Scholar]
  38. Fang, H.-S.; Sun, J.; Wang, R.; Gou, M.; Li, Y.-L.; Lu, C. Instaboost: Boosting Instance Segmentation via Probability Map Guided Copy-Pasting. In Proceedings of the IEEE/CVF International Conference on Computer Vision, Seoul, Republic of Korea, 27–28 October 2019; pp. 682–691. [Google Scholar]
  39. Abayomi-Alli, O.O.; Damaševičius, R.; Misra, S.; Maskeliūnas, R. Cassava Disease Recognition from Low-quality Images Using Enhanced Data Augmentation Model and Deep Learning. Expert Syst. 2021, 38, e12746. [Google Scholar] [CrossRef]
  40. Nair, V.; Hinton, G.E. Rectified Linear Units Improve Restricted Boltzmann Machines. In Proceedings of the 27th International Conference on Machine Learning, Haifa, Israel, 21–24 June 2010; pp. 807–814. [Google Scholar]
  41. Su, H.; Qi, C.R.; Li, Y.; Guibas, L.J. Render for Cnn: Viewpoint Estimation in Images Using Cnns Trained with Rendered 3d Model Views. In Proceedings of the IEEE International Conference on Computer Vision, Santiago, Chile, 7–13 December 2015; pp. 2686–2694. [Google Scholar]
  42. Movshovitz-Attias, Y.; Kanade, T.; Sheikh, Y. How Useful Is Photo-Realistic Rendering for Visual Learning? In Proceedings of the European Conference on Computer Vision, Amsterdam, The Netherlands, 11–14 October 2016; pp. 202–217. [Google Scholar]
  43. Gupta, A.; Vedaldi, A.; Zisserman, A. Synthetic Data for Text Localisation in Natural Images. In Proceedings of the IEEE Conference on Computer vision and Pattern Recognition, Las Vegas, NV, USA, 27–30 June 30 2016; pp. 2315–2324. [Google Scholar]
  44. Georgakis, G.; Mousavian, A.; Berg, A.C.; Kosecka, J. Synthesizing Training Data for Object Detection in Indoor Scenes. arXiv 2017, arXiv:1702.07836. [Google Scholar]
  45. Fuentes, A.; Yoon, S.; Kim, S.C.; Park, D.S. A Robust Deep-Learning-Based Detector for Real-Time Tomato Plant Diseases and Pests Recognition. Sensors 2017, 17, 2022. [Google Scholar] [CrossRef] [PubMed] [Green Version]
  46. Roy, A.M.; Bhaduri, J. A Deep Learning Enabled Multi-Class Plant Disease Detection Model Based on Computer Vision. AI 2021, 2, 26. [Google Scholar] [CrossRef]
  47. Chen, Y.-Y.; Pahadi, P.; Calderwood, L.; Annis, S.; Drummond, F.; Zhang, Y.-J. Will Climate Warming Alter Biotic Stresses in Wild Lowbush Blueberries? Agronomy 2022, 12, 371. [Google Scholar] [CrossRef]
  48. Redmon, J.; Divvala, S.; Girshick, R.; Farhadi, A. You Only Look Once: Unified, Real-Time Object Detection. In Proceedings of the IEEE Conference on Computer Vision and Pattern Recognition, Las Vegas, NV, USA, 27–30 June 30 2016; pp. 779–788. [Google Scholar]
  49. Redmon, J.; Farhadi, A. Yolov3: An Incremental Improvement. arXiv 2018, arXiv:1804.02767. [Google Scholar]
  50. Bochkovskiy, A.; Wang, C.-Y.; Liao, H.-Y.M. Yolov4: Optimal Speed and Accuracy of Object Detection. arXiv 2020, arXiv:2004.10934. [Google Scholar]
  51. Fu, C.Y.; Liu, W.; Ranga, A.; Tyagi, A.; Berg, A.C. Dssd: Deconvolutional Single Shot Detector. arXiv 2017, arXiv:1701.06659. [Google Scholar]
  52. Wang, Y.; Wang, C.; Zhang, H.; Dong, Y.; Wei, S. Automatic Ship Detection Based on RetinaNet Using Multi-Resolution Gaofen-3 Imagery. Remote Sens. 2019, 11, 531. [Google Scholar] [CrossRef] [Green Version]
  53. Girshick, R.; Donahue, J.; Darrell, T.; Malik, J. Rich Feature Hierarchies for Accurate Object Detection and Semantic Segmentation. In Proceedings of the IEEE Conference on Computer Vision and Pattern Recognition, Columbus, OH, USA, 23–28 June 2014; pp. 580–587. [Google Scholar]
  54. Girshick, R. Fast R-Cnn. In Proceedings of the Proceedings of the IEEE International Conference on Computer Vision, Santiago, Chile, 7–13 December 2015; pp. 1440–1448. [Google Scholar]
  55. He, K.; Gkioxari, G.; Dollár, P.; Girshick, R. Mask R-Cnn. In Proceedings of the Proceedings of the IEEE international conference on Computer Vision, Venice, Italy, 22–29 October 2017; pp. 2961–2969. [Google Scholar]
  56. Cai, Z.; Vasconcelos, N. Cascade R-Cnn: Delving into High Quality Object Detection. In Proceedings of the Proceedings of the IEEE Conference on Computer Vision and Pattern Recognition, Salt Lake City, UT, USA, 18–22 June 2018; pp. 6154–6162. [Google Scholar]
  57. Liu, K.; Tang, H.; He, S.; Yu, Q.; Xiong, Y.; Wang, N. Performance Validation of YOLO Variants for Object Detection. In Proceedings of the 2021 International Conference on Bioinformatics and Intelligent Computing, Harbin, China, 22–24 January 2021; pp. 239–243. [Google Scholar]
  58. Yan, B.; Fan, P.; Lei, X.; Liu, Z.; Yang, F. A Real-Time Apple Targets Detection Method for Picking Robot Based on Improved YOLOv5. Remote Sens. 2021, 13, 1619. [Google Scholar] [CrossRef]
  59. Li, Y.; Sun, S.; Zhang, C.; Yang, G.; Ye, Q. One-Stage Disease Detection Method for Maize Leaf Based on Multi-Scale Feature Fusion. Appl. Sci. 2022, 12, 7960. [Google Scholar] [CrossRef]
  60. Wang, D.; He, D. Channel Pruned YOLO V5s-Based Deep Learning Approach for Rapid and Accurate Apple Fruitlet Detection before Fruit Thinning. Biosyst. Eng. 2021, 210, 271–281. [Google Scholar] [CrossRef]
  61. Dong, X.; Yan, S.; Duan, C. A Lightweight Vehicles Detection Network Model Based on YOLOv5. Eng. Appl. Artif. Intell. 2022, 113, 104914. [Google Scholar] [CrossRef]
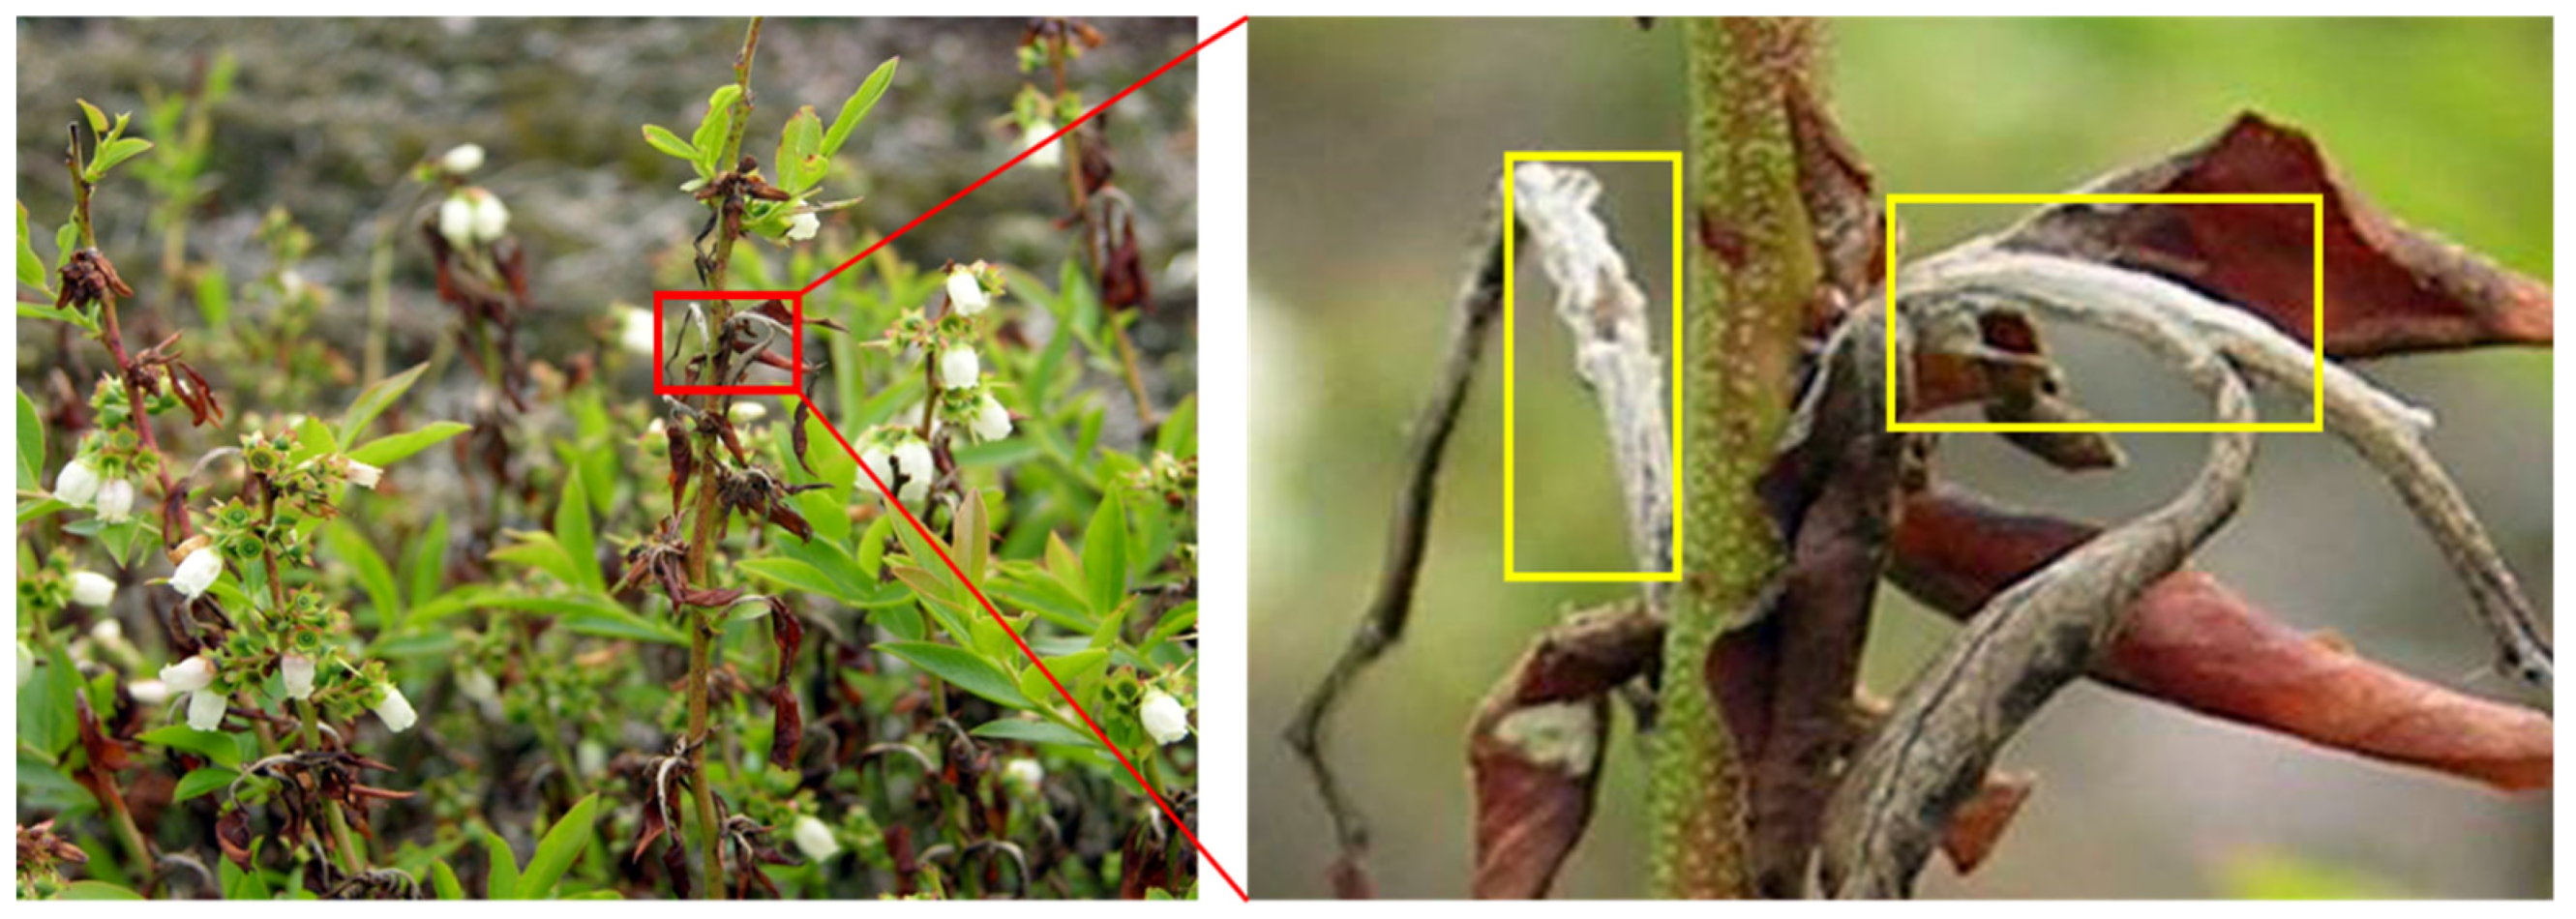
Figure 1. An example of field-taken images of mummy berry disease with the complex background of blueberry bushes. The red square marks the area in the left panel. The same image is zoomed in and depicted in the right panel, where yellow squares identify the presence of conidia.
Agriculture 13 00078 g001
Figure 2. The procedure of synthetic image dataset generation.
Agriculture 13 00078 g002
Figure 3. Structure of the coordinate attention (CA) module.
Agriculture 13 00078 g003
Figure 4. The improved Yolov5s-CA network model structure.
Agriculture 13 00078 g004
Figure 5. The SPPF module.
Agriculture 13 00078 g005
Figure 6. Effects of training data size. (a) Field-collected dataset. (b) Synthetic dataset.
Agriculture 13 00078 g006aAgriculture 13 00078 g006b
Figure 7. Comparison of detection results focused on the plant part. Yolov5s (ac) and Yolov5s-CA (df).
Agriculture 13 00078 g007
Figure 8. Comparison of detection results focused on the plant stem.Yolov5s (ac) and Yolov5s-CA (df).
Agriculture 13 00078 g008
Figure 9. Comparison of detection results focused on the clone. Yolov5s (ac) and Yolov5s-CA (df).
Agriculture 13 00078 g009
Table 1. Performance comparisons of models trained only on real field dataset.
ModelsPrecision (%)Recall (%)mAP @0.5 (%)
Yolov5s67.560.864.7
Yolov5s-CA70.2 161.3 165.8 1
1 Bold type reflects the best precision, recall and mAP@0.5 values.
Table 2. Performance comparisons of the model trained only on the synthetic dataset.
ModelsPrecision (%)Recall (%)mAP @0.5 (%)
Yolov5s30 114.911.7 1
Yolov5s-CA24.119.8 111.3
1 Bold type reflects the best precision, recall and mAP@0.5 values.
Table 3. Performance comparison of the model trained on a combination of synthetic and real field datasets.
Dataset SizeModelsPrecision (%)Recall (%)mAP @0.5 (%)
Synthetic + Real field 10%Yolov5s37.23327.9
Yolov5s-CA55.83335
Synthetic + Real field 25%Yolov5s40.440.735.2
Yolov5s-CA45.943.841.2
Synthetic + Real field 40%Yolov5s47.643.542.4
Yolov5s-CA6249.248.8
Synthetic + Real field 55%Yolov5s62.647.352.4
Yolov5s-CA69.648.954.2
Synthetic + Real field 70%Yolov5s62.655.961.1
Yolov5s-CA71.459.266.3
Synthetic + Real field 100%Yolov5s71.65462.3
Yolov5s-CA75.2 161.2 168.2 1
1 Bold type reflects the best precision, recall and mAP@0.5 values.
Table 4. Performance comparison of model detection speed.
ModelsDatasetsFrame Per Second (FPS)Inference Time (ms)ParametersModel Size (MB)
Yolov5sReal field109.899.17,027,72013.7
Synthetic93.4610.7
Mixed95.2410.5
Yolov5s-CAReal field87.7211.47,063,40013.8
Synthetic81.3012.3
Mixed84.0311.9
Table 5. Detail detection results of mummy berry disease at different spatial scales.
Models Spatial Plant ScalesTotal
Plant PartPlant StemClone 1
Yolov5sNumber of objects detected correctly 7142041
Number of annotations9214878
Recall rate (%)77.7866.6741.6752.56
Precision rate(%)87.5093.3383.3387.23
Yolov5s-CANumber of objects detected correctly7172852
Number of annotations9214878
Recall rate (%)77.7880.9558.3366.67
Precision rate(%)100.00100.0093.3396.30
1 Clone is a term that refers to a genetically distinct plant (range: <1–>25 m diameter).
Disclaimer/Publisher’s Note: The statements, opinions and data contained in all publications are solely those of the individual author(s) and contributor(s) and not of MDPI and/or the editor(s). MDPI and/or the editor(s) disclaim responsibility for any injury to people or property resulting from any ideas, methods, instructions or products referred to in the content.