Article

Potential Emissions of Insecticide VOCs and Their Correlations between Agricultural Emissions and Meteorological Factors

1
College of Resources and Environment, Hunan Agricultural University, Changsha 410128, China
2
Hunan Research Academy of Environmental Sciences, Changsha 410004, China
3
State Environmental Protection Key Laboratory of Monitoring for Heavy Metal Pollutants, Hunan Ecological and Environmental Monitoring Center, Changsha 410019, China
4
State Environmental Protection Key Laboratory of Environmental Pollution Health Risk Assessment, South China Institute of Environmental Sciences, Ministry of Ecology and Environment of the PRC, Guangzhou 510530, China
*
Author to whom correspondence should be addressed.
Agriculture 2023, 13(1), 66; https://doi.org/10.3390/agriculture13010066
Submission received: 25 September 2022 / Revised: 18 December 2022 / Accepted: 23 December 2022 / Published: 25 December 2022
(This article belongs to the Special Issue Impacts of Pesticides on Soil and Environment)

Abstract

:
In recent years, considerable attention has been paid to the volatile organic compounds (VOCs) that might lead to serious environmental problems, yet few studies relate to the insecticide application during agricultural process. As there appears to be a notable lack of research on the VOCs pollution of insecticides, we aimed to assess the occurrence of insecticide VOCs in the laboratory and during the agricultural process in China that have not been previously investigated. We discuss the estimation of VOCs emission potentials (EPs) and actual emissions (AEs) posed by insecticide applications. For this purpose, nine insecticide formulations were collected for testing and were analyzed via a thermogravimetric analyzer (TGA) and a pump-suction photoionization detection (PID) gas detector. The results showed that the EPs of nine insecticide samples ranged from 12.30% to 81.30%, with a median of 41.59% and a mean of 45.41%. The average actual emission ratio (AER) for the different formulations ranged from 48.76% to 72.12%. AER value was significantly positively correlated with temperature, but significantly negatively correlated with relative humidity and atmospheric pressure. The results of this study provide a technical reference for establishing the corresponding emission inventory and determining the total amount of pesticide VOCs.

1. Introduction

It has long been known that volatile organic compounds (VOCs) are emitted as gases from certain solids or liquids products. For example, numerous studies have shown the linkage between variety of products and their VOCs [1,2,3,4]. As a result, VOCs (e.g., formaldehyde, benzene, toluene, trichloroethylene dichloromethane) released into the atmosphere have been directly inducing short-term and long-term adverse effects to human health, leading to atmospheric environmental problems such as haze and photo-chemical smog [5,6,7,8,9]. VOCs continue to receive attention as important precursors of secondary pollutants like ozone (O3), secondary organic aerosol (SOA) and fine particulate matter (PM2.5) [6,9,10,11,12]. And the emission of key precursor VOCs from various sources should be cut down in the foreseeable future due to the atmospheric environment protecting goals of many countries. Intrinsically, VOCs emission sources include natural sources and anthropogenic sources, and the latter involved more people in a wide range such as using of solvents, driving of motor vehicles, and industrial processing [13,14]. It can be seen that the annual VOC emissions of industrial source in China increased from 8777 kt (thousand tonnes) to 12,446 kt with an average annual growth rate of 5.2% from 2011 to 2018 [15], which were even higher than the total emissions of anthropogenic VOCs in UK (810 kt in 2017) [16]. Pesticide formulations contain a large number of VOCs, most of which come from organic solvent components in liquid [17]. According to the estimation of European Solvents Industry Group (ESIG), total VOC emissions from solvent source of the European Union were up to 1981 kt/y in 2015 [18]. Pesticide use in agricultural activities could be one of the major factors causing the occurrence of solvent VOCs in many places around the world [19]. Usually, pesticides volatilize rapidly into the atmospheric environment during the pesticide production and use because a large number of solvents are involved in the process [20,21,22,23], and pesticide volatilization become one of the important anthropogenic emission sources of atmospheric VOCs.
In certain areas with heavy agricultural activities, pesticides could become a primary contributor to VOC emission. California (US) has been continuously monitoring pesticides use and their VOC emissions inventory, and publicly releasing the relevant reports since 1990 [24,25]. China has been ranked first for its pesticide usage and third for its application intensity in the world [26]. However, no detailed information on the VOC emission profiles from actual pesticide applications is available in China. The characteristics of high market value of cash crops and the profit seeking nature of farmers cause the rigid demand of pesticide market to increase. At present, the off-season fruits and vegetables represented by the greenhouse planting have considerable market profit space. However, while the greenhouse provides a suitable growth environment for the crops, it also becomes a hotbed for the breeding of bacteria and pests. Driven by interest factors, its pesticide consumption is much higher than that of traditional grain crops [5]. The term pesticide is defined as follows in the Regulations on the Administration of Pesticides (revised in 2022, Order No. 677 of the State Council of the People’s Republic of China): “It refers to the chemical synthesis used to prevent and control diseases, insects, grasses, rats and other harmful organisms that endanger agriculture and forestry, or a substance or mixture of several substances derived from biological and other natural substances and their preparations that can purposefully regulate the growth of plants and insects [27].” Among them, insecticide can be defined as a sub-categorical agent of pesticide that specially applied to kill insects, which have a long history of being used for eliminate agricultural and urban pests, and their flourished formulations and types covered a wild applicable range of fields [28], so the author selected insecticides as the research object to probe the characteristics of pesticide VOCs.
The objective of this research is to examine potential correlations between VOCs emitted from insecticides and agricultural applications in the following ways: (1) to estimate the potential insecticide VOC emission based on thermogravimetric analysis (TGA) of insecticide samples; (2) to measure the actual emission of the sample products after their application with portable VOCs gas detector and to compare the actual emission and potential VOC emission of the products; (3) to further analyze their emission characteristics of insecticide VOCs during application and the influence of formulations and meteorological factors. To the best of our knowledge, this represents the first study of field application experiment of pesticide VOCs in China.

2. Materials and Methods

2.1. Determining the EP Value of Insecticides

The VOC emission potential (EP) coefficients were calculated based on the thermal mass loss (TM) and moisture content (MC) of pesticide products according to the determination method from the California Department of Pesticide Regulation (CDPR) [29]. Since the commercial pesticides of China did not indicate exempt solvent and MC, the calculation of EP values could not directly use the MC in the product composition description, as the method of CDPR. Meanwhile, the exempt solvent disclosed by the CDPR was based on the considerations of meeting basic application requirements, but most of them were still the sources of VOCs. Therefore, this study mainly considered the influence of MC on the EP coefficient.
The TM values of insecticide samples were measured by thermogravimetric analysis (TGA) as the method of CPDR [29] and related reports [22,30], while the MC values of insecticide samples were measured with Karl Fischer coulometric titration according to the testing method of water in pesticides (GB/T1600-2021) from China [31]. Nine samples for testing were screened out from common liquid insecticides in China (see Table 1), including formulations of four emulsifiable concentrates (EC), two suspension concentrates (SC), one emulsion oil in water (EW), one aqueous solution (AS) and one soluble concentrate (SL). Each insecticide product was detected in triplicate for the above measurement, and the EP value (%) of a certain insecticide product was corrected by the formula as follows:
EP = TM ¯ MC ¯  
where, TM ¯ represents the average thermal mass loss(%) for three replicate samples of the same insecticide type; MC ¯ represents the average moisture content(%) for three replicates of the same insecticide type. A single test of MC cannot be greater than TM, but for three replicate samples of the weight approximately 10.00 mg might be resulting in the average value of MC greater than the average value of TM, due to the manual sampling process causing a tolerance of ±1.00 mg of the weight. Hence, if MC ¯ > TM ¯ caused the value of EP to be negative, then the EP value is regarded as zero for this type of insecticide product.
According to the method of CPDR [29] and related reports [22,30], the TM value of each insecticide sample was carried out in triplicate using TGA thermogravimetric analyzer (METTLER TOLEDO, Schwerzenbach, Switzerland). The weighing dishes (platinum) were conditioned at 125 °C for 1 h and stored in a desiccator prior to use. After taring, approximately 10.00 mg liquid sample was accurately weighed into a sample dish. When the sample reaches a stable maximum mass, recorded it immediately as the initial mass. Then, the samples were analyzed using the following temperature program: heating from 35 °C to 115 °C at a rate of 5 °C/min, held until the mass was stable (<0.5% change for 5 min) and then held for an additional 15 min, finally recording the ending mass. For some clearly identified thermal unstable pesticides and the uncertain pesticide samples which did not reach a stable mass at 115 °C (over 80 min), their detection procedure was re-run at 55 °C for 11 h.
The calculating formula of the TM value is as follows:
TM = (m0 − m1)/m × 100%
where, m0 represents the initial mass of insecticide sample, mg; m1 represents the ending mass of insecticide sample, mg; m represents the weighing mass of insecticide sample, namely 10.00 mg.
The moisture content of insecticide samples was detected in triplicate by the automatic micro moisture tester (ZDJ-1S, Beijing) based on the method of Karl Fischer coulometric titration (GB/T1600-2021) in China [31]. The water equivalent concentration (C, mg/mL) was calculated by the following formula:
C = m1 × 1000/V1
where, m1 represents the mass of added water, g; V1 represents the consuming volume of Carl Fisher reagent during the calibration, mL. The moisture content (MC, %) of pesticide sample was calculated by the following formula:
MC = C × V2 × 100/m2 × 1000
where, C represents the water equivalent concentration of Carl Fisher reagent (mg/mL); V2 represents the consuming volume of Carl Fisher reagent during the measurement, mL; m2 represents the mass of insecticide sample, g.

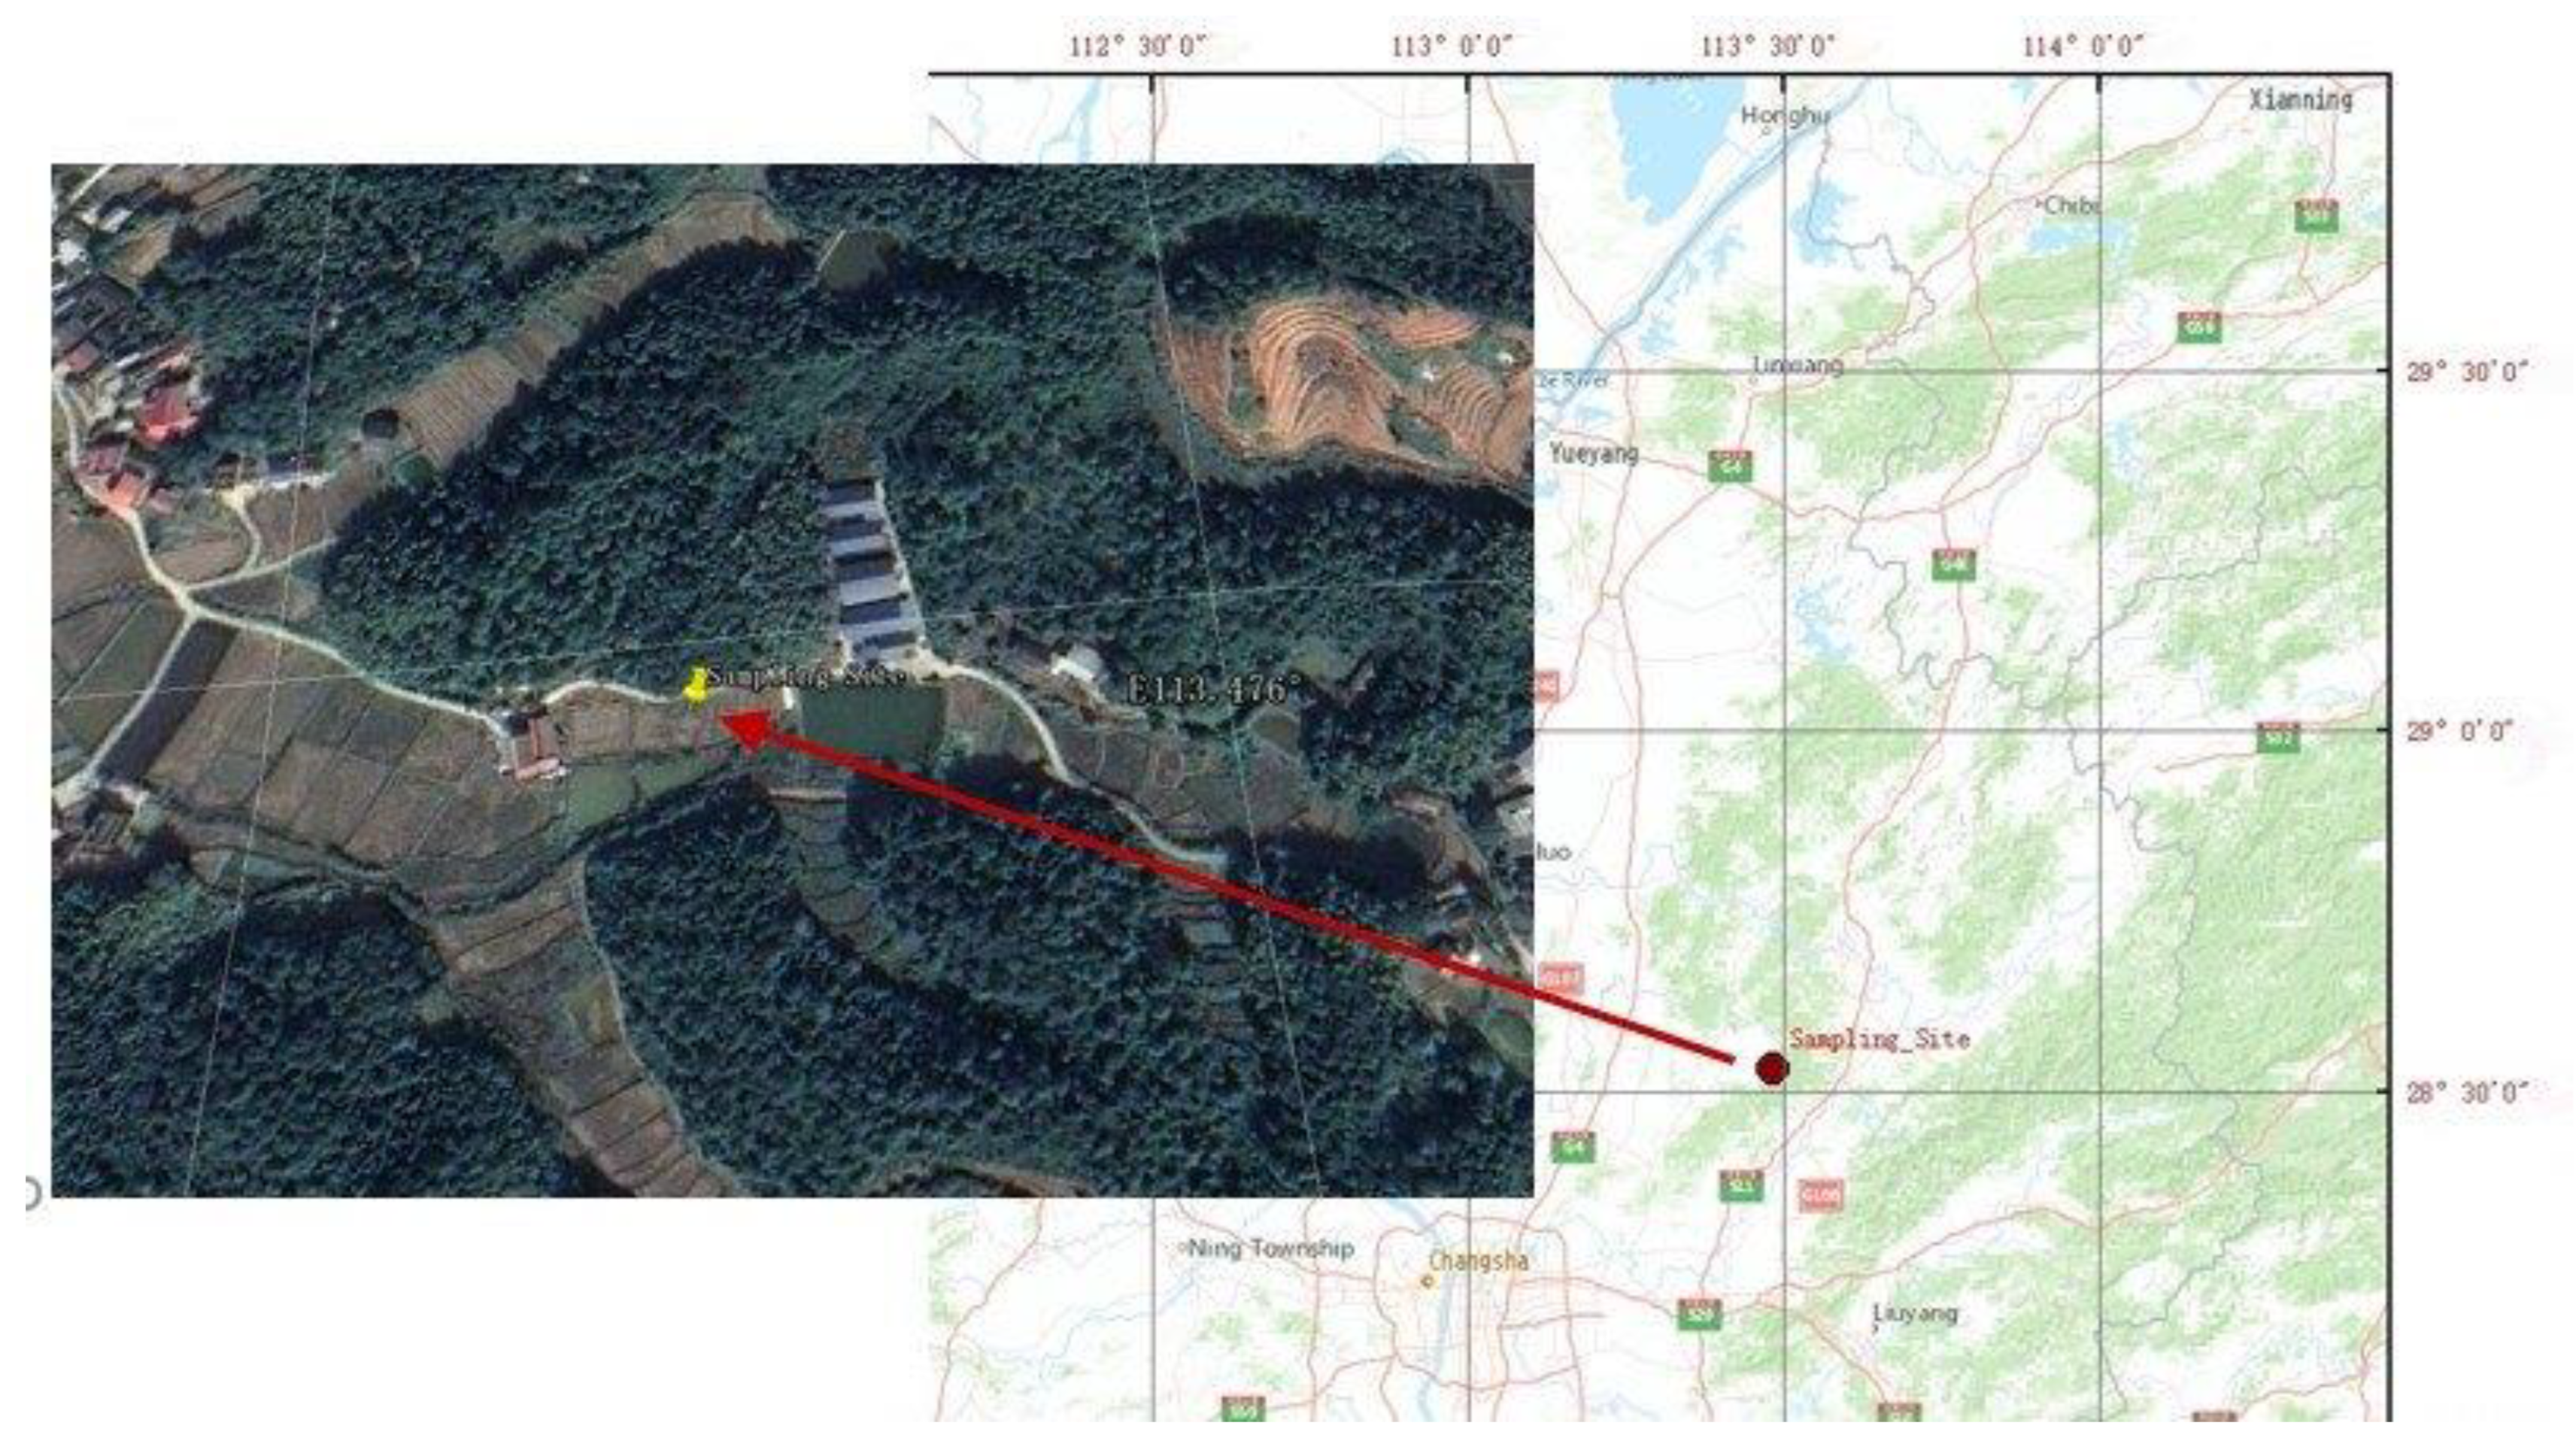
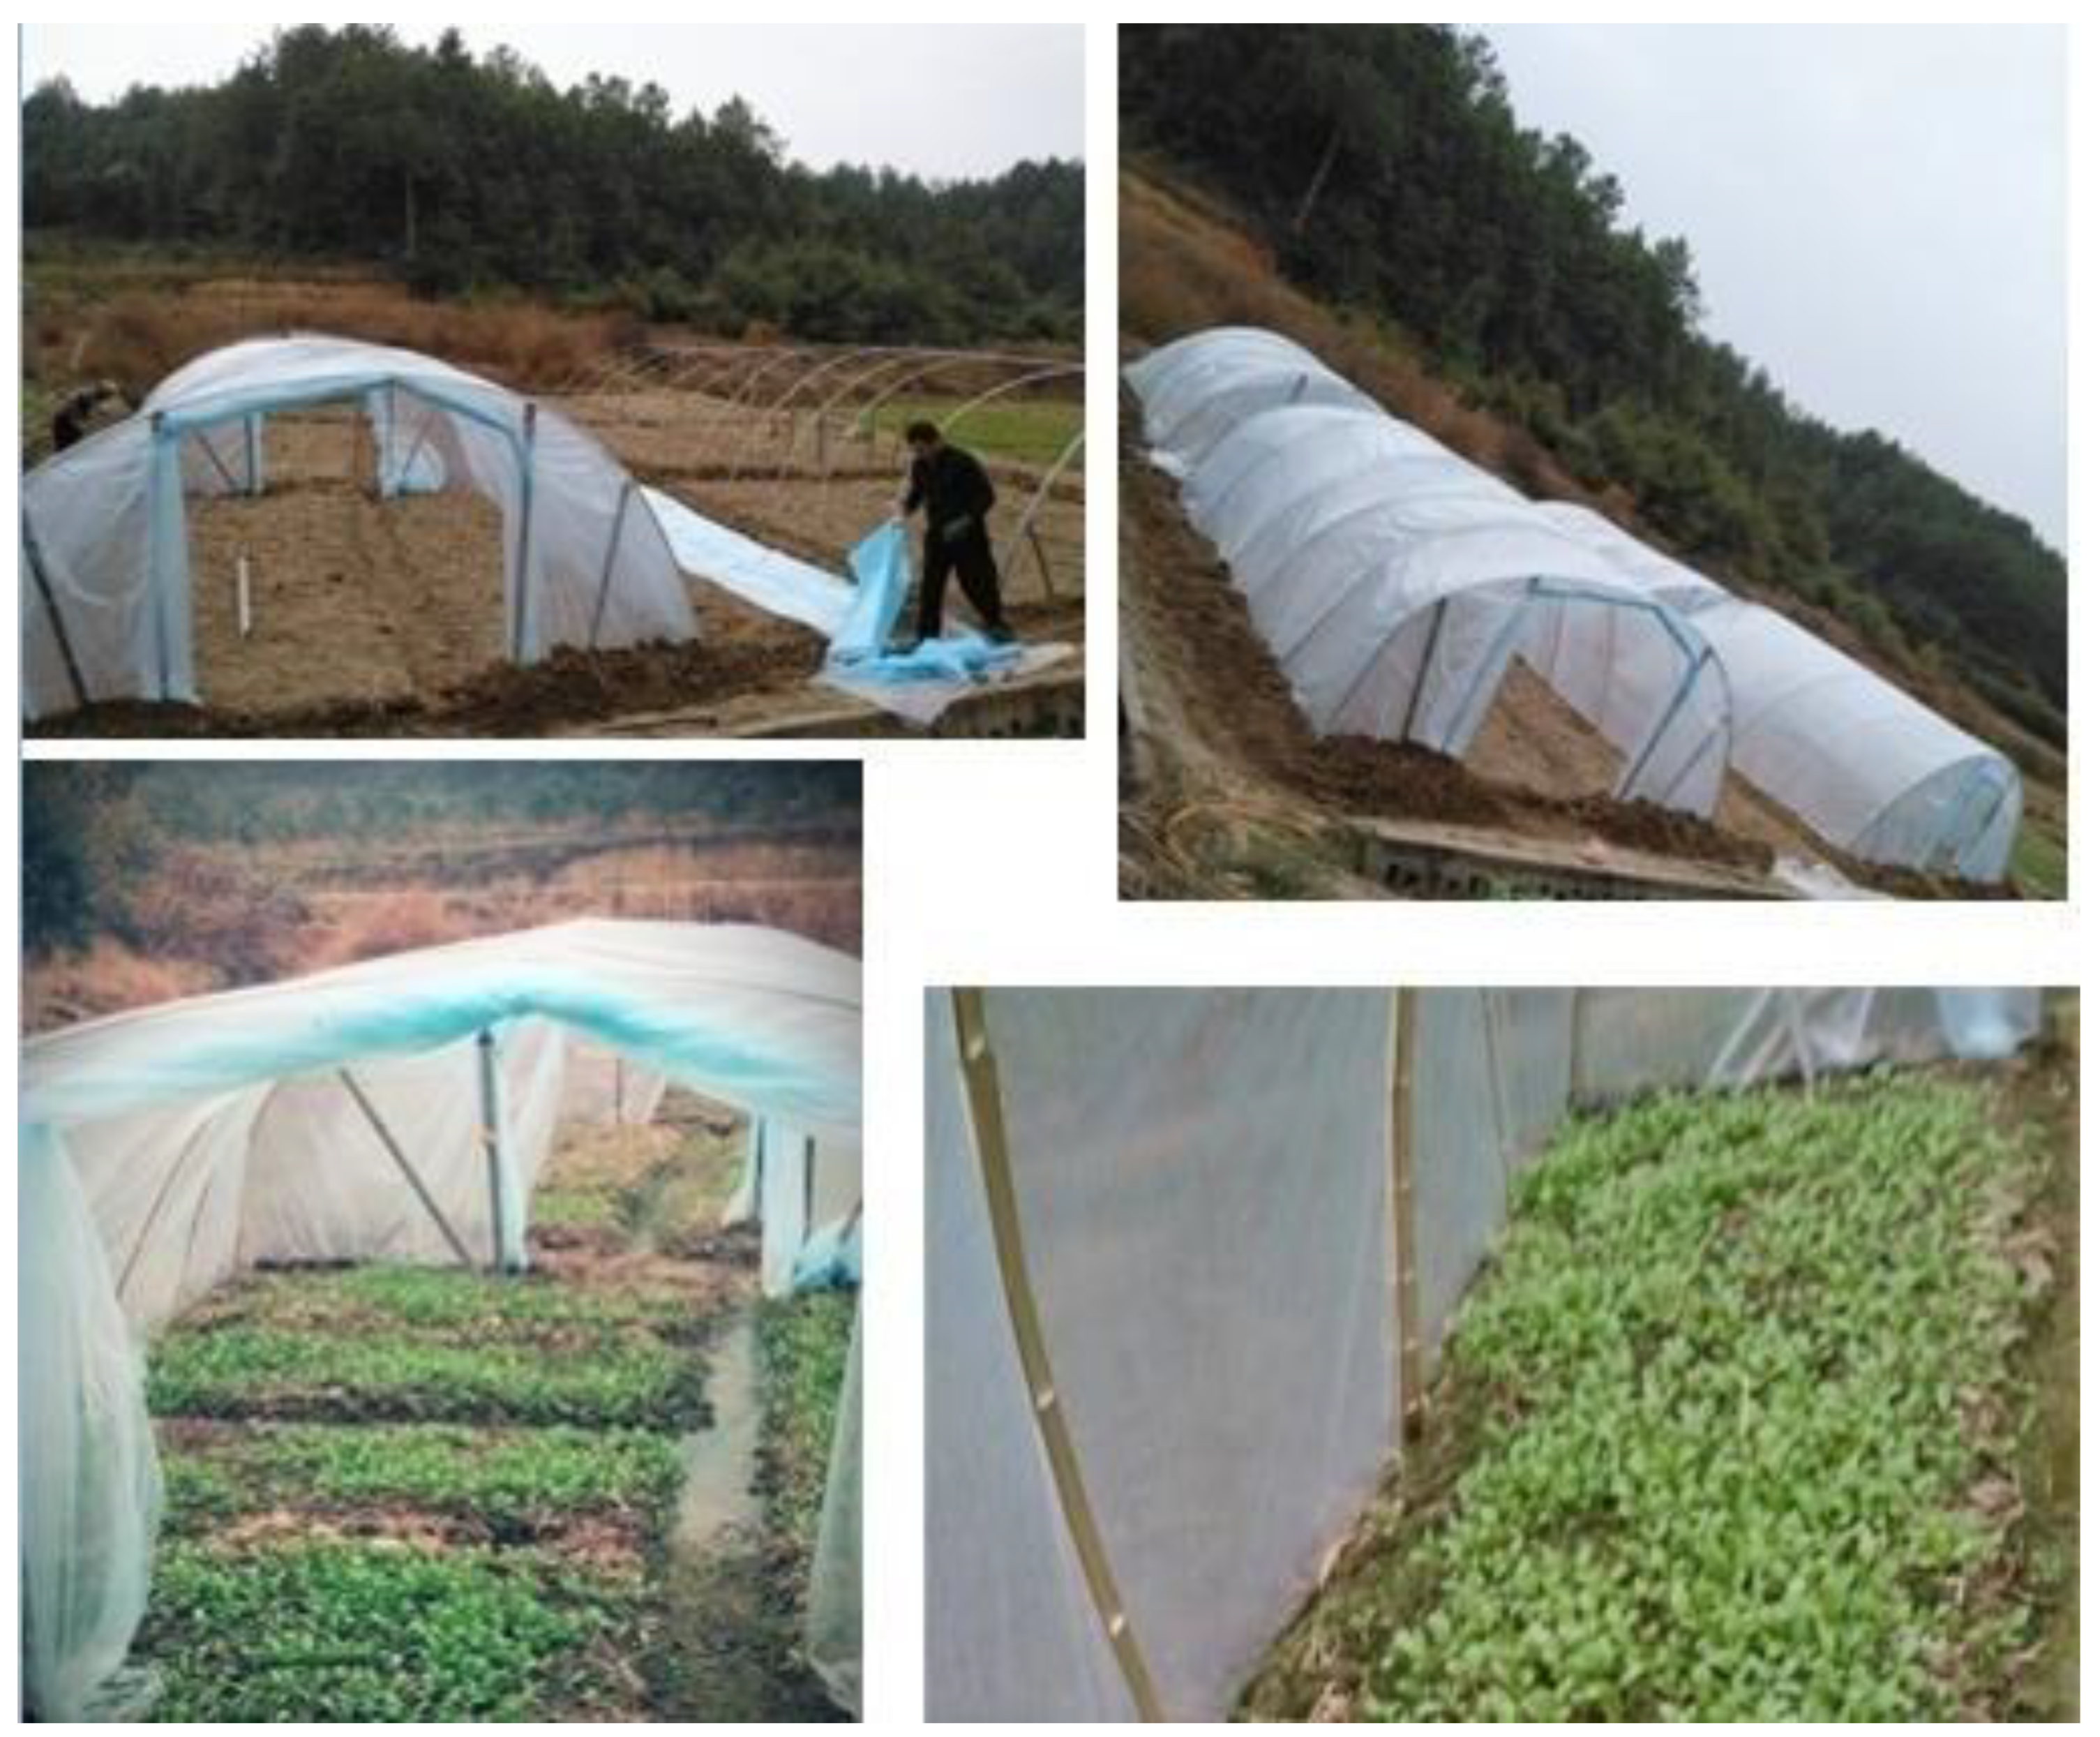
2.2. Measurement of InsecticideVOCs after Actual Application

The total amount of insecticide VOCs was detected by a pump suction photo ionization detection (PID) gas detector (RAE SYSTEMS, Sunnyvale, USA), PGM-7300 model, and the test instrument was selected according to the technical guideline for site soil and groundwater sampling of volatile organic compounds (HJ1019-2019) in China [32]. Before the test, the instrument has accepted the metrological calibration of a third-party testing institution and was within the validity period. The concentration detection limit of VOCs detector is 5000 mg/m3.
The test site (28°32.000′ N, 113°28.416′ E; Figure 1) is seated in Changsha, Hunan Province, China. Changsha is located in the temperate climate zone, with long summer and long winter. According to the data of China Meteorological Administration (CMA), the total rainfall in the sampling year is 1361.6 mm, and the annual average temperature is 17.2 °C [33]. The temperature changes greatly in spring, with more rain in early summer, higher temperature in autumn and less cold in winter [33]. The testing point is located in the hilly area, and there is no snowfall during the experiments. The author has monitored the concentration of VOCs in the environment as background benchmark before calculating the total amount of VOCs emitted during the application of insecticides in the greenhouse.
The PID portable gas detector was used to monitor the insecticide VOCs in the facility sheds. Four sheds (50 m3 for each) were set up for the experiment (Figure 2). Among them, only three sheds of pakchoi growing greenhouses were set as parallel test sites, and each of them was evenly sprayed of insecticide. The other pakchoi shed was set as an observation environment of comparison background. During the test, 1000 mg of one type of insecticide formulation shall be mixed with water and sprayed in a shed according to the proportion requirements (diluted 1000- to 3600-fold) in the product manual each time. The concentration peak of insecticide VOCs in the shed was monitored forone hour after the spraying. For the same batch test of each insecticide product, the data of three parallel samples were measured and recorded, respectively. The actual emission (AE) of insecticide VOCs were calculated based on the concentration peak (CP) of VOCs after applied the insecticide product, the shed volume (SV) used for the tests and the amount of formulation (AF) used (1000 mg for each sample). Each insecticide product was detected in triplicate for the above measurement, and the AE value was calculated by the formula as follows:
AE   =   CP × SV / AF
The AE value was recorded as a percentage form in order to analyze its correlation with the EP value. The tested samples involved in the experiment and their testing time were selected according to the greenhouse temperature monitored.
Figure 2. Setting of test sheds.
Agriculture 13 00066 g002
In 2020, a 72-round total of tests were conducted on nine types of insecticide products, and each test included 3 parallel samples, basically covering all seasons of the year. The temperature and relative humidity in the greenhouse were recorded during the test. Since the atmospheric pressure inside the shed was the same as that outside the shed during the test, the atmospheric pressures were recorded from the nearby automatic weather station. The statistics of characteristic values of meteorological elements (Table 2) show that the temperature in the shed during the test period was between 9–41 °C, with an average of 25.6 °C. The relative humidity was between 44.0–92.0%, with an average value of 74.8%. Since part of the 72-round tests were conducted in rainy days, part of the ambient humidity reached more than 80%. Moreover, air pressures were between 998.0–1021.0 hpa during the tests, with an average of 1007.5 hpa.

3. Results

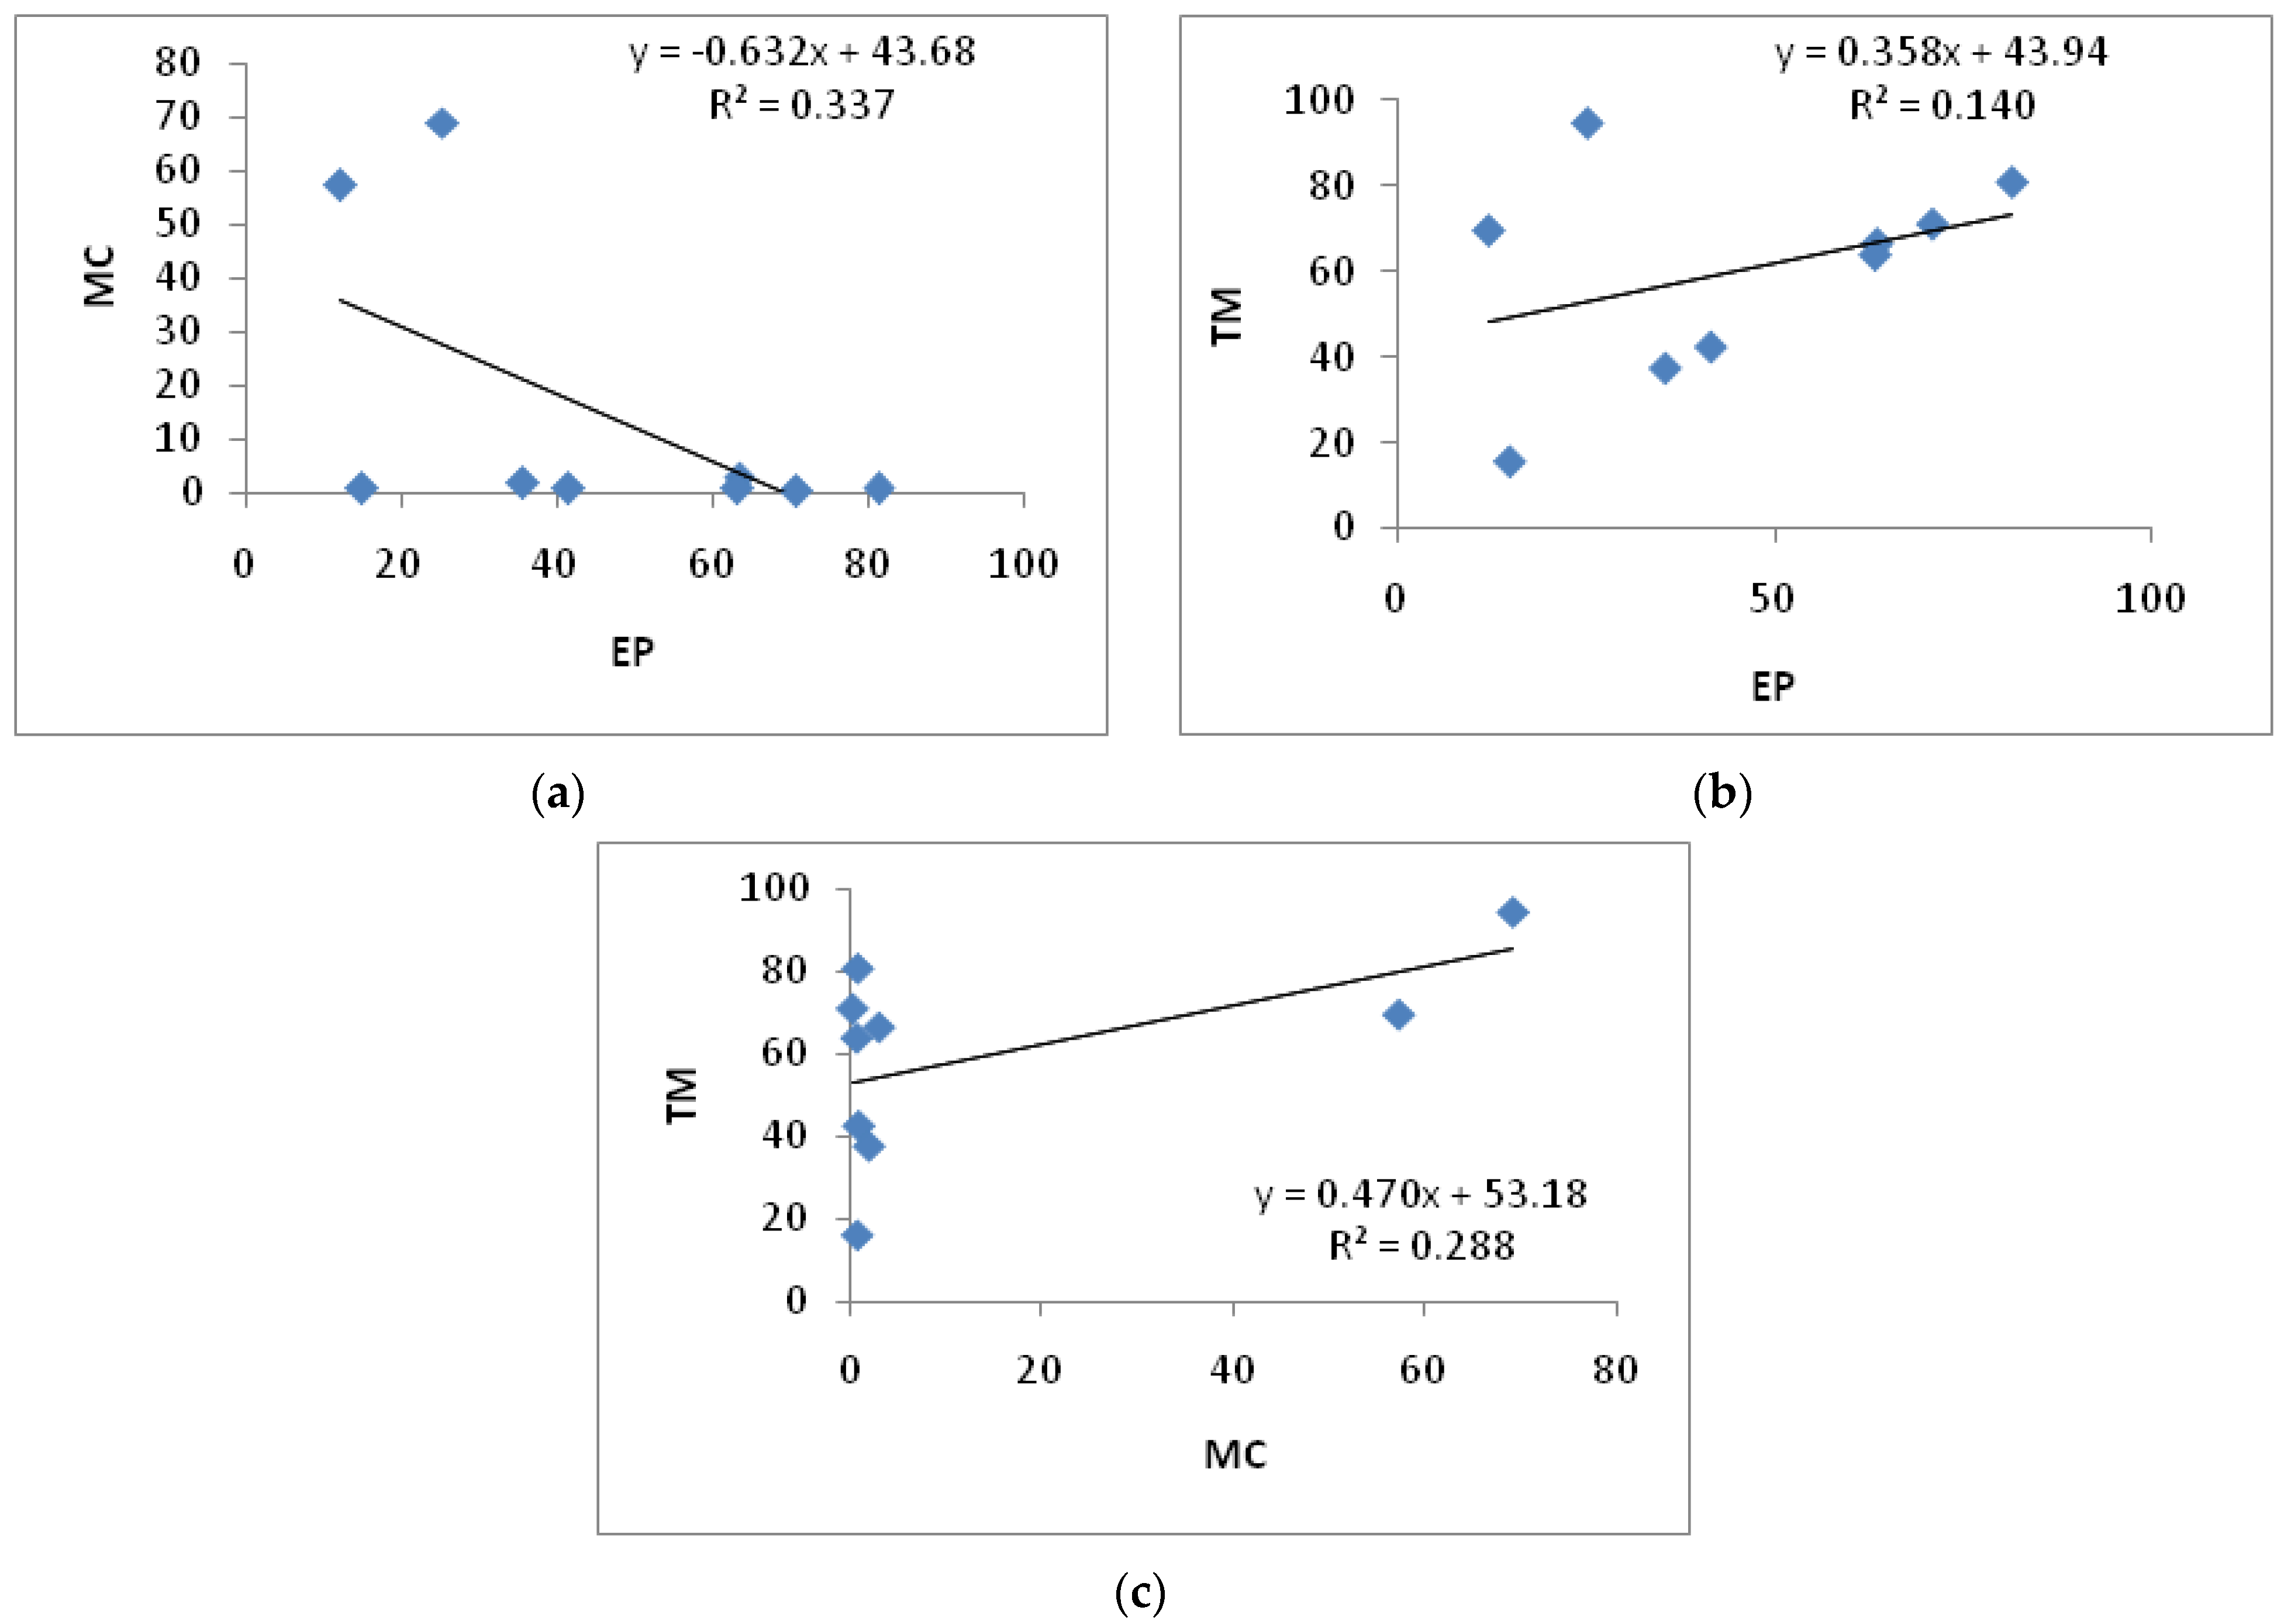
3.1. Correlations of EP, MC and TM Value of Different Formulations

The EP values of nine sampled products ranged from 12.30% to 81.30%, with a median of 41.59% and a mean of 45.41%. The distribution of EPs were shown in Figure 3. Among the samples, A0204 with the highest EP, i.e., 81.30%, was an abamectin EC formulation. There were four different types of abamectin EC formulations in the tested samples, with EP values ranging from 15.10% to 81.30%. It can be seen that the amount of VOCs emitted from the same kind of insecticide formulation or active ingredient may be very different. The EP values (%) of different formulations were sorted as follows: SL (70.8) > EC (50.37) > SC (37.76) >AS (35.59) > EW (25.33). The EPs, MCs and TMs of nine insecticides were analyzed according to the detection method in 2.1 and are shown in Table 3. The sequence of average MCs (%) of different formulations is EW (69.18) > SC (28.95) >AS (1.93) > EC (1.34) > SL (0.21), which in the range between 0.21% and 69.18%. In general, the SL and EC formulations had higher EP values in the samples, and EW and SC formulations had higher MC values.
In order to explore the correlations of EP, MC and TM value of different formulations, the author conducted research and comparison on the whole sample. The results were shown in Figure 4. There were no correlations either between EP and TM (Figure 4b), nor between MC and TM in the whole sample (Figure 4c). Their correlation coefficients (R2) were 0.140 and 0.288, respectively, which were both less than 0.3. However, there was a weak negative correlation between MC and EP (Figure 4a, R2 = 0.337, p < 0.01).

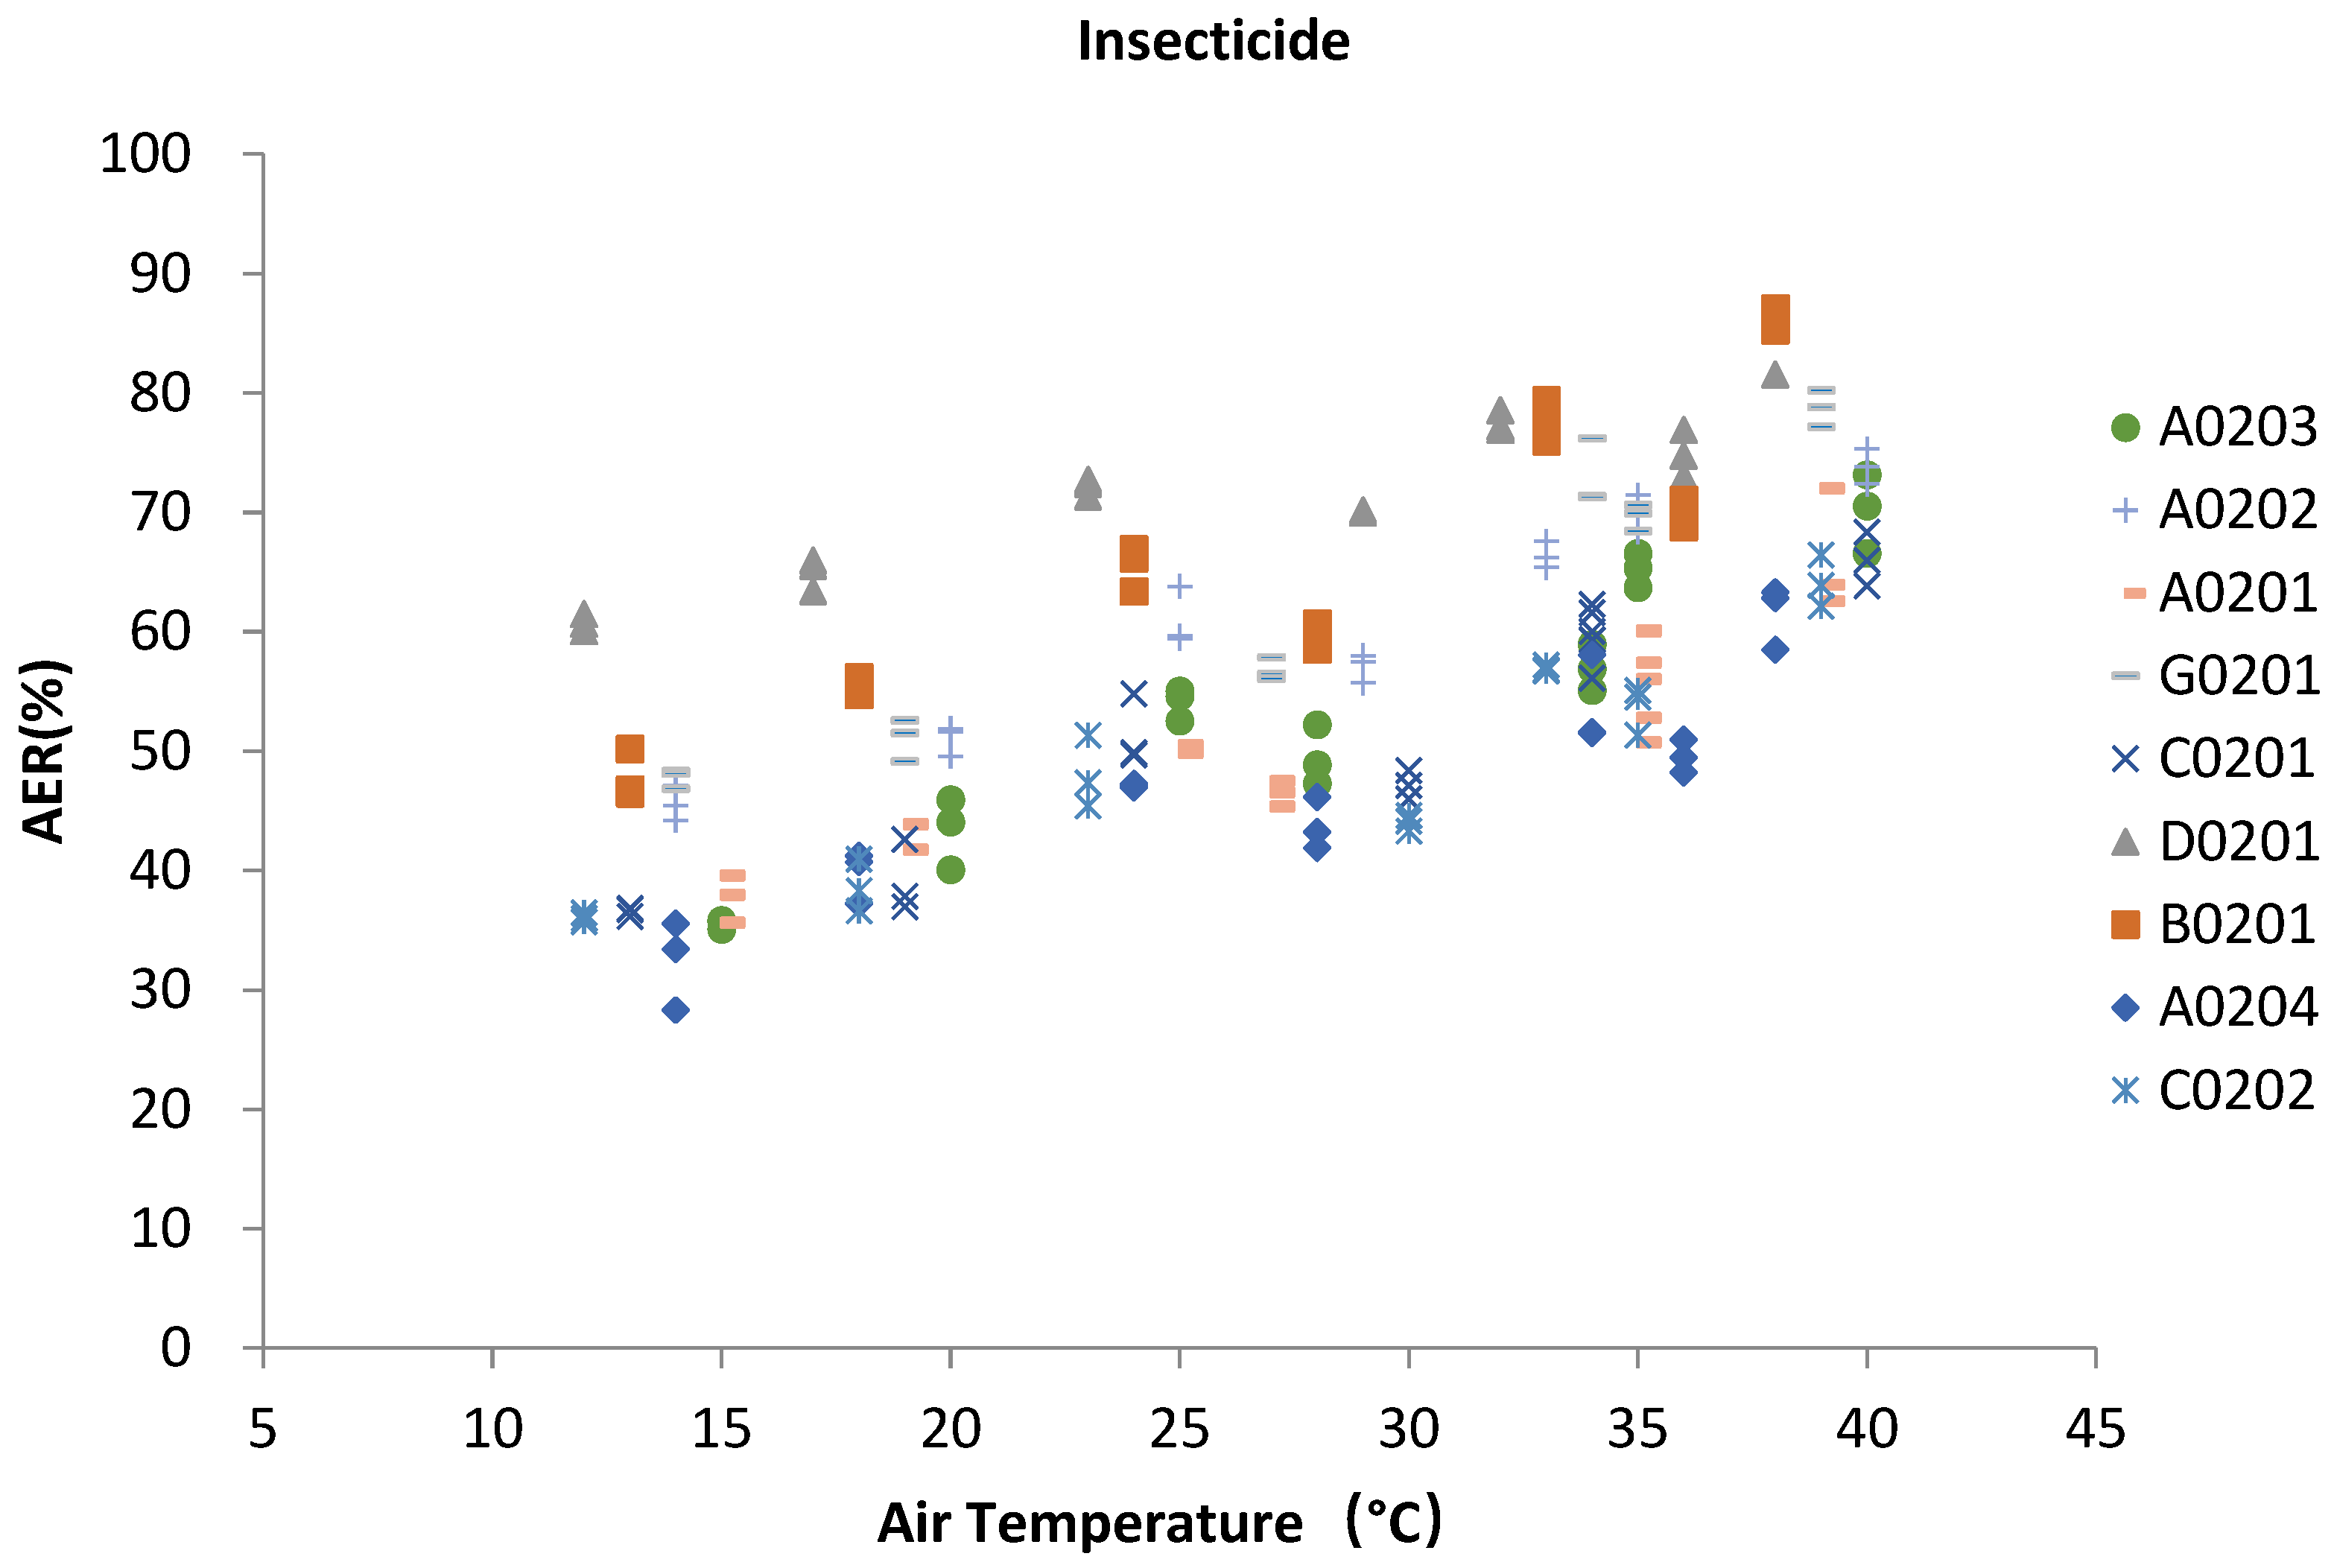
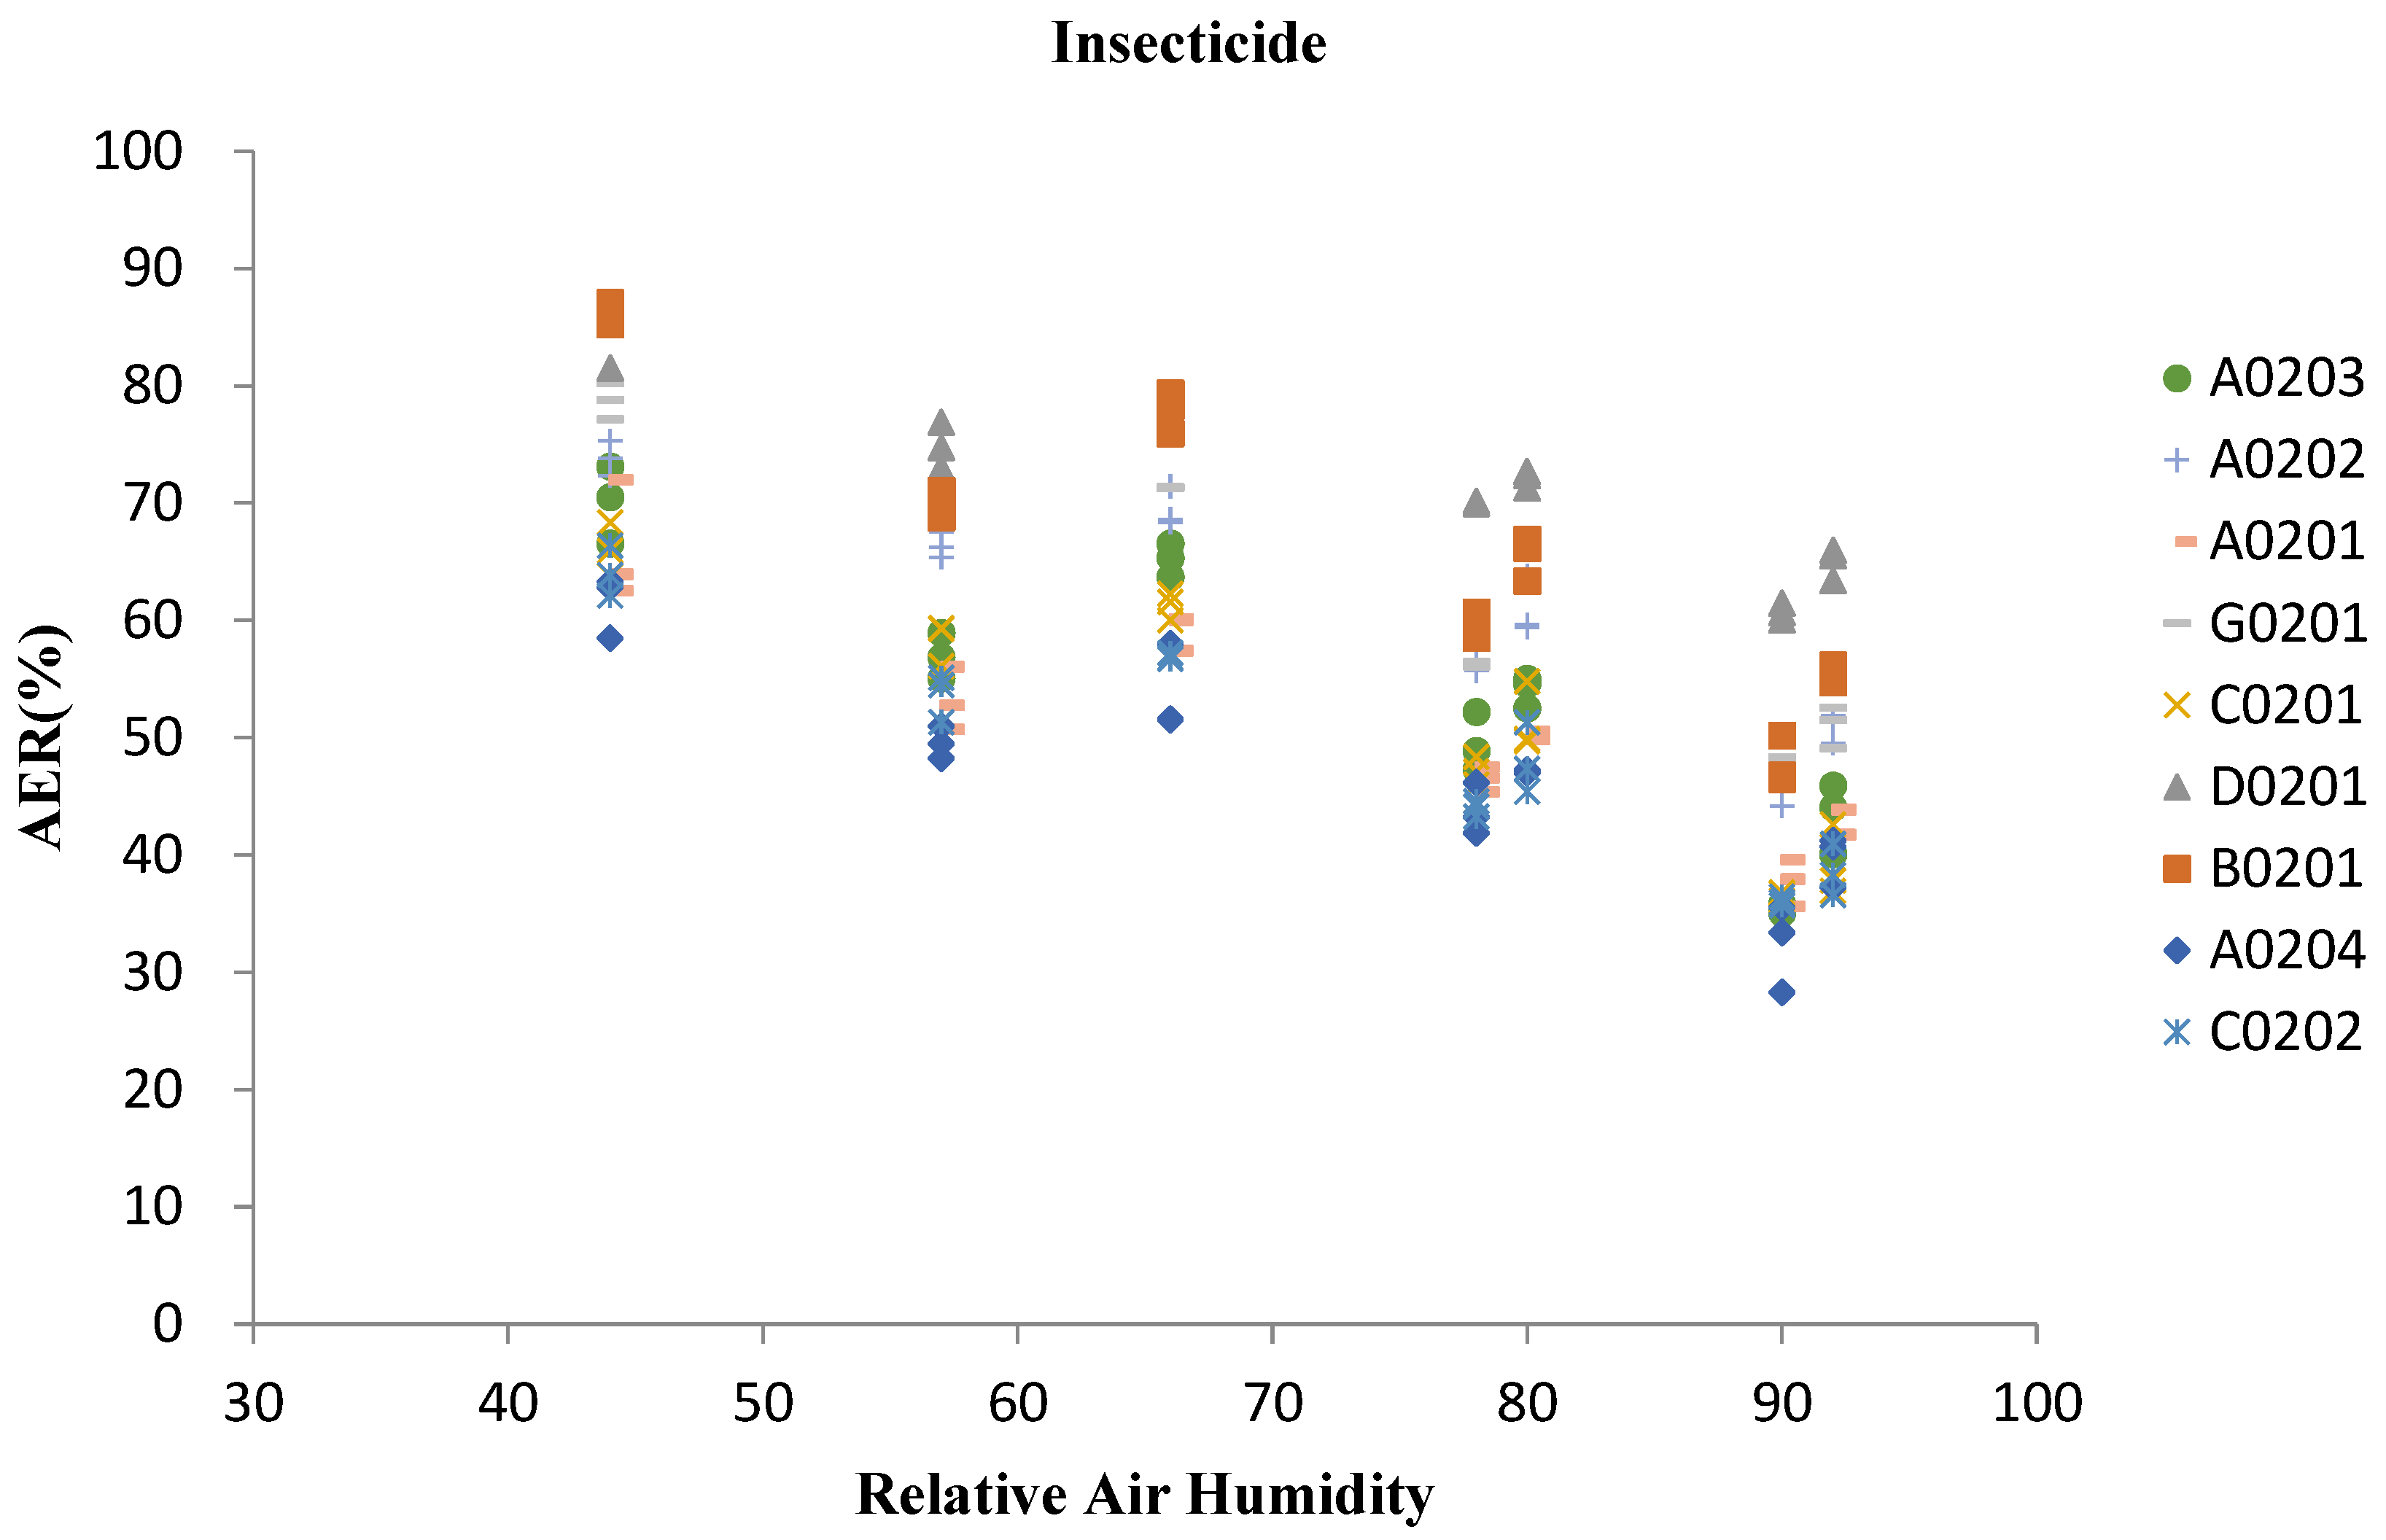
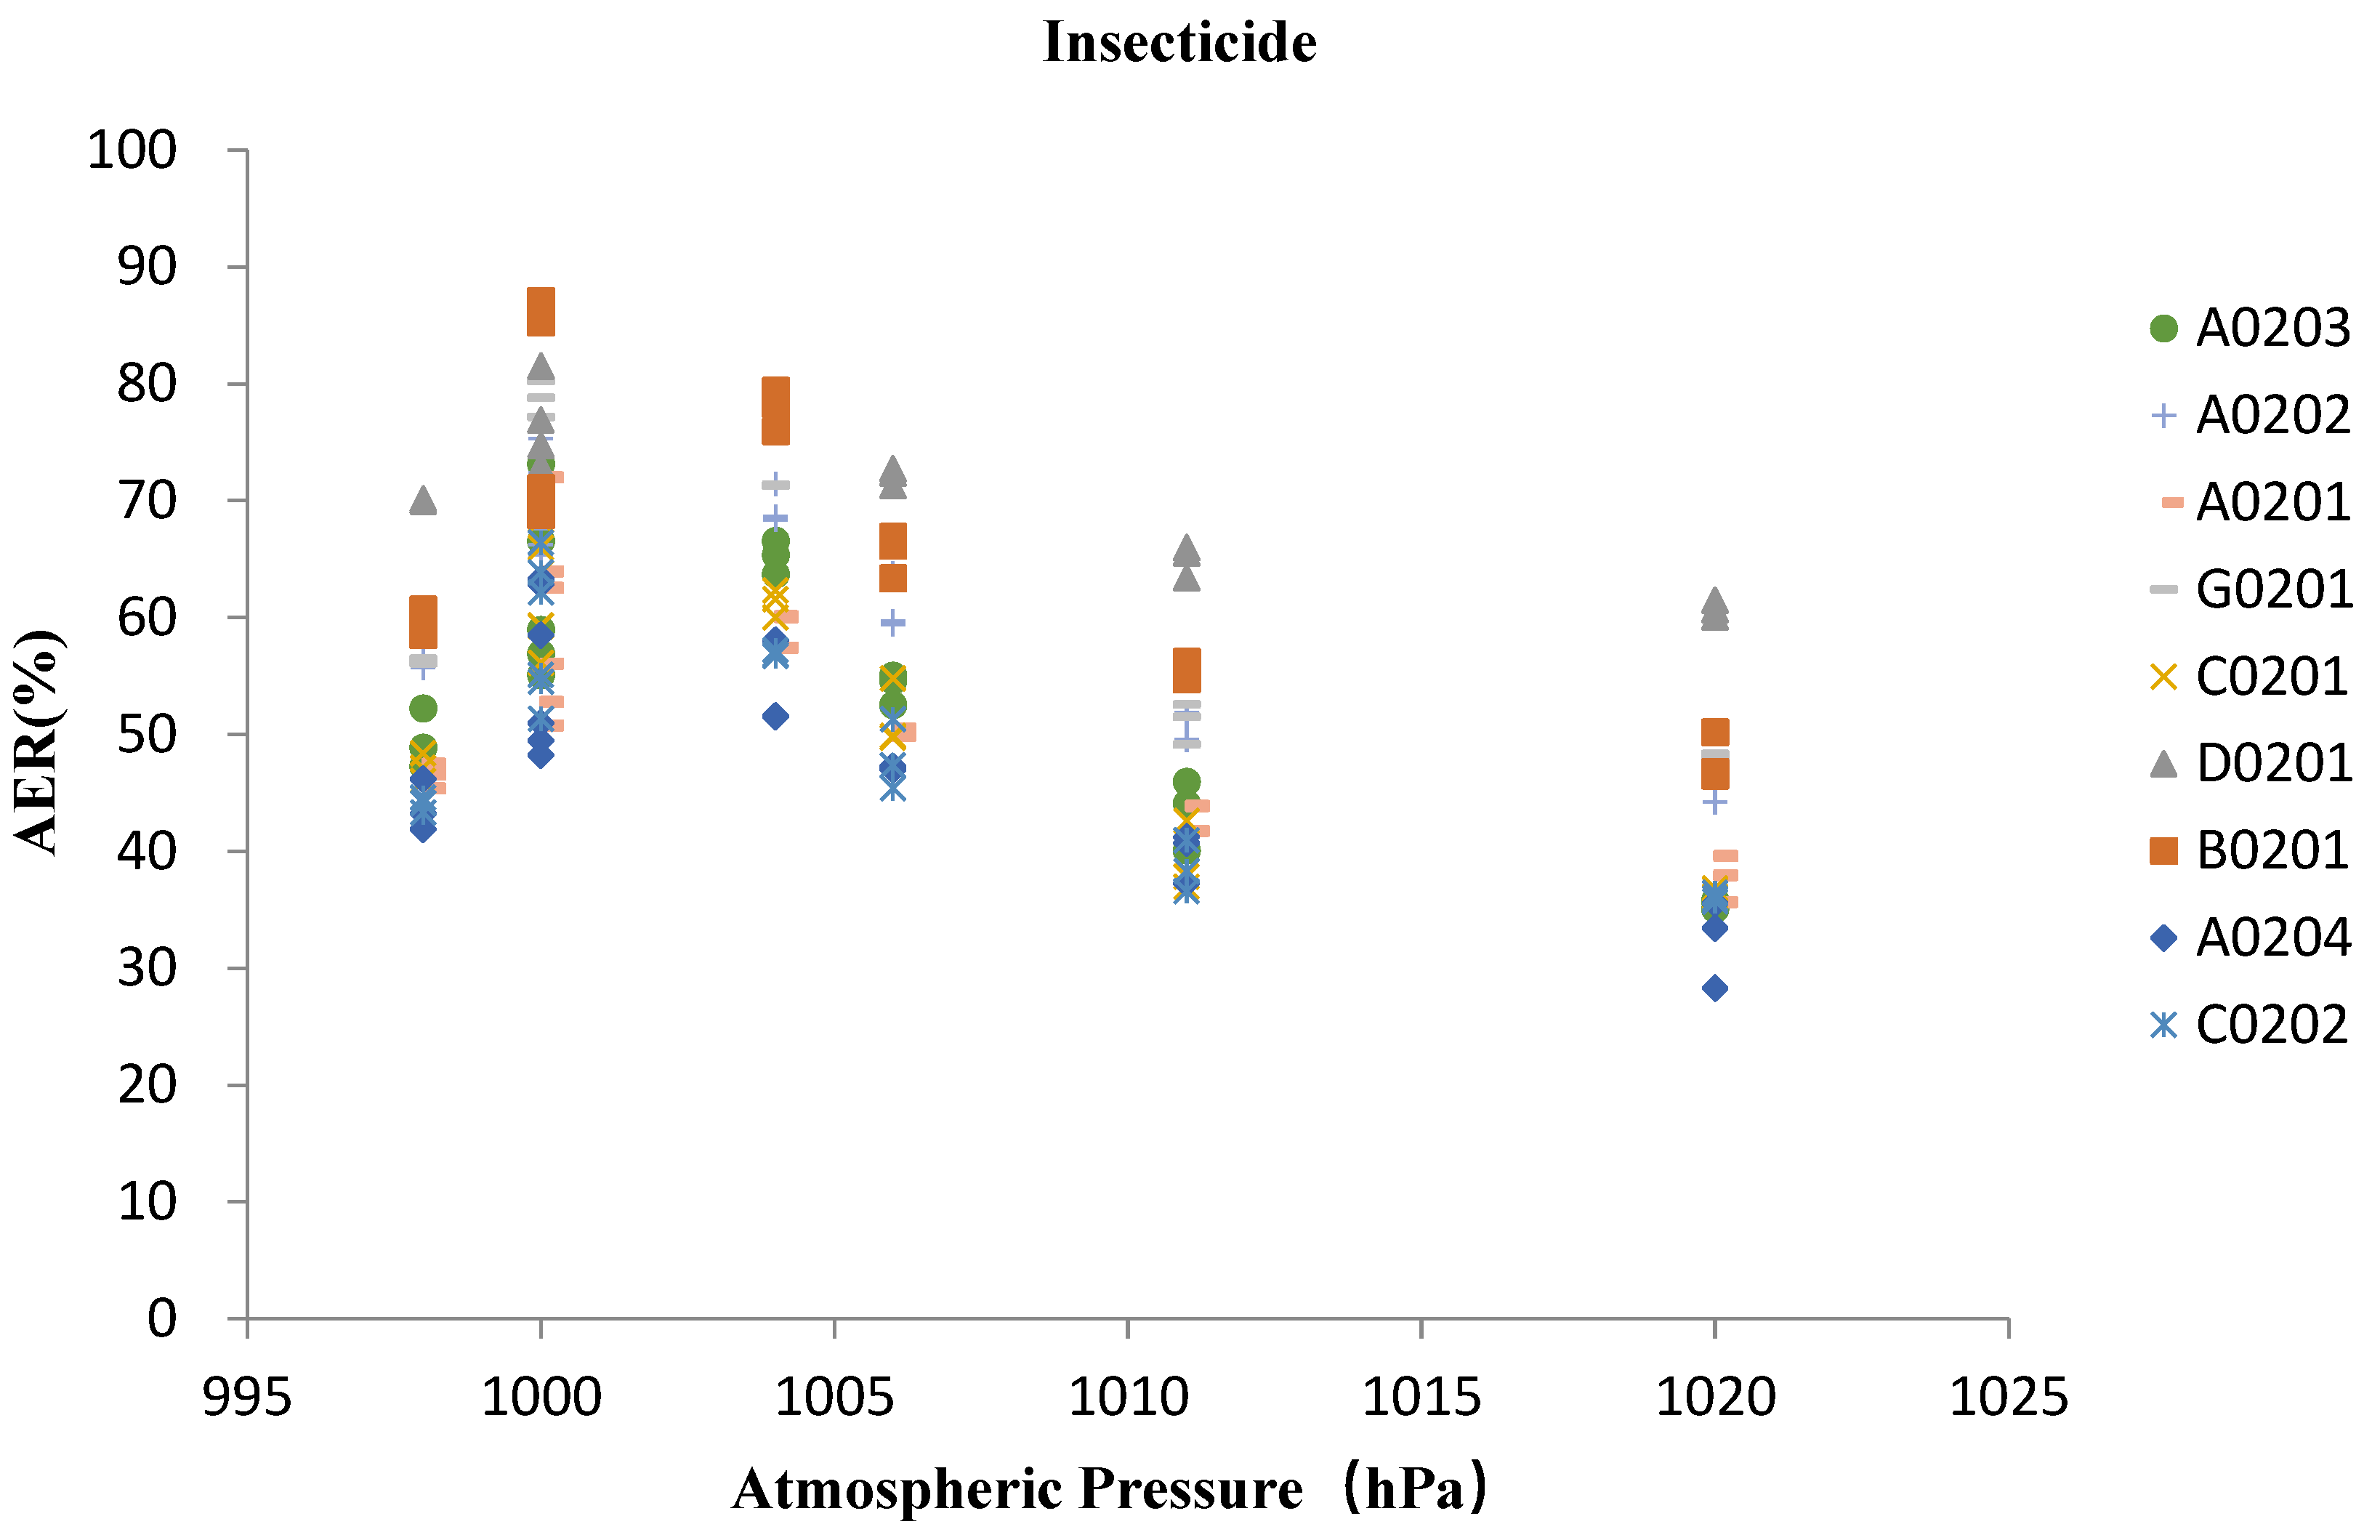
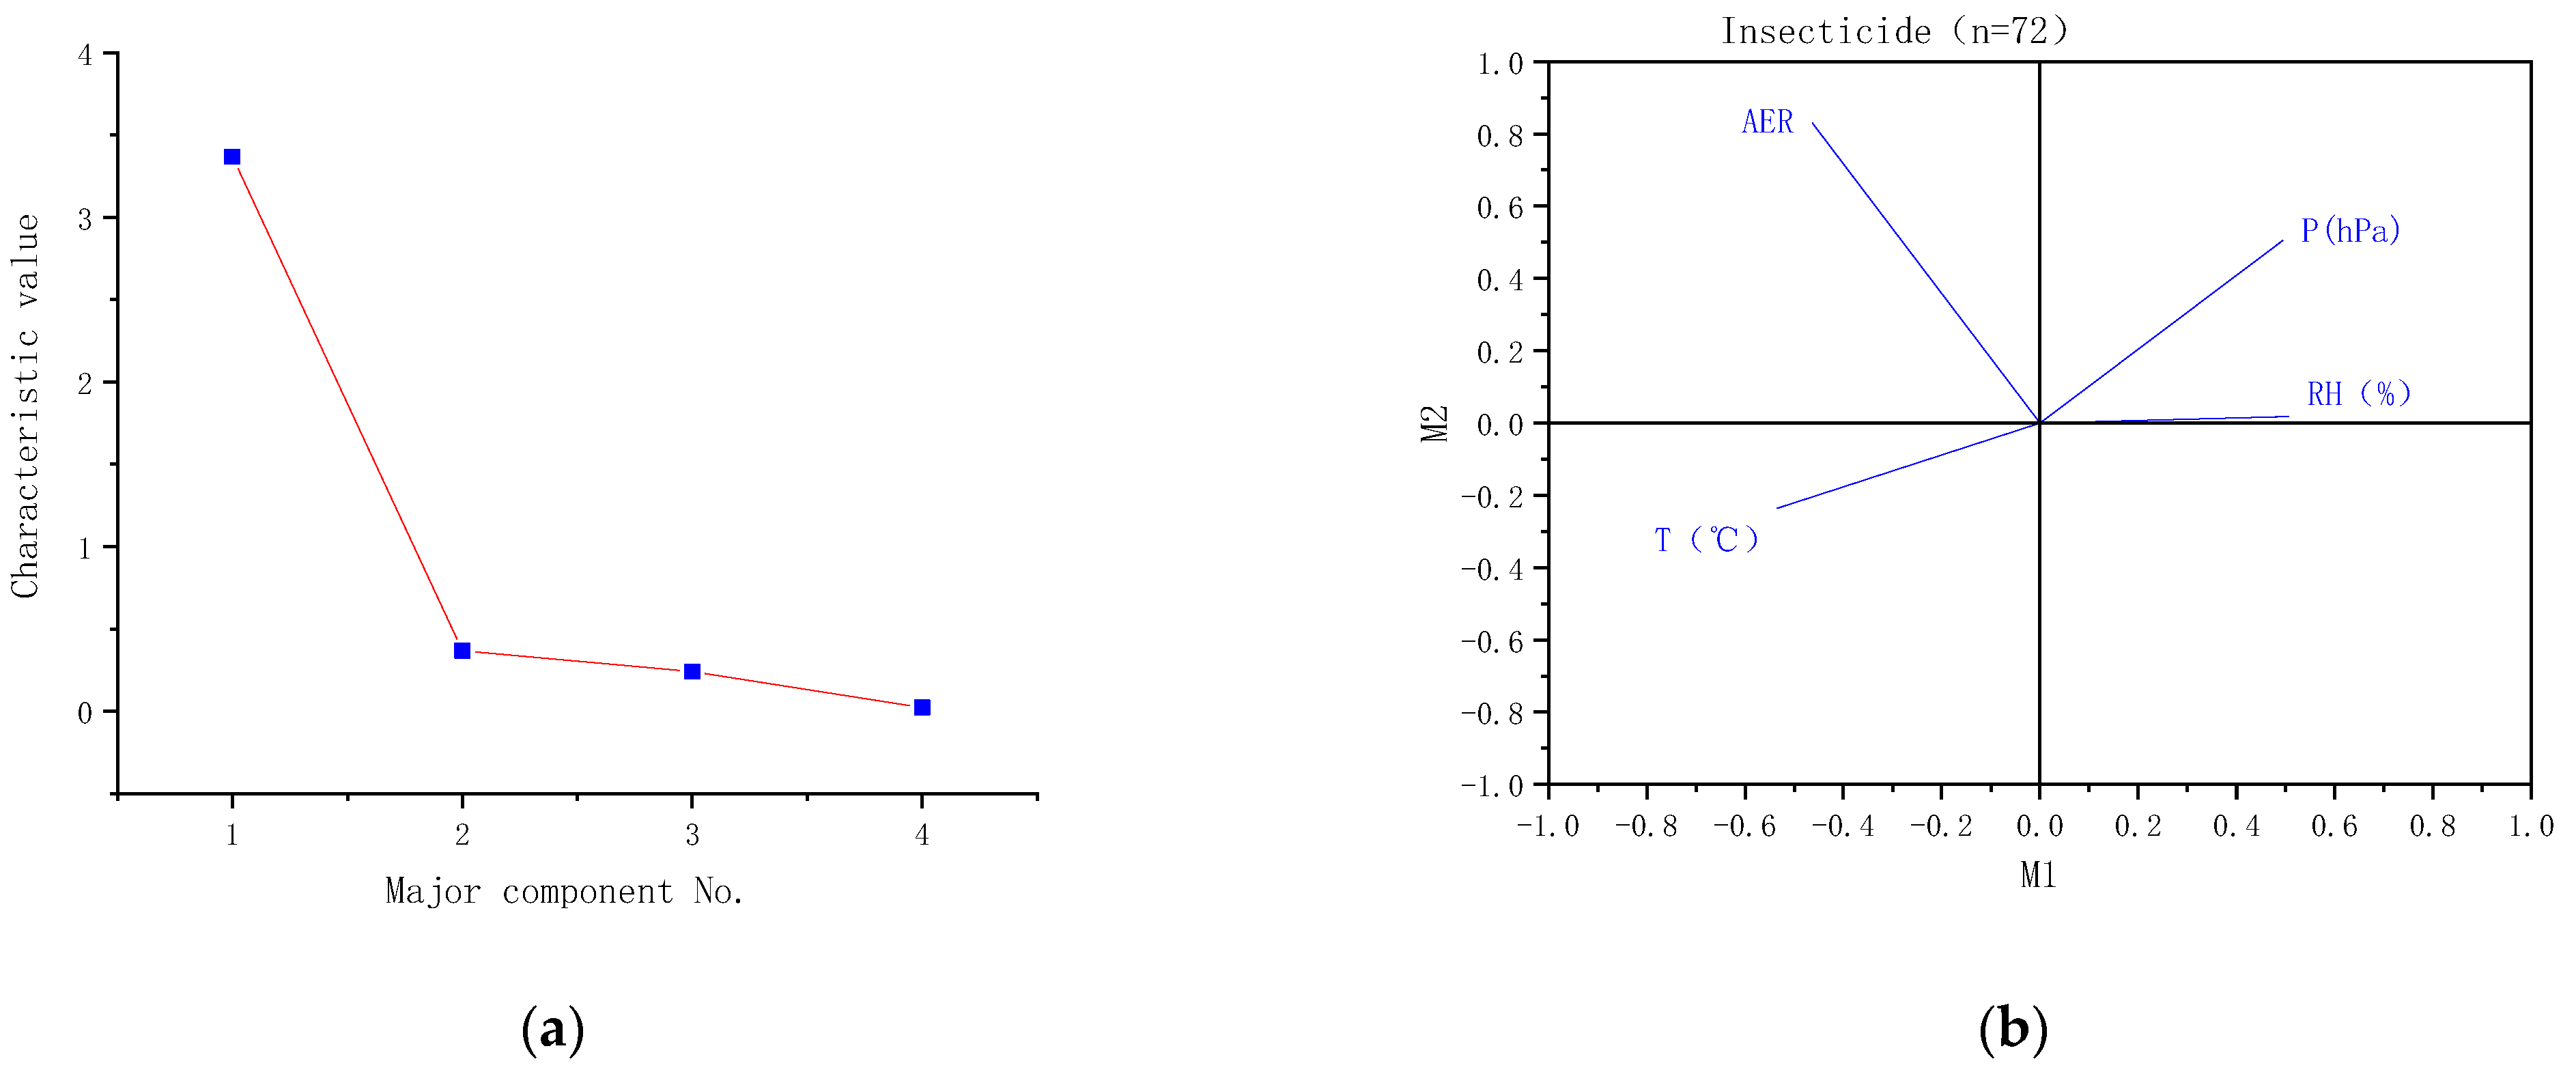
3.2. Correlations of Meteorological Factors on VOCs Emitted from Typical Insecticides

Table 4 demonstrated the actual emission ratio (AER, %) of total VOCs applied with typical insecticides, and it was calculated by the following formula:
A E R = AE / EP
According to the data analysis in Table 4, the average AER (%) of each formulation was ranked as: EW (72.12) > SL (63.03) > SC (58.69) > EC (52.95) >AS (48.76). Among all the insecticides selected in the test, the average, maximum and minimum AER (%) values of D0201 (EW, cypermethrin) were 72.12, 86.26 and 60.02 respectively, which were the highest among the nine products. The average, maximum and minimum AER (%) values of A0204 (EC, abamectin) were 46.82, 63.29 and 28.29 respectively, which were the lowest among the nine insecticide products.
The range of temperatures varied widely in the shed during the testing period. From the analysis of the AER values and temperature, the two showed a positive correlation in Figure 5. On the basis of correlation analysis between insecticide samples and atmospheric temperature, it can be seen that AERs of all insecticide varieties showeda significantly positive correlation with the change of air temperature. The correlation trends of AER and temperature of different insecticide products with the same formulationwere very similar. Compared with formulations, differentactive ingredients have little influence on the correlation trend. The AER of each testedproduct increased with the rising of temperature. Four EC formulations, that is A0201, A0202, A0203 and A0204, with abamectin as the active ingredient were specially selected for comparison. The AER values of these four products had a similar changing trend along with the temperatures. Among them, the AER of A0203 increased more sharply with the temperature change than the other three products.
Based on the analysis of AER and relative humidity of insecticide samples (Figure 6), it can be seen that the AER of all tested products has an evidently negative correlation with the change of air relative humidity, and the correlation between AER value and humidity of the same formulation has a similar trend. Compared with the formulation, the active ingredients have little impact on the correlation trend. According to the monitoring data results, the humidity was negatively correlated with the AER value. However, since the humidity and temperature in the test environment were also negatively correlated, it cannot be determined that the increase in humidity was the direct cause of the decrease in the AER value. Among the whole samples, except B0201, which decreases sharply with the increase of humidity, the change trend of AER and relative humidity of other eight products were very similar. And the similar trends appeared in all kinds of formulations. The trend curves of SC formulations ofC0201, C0202 and EC formulation ofA0204 were very close, but the AER value of the EC formulation was slightly lower than that of the other two SC formulations.
On the basis of correlation analysis between insecticide samples and atmospheric pressure (Figure 7), it can be seen that the AER of all types demonstrated a significant negative correlation with the change of atmospheric pressure, and the correlation between AER value and atmospheric pressure of the same formulation showed similar trend curves. Among all the samples, the AERs of B0201 were decreasing more sharply with the increase of atmospheric pressure than other samples, and the trend curves of SC formulations of C0201, C0202 and EC formulation of A0204 were drawn very close.
As the relativity among different meteorological elements existed to some extent, to describe the impact of a single element on insecticide volatilization with their respective correlations was difficult. Therefore, the principal component analysis method was used to probe the correlation between various factors in the test data. Principal component analysis was performed on the test elements according to the above classification (Figure 5, Figure 6 and Figure 7). According to the principal component analysis of various elements in different classifications(Figure 8a,b), the eigenvalue of the major principal component (M1) were all greater than three, while the eigenvalues of other principal components were all less than one, which indicates that M1has included most of the information of factors. The correlation statistics between M1 and AER exhibited a good linear correlation (Figure 8c). There were 72 samples in-all of insecticides in the test. The complex correlation coefficient R2 of the AER measured in the test with air temperature, relative humidity and air pressure were 0.568, 0.529 and 0.434 respectively. The M1 was linearly correlated with the AER, and R2 equals 0.719.

4. Discussion

Only a few studies have reported the determination of EP values for pesticides at home and abroad so far. According to the report of CDPR [34], the maximum EP threshold (%) of high-VOCs pesticide (taking abamectin as primary active ingredient) was 35% in the best-case scenario. According to the above standards, this study analyzed six high-VOCs insecticide products (A0202, A0203, A0204, C0202, B0201, and G0201) commonly used in China, and the results were listed in Table 3 and Table 4. The active ingredient with the highest proportion was abamectin, which implied that the high-VOCs pesticide products containing abamectin were commonly used in China, as in California in the US [34,35]. On the basis of limited reports or documents, the reports of Zhan and Zhang and CDPR were selected for comparison with this study [34,36]. Compared to the results of the present study, the EP mean values of abamectin as the active ingredient were 47.13 [36], 15.98 [34], and 50.37 in this study, respectively. The differences in the number of insecticide samples and the solvents used in different insecticide products may be responsible for the distinctions of EP values from the same active ingredient. Previous studies have verified that the solvent type used in different pesticide formulations is also the main reason affecting on the VOC emission potential [2,22,37]. In total, the EP values measured in this study are very close to other reported values in the case of the same and similar samples.
In order to explore the relationship between insecticide types and VOC volatilization potential, the correlations of MC, TM and EP values for different insecticides (n = 9) were compared, and the results are shown in Table 3 and Figure 4. For the whole sample, no significant correlations were presented between EP and TM, as well as MC and TM, with their correlation coefficients (R2) being less than 0.3. However, a weak negative correlation was presented between MC and EP (R2 = 0.337, p < 0.01).
Summarizing the whole study, the EP values of nine sampled products ranged from 12.30% to 81.30%, the mean of AE values ranged from 6.32% to 44.63%, and the mean of AER values ranged from 46.82% to 72.12%. The data demonstrate that (1) the actual emission during agricultural application of the insecticide products was evidently lower than its emission potential; (2) the volatilization proportions of different insecticide types in actual application varied greatly.
As seen from different insecticide formulations, the mean AER values of insecticide products conformed to the following sequence: EW (72.12%) > SL (63.03%) > SC (58.69%) > EC (52.95%) > AS (48.76%). The maximum and minimum AERs followed the same sequence with the mean values. However, the sequences of mean, maximum and minimum AERs were differentiated in different insecticide types. The A0204 is an avermectin EC formulation, with the lowest mean, maximum and minimum value among all types of insecticide. However, the A0204 also has a highest EP value (81.30%) in all the samples, so the actual emission amount of this type was still large. The D0201 is a β-Cyfluthrin EW formulation, with the highest mean and minimum AER value among all types of insecticide, while the highest maximum value (87.07%) belongs to C0201, a thiamethoxam SC formulation. We can find that (1) the volatilization proportions of different formulations varied greatly, and among them, EW formulation has the highest value of mean AER and AS formulation has the lowest value of mean AER; (2) the AER value of different insecticide type varied in different trend curves, e.g., the AER of C0201 changed sharply, while that of D0201 varied more gently.
The correlation between the complex factor of meteorological elements and the AER exhibited a good linear correlation (Figure 8), and the M1 was linearly correlated with the AER values (R2 = 0.719). The complex correlation coefficient (R2) of the AER measured in the test with air temperature, relative humidity and air pressure were 0.568, 0.529 and 0.434 respectively. The analysis demonstrates that (1) the temperature element has the most significant correlation with the AER trend among the composite meteorological factors; (2) the AER trend curve of different insecticide types in actual application varied greatly due to their differentiated degrees of affection by meteorological factors.
During the greenhouse tests, the meteorological elements during the application of insecticide products were recorded. Through the correlation analysis of the meteorological factors during the test and the measured insecticide AER value, it was found that the correlation between AER and each meteorological element was consistent, whether the statistics were made according to overall sample, formulation classification, or each sample separately. The AER values were positively correlated with the temperature, and negatively correlated with the relative humidity and air pressure. As mentioned above, the analysis showed that the temperature had the strongest correlation with the AER, so it had the greatest impact on VOC volatilization during insecticide application. Table 5 shows the actual volatilization characteristics of insecticides under different temperature conditions during the greenhouse test. It can be seen that the average value of AER is 0.66 when the temperature is above 25 °C, which is about 40% higher than 0.47 when the temperature is below 25 °C. The minimum AER values under the two temperature ranges were 0.39 and 0.21 respectively, and the former is about 83% higher than the latter. In high temperature conditions, the AER during insecticide application increases significantly. Considering temperature as a meteorological element that can be obtained in time when insecticides are applied, it is recommended to avoid high-temperature-application as much as possible in actual agricultural production, which can effectively reduce the pollution of atmospheric environment caused by pesticide application. Choosing morning or evening as application time can be an effective response to reduce environmental pollution caused by insecticide application.
To our knowledge, this is the first research about the agricultural insecticide use and VOC emissions of commercial pesticide products in China based on a laboratory test and a greenhouse test. The results from this study have demonstrated that a large amount of VOCs would be discharged during the production and use of commercial pesticides. This information provides some useful guidance for developing effective measures to reduce pesticide VOC emission, and further cutting down its contribution to O3 and PM2.5 formation.

5. Conclusions

Based on the laboratory and greenhouse experiments, this study evaluates the volatilization of VOCs in the actual application of insecticides. Considering the total amount control of insecticide VOCs, it provides a technical reference for the establishment of corresponding emission characterization and qualifying the amounts of VOC emissions during pesticide application. The VOCs emission potential coefficients of nine insecticides were quantitatively determined and the actual volatilization tests were conducted in the greenhouse to determine the main influence factors between the emission potential and the actual emission. The conclusions were as follows:
(1)
The EPs of nine insecticide samples ranged from 12.30% to 81.30%, with a median of 41.59% and a mean of 45.41%.There were no correlations either between EP and TM, nor between MC and TM in the whole sample analysis, but there was a weak positive correlation between MC and EP;
(2)
Compared the actual emission and potential emission of insecticide VOCs, the average AER (%) of each formulation was ranked as: EW (72.12) > SL (63.03) > SC (58.69) > EC (52.95) >AS (48.76); and
(3)
Analyzing the emission characteristics of insecticide VOCs during application and the influence of formulations and meteorological factors by principal component analysis, it was found that AER value was significantly positively correlated with temperature change, at the same time, significantly negatively correlated with relative humidity and atmospheric pressure. Among all the meteorological elements, the temperature had the strongest correlation with the AER.
In addition, the results of the present study indicate that numerous quantitative tests of pesticide use may be, in some cases, a possible adjunct to the emission inventory of pesticide VOC emissions.

Author Contributions

Conceptualization, G.W. and J.Y.; methodology, G.W., W.L. (Wenqi Long) and J.Y.; experiment, J.Y., W.L. (Wenqi Long) and C.J.; formal analysis, W.L. (Wangrong Liu) and J.Y.; writing—original draft preparation, C.J., W.L. (Wangrong Liu) and J.Y.; writing—review and editing, J.Y. and G.W. All authors have read and agreed to the published version of the manuscript.

Funding

The research was funded by National Natural Science Foundation of China (NSFC) Joint Fund for Regional Innovation and Development Key Support Project (No. U20A2086).

Institutional Review Board Statement

Not applicable.

Informed Consent Statement

Not applicable.

Data Availability Statement

The data presented in this study are available on request from the corresponding author.

Acknowledgments

We thank the reviewers for their valuable comments and recommendations.

Conflicts of Interest

The authors declare no conflict of interest.

References

  1. Caron-Beaudoin, É.; Whyte, K.P.; Bouchard, M.F.; Chevrier, J.; Haddad, S.; Copes, R.; Frohlich, K.L.; Dokkie, D.; Juul, S.; Bouchard, M.; et al. Volatile organic compounds (VOCs) in indoor air and tap water samples in residences of pregnant women living in an area of unconventional natural gas operations: Findings from the EXPERIVA study. Sci. Total Environ. 2022, 805, 150242. [Google Scholar] [CrossRef] [PubMed]
  2. Kumar, A.; Howard, C.J.; Derrick, D.; Malkina, I.L.; Mitloehner, F.M.; Kleeman, M.J.; Alaimo, C.P.; Flocchini, R.G.; Green, P.G. Determination of Volatile Organic Compound Emissions and Ozone Formation from Spraying Solvent-based Pesticides. J. Environ. Qual. 2011, 40, 1423–1431. [Google Scholar] [CrossRef] [PubMed] [Green Version]
  3. Gao, G.; Zhang, X.; Yan, Z.; Cheng, Y.; Li, H.; Xu, G. Monitoring Volatile Organic Compounds in Different Pear Cultivars during Storage Using HS-SPME with GC-MS. Foods 2022, 11, 3778. [Google Scholar] [CrossRef] [PubMed]
  4. Mo, Z.; Lu, S.; Shao, M. Volatile Organic Compound (VOC) Emissions and Health Risk Assessment in Paint and Coatings Industry in the Yangtze River Delta, China. Environ. Pollut. 2021, 269, 115740. [Google Scholar] [CrossRef]
  5. Liu, G.; Sun, S.; Zou, C.; Wang, B.; Wu, L.; Mao, H. Air pollutant emissions from on-road vehicles and their control in Inner Mongolia, China. Energy 2022, 238, 121724. [Google Scholar] [CrossRef]
  6. Pusede, S.E.; Cohen, R.C. On the observed response of ozone to NOx and VOC reactivity reductions in San Joaquin Valley California 1995-present. Atmos. Chem. Phys. 2012, 31, 311–315. [Google Scholar]
  7. Sarigiannis, D.A.; Karakitsios, S.P.; Gotti, A.; Liakos, I.L.; Katsoyiannis, A. Exposure to major volatile organic compounds and carbonyls in European indoor environments and associated health risk. Environ. Int. 2011, 37, 743–765. [Google Scholar] [CrossRef]
  8. Yang, K.; Wang, C.; Xue, S.; Li, W.; Liu, J.; Li, L. The identification, health risks and olfactory effects assessment of VOCs released from the wastewater storage tank in a pesticide plant. Ecotoxicol. Environ. Saf. 2019, 184, 109665. [Google Scholar] [CrossRef]
  9. Zheng, H.; Kong, S.; Chen, N.; Niu, Z.; Zhang, Y.; Jiang, S.; Yan, Y.; Qi, S. Source apportionment of volatile organic compounds: Implications to reactivity, ozone formation, and secondary organic aerosol potential. Atmos. Res. 2021, 249, 105344. [Google Scholar] [CrossRef]
  10. Chen, Y.; Su, W.; Xing, C.; Yin, H.; Lin, H.; Zhang, C.; Liu, H.; Hu, Q.; Liu, C. Kilometer-level glyoxal retrieval via satellite for anthropogenic volatile organic compound emission source and secondary organic aerosol formation identification. Remote Sens. Environ. 2022, 270, 112852. [Google Scholar] [CrossRef]
  11. Gkatzelis, G.I.; Coggon, M.M.; McDonald, B.C.; Peischl, J.; Gilman, J.B.; Aikin, K.C.; Robinson, M.A.; Canonaco, F.; Prevot, A.S.H.; Trainer, M.; et al. Observations Confirm that Volatile Chemical Products Are a Major Source of Petrochemical Emissions in U.S. Cities. Environ. Sci. Technol. 2021, 55, 4332–4343. [Google Scholar] [CrossRef] [PubMed]
  12. Wu, K.; Yang, X.; Chen, D.; Gu, S.; Lu, Y.; Jiang, Q.; Wang, K.; Ou, Y.; Qian, Y.; Shao, P.; et al. Estimation of biogenic VOC emissions and their corresponding impact on ozone and secondary organic aerosol formation in China. Atmos. Res. 2020, 231, 104656. [Google Scholar] [CrossRef]
  13. Hui, L.; Liu, X.; Tan, Q.; Feng, M.; An, J.; Qu, Y.; Zhang, Y.; Deng, Y.; Zhai, R.; Wang, Z. VOC characteristics, chemical reactivity and sources in urban Wuhan, central China. Atmos. Environ. 2020, 224, 117340. [Google Scholar] [CrossRef]
  14. Zhou, M.; Jiang, W.; Gao, W.; Zhou, B.; Liao, X. A high spatiotemporal resolution anthropogenic VOC emission inventory for Qingdao City in 2016 and its ozone formation potential analysis. Process Saf. Environ. Prot. 2020, 139, 147–160. [Google Scholar] [CrossRef]
  15. Liang, X.; Sun, X.; Lu, Q.; Ren, L.; Liu, M.; Su, Y.; Wang, S.; Lu, H.; Gao, B.; Zhao, W.; et al. VOC emission inventory of architectural coatings and adhesives for new buildings in China based on investigated and measured data. Atmos. Environ. 2021, 245, 118014. [Google Scholar] [CrossRef]
  16. Lewis, A.C.; Hopkins, J.R.; Carslaw, D.C.; Hamilton, J.F.; Nelson, B.S.; Stewart, G.; Dernie, J.; Passant, N.; Murrells, T. An increasing role for solvent emissions and implications for future measurements of volatile organic compounds. Philos. Trans. R. Soc. Math. Phys. Eng. Sci. 2020, 378, 20190328. [Google Scholar] [CrossRef]
  17. Chen, S.; Xu, Z.; Liu, P.; Zhuang, Y.; Jiang, M.; Zhang, X.; Han, Z.; Liu, Y.; Chen, X. Assessment of volatile organic compound emissions from pesticides in China and their contribution to ozone formation potential. Environ. Monit. Assess. 2022, 194, 737. [Google Scholar] [CrossRef]
  18. Pearson, J.K. European solvent VOC emission inventories based on industry-wide information. Atmos. Environ. 2019, 204, 118–124. [Google Scholar] [CrossRef]
  19. Lechhab, W.; Cincotta, F.; Lechhab, T.; Condurso, C.; Salmoun, F.; Cacciola, F.; Verzera, A. Preliminary Assessment of Occurrence, Potential Origin, and Human Health Risk of Volatile Organic Compounds in Uncontrolled Springs, North Morocco. Metabolites 2022, 12, 1213. [Google Scholar] [CrossRef]
  20. Lykogianni, M.; Bempelou, E.; Karamaouna, F.; Aliferis, K.A. Do pesticides promote or hinder sustainability in agriculture? The challenge of sustainable use of pesticides in modern agriculture. Sci. Total Environ. 2021, 795, 148625. [Google Scholar] [CrossRef]
  21. Siegel, M.; Starks, S.E.; Sanderson, W.T.; Kamel, F.; Hoppin, J.A.; Gerr, F. Organic solvent exposure and depressive symptoms among licensed pesticide applicators in the Agricultural Health Study. Int. Arch. Occup. Environ. Health 2017, 90, 849–857. [Google Scholar] [CrossRef] [PubMed]
  22. Toose, L.; Warren, C.; Mackay, D.; Parkerton, T.; Letinski, D.; Manning, R.; Connelly, M.; Rohde, A.; Fritz, B.; Hoffmann, W.C. Assessing the Fate of an Aromatic Hydrocarbon Fluid in Agricultural Spray Applications Using the Three-Stage ADVOCATE Model Framework. J. Agric. Food Chem. 2015, 63, 6866–6875. [Google Scholar] [CrossRef] [PubMed]
  23. Wu, Y.; An, Q.; Hao, X.; Li, D.; Zhou, C.; Zhang, J.; Wei, X.; Pan, C. Dissipative behavior, residual pattern, and risk assessment of four pesticides and their metabolites during tea cultivation, processing and infusion. Pest Manag. Sci. 2022, 78, 3019–3029. [Google Scholar] [CrossRef] [PubMed]
  24. CDPR (California Department of Pesticide Regulation). Pesticide Use Reporting—2018 Summary Data. 2018. Available online: https://www.cdpr.ca.gov/docs/pur/pur18rep/18_pur.htm (accessed on 19 January 2020).
  25. CDPR (California Department of Pesticide Regulation). Volatile Organic Compound (VOC) Emissions from Pesticides, Emission Inventory Reports and Data. 2019. Available online: https://www.cdpr.ca.gov/docs/emon/vocs/vocproj/voc_data_analysis.htm (accessed on 16 March 2021).
  26. OWD (Our World in Data). Pesticides—Our World in Data. 2021. Available online: https://ourworldindata.org/pesticides (accessed on 5 September 2022).
  27. The State Council of the People’s Republic of China. The Term Pesticide Is Defined as Follows in the Regulations on the Administration of Pesticides. 2022. Available online: http://www.gov.cn/gongbao/content/2017/content_5186961.htm (accessed on 5 September 2022).
  28. Porretta, D.; Mastrantonio, V.; Lucchesi, V.; Bellini, R.; Vontas, J.; Urbanelli, S. Historical samples reveal a combined role of agriculture and public-health applications in vector resistance to insecticides. Pest Manag. Sci. 2022, 78, 1567–1572. [Google Scholar] [CrossRef]
  29. CDPR (California Department of Pesticide Regulation). Estimation of Volatile Emission Potential of Pesticides by Thermogravimetry. 2005. Available online: https://www.cdpr.ca.gov/docs/emon/vocs/vocproj/tga_method_020905.pdf (accessed on 19 January 2020).
  30. Zeinali, M.; McConnell, L.L.; Hapeman, C.J.; Nguyen, A.; Schmidt, W.F.; Howard, C.J. Volatile organic compounds in pesticide formulations: Methods to estimate ozone formation potential. Atmos. Environ. 2011, 45, 2404–2412. [Google Scholar] [CrossRef]
  31. GB/T 1600-2021; Testing Method of Water for Pesticides. SAC (Standardization Administration of The People’s Republic of China), General Administration of Quality Supervision, Inspection and Quarantine of the PRC: Beijing, China, 2021. Available online: https://openstd.samr.gov.cn/bzgk/gb/newGbInfo?hcno=54E693A0F5DF1132DA47C71DB0A780B5 (accessed on 5 September 2022).
  32. HJ 1019-2019; Technical Guideline for Site Soil and Groundwater Sampling of Volatile Organic Compounds. MEE (Ministry of Ecology and Environment of the PRC): Beijing, China, 2019. Available online: https://www.mee.gov.cn/ywgz/fgbz/bz/bzwb/jcffbz/201905/W020190516584161547667.pdf (accessed on 5 September 2022).
  33. CMA (China Meteorological Administration). Analysis of Climate Background in Changsha. 2021. Available online: http://www.weather.com.cn/cityintro/101250101.shtml (accessed on 5 September 2022).
  34. CDPR (California Department of Pesticide Regulation). Nonfumigant Volatile Organic Compound (VOC) Regulations Product List. 2021. Available online: https://www.cdpr.ca.gov/docs/emon/vocs/vocproj/nonfum_voc_prod_list.pdf (accessed on 28 January 2022).
  35. Wei, H. The Environmental Impacts of Pesticide Use in Conventional and Organic Agriculture: Evidence from California. 2021. Available online: https://arefiles.ucdavis.edu/uploads/pub/2021/01/28/job_market_paper_hanlin_wei_152021.pdf (accessed on 5 September 2022).
  36. Zhan, Y.; Zhang, M.H. PURE: A web-based decision support system to evaluate pesticide environmental risk for sustainable pest management practices in California. Ecotoxicol. Environ. Saf. 2012, 82, 104–113. [Google Scholar] [CrossRef]
  37. Yates, S.R.; McConnell, L.L.; Hapeman, C.J.; Papiernik, S.K.; Gao, S.; Trabue, S.L. Managing agricultural emissions to the atmosphere: State of the science, fate and mitigation, and identifying research gaps. J. Environ. Qual. 2011, 40, 1347–1358. [Google Scholar] [CrossRef]
Figure 1. Location of the sampling point.
Agriculture 13 00066 g001
Figure 3. EP value of tested samples (%).
Agriculture 13 00066 g003
Figure 4. (a): Correlation analysis between MC and EP of insecticide products. (b): Correlation analysis between TM and EP of insecticide products. (c): Correlation analysis between TM and MC of insecticide products.
Agriculture 13 00066 g004
Figure 5. Relationship between AER of insecticide and air temperature.
Agriculture 13 00066 g005
Figure 6. Relationship between AER of insecticide and relative air humidity.
Agriculture 13 00066 g006
Figure 7. Relationship between AER of insecticide and air pressure.
Agriculture 13 00066 g007
Figure 8. (a): Characteristic value of major components. (b): Elements of the major principal component (M1). (c): Correlation between AER of insecticide samples and M1.
Agriculture 13 00066 g008aAgriculture 13 00066 g008b
Table 1. General list of selected insecticides.
Tested No.Product No.Pesticide FormulationActive Ingredient
InsecticideA0201PD20095706Emulsifiable concentrateAbamectin
A0202PD20121299Emulsifiable concentrateAbamectin
A0203PD20141452Emulsifiable concentrateAbamectin
A0204PD20120093Emulsifiable concentrateAbamectin
C0201PD20150289Suspension concentrateThiamethoxam
C0202PD20094278Suspension concentrateBacillus thuringiensis
B0201PD20140436Aqueous solutionNitenpyram
D0201PD20170562Emulsion (oil in water)β-Cyfluthrin
G0201PD20130350Soluble concentrateImidacloprid
Table 2. Characteristics of meteorological elements during the tests.
Meteorological ElementAverageMaximumMinimum
Temperature (°C)25.641.09.0
Relative humidity (%)74.892.044.0
Air pressure (hPa)1007.51021.0998.0
Table 3. MC, TM and EP of tested insecticides (%).
Tested No.Insecticide FormulationActive IngredientEPMCTM
A0201ECAbamectin15.100.7215.82
A0202ECAbamectin63.492.9866.48
A0203ECAbamectin41.590.8742.46
A0204ECAbamectin81.300.7780.79
C0201SCThiamethoxam12.3057.2569.55
C0202SCBacillus thuringiensis63.210.6563.86
B0201ASNitenpyram35.591.9337.52
D0201EWβ-Cyfluthrin25.3369.1894.50
G0201SLImidacloprid70.800.2171.01
Table 4. Actual emission ratio of total VOCs during applied typical insecticides.
Tested No.Pesticide
Formulation
Active
Ingredient
AE (%)AER (%)
AverageMaximumMinimumAverageMaximumMinimum
A0201ECAbamectin7.6810.875.3850.8571.9835.61
A0202ECAbamectin38.4847.8028.0660.6175.2944.19
A0203ECAbamectin22.2630.4214.5953.5273.1335.07
A0204ECAbamectin38.0751.4623.0046.8263.2928.29
C0201SCThiamethoxam23.4930.9916.5465.9887.0746.47
C0202SCBacillus thuringiensis6.328.414.4551.4068.3236.13
B0201ASNitenpyram30.8241.9622.5748.7666.3935.71
D0201EWβ-Cyfluthrin18.2721.8515.2072.1286.2660.02
G0201SLImidacloprid44.6356.7933.1763.0380.2146.85
Table 5. Statistics of AER characteristics of different temperature ranges during the tests.
Air TemperatureAir temperature CharacteristicsAER Characteristics
AverageMaximumMinimumStandard DeviationAverageMaximumMinimumStandard Deviation
Above 25 °C33.9041.0026.004.700.660.860.390.11
Below 25 °C16.1025.009.005.400.470.720.210.12
Total25.6041.009.0010.200.570.860.210.15
Disclaimer/Publisher’s Note: The statements, opinions and data contained in all publications are solely those of the individual author(s) and contributor(s) and not of MDPI and/or the editor(s). MDPI and/or the editor(s) disclaim responsibility for any injury to people or property resulting from any ideas, methods, instructions or products referred to in the content.

