Article

Establishment of DNA Molecular Fingerprint of Caladium Core Collections

1
Guangdong Provincial Key Lab of Ornamental Plant Germplasm Innovation and Utilization, Environmental Horticulture Research Institute, Guangdong Academy of Agricultural Sciences, Guangzhou 510640, China
2
Key Laboratory of Urban Agriculture in South China, Ministry of Agriculture, Guangzhou 510640, China
3
Dongguan Agricultural Scientific Research Center, Dongguan 523083, China
4
Jiangmen Agricultural Science and Technology Innovation Center, Jiangmen 529000, China
*
Author to whom correspondence should be addressed.
Agriculture 2023, 13(1), 200; https://doi.org/10.3390/agriculture13010200
Submission received: 2 December 2022 / Revised: 6 January 2023 / Accepted: 12 January 2023 / Published: 13 January 2023

Abstract

:
Caladiums are promising colorful foliage plants due to their unique leaf shapes and dazzling colors. Until now, over 2000 varieties of Caladium have been cultivated worldwide. The long-term natural variation and artificial selection have enriched the germplasm resources of Caladium in the market, yet have blurred its genetic background. In this study, 16 informative EST-SSR markers were used to screen 144 Caladium accessions, indicating that 16 EST-SSRs could distinguish all genotypes with a minimum cumulative identity probability (PI) of 2.0 2 × 10⁻¹⁵. Using the simulated annealing method, the richest genetic information was acquired at the same compression ratio. A final core of 44 accessions was selected, comprising 30.6% of the individuals and retraining more than 95% of the total genetic information. No significant differences were observed in allele frequency distributions or genetic diversity parameters between the core collection and the entire population. Cluster analysis roughly divided the core collections into four populations, where 66.7% of the private alleles were detected in Pop2. Finally, DNA molecular fingerprints of 44 core accessions were established, including barcodes and quick response (QR) code molecular identities (ID). The results will lay a theoretical foundation for identifying, preserving, and utilizing Caladium germplasm resources.

1. Introduction

Caladium, a foliage plant belonging to the Araceae family, is native to the tropical regions of South America [1,2]. It is often used for potted ornamental and flower garden cultivation due to its unique leaf shape, dazzling color, and excellent effects on urban beautification [3,4,5]. Driven by the diversified ornamental demands in leaf shape and color of Caladium, the University of Florida in the United States has been committed to the development and selection of Caladium accessions for years, aiming to make its germplasm resources more abundant [6,7,8,9]. Now, molecular markers are gradually being applied to breed new Caladium cultivars [10,11,12]. In China, there is little related research on Caladium, and significant efforts have been made for its introduction. The varieties of Caladium introduced include C. pieturatum, C. bicolor, and C. humboldtii [13]. However, the increasing number of introduced varieties has contributed to the confusion of different Caladium varieties [14]. Under such circumstances, identification work is pressing. It will be conducive to better explore the kinships and offer technological support for molecular marker-assisted breeding and molecular genetic fingerprinting of Caladium [15].
Over 2000 varieties of Caladium have been cultivated worldwide, with 100 available in the market after more than a century’s efforts in breeding [16,17,18]. The long-term natural variation and artificial selection have enriched the germplasm resources of Caladium in the market, yet blurred their genetic backgrounds [19,20]. Hence, it is of the utmost importance to determine whether the same varieties are named differently or if different varieties share the same name, causing more redundancy for germplasm resources and increasing pressure on resource beds for preservation [21]. Additionally, as new varieties continue to be updated, some traditional representative varieties of Caladium have gradually withdrawn from the market due to their low prices, resulting in a loss of resources [22,23]. Therefore, establishing a Caladium core collection is necessary to achieve better management and conservation system of Caladium germplasm resources [24]. The construction of molecular fingerprints of Caladium germplasm resources is also required to realize efficient utilization and rapid molecular identification of Caladium germplasm resources. With these efforts, it will be achievable to lay a solid foundation for finding the superior genes of Caladium.
In the 1980s, Frankel (1984) and Brown (1989) proposed the concept of core collection to maximize the genetic information of a population with a small number of resources [25,26]. Genetic diversity is enriched, and the number of resources and management costs are reduced in this concept [27,28]. The construction of core resource banks at an early stage is based on phenotypic trait evaluation, which is simple and operable, but low in accuracy due to its vulnerability to environmental influences [29]. The use of molecular markers is increasingly mainstream in core collection construction [30]. This is because they can provide genetic information on all plant materials in a brief time and reveal the phylogenetic relationship among individuals steadily and efficiently [31]. Simple repeat sequence (SSR), an ideal genetic marker method among most molecular marker techniques, outperforms others for its high polymorphism, abundant quantity, and good reproducibility [32,33].
A growing number of researchers are using molecular markers to construct deoxyribonucleic acid (DNA) fingerprints in order to identify the differences between core collections [34]. The current methods of fingerprint construction include polyacrylamide gel electrophoresis (PAGE), capillary electrophoresis with fluorescence detection, etc. [35,36,37]. With the rapid development of capillary electrophoresis with fluorescent SSR markers to construct DNA fingerprints, the obtained results can be converted into strings, barcodes, and quick response (QR) codes with the help of fingerprints [38,39]. All of these can be regarded as components of DNA molecular identity (ID) independent of environmental impacts, and can identify germplasm resources of different varieties precisely and concisely [40,41]. However, there are currently only a few studies on the DNA molecular ID construction of fingerprints of Caladium germplasm resources.
A total of 144 Caladium accessions were used in this study as the materials, followed by amplification using 16 pairs of fluorescent SSR primers. Next, Caladium core collections were established based on the allele maximization method. Their molecular fingerprints were constructed, laying a theoretical foundation for identifying, preserving, and utilizing Caladium germplasm resources.

2. Results

2.1. Polymorphic Information of EST-SSR Markers

A total of 144 Caladium germplasm resources were PCR amplified using 16 pairs of EST-SSR primers, with their polymorphic information calculated. It was shown in the results that the 16 pairs of primers were rich in polymorphism. The minimum cumulative identity probability (PI) was 2 × 10⁻¹⁵, indicating that these 16 pairs of markers could distinguish all genotypes of the 144 identified Caladium samples. Among all the markers, CAL86 achieved the highest identity probability (4 × 10⁻²), while CAL79 had the poorest identity probability (2.4 × 10⁻¹) (Table 1).

2.2. Confirmation and Evaluation of Core Collection Resources

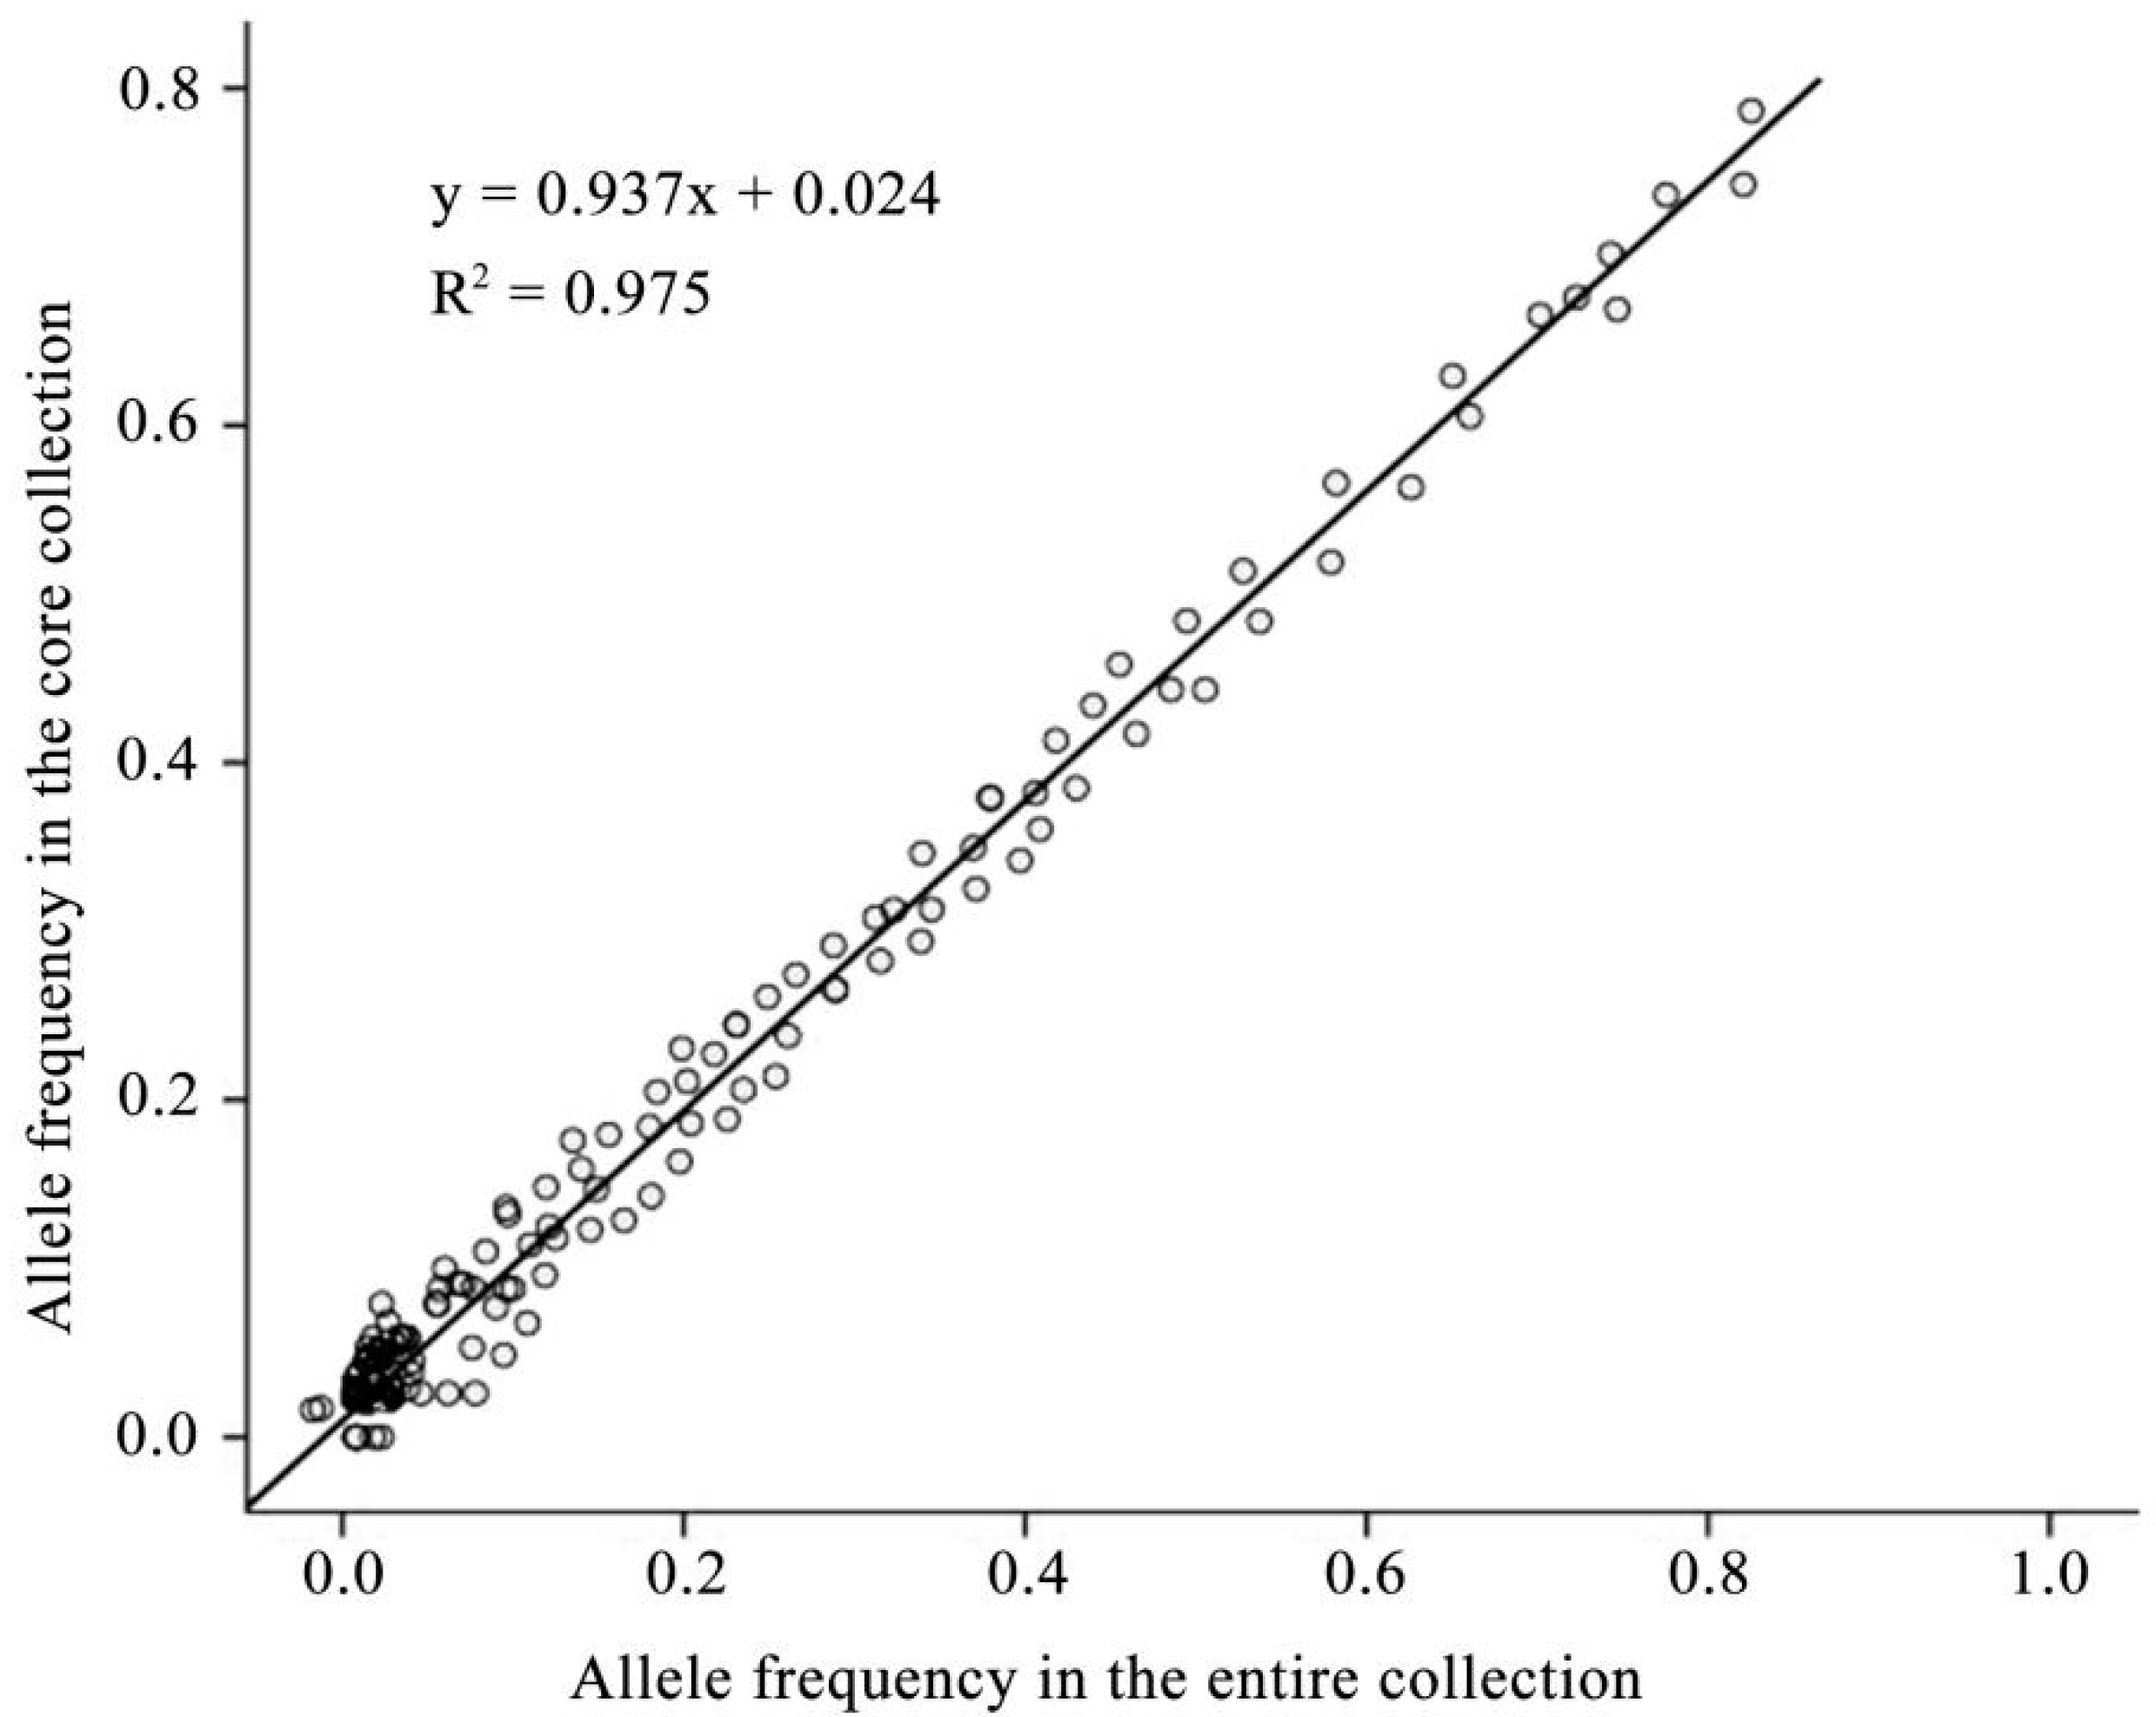
It could be found by comparing the three search methods that the simulated annealing method could acquire richer genetic information at the same compression ratio (Figure 1). Based on the genetic diversity analysis results, the resources possessing richer polymorphic loci were selected with greater priority. A total of 13 core resource populations were constructed, accounting for about 9.7–34.7% of the original germplasms. The genetic diversity parameters of each core resource population at different compression ratios are listed in Table S1. It was revealed in the results that Na grew with the increase in the compression ratio. The Ne value increased and then declined, while other parameters fluctuated wildly without evident variation tendency. A compression ratio of 30.6% could be the optimal ratio for Caladium core collections through a comprehensive analysis of all core resource populations. The retaining ratios of Na, Ne, I, Ho, He, and PIC were 95.2%, 109.9%, 108.8%, 100%, 104.1%, and 98.9%, respectively. The genetic parameters of original germplasms (144) and core collections (44) were subjected to t-tests, with no significant differences observed between them (p < 0.05), indicating that core collections can sufficiently represent the genetic diversity of the entire population (Figure 2).

2.3. Cluster and Allelic Analyses of Core Collections

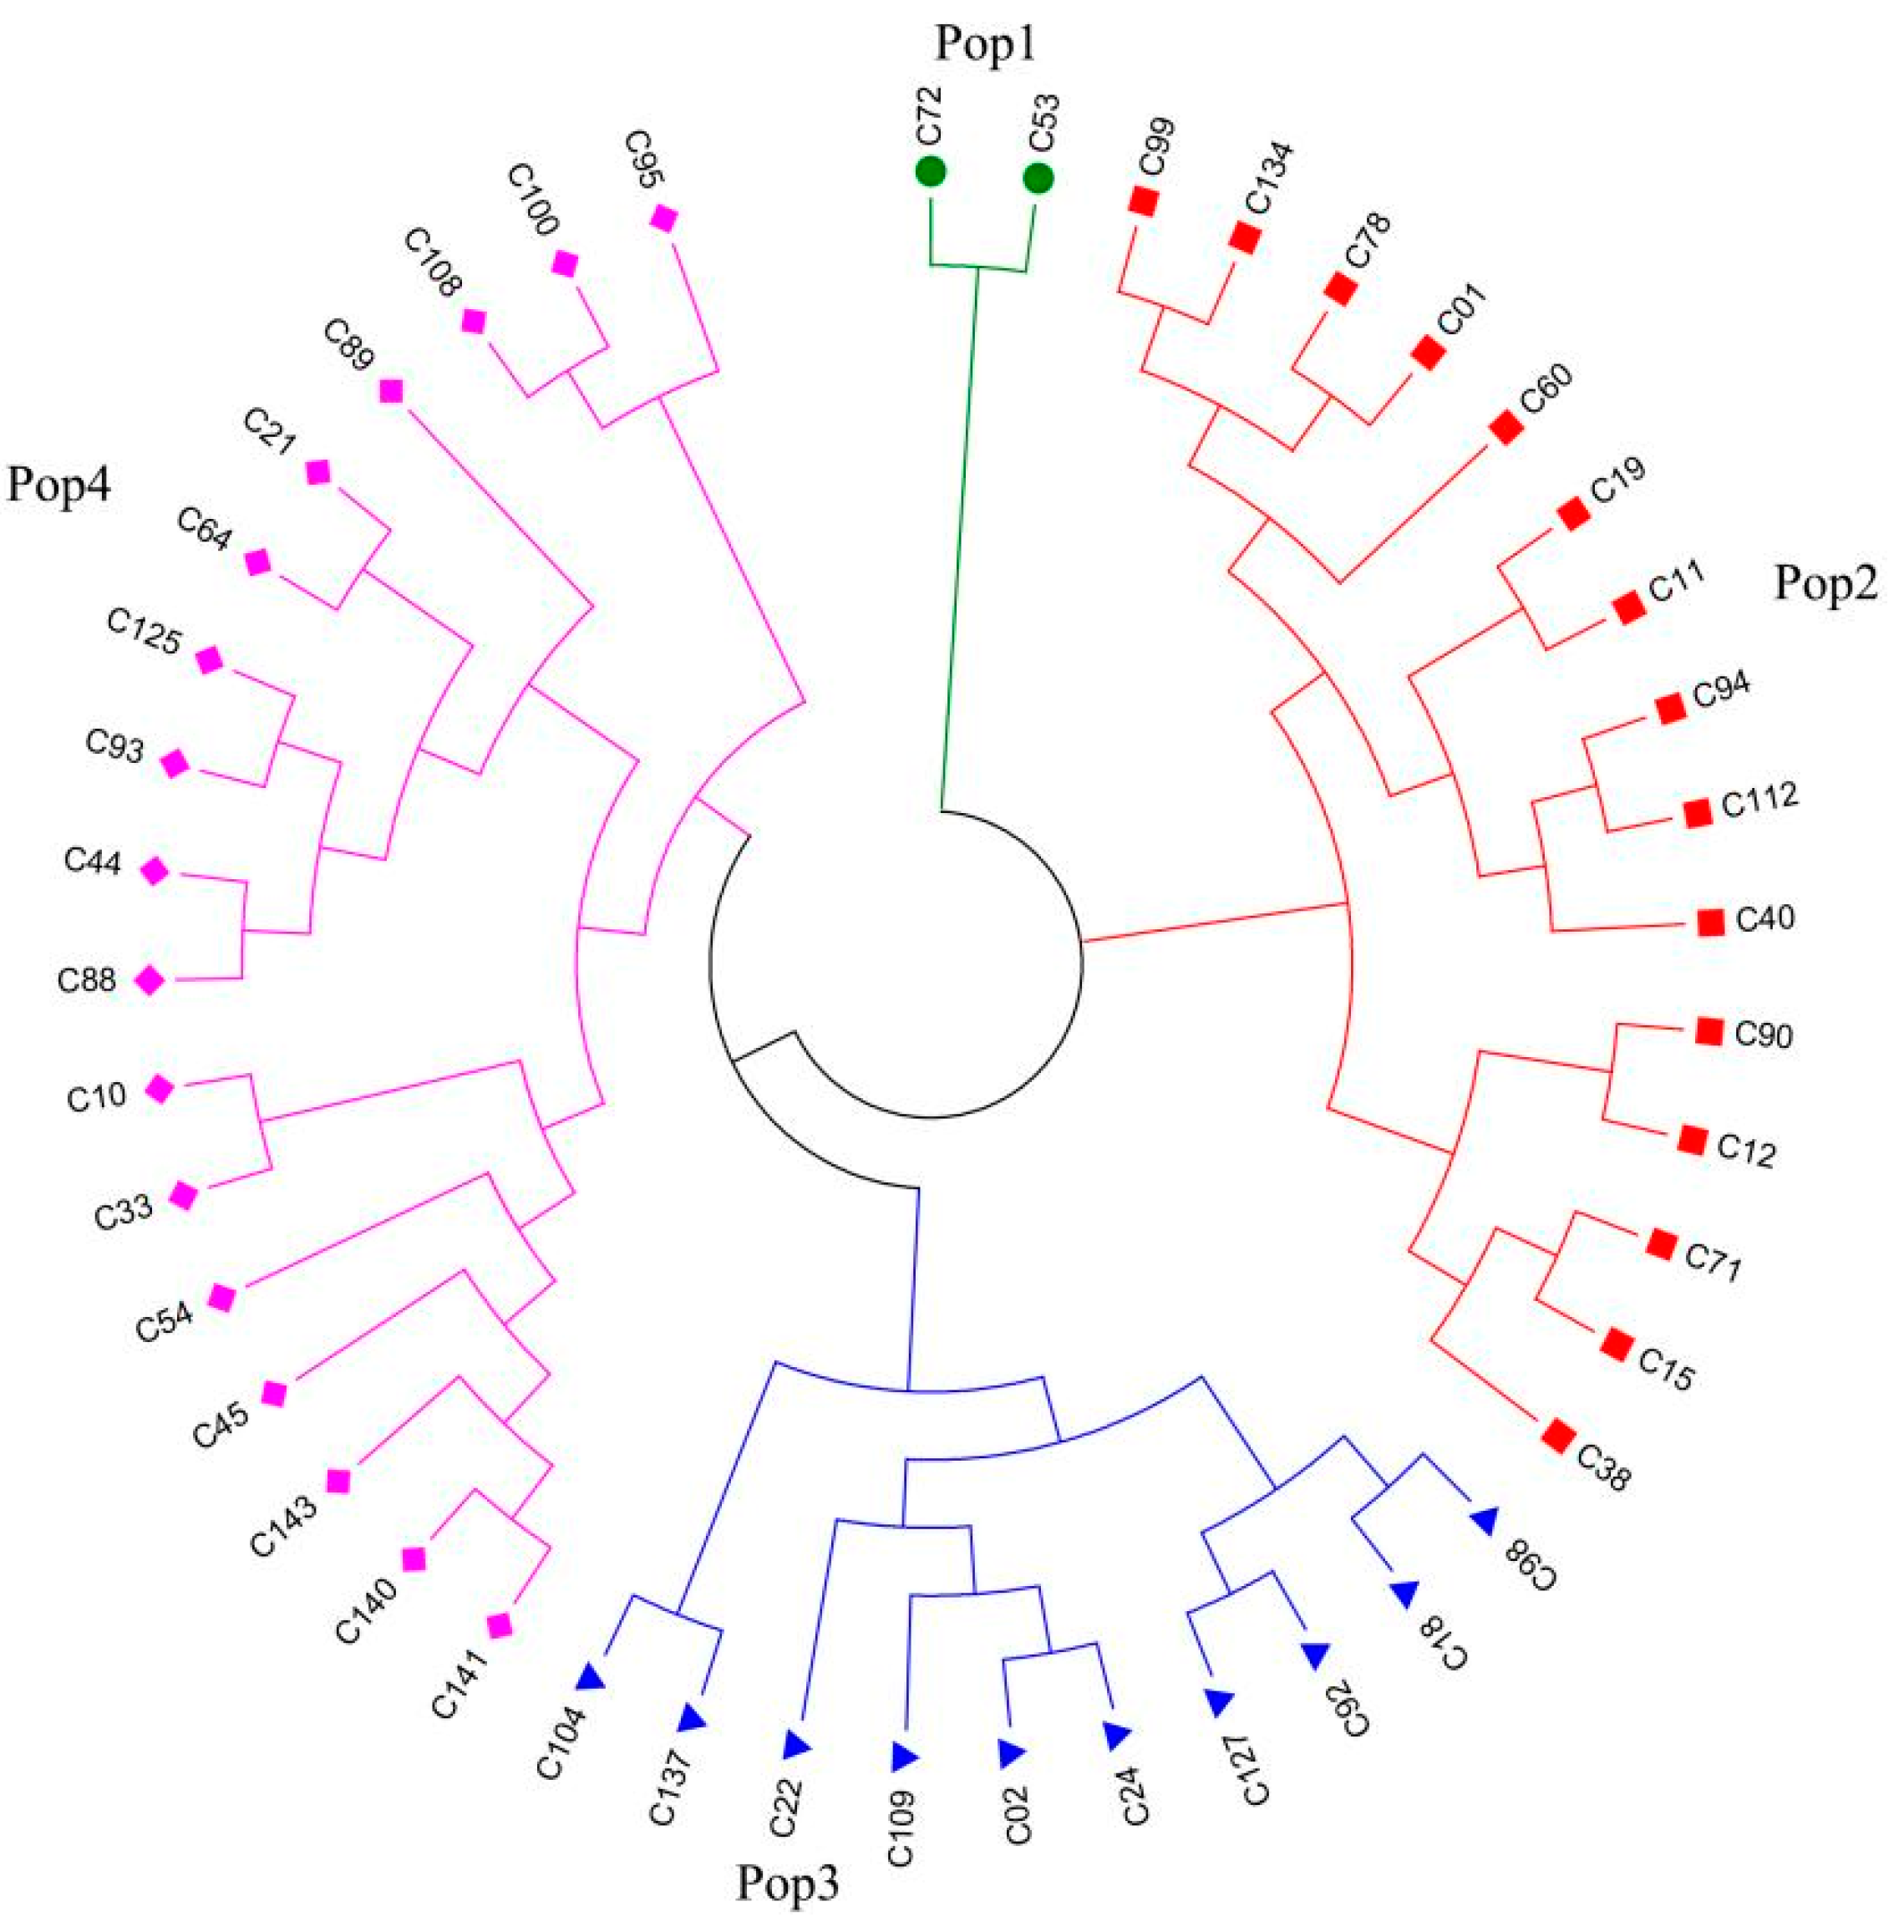
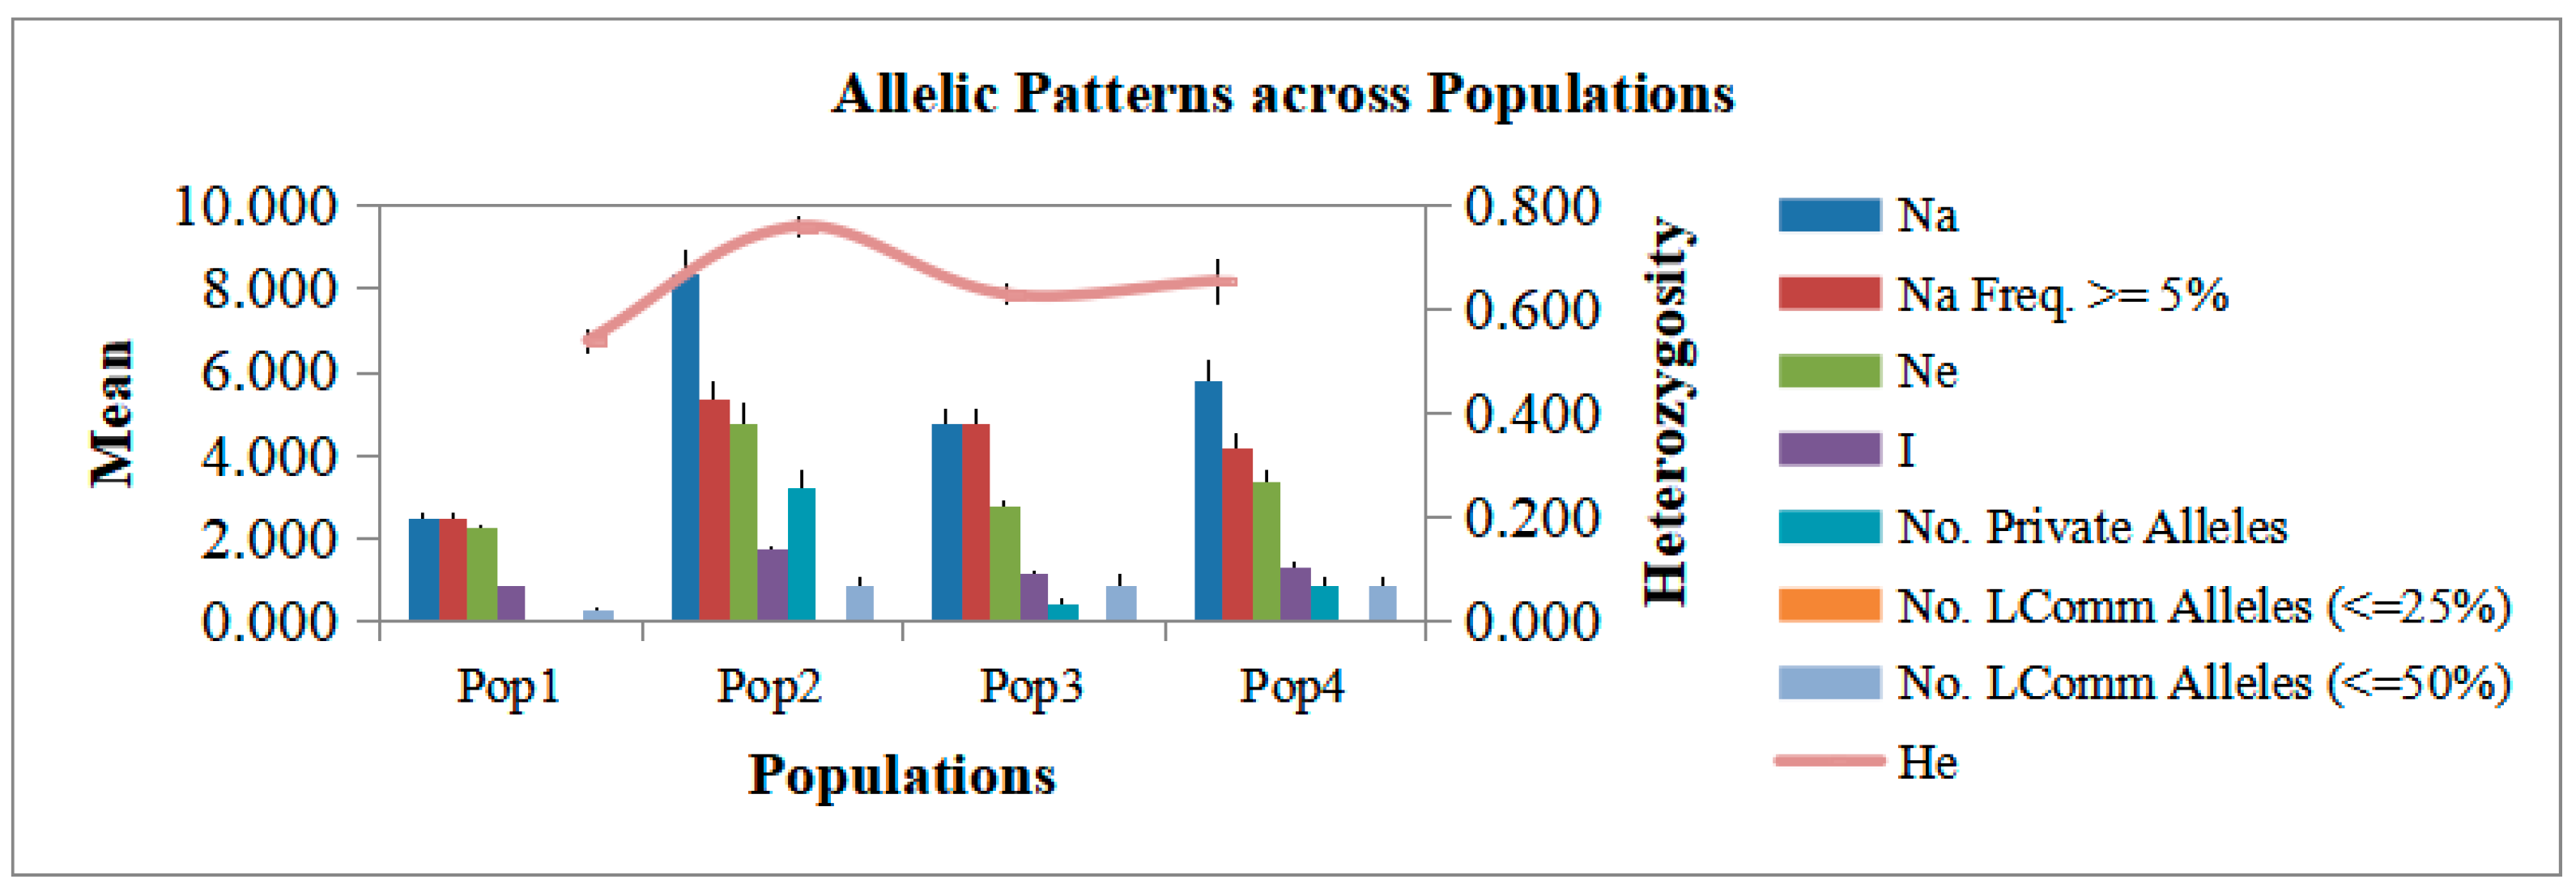
The established resource bank of core collections included 44 Caladium materials, which were clustered into four major populations for analysis (Figure 3). The allelic patterns across populations were investigated, revealing that the genetic parameters including Na, Ne, and I were highest in Pop2 and the lowest values were found in Pop1 (Figure 4). At the population level, 45 private alleles were detected in the four populations among 16 loci, with frequencies ranging from 0 to 0.583. Notably, seven private alleles were found in CAL90, followed by CAL162 (n = 6). Ten private alleles were observed in C. lindenii, followed by C. humboldtii, “Mini White,’” (n = 4) and C. praetermissum, “Hilo Beauty,” (n = 3). Overall, 66.7% of the private alleles were detected in Pop2, suggesting that the accessions in this group possess informative genetic diversity and may have undergone a unique evolutionary process.

2.4. Establishment of Molecular ID for Core Collections

The 16 pairs of core priers were adopted to perform capillary electrophoresis with fluorescent SSR markers for the established core collections. Band data were read using a sequencing analyzer (3730XL). The total number of polymorphic bands and the size of polymorphic fragments obtained by amplifying all primers and their codes are shown in Table S2. It can be seen that CAL86 and CAL106 harvested the most considerable number of bands (32), while CAL188 obtained the fewest bands (8). Subsequently, digit + English letter coding was performed according to the amplification results. The permutation and combination of the 16 pairs of markers were used to establish molecular IDs for the 44 core collections. For example, the DNA molecular ID of Caladium praetermissum, “Hilo Beauty,” (germplasm C99) was coded as M8H59UH89731EK6R, where the first letter, M, indicates the amplified fragment 189/201 of CAL16 in the germplasm C99 (Figure 5a,b). The second digit, eight, denotes the amplified fragment 190/199 of CAL152 in the germplasm C99. The other codes stand for corresponding information based on the same definition. Finally, the codes were imported into the online barcode generator to generate barcode-type DNA molecular IDs. Meanwhile, the primary descriptions of the Caladium core collections were imported into the quick response (QR) code generator to generate QR code-type DNA molecular IDs (Figure 5c,d). On this basis, the DNA molecular IDs of 44 Caladium core collections were successfully established in the form of character strings, barcodes, and QR codes. The DNA molecular IDs of the core collections in the form of barcodes and QR codes are demonstrated in Table S3.

3. Discussion

As the natural environment is excessively destroyed, many precious germplasm resources have been gradually reduced, accompanied by an increase in land costs and a decline in the land utilization rate, all of which affect the preservation of germplasm resources [42]. This problem has been effectively solved, to some extent, due to the proposal of the concept of core collection resources. The screening of plant-based phenotypic characteristics is easily susceptible to environmental factors. When used, molecular markers can acquire the genetic information of all plant materials in the short term, and can stably and efficiently reflect the kinships between individuals, providing a new direction for constructing core collection resources [43]. A resource bank of Caladium core collections was established in this study using 44 materials, with a genetic diversity of over 95% retained in the original population. According to the construction requirements for core collections, a significantly favorable sampling scale can be achieved if the core collection retains 70–80% of the genetic information of the original population [44]. Hence, the core collection of Caladium in this study preserved much of the genetic information of the original population and could be rendered representative of its genetic diversity.
Generally, specific requirements exist for the proportion of core collection samples to be selected. With a too-large sample size, it would be meaningless to construct the core collection. However, the size and genetic diversity covered may not be satisfactory in the case of too-small samples. Based on previous research structures, it is reasonable to set the sample size at 5–40%, under which the genetic diversity covered cannot be lower than 70%, and the number of selected germplasms should be no less than 20 [45]. The proportion can be reduced to 5–15% in the case of quality core collections [46]. Alternative germplasms with 13 compression ratios (9.7–34.7%) were constructed through stepwise clustering in this study. After comparisons and evaluations, a compression ratio of 30.6% was selected as the optimal sampling ratio, thus establishing a Caladium core collection of 44 materials and retaining 95.2% of the alleles. This could fully represent the genetic diversity of the original germplasm.
Among the 44 core collections, 19 accessions originated from the United States, 18 from Thailand, and only 7 from China. The largest proportion belonging to the United States reflects that the United States is still the breeding center of caladium, which is consistent with previous reports [11,12,15]. The number of core germplasms from Thailand also accounted for a large proportion, mainly because Thailand’s research institutions have devoted themselves to the cultivation of new varieties of caladium in recent decades, and they have bred some excellent cultivars with specific leaf vein colors, such as C12, C18, C98, C104 and C127, whose leaf vein colors are gray-purple, while the United States lacks such varieties [24,47]. The number of core germplasms in China was the lowest, which indicated that the breeding process of caladium in China is still in the development stages. However, there exist broad prospects for efficient utilization and rapid molecular breeding of Caladium germplasm resources on the basis of this final core collection.
Plants must have rich genetic diversity to better adapt to the environment and increase their survival rate. Only in this way can their advantageous positions in evolution and reproduction be ensured [48]. Thus, it is indispensable to establish resource banks for Caladium core collections, which, to some extent, can reduce the labor force, materials, and financial resources put into the protection of the original germplasms. Resource banks of core collections can be established by collecting essential materials for which the required protective measures should be formulated. Such materials will be selected as superior gene banks for breeding if they are utilized [28]. Core collections are established in a dynamic fashion, which will be continuously perfected by further expanding the collection of germplasm resources in subsequent research work [32].
Differences in breeding materials or varieties cannot be identified only through traditional distinctness, uniformity, and stability (DUS) detection. The DNA molecular marker technique, which develops rapidly, has become a necessary means of compensating for the traditional identification method and, thus, has been included as a component of DUS detection [49]. SSR markers have developed into an ideal tool for variety identification under high resolution and codominance [50,51]. The fluorescence sequencing technique can be combined with the SSR detection technique to efficiently construct crop variety fingerprints and perform genetic diversity analysis [52]. Thus, it is possible to overcome the difficulty of electrophoresis in band reading and mass data analysis with high efficiency.
DNA molecular IDs, which feature uniqueness and identifiability, serve as effective proof to verify and distinguish between different materials [34]. The established character strings, barcodes, and QR code-type DNA molecular IDs for the 44 core collections were exclusive to each variety (line), with unique codes, in this study [53]. Based on character strings, barcode-type DNA molecular IDs that could be rapidly identified by electronic devices were established [54,55]. However, they could not save much effective information, such as characters. Nowadays, the QR code technique can effectively accommodate digital information, character information, graphical information, etc., and can be identified by electronic devices, such as computers and cellphones, in an all-around way, thus substantially expanding the range of its application [39]. Thanks to such techniques, the DNA molecular IDs established for the Caladium core collections in this study can play a significant role in identifying and protecting germplasms [40,41]. Moreover, they apply to the perfection and intelligent management of resource banks of Caladium germplasms, laying an essential technical foundation for constructing standard DNA molecular ID libraries for Caladium germplasms. This study takes the lead, at home and abroad, in establishing DNA molecular IDs for Caladium germplasms, with broad application prospects in the research on the preservation and utilization of Caladium germplasm resources.

4. Materials and Methods

4.1. Plant Materials

Fresh leaves taken from 144 Caladium accessions collected from China and overseas were placed in dry silica gels, numbered, and preserved at 4 °C. Such preservation was made for later use (see the information of all samples in the Table S4) [47].

4.2. DNA Extraction and Detection

The dried leaves were ground in liquid nitrogen. Their DNA was extracted using a new-type plant genomic DNA extraction kit (Tiangen Biotechnology Co., Ltd., Beijing, China). Subsequently, DNA purity was detected in 1% agarose gel electrophoresis. Its concentration was determined using an ultramicro-spectrophotometer (P360). Then, the extracted DNA was preserved at −20 °C with the concentration regulated to 20 ng/μL.

4.3. Expressed Sequence Tag (EST)-SSR Amplification and Sequencing

EST-SSR markers were derived from primers developed through high-throughput sequencing, among which 16 highly polymorphic markers were selected [47]. In the method proposed by Schuelke et al., a primer fragment sequenced as TGTAAAACGACGGCCAGT was adapted to the 3′ terminal of the forward primer [56]. In contrast, the reverse primer sequence remained unchanged; the primer information is listed in Table S5. The polymerase chain reaction (PCR) system (15 μL) included 7.5 μL of 2× Taq PCR Master Mix, 0.2 μL of TP-M13 primers (1 μM), 1.2 μL of reverse primers (1 μM), 1.2 μL of M13 fluorescent primers (1 μM), 2.5 μL of DNA templates (20 ng/μL), and 2.4 μL of ddH2O. The PCR amplification procedure was as follows: unwinding at 94 °C for 5 min; 30 cycles at 94 °C for 30 s, at 56 °C for 30 s, and at 72 °C for 1 min; 13 cycles at 94 °C for 30 s, at 53 °C for 30 s, and at 72 °C for 1 min; extension at 72 °C for 10 min; and final preservation at 16 °C. Next, four different fluorescent PCR products were blended and detected with a DNA analyzer (ABI 3730 XL), followed by the collection and analysis of sequencing data via FlexiBin v2 and GeneMarker v2.20.

4.4. Genetic Diversity Analysis

The number of alleles and the polymorphic information content (PIC) were calculated by GenAlEx v6.0 to evaluate the polymorphism of each marker locus [57]. Next, POPGENE v1.31 was employed to calculate various genetic diversity indices, including the expected heterozygosity (He), the observed heterozygosity (Ho), the observed number of alleles (Na), the effective number of alleles (Ne), and the Shannon Diversity Index (I) [58]. Moreover, the genetic distance was calculated and the cluster analysis was performed in PowerMarker v3.25, with the cluster analysis diagram displayed in MEGA v4.0 [59].

4.5. Construction of Core Collections

According to the cluster analysis results, a core resource bank was established through a progressive sampling strategy. A total of 14 compression ratios were set to determine the number of optimal accessions (9.7%, 11.8%, 13.9%, 16.0%, 18.1%, 20.1%, 22.2%, 24.3%, 26.4%, 28.5%, 30.6%, 32.6%, and 34.7%). Additionally, 10 repeats were operated each time through 3 different search methods in PowerMarker 3.25. Then, the genetic parameter information of different methods under 13 compression ratios was comparatively analyzed, and the primary core collections were screened out. The genetic parameters and retaining ratios of the primary core collections and original germplasms were compared and combined with the t-test to determine the final core collections.

4.6. Establishment of DNA Molecular Identification

Based on SSR sequencing analysis results, the band patterns of all primers in different individuals were coded with digits + English letters. Different band patterns such as this were numbered from one to nine in descending order based on fragment length. Those band patterns exceeding nine were expressed with English letters from A to Z to establish DNA molecular identification in the form of character strings. Subsequently, the corresponding character strings were imported into an online barcode generator (http://barcode.cnaidc.com/html/BCGcode128b.php (accessed on 17 November 2022) to generate barcode-type DNA molecular IDs available for scanning. Next, text information, such as basic information, morphological characteristics and traits, quality data, and the DNA molecular ID of core collections, was input into an online QR code generator (https://cli.im/ (accessed on 17 November 2022)) to generate QR code-type DNA molecular IDs available for scanning.

5. Conclusions

Based on the phenotypic traits of 144 Caladium accessions, 16 informative EST-SSR markers were employed to screen their genetic relationships. Subsequently, a core collection of 44 individuals was constructed, comprising 30.6% of the accessions and representing the greatest genetic diversity. Among the four populations of core collections, 66.7% of the private alleles were detected in Pop2. Finally, precise DNA molecular fingerprints of 44 core accessions were established, including barcodes and quick response (QR) code molecular identities (ID). The results could be beneficial to increasing the application efficiency and rapid molecular identification in Caladium germplasm resources.

Supplementary Materials

The following supporting information can be downloaded at: https://www.mdpi.com/article/10.3390/agriculture13010200/s1, Table S1: Comparison of the genetic diversity among different sampling groups; Table S2: Amplification results and code typing of 12 pairs of core primers detected with capillary electrophoresis; Table S3: The bar code and QR code of 44 core collections; Table S4: Information of 144 Caladium accessions; Table S5: The basic information of 16 EST-SSR loci used in this study.

Author Contributions

Conceptualization, J.L. and H.F.; methodology, Y.Y.; software, Y.Z.; validation, Y.Y. and Y.Z.; formal analysis, Y.Y. and Y.Z.; investigation, J.T., Z.W. and L.T.; resources, Y.X. and J.L.; data curation, J.T.; writing—original draft preparation, Y.Y.; writing—review and editing, Y.Y.; visualization, H.F. and S.Z.; supervision, G.Z.; project administration, H.F. and J.L.; funding acquisition, H.F. and J.L. All authors have read and agreed to the published version of the manuscript.

Funding

This research was funded by The Project of Collaborative Innovation Center of GDAAS, grant number XT202212; and Social Science and Technology Project of Dongguan Province, grant number 20221800906422.

Institutional Review Board Statement

Not applicable.

Informed Consent Statement

Not applicable.

Data Availability Statement

The data presented in this study are available on request from the corresponding author.

Conflicts of Interest

The authors declare no conflict of interest.

References

  1. Madison, M. Notes on Caladium (Araceae) and its allies. Selbyana 1981, 5, 342–377. [Google Scholar]
  2. Croat, T. Taxonomic status of neotropical Araceae. Aroideana 1994, 17, 33–60. [Google Scholar]
  3. Ahmed, E.U.; Hayashi, T.; Yazawa, S. Leaf color stability during plant development as an index of leaf color variation among micropropagated Caladium. HortScience 2004, 39, 328–332. [Google Scholar] [CrossRef] [Green Version]
  4. Yu, S.Y.; Zhao, X.Q.; Wang, Y.D.; Jiang, D.Z.; Zhang, Y.M.; Hu, L.; Liu, Y.Q.; Cai, X.D. Morphological, cytological, and molecular-based genetic stability analysis of in vitro-propagated plants from newly induced aneuploids in Caladium. Agriculture 2022, 12, 1708. [Google Scholar] [CrossRef]
  5. Isah, T. Changes in the biochemical parameters of albino, hyperhydric and normal green leaves of Caladium bicolor cv. "Bleeding hearts" in vitro long-term cultures. J. Photochem. Photobio. B 2019, 191, 88–98. [Google Scholar] [CrossRef] [PubMed]
  6. Ahmed, E.U.; Hayashi, T.; Yazawa, S. Auxins increase the occurrence of leaf-colour variants in Caladium regenerated from leaf explants. Sci. Hortic. 2004, 100, 153–159. [Google Scholar] [CrossRef]
  7. Deng, Z.A.; Harbaugh, B.K. Independent inheritance of leaf shape and main vein color in Caladium. J. Am. Soc. Hortic. Sci. 2006, 131, 53–58. [Google Scholar] [CrossRef]
  8. Maia, A.C.D.; Schlindwein, C. Caladium bicolor (Araceae) and Cyclocephala celata (Coleoptera, Dynastinae): A well-established pollination system in the northern atlantic rainforest of pernambuco, Brazil. Plant Biol. 2006, 8, 529–534. [Google Scholar] [CrossRef]
  9. Cao, Z.; Sui, S.Z.; Yang, Q.; Deng, Z.A. Inheritance of rugose leaf in Caladium and genetic relationships with leaf shape, main vein color, and leaf spotting. J. Am. Soc. Hortic. Sci. 2016, 141, 527–534. [Google Scholar] [CrossRef] [Green Version]
  10. Cao, Z.; Deng, Z.A. De novo assembly, annotation, and characterization of root transcriptomes of three Caladium cultivars with a focus on necrotrophic pathogen resistance/defense-related genes. Int. J. Mol. Sci. 2017, 18, 712. [Google Scholar] [CrossRef] [PubMed]
  11. Deng, Z.A.; Goktepe, F.; Harbaugh, B.K.; Hu, J.G. Assessment of genetic diversity and relationships among Caladium cultivars and species using molecular markers. J. Am. Soc. Hortic. Sci. 2007, 132, 219–229. [Google Scholar] [CrossRef] [Green Version]
  12. Loh, J.P.; Kiew, R.; Kee, A.; Gan, L.H.; Gan, Y.Y. Amplified fragment length polymorphism (AFLP) provides molecular markers for the identification of Caladium bicolor cultivars. Ann. Bot. 1999, 84, 155–161. [Google Scholar] [CrossRef]
  13. Cai, X.D.; Cao, Z.; Xu, S.X.; Deng, Z.A. Induction, regeneration and characterization of tetraploids and variants in ‘Tapestry’ Caladium. Plant Cell Tiss. Org. 2015, 120, 689–700. [Google Scholar] [CrossRef]
  14. Zhang, Y.S.; Chen, J.J.; Cao, Y.M.; Duan, J.X.; Cai, X.D. Induction of tetraploids in ‘Red Flash’ Caladium using colchicine and oryzalin: Morphological, cytological, photosynthetic and chilling tolerance analysis. Sci. Hortic. 2020, 275, 109524. [Google Scholar] [CrossRef]
  15. Cao, Z.; Deng, Z.A. Interspecific genome size and chromosome number variation shed new light on species classification and evolution in Caladium. J. Am. Soc. Hortic. Sci. 2014, 139, 449–459. [Google Scholar] [CrossRef] [Green Version]
  16. Cao, Z.; Sui, S.Z.; Cai, X.D.; Yang, Q.; Deng, Z.A. Somaclonal variation in ‘Red Flash’ Caladium: Morphological, cytological and molecular characterization. Plant Cell Tiss. Org. 2016, 126, 269–279. [Google Scholar] [CrossRef] [Green Version]
  17. Deng, Z.A.; Peres, N.A. ‘Sea Foam Pink’ Caladium. HortScience 2019, 54, 1637–1640. [Google Scholar] [CrossRef]
  18. Yu, J.L.; Boyd, N.S. Tolerance of Caladium cultivars florida cardinal and florida fantasy to sulfonylurea herbicides. HortScience 2018, 53, 850–858. [Google Scholar] [CrossRef]
  19. Cao, Z.; Deng, Z.A. Morphological, cytological and molecular marker analyses of ‘Tapestry’ Caladium variants reveal diverse genetic changes and enable association of leaf coloration pattern loci with molecular markers. Plant Cell Tiss. Org. 2020, 143, 363–375. [Google Scholar] [CrossRef]
  20. Chen, J.J.; Zhang, Y.S.; Duan, J.X.; Cao, Y.M.; Cai, X.D. Morphological, cytological, and pigment analysis of leaf color variants regenerated from long-term subcultured Caladium callus. In Vitr. Cell. Dev. Biol. Plant 2021, 57, 60–71. [Google Scholar] [CrossRef]
  21. Deng, Z.A.; Goktepe, F.; Harbaugh, B.K. Inheritance of leaf Spots and their genetic relationships with leaf shape and vein color in Caladium. J. Am. Soc. Hortic. Sci. 2008, 133, 78–83. [Google Scholar] [CrossRef] [Green Version]
  22. Ekeke, C.; Agbagwa, I.O. Anatomical characteristics of Nigerian variants of Caladium bicolor (Aiton) Vent. (Araceae). Afr. J. Plant Sci. 2016, 10, 121–129. [Google Scholar]
  23. Croat, T.B.; Delannay, X.; Ortiz, O.O.; Jiménez, P.D. A review of the Aroid Tribe Caladieae with the description of three new species of Caladium and seven new species of Syngonium (Araceae). Novon J. Bot. Nom. 2019, 27, 38–64. [Google Scholar] [CrossRef]
  24. Hussain, R.; Younis, A.; Riaz, A.; Tariq, U.; Ali, S.; Ali, A.; Raza, S. Evaluating sustainable and environment friendly substrates for quality production of potted Caladium. Int. J. Recycl. Org. 2017, 6, 13–21. [Google Scholar] [CrossRef] [Green Version]
  25. Frankel, O.H. Genetic Perspectives of Germplasm Conservation; Cambridge University Press: Cambridge, UK, 1984; pp. 161–170. [Google Scholar]
  26. Brown, A. Core collections: A practical approach to genetic resources management. Genome 1989, 31, 818–824. [Google Scholar] [CrossRef]
  27. Song, J.M.; Arif, M.; Zi, Y.; Sze, S.H.; Zhang, M.P.; Zhang, H.B. Molecular and genetic dissection of the USDA rice mini-core collection using high-density SNP markers. Plant Sci. 2021, 308, 110910. [Google Scholar] [CrossRef]
  28. Razi, S.; Soleimani, A.; Zeinalabedini, M.; Vazifeshenas, M.R.; Martínez-Gómez, P.; Kermani, A.M.; Raiszadeh, A.R.; Tayari, M.; Martínez-García, P.J. Development of a multipurpose core collection of new promising Iranian pomegranate (Punica granatum L.) genotypes based on morphological and pomological traits. Horticulturae 2021, 7, 350. [Google Scholar] [CrossRef]
  29. Huang, F.Y.; Duan, J.H.; Lei, Y.; Liu, Z.; Kang, Y.K.; Luo, Y.; Chen, Y.Y.; Li, Y.Y.; Liu, S.Q.; Li, S.J.; et al. Genetic diversity, population structure and core collection analysis of Hunan tea plant germplasm through genotyping-by-sequencing. Beverage Plant Res. 2022, 2, 5. [Google Scholar] [CrossRef]
  30. Govindaraj, M.; Rai, K.N.; Kanatti, A.; Upadhyaya, H.D.; Shivade, H.; Rao, A.S. Publisher Correction: Exploring the genetic variability and diversity of pearl millet core collection germplasm for grain nutritional traits improvement. Sci. Rep. 2021, 11, 9757. [Google Scholar] [CrossRef]
  31. Balfourier, F.; Roussel, V.; Strelchenko, P.P.; Exbrayatvinson, F.; Spurdille, P.; Boutet, G.; Koening, J.L.; Ravel, C.; Mitrofanova, O.P.; Beckert, M.; et al. A worldwide bread wheat core collection arrayed in a 384-well plate. Theor. Appl. Genet. 2007, 114, 1265–1275. [Google Scholar] [CrossRef]
  32. Xu, C.Q.; Gao, J.; Du, Z.F.; Li, D.K.; Wang, Z.; Li, Y.Y.; Pang, X.M. Identifying the genetic diversity, genetic structure and a core colmection of Ziziphus jujuba Milm. Var. jujuba accessions using microsatelmite markers. Sci. Rep. 2016, 6, 31503. [Google Scholar] [CrossRef] [PubMed]
  33. Nie, X.H.; Wang, Z.H.; Liu, N.W.; Song, L.; Yan, B.Q.; Xing, Y.; Zhang, Q.; Fang, K.F.; Zhao, Y.L.; Chen, X.; et al. Fingerprinting 146 Chinese chestnut (Castanea mollissima Blume) accessions and selecting a core collection using SSR markers. J. Integr. Agr. 2021, 20, 1277–1286. [Google Scholar] [CrossRef]
  34. Tian, H.L.; Wang, F.G.; Zhao, J.R.; Yi, H.M.; Wang, R.; Yang, Y.; Song, W. Development of maizeSNP3072, a high-throughput compatible SNP array, for DNA fingerprinting identification of Chinese maize varieties. Mol. Breed. 2015, 35, 136. [Google Scholar] [CrossRef] [PubMed]
  35. Natesan, S.; Venugopalan, G.; Selvamani, S.B.; Krishnamoorthy, M.; Chandran, S.; Angamuthu, N. Characterization of little millet (Panicum sumatrense) varieties using morphological descriptors and SSR based DNA fingerprinting. J. Phytol. 2020, 12, 29–34. [Google Scholar] [CrossRef]
  36. Ma, S.N.; Han, C.Y.; Zhou, J.; Hu, R.C.; Jiang, X.; Wu, F.F.; Tian, K.; Nie, G.; Zhang, X.Q. Fingerprint identification of white clover cultivars based on SSR molecular markers. Mol. Biol. Rep. 2020, 47, 8513–8521. [Google Scholar] [CrossRef]
  37. Liu, J.; Liao, K.; Nasir, M.; Sun, Q.; Liu, H.; Jia, Y. Analysis of genetic diversity and construction of DNA fingerprint database of Xinjiang apricot varieties (lines). Sci. Agric. Sin. 2015, 4, 134–144. (In Chinese) [Google Scholar]
  38. Xia, F.G.; Huang, J.X.; Ji, B.J.; Zhan, F.Y.; Xie, P.P.; Deng, B.Z.; Lin, H.; Zheng, J.G. Genetic diversity analysis and DNA fingerprint construction of Coix lacryma-jobi germplasm resources by SRAP marker. J. Plant Genet. Resour. 2017, 3, 36–43. (In Chinese) [Google Scholar]
  39. Guo, Y.C.; Zhang, L.L.; Chen, S.Y.; Qi, J.M.; Fang, P.P.; Tao, A.F.; Zhang, L.M.; Zhang, L.W. Establishment of DNA molecular fingerprint of applied core germplasm in jute (Corchorus spp.). Acta Agric. Sin. 2021, 47, 80–93. (In Chinese) [Google Scholar] [CrossRef]
  40. Freixas-Coutin, J.A.; An, S.; Postman, J.; Bassil, N.V.; Yates, B.; Shukla, M.; Saxena, P.K. Development of a reliable Corylus sp. reference database through the implementation of a DNA fingerprinting test. Planta 2019, 249, 1863–1874. [Google Scholar] [CrossRef]
  41. Yogi, R.; Kumar, N.; Kumar, R.; Jain, R.K. Genetic diversity analysis among important rice (Oryza sativa L.) genotypes using SSR markers. Adv. Biores. 2020, 11, 68–74. [Google Scholar]
  42. Anoumaa, M.; Yao, N.K.; Kouam, E.B.; Kanmegne, G.; Machuka, E.; Osama, S.K.; Nzuki, I.; Kamga, Y.B.; Fonkou, T.; Omokolo, D.N. Genetic diversity and core collection for potato (Solanum tuberosum L.) cultivars from cameroon as revealed by SSR markers. Am. J. Potato Res. 2017, 94, 449–463. [Google Scholar] [CrossRef]
  43. Nader, W.; Elsner, J.; Brendel, T.; Schubbert, R. The DNA fingerprint in food forensics: The Basmati rice case. Agro. Food Ind. Hi Tech. 2019, 30, 57–61. [Google Scholar]
  44. Di Guardo, M.; Scollo, F.; Ninot, A.; Rovira, M.; Hermoso, J.F.; Distefano, G.; La Malfa, S.; Batlle, I. Genetic structure analysis and selection of a core collection for carob tree germplasm conservation and management. Tree Genet. Genomes 2019, 15, 41. [Google Scholar] [CrossRef]
  45. Wang, Y.Z.; Zhang, J.H.; Sun, H.Y.; Ning, N.; Yang, L. Construction and evaluation of a primary core colmection of apricot germplasm in China. Sci. Hortic. 2011, 128, 311–319. [Google Scholar] [CrossRef]
  46. Choi, Y.M.; Kim, K.M.; Lee, S.; Oh, S.; Lee, M.C. Development of a Core Collection Based on EST-SSR Markers and Phenotypic Traits in Foxtail Millet [Setaria italica (L.) P. Beauv.]. J. Crop Sci. Biotechnol. 2019, 21, 395–405. [Google Scholar] [CrossRef]
  47. Zhou, Y.W.; Ye, Y.J.; Zhu, G.F.; Xu, Y.C.; Tan, J.J.; Liu, J.M. Diversity, classification, and EST-SSR-based association analysis of caladium ornamental traits. Physiol. Plantarum 2022, 174, e13841. [Google Scholar] [CrossRef]
  48. Ye, Y.J.; Xu, Y.C.; Li, D.M.; Tan, J.J.; Liu, J.M. Characterization of EST-SSR markers in Curcuma kwangsiensis S. K. Lee & C. F. Liang based on RNA sequencing and its application for phylogenetic relationship analysis and core collection construction. Genet. Resour. Crop Evol. 2021, 68, 1503–1516. [Google Scholar]
  49. Ye, Y.J.; Feng, L.; Liang, X.H.; Liu, T.T.; Cai, M.; Cheng, T.R.; Wang, J.; Zhang, Q.X.; Pan, H.T. Characterization, validation, and cross-species transferability of newly developed EST-SSR markers and their application for genetic evaluation in crape myrtle (Lagerstroemia spp). Mol. Breed. 2019, 39, 26. [Google Scholar] [CrossRef]
  50. Duan, H.J.; Cao, S.; Zheng, H.Q.; Hu, D.H.; Lin, J.; Cui, B.B.; Lin, H.Z.; Hu, R.Y.; Wu, B.; Sun, Y.H.; et al. Genetic characterization of Chinese fifir from six provinces in southern China and construction of a core collection. Sci. Rep. 2017, 7, 13814. [Google Scholar] [CrossRef] [Green Version]
  51. Zhou, Q.; Mu, K.M.; Ni, Z.X.; Liu, X.H.; Li, Y.G.; Xu, L.A. Analysis of genetic diversity of ancient Ginkgo populations using SSR markers. Ind. Crop Prod. 2019, 145, 111942. [Google Scholar] [CrossRef]
  52. Zhang, Z.Y.; Xie, W.G.; Zhao, Y.Q.; Zhang, J.C.; Wang, N.; Ntakirutmana, F.; Yan, J.J.; Wang, Y.R. EST-SSR marker development based on RNA-sequencing of E. sibiricus and its application for phylogenetic relationships analysis of seventeen Elymus species. BMC Plant Biol. 2019, 19, 235. [Google Scholar] [CrossRef] [Green Version]
  53. Lu, X.Z.; Ni, J.L.; Li, L.; Wang, X.F.; Ma, H.; Zhang, X.J.; Yang, J.B. Construction of rice variety in dentity using SSR fingerprint and commodity information. Acta Agron. Sin. 2014, 40, 823–829. (In Chinese) [Google Scholar] [CrossRef]
  54. Gao, Y.; Liu, F.Z.; Wang, K.; Wang, D.J.; Gong, X.; Liu, L.J. Establishment of molecular ID for some apple germplasm resources. Sci. Agric. Sin. 2015, 48y, 3887–3898. (In Chinese) [Google Scholar]
  55. Zhang, L.W.; Cai, R.R.; Yuan, M.H.; Tao, A.F.; Xu, J.T.; Lin, L.H.; Fang, P.P.; Qi, J.M. Genetic diversity and DNA fingerprinting in jute (Corchorus spp.) based on SSR markers. Acta Agron. Sin. 2015, 3, 416–422. (In Chinese) [Google Scholar] [CrossRef] [Green Version]
  56. Schuelke, M. An economic method for the flfluorescent labeling of PCR fragments. Nat. Biotechnol. 2000, 18, 233–234. [Google Scholar] [CrossRef]
  57. Peakall, R.; Smouse, P.E. GenAlEx 6.5: Genetic analysis in Excel. Population genetic sofware for teaching and research-an update. Bioinformatics 2006, 28, 2537–2539. [Google Scholar] [CrossRef] [PubMed] [Green Version]
  58. Yeh, F.C.; Yang, R.C.; Boyle, T. POPGENE Version 1.31, University of Alberta: Edmonton, AB, Canada, 1999.
  59. Liu, K.; Muse, S.V. PowerMarker: An integrated analysis environment for genetic marker analysis. Bioinformatics 2005, 21, 2128–2129. [Google Scholar] [CrossRef]
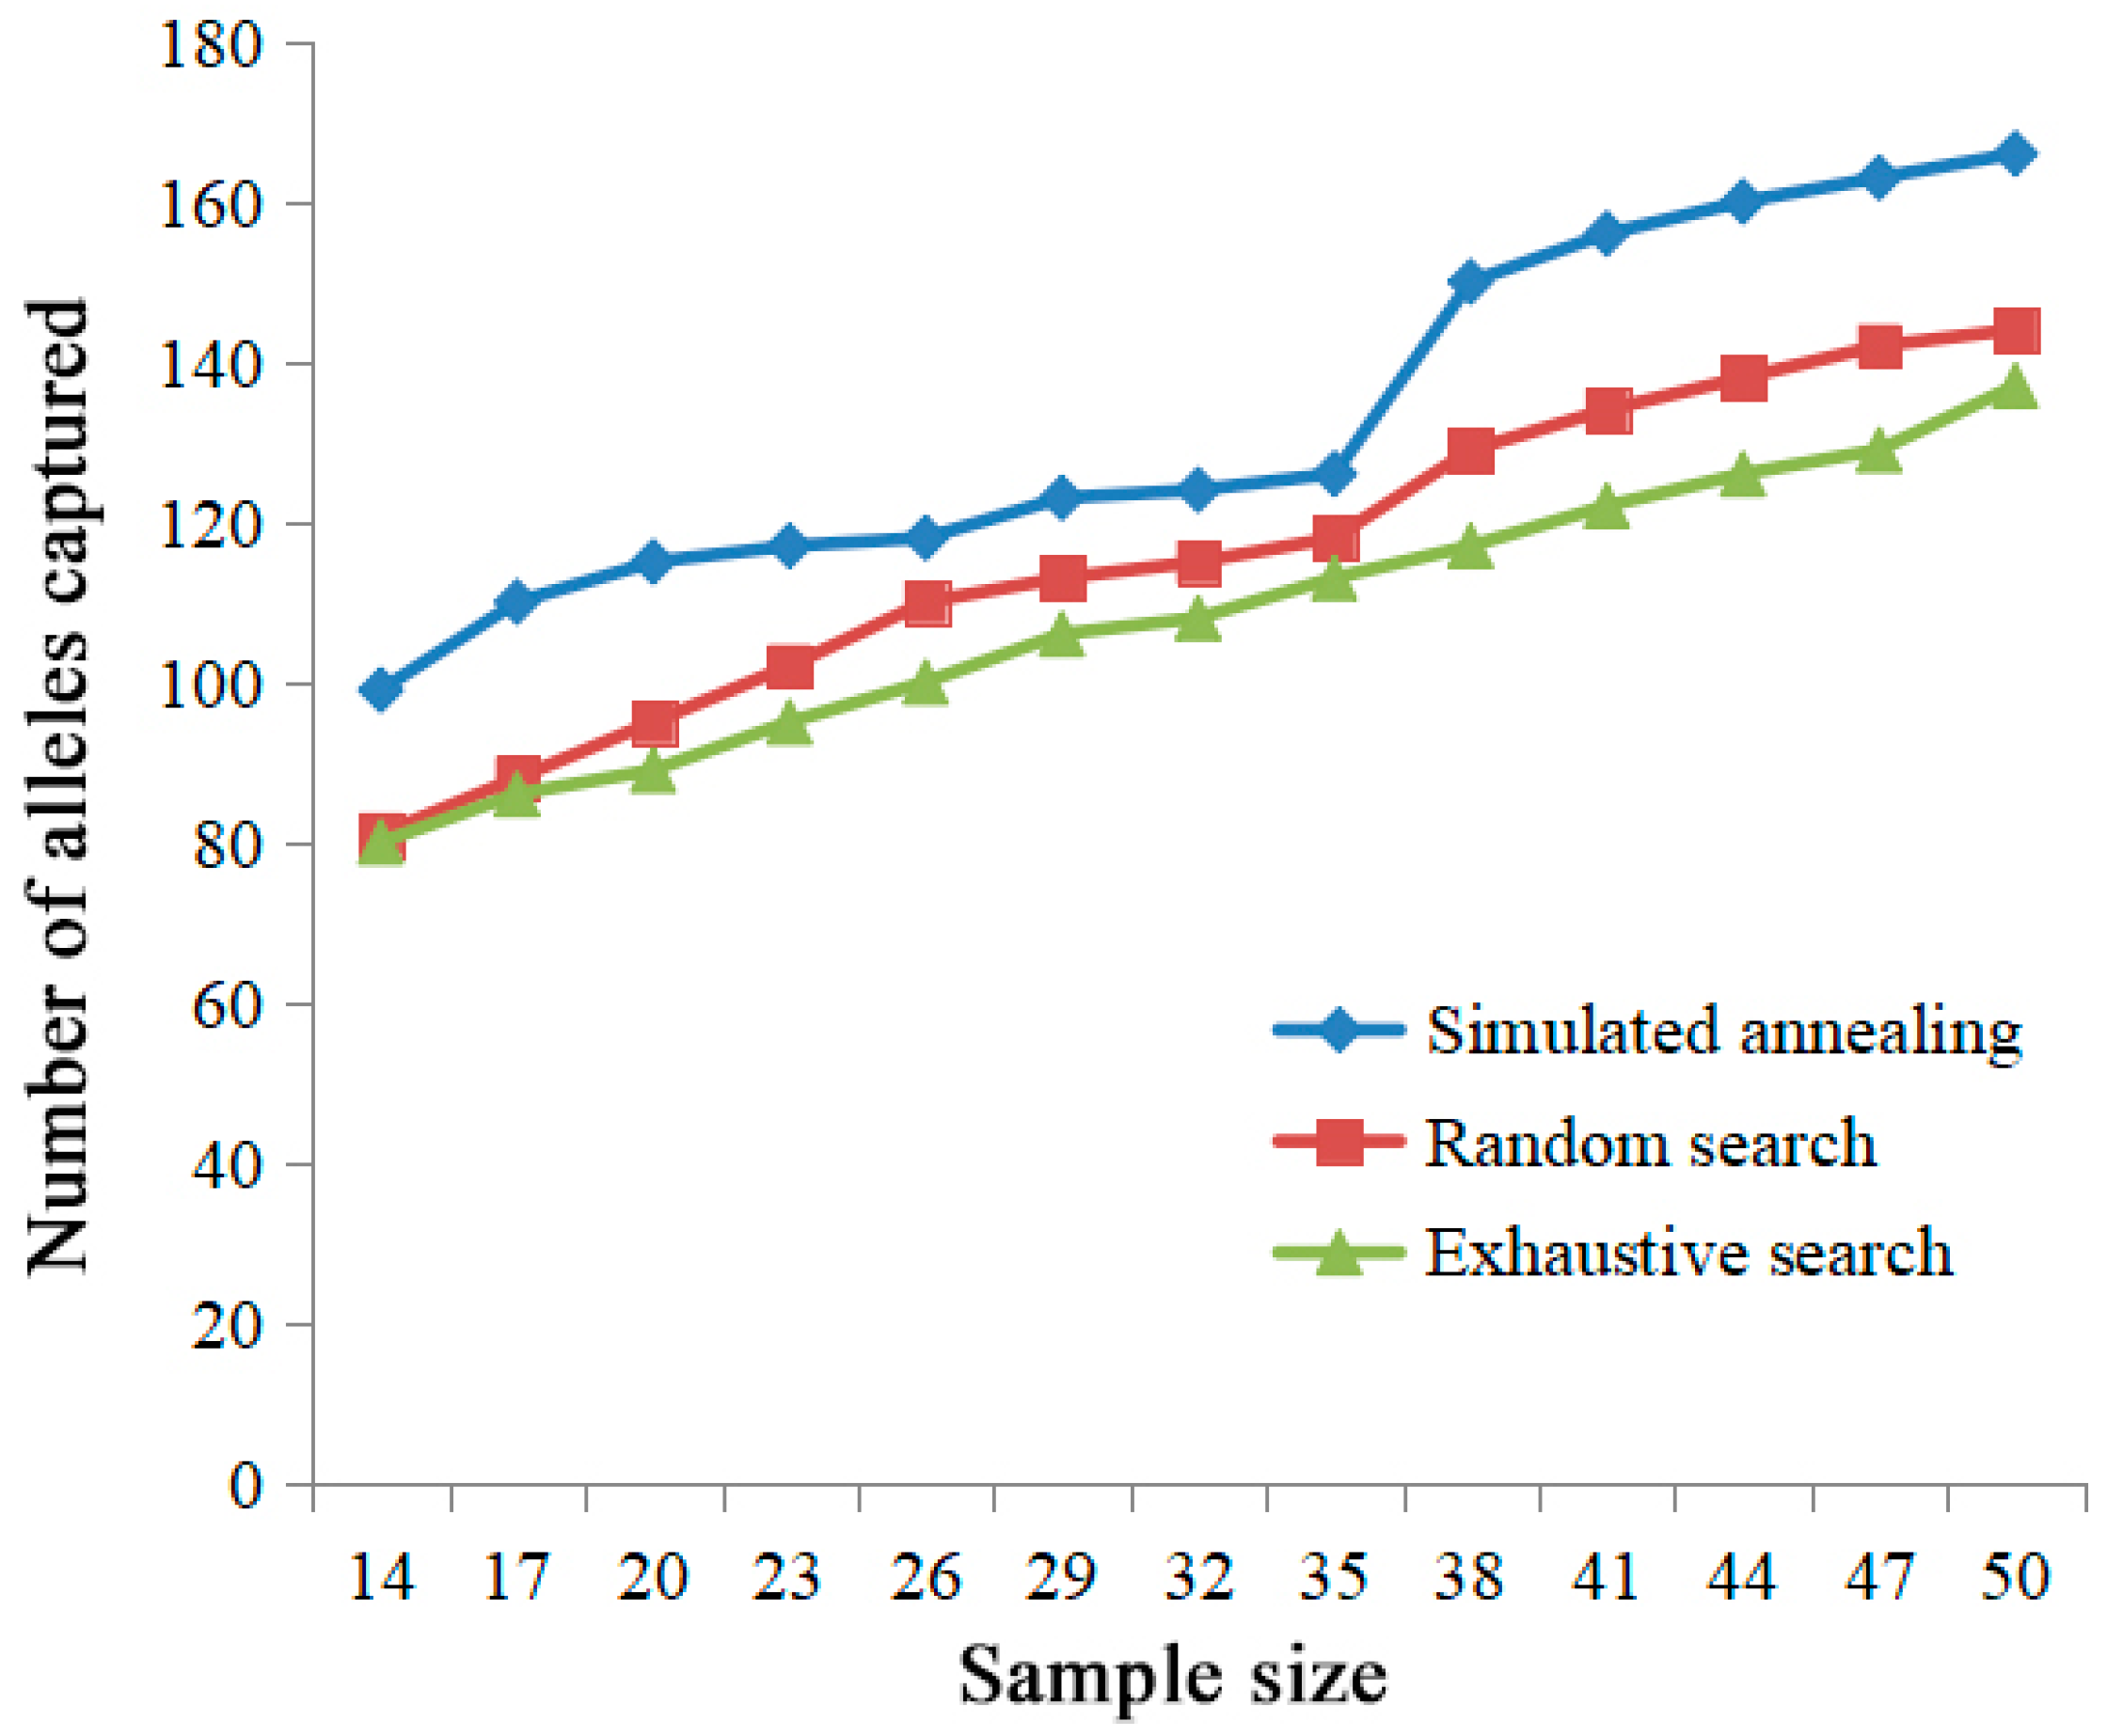
Figure 1. Comparison of the number of alleles captured using different search methods.
Agriculture 13 00200 g001
Figure 2. Scatter plot of allele frequency distribution between the core collections and the whole germplasms. The dots represents 160 alleles shared by the 44 core collections and the whole germplasms (166 alleles).
Agriculture 13 00200 g002
Figure 3. The cluster analysis of 44 core collections based on 16 EST-SSR loci.
Agriculture 13 00200 g003
Figure 4. Graphical representation of the allelic patterns across populations.
Agriculture 13 00200 g004
Figure 5. Illustration of barcodes and QR codes of the applied core individuals. (a) Barcode DNA molecular ID of C01; (b) barcode DNA molecular ID of C99; (c) QR code DNA molecular ID of C01; (d) QR code DNA molecular ID of C99.
Agriculture 13 00200 g005
Table 1. Observed probability of identity calculated from 144 accessions using GenAlex 6.5 on 16 EST-SSR loci.
SSR MarkerNumber of Identical
Pairs of Genotypes
Probability of
Identity
Cumulative Probability of
Identity
CAL8611234 × 10−24 × 10−2
CAL1066744.2 × 10−21.6 × 10⁻³
CAL165356.8 × 10−21.1 × 10⁻⁴
CAL813989.8 × 10−21.1 × 10⁻⁵
CAL1802429.9 × 10−21.1 × 10⁻⁶
CAL1811361 × 10−11.1 × 10⁻⁷
CAL1351201.2 × 10−11.3 × 10⁻⁸
CAL77901.3 × 10−11.7 × 10⁻⁹
CAL90461.3 × 10−12.2 × 10⁻¹⁰
CAL96331.6 × 10−13.6 × 10⁻¹¹
CAL156211.6 × 10−15.6 × 10⁻¹²
CAL143151.8 × 10−11.0 × 10⁻¹²
CAL5221.8 × 10−11.8 × 10⁻¹³
CAL18822 × 10−13.6 × 10⁻¹⁴
CAL16222.3 × 10−18.3 × 10⁻¹⁵
CAL7912.4 × 10−12 × 10−15
Disclaimer/Publisher’s Note: The statements, opinions and data contained in all publications are solely those of the individual author(s) and contributor(s) and not of MDPI and/or the editor(s). MDPI and/or the editor(s) disclaim responsibility for any injury to people or property resulting from any ideas, methods, instructions or products referred to in the content.