Abstract
Post-harvest diseases are one of the main causes of economical losses in the apple fruit production sector. Therefore, this paper presents an application of a knowledge-based expert system to diagnose post-harvest diseases of apple. Specifically, we detail the process of domain knowledge elicitation for constructing a Bayesian network reasoning system. We describe the developed expert system, dubbed BN-DSSApple, and the diagnostic mechanism given the evidence provided by the user, as well as a likelihood evidence method, learned from the estimated consensus of users’ and expert’s interactions, to effectively transfer the performance of the model to different cohorts of users. Finally, we detail a novel technique for explaining the provided diagnosis, thus increasing the trust in the system. We evaluate BN-DSSApple with three different types of user studies, involving real diseased apples, where the ground truth of the target instances was established by microbiological and DNA analysis. The experiments demonstrate the performance differences in the knowledge-based reasoning mechanism due to heterogeneous users interacting with the system under various conditions and the capability of the likelihood-based method to improve the diagnostic performance in different environments.
1. Introduction
The domesticated apple (Malus domestica) is the third most produced fruit in the world (after bananas and watermelons), with more than 87 million metric tons produced per year [1]. Apple trees are widely spread in moderate temperate agricultural areas, and their fruits can be stored for prolonged periods under controlled atmosphere conditions. However, physiological disorders and pathogenic diseases might occur during post-harvest storage and degrade crop quality and quantity, resulting in significant economic losses [2]. For example, pathogenic diseases were evaluated to cause production losses of up to 10% in integrated agriculture and up to 30% in organic agriculture in northern Europe [3]. Therefore, an expert system capable of responsively and effectively suggesting a proper diagnosis of the disease affecting the stored apples is crucial for this economic sector. Determining the best immediate damage containment technique and/or recommending a plant protection scheme for the following year is dependent on the identification of the exact pathogen species [4]. The system should process various macroscopic but subtle properties of the symptoms, such as texture, size, shape, and consistency of the rot, in order to properly detect the disease class. Thus, the expert system should provide a user interface able to extrapolate user feedback on visible symptoms of a diseased target apple, guiding its reasoning toward a reliable and valid diagnosis. Therefore, we desdigned BN-DSSApple a knowledge-based expert system developed on the framework of a Bayesian network (BN) [5], constituting a probabilistic graphical model to support the reasoning about uncertainty relationships among symptoms, features, and apple diseases. The user feedback (i.e., the evidence) is incrementally elicited through an adaptive question-answering interface, illustrated by visual explanation of the requested information in order to facilitate user understanding. Moreover, we developed of a diagnostic knowledge base, which represents the core of the reasoning mechanism of BN-DSSApple, together with a domain expert in phytopathology. We discussed the transferability problem of such an expert model to a larger cohort of users with different expertise levels and constructed a novel expert-users likelihood-based approach to deal with it. Finally, we created an explanation technique tailored to this BN reasoning system, illustrating the suggested diagnosis. We thoroughly evaluated BN-DSSApple under various experimental conditions, simulated by three user studies in order to prove the effectiveness of the system and its transferability across environments. The presented study builds upon and extends the preliminary research presented in [6].
The rest of this paper is organized as follows: In Section 2, we provide some context in the domain of post-harvest diseases of apple, and we analyze the related literature in the field of expert systems in agriculture, with a particular focus on Bayesian techniques. In Section 3, we detail the methodologies applied for the development of BN-DSSApple. The paper is organized as follows:
- (a)
- Section 3.1 gives a description of the application design and the implemented BN-DSSApple system;
- (b)
- In Section 3.2, the process of knowledge elicitation from domain expertise is illustrated;
- (c)
- In Section 3.3, the diagnostic mechanism responsible for suggesting diseases given user feedback is formalized;
- (d)
- In Section 3.4, the transferability problem of knowledge-based models is defined and an approach exploiting likelihood evidence proposed;
- (e)
- In Section 3.5, a novel BN reasoning-related explanation technique for the provided diagnosis is detailed.
2. Background and Related Studies
2.1. Post-Harvest Diseases of Apple
The apple (Malus domestica) is cultivated on a global scale in temperate regions, reaching a world gross production value of over USD 30 billion in 2020 [7]. Apple fruits provide a valuable contribution to human nutrition and are available throughout the year, as modern apple cultivars can be stored for a period of up to twelve months under controlled atmosphere conditions [2]. In the course of storage, however, apple fruit may deteriorate due to physiological disorders or infectious post-harvest diseases [8]. The most important post-harvest diseases of apple are caused by pathogenic fungi that can affect both the quantity and quality of the produce, not only during storage but also at the time of packing, shipment, and shelf life. The fungal species causing post-harvest diseases of apple can be divided into two groups: latent and wound pathogens [4]. Latent pathogens infect the apple fruit in the orchard, prior to the harvest, and remain asymptomatic for several months during storage. The maturation of fruit and the change in physiological conditions can finally favor the development of the pathogen and the onset of decay symptoms. Wound pathogens, in contrast, enter the fruit through injuries, lesions, or cracks, or due to physiological damage at harvest or at different post-harvest stages. In some cases, infections can spread through the contact with decaying fruit, resulting in nests of rotten produce. Some species of fungi not only induce direct post-harvest losses by rotting but are also associated with the production of mycotoxins, which can contaminate fruit and raise safety concerns [9]. As fungal post-harvest pathogens differ in their biological characteristics, effective disease determination is crucial for containing damages, setting sales and marketing priorities, and implementing a sanitation program, or—in case of latent post-harvest diseases—to define pre-harvest plant protection measures for the following season. The most accurate diagnostic methods are based on microscopic, microbiological, or molecular genetic examinations, which require dedicated laboratories and trained staff. A method for disease determination that requires the lowest technical effort and can be directly applied in packing houses is based on the observation of decayed fruit for the presence of macroscopic symptoms or fungal signs. The former include considering the appearance, color, texture, and consistency of the rot induced on the peel and/or the pulp tissue, whereas the latter comprise mycelium, fruiting bodies, or spore tufts. However, symptom-based disease diagnosis requires a good knowledge of the diseases involved and a trained eye of the user. Furthermore, symptoms can vary according to the cultivar, the stage of infection, as well as the cultivation and storage conditions. Therefore, a computer-guided decision support system would help practitioners to distinguish pathogens producing apparently similar symptoms in order to diagnose post-harvest diseases of apple onsite.
2.2. Expert Systems and Bayesian Networks in Agriculture
Expert and knowledge-based systems have attracted the attention of researchers and practitioners since the late 1980s. These systems aim at addressing complex diagnostic and decision-making tasks with the support of an encoded knowledge base. In agriculture, intelligent systems have been largely employed over the years to cope with the problem of diagnosing and preventing diseases and disorders that might appear at different stages of plant and fruit growth or parts of the plants and fruits, largely affecting the production result [10,11]. In the early years, such applications were mainly designed as case-based reasoning systems supported by static rules, for instance, encoded in the form of prolog-like [12] or ifthen rules [13], addressing the specific use case of potato diseases. Similarly, another stream of research has concerned the construction of expert systems for identifying specific weeds, insects, and diseases of olive trees [14] and pepper plants [15]. In this case, knowledge was collected by reviewing the technical literature and interviewing experts, as in the study discussed in this article. Moreover, the system adopted the traditional ifthen knowledge representation, and the application embedded digital images to help the user through the identification process.
More recently, systems have evolved that exploit smart interfaces to incorporate dynamic knowledge bases and provide reasoning by means, for instance, of fuzzy logic. One example is the web application for diagnosing oilseed crops, presented by Kolhe et al. [16]. A similar methodology was followed to support the handling of tomato diseases [17]. Authors exploited the object–attribute–value formalism for modeling the knowledge base, and they enhanced it with fuzzy logic to deal with the reasoning. From the same research group, an advisory expert system, called DIARES-IPM, with an integrated knowledge base, designed as a set of ifthen inference rules [18] was later presented. The objective of the system was to help non-experts to identify pests in crops and suggest appropriate treatments. Another interesting example of an expert system supporting knowledge elicitation with images was the Identificator system [19]. The framework takes advantage of macroscopic features (symptoms) of strawberries to diagnose the potential disease. Users select a sequence of predefined images and descriptions of symptoms to finally arrive at the correct diagnosis. Nevertheless, none of these methods were designed for the challenging task of apple disease diagnosis, based on the interactive observation of macroscopic symptoms on fruit. Furthermore, these approaches failed to model the knowledge in a probabilistic manner, to allow uncertainty both in the knowledge base and the reasoning mechanism.
The Bayesian network was introduced in the early years of artificial intelligence to deal with the problem of handling intrinsic uncertainty in the diagnostic process, especially in medical domain [20,21]. A Bayesian network (BN) [5,22] is a probabilistic graphical model defined by two components: a qualitative part, represented by its graphical structure; and a quantitative part, consisting of conditional probabilities. Formally, a BN is represented as a directed acyclic graph (DAG) , where denotes the set of l nodes, and is the set of directed edges between pairs of nodes. Each node in the DAG is mapped one-to-one with a random variable , where denotes the set of random variables involved in the model. A random variable is constituted by a set of exclusive values (or states) in which the variable might be observed , where denotes the jth value of variable . We use the notation for an observed event to express that variable is observed (or instantiated) in the state . A conditional probability table (CPT) is associated with each random variable . The CPT specifies the conditional probability distribution over the states of , where represents the set of conditional probabilities in the model, and denotes the set of parents of the variable associated with node in the DAG (i.e., the nodes directly connected with an incoming edge to ). Those CPTs allow probabilistic computation of the joint distribution (i.e., the reasoning) over the space of the variables in the BN model through the probability factorization , usually referred to as the chain rule for Bayesian networks [22].
In the agricultural sector, BN models have been adopted by researchers and practitioners for a wide range of applications, but few of them were specifically designed for post-harvest or in-field disease diagnosis. For instance, Bayesian modeling has been exploited to investigate the dependencies between yam planting practices, early growth variables, and crop yields in west Africa [23]. Similarly, Villordon et al. focused on predicting storage root initiation, growing degree days to harvest, and yield grades in sweet potato grown in Louisiana [24]. BN models learned from data were developed to diagnose different crop infections, such as coffee rust disease [25] and maize diseases [26]. Finally, Yu et al. developed a generalized two-layered BN model for diagnosing crop and animal diseases, founded on a noisy OR assumption [27]. With our study, we aimed at merging these different practices by providing an expert system with a dynamic interface able to support apple disease diagnosis under uncertainty and based on a BN derived from domain knowledge.
3. Materials and Methods
3.1. System Design
The proposed expert system, dubbed BN-DSSApple, was designed as an interactive application allowing users with varying levels of domain expertise in the field of apple production (e.g., growers, quality controllers, and storage workers) to diagnose post-harvest diseases of apple fruit, based solely on macroscopic symptoms observed on harvested fruits. The system is composed of a dynamic user interface that collects feedback from users (i.e., the evidence) on an apple fruit instance (i.e., the target apple), and a reasoning engine, which proposes a diagnosis (i.e., a ranked list of suitable diseases) based on the collected evidence. The reasoning mechanism is supported by a BN with an ad hoc knowledge base, developed in collaboration with a domain expert (as described in Section 3.2).
In detail, the system gathers user feedback on the target apple by asking a series of multiple-choice questions regarding the macroscopic features of the symptoms they might observe (e.g., the size of the rot, color of the fungal growth, etc.). Each question is accompanied by illustrative images to aid even non-expert users in their comprehension. Each question is mapped to a specific random variable in the BN model, where refers to the set of symptom variables. This component of the system is dynamic, because it progressively modifies the question path based on users’ prior responses. For instance, when the application collects evidence that fungal growth is visible on the diseased apple, it inquires about additional characteristics of these fungi and spores (i.e., distribution, color, and origin). Furthermore, interaction with the system is highly flexible, allowing users to walk the question path back and forth, rethink prior responses, submit multiple answers to a single question, or skip “difficult” questions. Figure 1 depicts an example of the interface of BN-DSSApple.
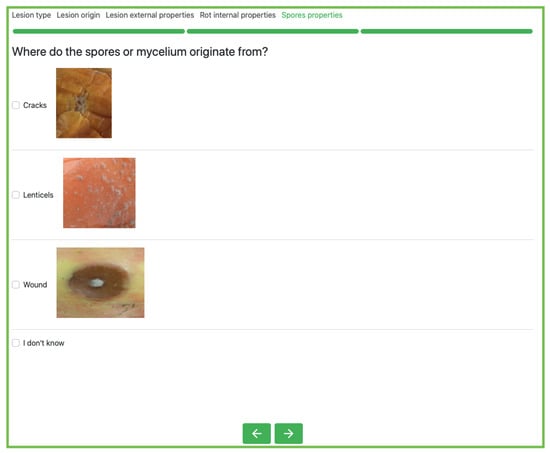
Figure 1.
A round of feedback collection of BN-DSSApple, where the application asks about the origin of fungal growth.
Having finished evidence collection, the user receives the diagnosis result. Namely, the application displays a short list of suitable diseases (typically three) based on the information gathered. Each candidate disease is ranked in the diagnosis list on a score representing the confidence in the diagnosis computed by the BN-DSSApple reasoning system. The score is defined by the posterior probability of a disease given the evidence collected for the BN model. Moreover, each suggested disease is supplied with an explanation, motivating the suggestion in light of the user feedback, namely, the most peculiar answers given by the user to the system related to that disease.
3.2. Knowledge Elicitation
Two alternatives exist for developing a diagnostic reasoning system based on a BN (i.e., defining both the network structure and the CPTs): learn it from data or elicit information from domain literature and experts, or any mix of the two. To the best of our knowledge, no large datasets for learning significant connections between apple post-harvest diseases and visible symptoms are publicly available. We overcame this issue by directly involving a domain expert (i.e., a professor in the field of apple phytopathology) in the process of constructing the BN-DSSApple knowledge base. Namely, we articulated this process into two distinct phases: in the first phase, we identified the random variables (i.e., the macroscopic symptoms) that are relevant for the disease diagnosis, and we determined the network structure; during the second phase, we quantitatively estimated the probability distributions (i.e., the CPTs) connecting the diseases to the observable symptoms.
We first asked the domain expert to elicit the variables related to visible signs and symptoms characteristics that she considered relevant to the diagnosis of post-harvest diseases of apple. After some rounds of interview, we agreed on a set of 27 discrete random variables (12 boolean and 15 categorical) related to macroscopic attributes that can be observed on infected apple skin and pulp, together with two hidden (target) variables, namely Disease and Stage. We assumed that a target apple can be infected by only one disease, which is a strong yet realistic assumption, allowing us to drastically reduce the complexity of our BN model by imposing mutual exclusivity among diseases. We also postulated that the symptom variables are conditionally independent given the Disease variable, as formalized in the naïve Bayes algorithm [22]. Thus, the random variable Disease encodes the whole set of fungal diseases in our study, namely the seven diseases Val(Disease) = {alternaria_rot, alternaria_spot, bitter_rot, blue_mold, bulls_eye, grey_mold, mucor_rot}. The Stage random variable was introduced to better formalize the progression of the disease during the process of knowledge elicitation. The variable represents three discrete and symbolic stages of advancement of post-harvest infection, namely Val(Stage) = {early, medium, late}. Finally, we exploited the collected domain knowledge to identify conditional independence across variables and hence prune the graph from unnecessary edges. For example, we modeled the fact that variables related to lesion origin are conditionally independent from the stage of the disease.
Figure 2 displays the BN-DSSApple graph. The two hidden diagnosis variables, namely Disease and Stage, are represented by the bolded and empty nodes in the center of the network. The nodes concerning the lesion properties are colored grey at the top of the network. The rot properties are colored yellow on the right-hand side, and the lesion-origin nodes are colored green on the left-hand side. Finally, the nodes relating to lesion type and other traits are colored orange in the central-bottom section, with nodes reflecting the attributes of other traits colored blue underneath them. The detailed list of all the random variables and their states included into the BN model are reported in Appendix A.
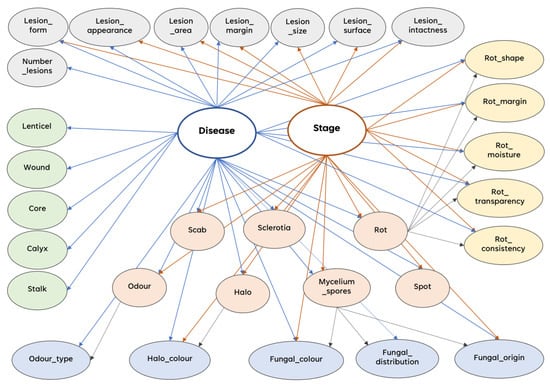
Figure 2.
The Bayesian network graphical structure.
In the second phase, we interviewed a domain expert to extrapolate the quantitative probabilistic dependencies among variables. Given the conditional (in)dependencies defined in the previous stage, we elicited the conditional probabilities of symptom variables given the states of both the hidden variables (i.e., Disease and Stage) or just the Disease variable. We refer to the Disease variable as , where is the set of hidden variables for the model. represents the set of states of the variable D, where is the ith state of the Disease variable (i.e., the ith disease in the knowledge base). The Stage variable is defined as , and represents the set of states of variable T, where is the ith state of the Stage variable. All other (observed) variables in the model are referred to as symptom variables and belong to the set . Generally, a symptom variable is represented by its set of states , where is the jth state of the symptom variable . Moreover, we adapted the procedures described in [28] for eliciting expert probabilities of our network. Specifically, we opted for a mixed symbolic questionnaire to allow the expert to express the conditional probability of each symptom with respect to a given disease. In more detail, two techniques were applied depending on the support of the variable. For boolean variables (for each symptom variable such that ), the expert was systematically requested to answer the following question: “How frequently do you observe symptom , given that you have an apple infected by disease at stage ?”. We allowed her to choose the response on a pre-defined 6-point scale including always (A), very often (V), often (O), sometimes (S), rarely (R), and never (N). The expert had to provide the answer for each combination of . This symbolic scale was converted into an actual probability value according to the scheme reported in Table 1, adapted from similar studies in the medical domain literature [28,29].

Table 1.
Scale to convert expert answers into probability values.
For categorical variables (i.e., each symptom variable , such that , where ), the described probability elicitation process would have been too burdensome for the expert. Thus, we decided to use a simplified approach. For each categorical symptom variable , given a disease at stage , the expert was asked to simply report which values of are likely to be observed and with which frequency (i.e., commonly, less commonly, rarely). This approach is justified by the fact that many symptoms are never observed under specific conditions (i.e., combination of disease and stage) and hence, can be ignored to speed up the elicitation process.
We want to stress that the described process of knowledge elicitation, despite being designed for our particular application, can be easily extended to other domains in which experts are involved in the construction of a BN reasoning mechanism.
3.3. Diagnosis Computation
In this section, we describe how the system suggests a ranked list of suitable diseases (i.e., a diagnosis) after user feedback elicitation on a target apple is terminated. The BN reasoning system was implemented with the Python package pomegranate (https://pomegranate.readthedocs.io/en/latest/ (accessed on 10 May 2021). The BN framework allows performing the inference, namely, to compute the posterior probability distribution on a target unobserved variable (i.e., the Disease variable D), given any set of observed variables inputted by the user (i.e., the evidence ) by answering the proposed questions. The evidence set is incrementally built by the system. At each step, the application invites the user to answer a multiple-choice question related to a symptom variable . When the user submits the observed value , BN-DSSApple includes the new information into the evidence set, . The BN inference mechanism is robust to missing values, and the user is not forced to provide observations for every single symptom variable in the model. Therefore, the user can always skip a problematic question related to a variable , which will not be appended to the evidence set , i.e., . Eventually, at the end of the elicitation process, the system has gathered the whole information available for the user, and the reasoning system is able to compute the probability distribution over the set of candidate diseases as follows. We estimate the posterior probability distribution through the loopy belief propagation algorithm [30], as implemented in pomegranate. Loopy belief propagation is an approximate message-passing method used to perform inference on graphical models.
The posterior probability computed for target apple a when evidence is collected is considered a diagnosis score for each disease . Namely, this probability distribution represents the confidence of the system over each disease being the correct diagnosis for the target apple a. Formally, given the evidence set , the diagnosis score related to target apple a for disease is computed as:
The ranked list of the k suggested diseases shown to the user is then based on the score for each disease, such that . The parameter k controls for the capability of the system to show more or less candidate diseases to the user. In our evaluation, the parameter was set to .
3.4. Knowledge Model Transferability
In knowledge-based modeling, and similarly in standard machine learning, we frequently confront the difficulty of transferring a built model to a different environment (i.e., providing external validity). This issue is known as the transferability problem [31]. It may be challenging to allow a large number of users, with varying levels of competence, to properly and effectively use a diagnostic expert model, built on domain-specific knowledge. The knowledge base of the BN-DSSApple application was constructed with the information gathered from the knowledge and the experience of a domain expert. However, different groups of users, with less experience in the field, might perceive the same attributes (i.e., the symptom characteristics) differently. User perception is influenced by their own experience and personal knowledge biases. This behavior may mislead the user during the feedback elicitation process and hence corrupt the diagnostic effectiveness of BN-DSSApple. In this section, we formally define the problem of transferability in our context, and we suggest a practical approach to bridge the gap between the expert model and user perception.
In our application scenario, the transferability problem is defined as the mismatch between the BN probability distributions (CPTs) defined by the expert, and the probability distributions produced by the usage of the system. The expert, during the knowledge elicitation phase (as described in Section 3.2), implicitly stated a complete probability distribution set , given the set of symptom random variables and a target disease . During testing, the users of the BN-DSSApple application generated a set , of u observations, where represents the evidence submitted by a user during the ith diagnostic session (i.e., a set of observed symptom variables), and is the corresponding ground-truth disease. From , another set of probability distributions can be derived. However, this set of distributions is typically different from the one defined by the expert, namely . Thus, the problem is to find a transferability function that can be applied to the expert model such that .
The transferability problem is well known in machine learning and statistics and it has been framed in causal terms, referred to as transportability [32,33], as well as in the context of supervised learning, where it is also named covariate shift or sample selection bias [34,35]. One of the most popular approaches applies a direct correction to the learned probability distribution based on the test set estimation [31]. Inspired by the previous work on likelihood evidence [36], we designed a methodology tailored to our BN-based diagnostic application to adjust the expert-defined distribution toward the one derived by user interactions . The presented technique can be easily generalized to other domains, where the transfer learning of BN parameters is a problem to be addressed (e.g., when the users struggle to correctly identify the observable evidence produced by a phenomenon). We define the likelihood evidence (or likelihood finding) for each symptom variable of the BN-DSSApple model. Specifically, when a symptom variable is observed and instantiated by a user during a diagnosis, we assume that a degree of uncertainty is associated with it, which can be practically explained as the difference in perception and experience between the user and the expert. Thus, we assign the actual user observation to an auxiliary random variable , such that , to distinguish it from the variable as it should be observed by an expert in the same diagnostic context. We represent the uncertainty degree with a likelihood ratio as:
which defines the probability of a user observing value given that, in the same context, the expert would have observed . Thus, we enriched our BN by adding, for each symptom variable , a virtual likelihood evidence node that encodes the likelihood ratio with . The added set of random variables is now the one observed by the user while submitting the evidence on the questions proposed by the application. Finally, we needed to estimate a new set of conditional probability tables for each pair . We developed a direct estimation technique from the observed interactions of users with a set of apples , whose actual observed value by the expert is known. Namely, for each state of each variable , we define the subset , whose observed value by the expert for symptom is . The conditional probability of the users observed value is defined as:
where is an indicator function that is equal to 1 if the user observed in apple , and 0 otherwise. The defined conditional probability for the likelihood ratio is also referred as consensus among expert and users. We replicate this procedure for all the observable states in and for all the possible subsets in in order to generate the desired set of likelihood evidence for each symptom variable and, hence, the transferability function .
3.5. Diagnosis Explanation
Explanation is a crucial element in modern artificial intelligence. In real-world applications, a suitable explanation increases trust in the model by allowing its decisions to be understood by humans [37]. This is especially relevant in cases where decisions can have significant economical consequences, if not on human well-being (e.g., in the medical area). Previously presented methods in the area of BN explanation were reviewed by Lacave et al. [38]. The authors classified the explanation approaches into three categories: explanation of reasoning, explanation of the model, and explanation of evidence, according on the BN components interested in the explanation.
Following this nomenclature, we present a novel BN reasoning-related explanation technique, which is inspired by the forward feature selection algorithm [39]. The purpose of our method is to decide which subset of the collected evidence better justifies a specific diagnosis (i.e., a suggested disease). In formal terms, given the full set of evidence submitted by the user, we want to find the subset , with size n, which represents the best explanation (i.e., the most representative evidence set) toward the diagnosed disease . Our algorithm receives as input the user’s evidence , a target diagnosis , and an integer number , namely, the size of the subset of evidence that should explain the diagnosis d. A piece of evidence corresponds to the observation of a symptom random variable , as submitted by the user to the application. The complete procedure is formalized in Algorithm 1. At the beginning, the algorithm initializes an an empty set and, at each iteration t, it searches for the best piece of evidence to be added to the set . Specifically, the best evidence set at time t is identified by maximizing the likelihood function of evidence toward diagnosis d, where the temporary set is iteratively constructed as for each . It is important to mention that when a piece of evidence is selected at around t and added to , it is consequently removed from . This process iterates until the best subset of evidence of cardinality n for diagnosis d is constructed.
| Algorithm 1 The BN-DSSApple explanation algorithm. |
| Input: ; ; |
| Output: |
| 1: Initialize |
| 2: |
| 3: while do |
| 4: for each do |
| 5: |
| 6: |
| 7: compute |
| 8: if then |
| 9: |
| 10: |
| 11: end if |
| 12: end for |
| 13: |
| 14: |
| 15: |
| 16: end while |
We define the likelihood function for a subset of evidence with respect to a target disease , as its measure of normalized likelihood (NL) [22]. Thus, we compute with the following equation:
measures the degree of significance of a subset of evidence on the target disease d. By comparing the normalized likelihoods of different subsets of the evidence, we compare the impact of these subsets on the target variable D. Investigating the impact of various subsets of the evidence on states helped to determine which of those subsets are providing an explanation in favor of (or against) each possible hypothesis state (i.e., suggested disease) .
4. Experiments and Results
4.1. Experimental Study Setup
We conducted a wide user-centered evaluation to test the effectiveness of BN-DSSApple in identifying and suggesting the correct diagnosis. Specifically, we elaborated three distinct user studies to test the system behavior under different circumstances. The task proposed to the users was identical in all cases. Each user received a “bucket” of diseased apples, for which she had to find the correct diagnosis leveraging the BN-DSSApple application. Each target apple was simulated with a pair of high-resolution photos depicting an interior and an exterior view of the apple in analysis, and for which the (hidden) ground-truth disease was obtained in a laboratory by microbiological analysis. During each diagnostic round, the user had to carefully scrutinize the target apple and interact with the system by answering the proposed questions and providing information (i.e., the evidence) about the symptom and sign characteristics they were able to identify on the apple. At the end, BN-DSSApple proposed a ranked list of three suggested diagnoses, i.e., the three diseases with the highest posterior probability given the evidence, as computed by the BN.
The three user studies differed in the number of users, their expertise level, and the number of distinct target apples involved. We incrementally increased the complexity of the environment in which the system was tested to evaluate its robustness and transferability. In details, we performed:
- Single-Expert Study (SES): A single domain expert (a professor in phytopathology) leveraged the BN-DSSApple application to diagnose 21 target apples in a time-span of around 2 weeks.
- Single-User Study (SUS): A single user (a M.S. student in biology) interacted with BN-DSSApple application during the course of an internship, lasting around 1 month, to diagnose 131 target apples.
- Multiple-User Study (MUS): A group of 11 students from a phytopatology class interacted with the application to diagnose a bucket of 7 target apples each; the apples were randomly sampled with stratification over disease from the same set of 21 apples used for SES, and the activity lasted 4 h (in-class activity).
In Table 2, we summarize the metadata of the three conducted user studies.
Table 2.
Metadata of the three user studies: Single-Expert Study (SUS), Single-User Study (SUS), and Multiple-User Study (MUS).
4.2. Results
In Table 3, we summarize the results of the three user studies in terms of recall@k. We define recall@k as the share of diagnoses (i.e., the ranked list of k recommended diseases) correctly identifying the ground-truth disease for a given target apple. We benchmarked the presented results with the ZeroR baseline (i.e., a naïve classifier that always selects the most prominent class), averaged across the three studies.
Table 3.
Recall@k for the three user studies performed, Single-Expert Study (SES), Single-User Study (SUS), Multiple-User Study (MUS), and the ZeroR benchmark.
The results presented in Table 3 show that the theoretical effectiveness of the BN-DSSApple model is very high. Specifically, an expert (SES), with strong knowledge in phytopathology of apples and an appropriate capability of identifying symptoms on a diseased apple was able to achieve a recall@1 above the 90% with the help of BN-DSSApple. The performance of the system reached 100% recall when evaluated at a larger cut-off k. We stress that in the SES evaluation, we were in the ideal situation in which the user was perfectly able to understand and identify on the target apple the symptoms properties requested by BN-DSSApple. A more realistic situation is depicted by the SUS evaluation. In this case, a single user with a medium level of expertise had weeks of time to interact with the system and train herself by evaluating a very large set of apples (131). The performance of BN-DSSApple for the recall@1 was still convincing (49%), i.e., the correct disease was recognized and suggested in approximately half of the trials. The other metrics testified how the system is not perfectly able to scale-up by extending the diagnosis list cut-off, achieving 66% on recall@2 and 76% on recall@3 (the correct disease was within the first three suggestions in 3/4 of the trials). Finally, in a situation such as the MUS assessment, where users have limited knowledge and training, as well as a limited amount of time (a few hours) to used the system, BN-DSSApple presented major flaws. In addition to the time and skill factors, a lack of intrinsic motivation to engage with the system as accurately as possible might be a factor explaining such behavior. In this study, the measured recall of the system was significantly lower than in the two previous evaluations. Specifically, recall@1 was below 30%, while the best result was achieved by recall@3 with 57%, meaning that slightly more than half of the diagnoses include the correct disease in the top three suggestions. Nevertheless, despite the poor performances of BN-DSSApple in MUS, the collected results were still superior to those of the ZeroR benchmark. In the comparison with ZeroR, the MUS evaluation for BN-DSSApple showed a doubling in recall@1 (28.6% against 14.3%), while the difference in recall@2 and recall@3 was lower but still significant (+12% and +14%, respectively). The major cause of the reported mismatch in performance among expert and averaged users might be studied in the transferability problem of the knowledge model. In the remaining part of this section, we empirically analyze this phenomenon and evaluate alternative approaches to correct and alleviate it.
First, we investigated the impact of each attribute in the transferability of the model. In Table 4, we rank the list of attributes based on the likelihood ratio (i.e., consensus or level of agreement) computed between the logged interactions of the users of MUS and the expert of SES (considered as ground truth) in the task of recognizing the symptom characteristics on the same set of 21 target apples. The users were effective in identifying the principal symptoms and signs, included in the application as boolean variables. Namely, Sclerotia (99%), Rot (96%), and Spot (95%) presented a very high level of agreement with the expert, while consensus onMycelium_spores (81%) and Halo (78%) was quite high. On the other hand, some qualitative attributes related to the appearance or the consistency of the lesion and the rot were among the hardest to correctly recognize by the users (i.e., users achieved a poor consensus with the expert). For example, Lesion_appearance and Rot_consistency had a level of agreement below 50%, while the agreements for Lesion_margin, Lesion_area, and Rot_transparency were below 65%. Nevertheless, other categorical variables, related to quantitative aspects of the lesion, were easier to be correctly recognized. This was the case for the variables Lesion_size, Lesion_surface, Lesion_form, and Lesion_intactness, which showed a consensus between 84% and 79%. The behavior of the variables belonging to the Lesion origin category is relevant to analyze. The majority of them were straightforward to be correctly identified by the users, with an expert agreement above 90%. Nonetheless, two of them, Wound and Lenticel, were equally difficult to be distinguished, with a consensus of around 59%. This may have been due to the fact that the two origins may be perceived as similar and can be easily mistaken without a more careful examination of the target apple.
Table 4.
Attributes ranking based on the consensus of users in the MUS with the domain expert of SES.
In Figure 3, we display the recall@kobtained by BN-DSSApple for MUS and SES, by incrementally including the attributes in the model, based on the agreement ranking in Table 4. On the x-axis, we indicate the number of attributes in each model configuration. Namely, i represents the BN model constituted by the attribute set , where rank j of attribute is defined by the consensus, as reported in Table 4. From the graph in Figure 3a for MUS evaluation, we see how the model obtained the best performances for recall@1 and recall@2 with around 7–8 attributes. A larger set of attributes is counter-effective, causing a drop of recall of at least 10% in both situations. The performance seems to recover with the models based on 21–22 attributes. For the recall@3 metric, the model with 20 attributes achieved the optimum, with a significant improvement of roughly 10% over the other configurations of the model including fewer attributes. The graph in Figure 3b reveals the opposite considerations for the SES evaluation. The recall@k linearly correlated with the number of attributes, and the best results were always obtained when all the attributes are used. This means that the expert was able to correctly instantiate even the harder variables, with a correct comprehension of the status of an infected apple. Moreover, these hard-to-recognize attributes are required to considerably increase the model’s diagnostic efficacy and obtain the best recall@k result. For both recall@2 and recall@3, the BN model achieves roughly a +20% improvement by including the entire set of 27 attributes rather than just 21 attributes (i.e., by discarding the six “hardest” attributes, with lowest consensus).
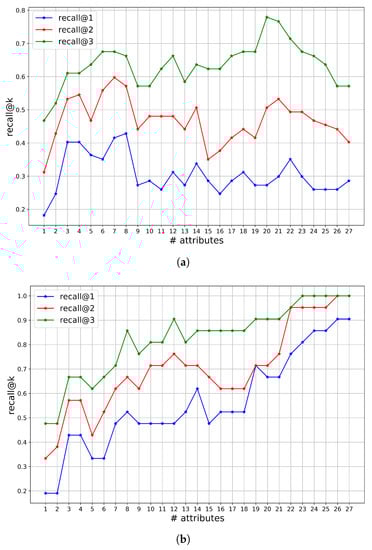
Figure 3.
Recall@k by incremental selection of attributes based on ranking of Table 4 for MUS (a) and SES (b).
Finally, in Table 5, we compare the results of the adapted versions of the BN model for the MUS evaluation in order to cope with the transferability problem discussed in Section 3.4 that emerged from the previous analysis. First, the trained BN model (TRAIN-BN), where the network parameters were fine-tuned on the MUS data with a maximum likelihood estimation (MLE) algorithm [5], provided a marginal enhancement. The recall@1 improvement was minimal (around +2.5%), while recall@2 showed a +6.5% improvement with respect to the original BN model. We already discussed the significant benefit obtained by picking the optimal attribute set (BEST-ATTR model), with a gain in recall ranging between +14% and +21%. Nonetheless, this analysis was extrapolated a posteriori, with the ideal number of attributes fixed after the evaluation of the results. Thus, the performance of the model equipped with likelihood evidence (LH-EV, methodology detailed in Section 3.4, where expert ground-truth data were derived from SES) was even more surprising. For recall@1, the LH-EV marginally outperformed TRAIN-BN by around +4%, while being slightly inferior to BEST-ATTR (−8%). Nevertheless, for recall@2, the likelihood evidence method obtained the best result, outperforming BEST-ATTR by a small margin (around +2.5%). Finally, for recall@3, the LH-EV model significantly outscored TRAIN-BN (+13%), while obtaining comparable results to BEST-ATTR.
Table 5.
Recall@k for MUS considering the original expert-defined BN-DSSApple (BN), the BN-DSSApple trained on MUS data (TRAIN-BN), the incremental best attribute selection (BEST-ATTR), and the BN-DSSApple refined by likelihood evidence (LH-EV). For the BEST-ATTR column, we report the results for the optimal attribute set, with the number of selected attributes in parentheses.
5. Discussion and Conclusions
We presented BN-DSSApple, a knowledge-based expert system for the diagnosis of post-harvest apple diseases. This study focused on the process of knowledge elicitation from a domain expert in order to craft a BN-based reasoning mechanism. The effectiveness of BN-DSSApple was thoroughly tested under different conditions in three user studies. The model showed high diagnostic accuracy when a single user with sufficient domain expertise was using the system. Nevertheless, a transferability problem emerged when multiple users with different understandings of the domain were involved in the study. Thus, we further investigated the impact of the model’s attributes on the system performance, and we proposed an ad hoc adaptation of the likelihood evidence technique [36], which we proved was capable of increasing the accuracy of BN-DSSApple when used by a heterogeneous cohort of users. Despite being focused on a specific application scenario, the presented methodology can be generalized to other domains. For instance, the knowledge extraction process can be easily applied to similar diagnostic expert models [16,19,27], where the intervention of an expert is required to learn an effective reasoning mechanism. Moreover, the presented use case provides further evidence toward explicitly leveraging de-biasing techniques (such as the proposed adaptation of likelihood evidence) to cope with the problem of transferability in a knowledge-based model [31]. The major limitation of the study is that the knowledge base was fully constructed on qualitative probability elicitation from a single human expert; hence, the extracted parameters might be biased toward her perception. In future work, we plan to extend the knowledge elicitation procedure to a panel of experts [28]. The parameters’ elicitation based on their consensus will contribute to alleviating diagnostic model bias. Furthermore, the transferability problem of the crafted BN must be additionally investigated in different environments, and other techniques based on causal transportability [32] might be explored. In future work, the integration of additional evidence such as the automated processing of microscopic images of fungal spores will be considered. Currently, we are focusing on the development of a hybrid version of the application including pictures of diseased apples with which to interact [40,41], as well as on the deployment of the application for in-field evaluations.
Author Contributions
Conceptualization, G.S., S.B., F.S. and M.Z.; methodology, G.S., F.S. and M.Z.; software, G.S.; validation, G.S., S.B., F.S. and M.Z.; formal analysis, G.S., F.S. and M.Z.; investigation, G.S., S.B. and M.Z.; resources, S.B. and M.Z.; data curation, G.S., S.B. and M.Z.; writing—original draft preparation, G.S.; writing—review and editing, G.S., S.B., F.S. and M.Z.; visualization, G.S.; supervision, S.B., F.S. and M.Z.; project administration, M.Z.; funding acquisition, M.Z. All authors have read and agreed to the published version of the manuscript.
Funding
The authors acknowledge the Free University of Bozen-Bolzano for funding the project “Development of a decision support system for the determination of postharvest disorders and diseases of apple—DSSApple” (Project Code IN2067—ID Call 2017). This work was supported by the Open Access Publishing Fund of the Free University of Bozen-Bolzano.
Institutional Review Board Statement
Not applicable.
Informed Consent Statement
Not applicable.
Data Availability Statement
Not applicable.
Conflicts of Interest
The authors declare no conflict of interest.
Appendix A. Variables and States
Table A1 lists all variables included in the BN-DSSApple model as described in the graph in Figure 2.
Table A1.
Random variables and states included in the BN-DSSApple model, grouped by category.
Table A1.
Random variables and states included in the BN-DSSApple model, grouped by category.
| Category | Variable | States |
|---|---|---|
| Diagnosis | Disease | {alternaria_rot, alternaria_spot, bitter_rot, blue_mold, bulls_eye, grey_mold, mucor_rot} |
| Diagnosis | Stage | {early, medium, late} |
| Lesion type | Rot | {true, false} |
| Lesion type | Spot | {true, false} |
| Lesion type | Scab | {true, false} |
| Other symptoms | Halo | {true, false} |
| Other symptoms | Mycelium_spore | {true, false} |
| Other symptoms | Sclerotia | {true, false} |
| Other symptoms | Odor | {true, false} |
| Lesion origin | Lenticel | {true, false} |
| Lesion origin | Wound | {true, false} |
| Lesion origin | Calyx | {true, false} |
| Lesion origin | Stalk | {true, false} |
| Lesion origin | Core | {true, false} |
| Lesion properties | Number_lesions | {single, few, multiple} |
| Lesion properties | Lesion_form | {circular, irregular} |
| Lesion properties | Lesion_margin | {sharp, indistinct} |
| Lesion properties | Lesion_area | {plane, flat, sunken, collapsed} |
| Lesion properties | Lesion_appearance | {dry, watery, baked} |
| Lesion properties | Lesion_surface | {unwrinkled, slightly_wrinkled, wrinkled, corky} |
| Lesion properties | Lesion_crack | {uncracked, cracked, parchment} |
| Lesion properties | Lesion_size | {xs, s, m, l, xl} |
| odor properties | Odor_type | {sweet_cider, earthy_musty, bandage} |
| Halo properties | Halo_color | {brown, red, yellow, light_green} |
| Spore properties | Spore_color | {white, grey, dark_grey, pink, yellow, brown, green_blue, peppered} |
| Spore properties | Spore_distribution | {random, concentric} |
| Spore properties | Spore_origin | {wound, lenticels, cracks} |
| Rot properties | Rot_shape | {conical, rounded, irregular} |
| Rot properties | Rot_margin | {sharp, indistinct} |
| Rot properties | Rot_texture_dry | {dry, moist, juicy} |
| Rot properties | Rot_texture_opaque | {opaque, glassy} |
| Rot properties | Rot_texture_pressure | {firm, spongy, soft} |
References
- Shahbandeh, M. Global Fruit Production in 2019, by Selected Variety (in Million Metric Tons). 2021. Available online: https://www.statista.com/statistics/264001/worldwide-production-of-fruit-by-variety/ (accessed on 10 May 2021).
- Sutton, T.B.; Aldwinckle, H.S.; Agnello, A.; Walgenbach, J.F. (Eds.) Compendium of Apple and Pear Diseases and Pests, 2nd ed.; APS Press: St. Paul, MN, USA, 2014. [Google Scholar]
- Maxin, P.; Williams, M.; Weber, R.W. Control of Fungal Storage Rots of Apples by Hot-Water Treatments: A Northern European Perspective. Erwerbs-Obstbau 2014, 56, 25–34. [Google Scholar] [CrossRef]
- Barkai-Golan, R. Postharvest Diseases of Fruits and Vegetables: Development and Control; Elsevier Science B.V.: Amsterdam, The Netherlands, 2001. [Google Scholar]
- Koller, D.; Friedman, N. Probabilistic Graphical Models: Principles and Techniques; Adaptive computation and machine learning; MIT Press: Cambridge, MA, USA, 2009. [Google Scholar]
- Sottocornola, G.; Baric, S.; Stella, F.; Zanker, M. Case Study on the Development of a Recommender for Apple Disease Diagnosis with a Knowledge-based Bayesian Network. In Proceedings of the Workshop Proceedings of the 3rd Edition of Knowledge-Aware and Conversational Recommender Systems (KaRS) and the 5th Edition of Recommendation in Complex Environments (ComplexRec). CEUR-WS.org; 2021; Volume 2960. Available online: https://www.researchgate.net/profile/Gabriele-Sottocornola/publication/356776344_Case_Study_on_the_Development_of_a_Recommender_for_Apple_Disease_Diagnosis_with_a_Knowledge-based_Bayesian_Network/links/61ab4437aade5b1bf50270fb/Case-Study-onthe-Development-of-a-Recommender-for-Apple-Disease-Diagnosis-with-a-Knowledge-based-Bayesian-Network.pdf (accessed on 10 May 2021).
- O’Rourke, D. Economic Importance of the World Apple Industry. In The Apple Genome; Springer International Publishing: Cham, Switzerland, 2021; pp. 1–18. [Google Scholar] [CrossRef]
- Snowdon, A.L. A Color Atlas of Post-Harvest Diseases and Disorders of Fruit and Vegetables; Wolfe Scientific: London, UK, 1990. [Google Scholar]
- Beretta, B.; Gaiaschi, A.; Galli, C.; Restani, P. Patulin in apple-based foods: Occurrence and safety evaluation. Food Addit. Contam. 2000, 17, 399–406. [Google Scholar] [CrossRef] [PubMed]
- Plant, R.E.; Stone, N.D. Knowledge-Based Systems in Agriculture; McGraw-Hill, Inc.: New York, NY, USA, 1991. [Google Scholar]
- Barbedo, J. Expert Systems Applied to Plant Disease Diagnosis: Survey and Critical View. IEEE Lat. Am. Trans. 2016, 14, 1910–1922. [Google Scholar] [CrossRef]
- Boyd, D.W.; Sun, M.K. Prototyping an expert system for diagnosis of potato diseases. Comput. Electron. Agric. 1994, 10, 259–267. [Google Scholar] [CrossRef]
- Adams, S.S.; Stevenson, W.R.; Delhotal, P.; Fayet, J. An expert system for diagnosis of post-harvest potato diseases. EPPO Bull. 1990, 20, 341–347. [Google Scholar] [CrossRef]
- Gonzalez-Andujar, J. Expert system for pests, diseases and weeds identification in olive crops. Expert Syst. Appl. 2009, 36, 3278–3283. [Google Scholar] [CrossRef]
- Gonzalez-Diaz, L.; Martínez-Jimenez, P.; Bastida, F.; Gonzalez-Andujar, J. Expert system for integrated plant protection in pepper (Capsicum annuun L.). Expert Syst. Appl. 2009, 36, 8975–8979. [Google Scholar] [CrossRef]
- Kolhe, S.; Kamal, R.; Saini, H.S.; Gupta, G. A web-based intelligent disease-diagnosis system using a new fuzzy-logic based approach for drawing the inferences in crops. Comput. Electron. Agric. 2011, 76, 16–27. [Google Scholar] [CrossRef]
- Yialouris, C.; Sideridis, A. An expert system for tomato diseases. Comput. Electron. Agric. 1996, 14, 61–76. [Google Scholar] [CrossRef]
- Mahaman, B.; Passam, H.; Sideridis, A.; Yialouris, C. DIARES-IPM: A diagnostic advisory rule-based expert system for integrated pest management in Solanaceous crop systems. Agric. Syst. 2003, 76, 1119–1135. [Google Scholar] [CrossRef]
- Pertot, I.; Kuflik, T.; Gordon, I.; Freeman, S.; Elad, Y. Identificator: A Web-based Tool for Visual Plant Disease Identification, a Proof of Concept with a Case Study on Strawberry. Comput. Electron. Agric. 2012, 84, 144–154. [Google Scholar] [CrossRef]
- Nikovski, D. Constructing Bayesian Networks for Medical Diagnosis from Incomplete and Partially Correct Statistics. IEEE Trans. Knowl. Data Eng. 2000, 12, 509–516. [Google Scholar] [CrossRef]
- Seixas, F.L.; Zadrozny, B.; Laks, J.; Conci, A.; Muchaluat Saade, D.C. A Bayesian Network Decision Model for Supporting the Diagnosis of Dementia, Alzheimer’s Disease and Mild Cognitive Impairment. Comput. Biol. Med. 2014, 51, 140–158. [Google Scholar] [CrossRef] [PubMed]
- Kjaerulff, U.B.; Madsen, A.L. Bayesian Networks and Influence Diagrams: A Guide to Construction and Analysis, 1st ed.; Springer Publishing Company, Inc.: New York, NY, USA, 2010. [Google Scholar]
- Cornet, D.; Sierra, J.; Tournebize, R.; Gabrielle, B.; Lewis, F.I. Bayesian network modeling of early growth stages explains yam interplant yield variability and allows for agronomic improvements in West Africa. Eur. J. Agron. 2016, 75, 80–88. [Google Scholar] [CrossRef]
- Villordon, A.; Sheffield, R.; Rojas, J.; Chiu, Y.L. Development of Simple Bayesian Belief and Decision Networks as Interactive Visualization Tools for Determining Optimal In-row Spacing for ‘Beauregard’ Sweetpotato. HortScience 2011, 46, 1588–1597. [Google Scholar] [CrossRef]
- Pérez-Ariza, C.; Nicholson, A.; Flores, M. Prediction of Coffee Rust Disease Using Bayesian Networks. In Proceedings of the 6th European Workshop on Probabilistic Graphical Models, PGM 2012, Granada, Spain, 19–21 September 2012. [Google Scholar]
- Chen, G.; Yu, H. Bayesian Network and Its Application in Maize Diseases Diagnosis. In Proceedings of the Computer and Computing Technologies in Agriculture; Li, D., Ed.; Springer: Boston, MA, USA, 2008; Volume II, pp. 917–924. [Google Scholar]
- Yu, H.; Chen, G.; Liu, D. A Simplified Bayesian Network Model Applied in Crop or Animal Disease Diagnosis. In Proceedings of the Computer and Computing Technologies in Agriculture; Li, D., Zhao, C., Eds.; Springer: Boston, MA, USA, 2009; Volume 2, pp. 1001–1009. [Google Scholar]
- van der Gaag, L.C.; Renooij, S.; Witteman, C.L.M.; Aleman, B.M.P.; Taal, B.G. How to Elicit Many Probabilities. In Proceedings of the Fifteenth Conference on Uncertainty in Artificial Intelligence, UAI’99, Stockholm, Sweden, 30 July–1 August 1999; Morgan Kaufmann Publishers Inc.: San Francisco, CA, USA, 1999; pp. 647–654. [Google Scholar]
- Gaag, L.C.; Renooij, S.; Witteman, C.; Aleman, B.; Taal, B. Probabilities for a probabilistic network: A case study in oesophageal cancer. Artif. Intell. Med. 2002, 25, 123–148. [Google Scholar] [CrossRef]
- Ihler, A.T.; Fischer III, J.W.; Willsky, A.S. Loopy Belief Propagation: Convergence and Effects of Message Errors. J. Mach. Learn. Res. 2005, 6, 905–936. [Google Scholar]
- Lu, J.; Behbood, V.; Hao, P.; Zuo, H.; Xue, S.; Zhang, G. Transfer learning using computational intelligence: A survey. Knowl. Based Syst. 2015, 80, 14–23. [Google Scholar] [CrossRef]
- Pearl, J.; Bareinboim, E. Transportability of Causal and Statistical Relations: A Formal Approach. In Proceedings of the 2011 IEEE 11th International Conference on Data Mining Workshops, ICDMW ’11, Vancouver, BC, Canada, 11 December 2011; pp. 540–547. [Google Scholar] [CrossRef]
- Subbaswamy, A.; Saria, S. Counterfactual normalization: Proactively addressing dataset shift using causal mechanisms. In Proceedings of the 34th Conference on Uncertainty in Artificial Intelligence 2018, UAI 2018, Monterey, CA, USA, 6–10 August 2018; Silva, R., Globerson, A., Globerson, A., Eds.; Association For Uncertainty in Artificial Intelligence (AUAI): Pittsburgh, PA, USA, 2018; Volume 2, pp. 947–957. [Google Scholar]
- Huang, J.; Smola, A.J.; Gretton, A.; Borgwardt, K.M.; Scholkopf, B. Correcting Sample Selection Bias by Unlabeled Data. In Proceedings of the 19th International Conference on Neural Information Processing Systems, NIPS’06, Vancouver, BC, Canada, 4–7 December 2006; MIT Press: Cambridge, MA, USA, 2006; pp. 601–608. [Google Scholar]
- Sugiyama, M.; Nakajima, S.; Kashima, H.; Bünau, P.v.; Kawanabe, M. Direct Importance Estimation with Model Selection and Its Application to Covariate Shift Adaptation. In Proceedings of the 20th International Conference on Neural Information Processing Systems, NIPS’07, Vancouver, BC, Canada, 3–6 December 2007; Curran Associates Inc.: Red Hook, NY, USA, 2007; pp. 1433–1440. [Google Scholar]
- Mrad, A.B.; Delcroix, V.; Piechowiak, S.; Leicester, P.; Abid, M. An explication of uncertain evidence in Bayesian networks: Likelihood evidence and probabilistic evidence—Uncertain evidence in Bayesian networks. Appl. Intell. 2015, 43, 802–824. [Google Scholar] [CrossRef]
- Stepin, I.; Alonso, J.M.; Catala, A.; Pereira-Fariña, M. A survey of contrastive and counterfactual explanation generation methods for explainable artificial intelligence. IEEE Access 2021, 9, 11974–12001. [Google Scholar] [CrossRef]
- Lacave, C.; Díez, F.J. A Review of Explanation Methods for Bayesian Networks. Knowl. Eng. Rev. 2002, 17, 107–127. [Google Scholar] [CrossRef]
- Kohavi, R.; John, G.H. Wrappers for Feature Subset Selection. Artif. Intell. 1997, 97, 273–324. [Google Scholar] [CrossRef]
- Sottocornola, G.; Baric, S.; Nocker, M.; Stella, F.; Zanker, M. Picture-based and conversational decision support to diagnose post-harvest apple diseases. Expert Syst. Appl. 2022, 189, 116052. [Google Scholar] [CrossRef]
- Sottocornola, G.; Baric, S.; Nocker, M.; Stella, F.; Zanker, M. DSSApple: A hybrid expert system for the diagnosis of post-harvest diseases of apple. Smart Agric. Technol. 2023, 3, 100070. [Google Scholar] [CrossRef]
Disclaimer/Publisher’s Note: The statements, opinions and data contained in all publications are solely those of the individual author(s) and contributor(s) and not of MDPI and/or the editor(s). MDPI and/or the editor(s) disclaim responsibility for any injury to people or property resulting from any ideas, methods, instructions or products referred to in the content. |
© 2023 by the authors. Licensee MDPI, Basel, Switzerland. This article is an open access article distributed under the terms and conditions of the Creative Commons Attribution (CC BY) license (https://creativecommons.org/licenses/by/4.0/).