Abstract
The aim of this study was to analyze the polymorphisms of the beta-casein gene and describe the association between the beta-casein genotypes and milk production in high milk-production Slovak Holstein cattle herds. Genomic DNA was isolated from the hair root samples of 1478 cows using a commercial column kit. The detection of the specific alleles A1 and A2 of the CSN2 gene was carried out using three molecular-genetics methods, including the TaqMan allelic discrimination assay, ACRS-PCR and SBE primer extension technology. The results of the molecular-genetic analysis were used for calculating the genetic structure in the analyzed population. All three genotypes, including A1A1 (5.28%), A1A2 (37.08%) and A2A2 (57.64%), were detected. The frequency of the allele A1 was 23.82% and the allele A2 was 76.18%. The statistical analysis and data preparation were performed using the SAS 9.2 Enterprise Guide 4.2 software. A general linear model (GLM) and the least squares means adjusted for multiple comparisons were used. A significant positive effect of the beta-casein genotype A2A2 on protein in kilograms and partially for the protein content in Holstein cows was found. Only the highest the least squares means for the fat percentage was found for the genotype A1A1 compared to the genotype A2A2. This can be considered a slightly negative trend.
1. Introduction
Milk protein composition is an important factor in the nutritional and technological characteristics of milk. The total protein component of milk consists of many specific proteins. The main protein component of cow’s milk is beta-casein (CSN2), which comprises 45% of the casein in bovine milk [1,2]. It can occur in different genetic variants, although the A1 and A2 variants are the most common [3]. The original beta-casein protein in bovine milk was A2, but after the domestication of cows thousands of years ago, the A1 type arose and spread as a result of breeding practices and human migration. A2 is more comparable to human beta-casein than A1 in terms of digestive degradation [4,5]. The beta-casein A1 variant differs from the A2 variant at position 67, where a histidine (CAT) replaces a proline (CCT). Notably, the change to the histidine at position 67 can potentially lead to cleavage during the digestion and release of the bioactive peptide—beta-casomorphin [6,7,8].
Bovine milk also contains bioactive peptides that are associated with positive effects on the cardiovascular, nervous and gastrointestinal systems [9]. The opinions on the effects of the A1 variant of beta-casein and beta-casomorphin-7 on human health vary. According to several authors, the A2 variant of beta-casein can have some beneficial effects on the gastrointestinal system [10,11,12]. A study conducted by Kay et al. [12] demonstrated the pro-inflammatory role of the A1 variant of beta-casein on gastrointestinal, endocrinological, neurological and cardiovascular systems. Many studies showed that the consumption of milk containing the beta-casein A1 variant in humans was associated with a higher incidence of many human diseases, such as diabetes mellitus, coronary ischemic disease, autism, schizophrenia and other diseases [4,13,14,15,16,17,18]. However, EFSA [16] presented a cause–effect relationship between the oral intake of BCM-7 or the related peptides and the etiology or the course of any suggested non-communicable diseases that could not be established. EFSA’s claim was supported by Hedge [19] who stated that people in Europe, the USA and India have been consuming A1 milk for decades and the common public has not experienced any adverse effects from consuming this milk. Summer et al. [5] identified that despite the fact that the “beta-casein A1/BCM7 issue” remains intriguing, the policies in favor for the breeding of non-BCM7-releasing beta-casein variants and the consumption of “A1-like” milk are not yet suitable for a healthier and safer diet. Due to the requirements of some dairy consumers for products with increased A2 casein content, a selection of programs aimed at increasing the prevalence of the A2 allele of the CSN2 gene in cow herds are being used. The aim of our work were to evaluate the genetic structure and the effect of the CSN2 gene genotypes on milk production in high-producing Holstein cow herds.
2. Materials and Methods
2.1. Animals
A total of 1478 cows of the Holstein cattle breed raised in the Slovak Republic were used in this study. The population of the Holstein cows was collected from five farms in western Slovakia. The population consisted of the black-and-white variant and the red-and-white variant of the Holstein breed. The selection of farms represented the whole population of the Slovak Holstein breed. Four farms without the selection of the A2 variant of CSN2 (Herds 1–4), one farm with selection of the A2 variant of CSN2 (Herd 5) and one farm with a minor red-and-white variant of the Holstein breed (Herd 3) were randomly selected. The bovine genomic DNA was isolated from the hair root samples using the QIAamp DNA Mini column kit (Qiagen, Hilden, Germany).
2.2. Data
The analysis involved 1478 genotyped Slovak Holstein cows from the five high-milk production dairy cattle Holstein herds. Holstein cows come in two color patterns: black and white or red and white. The red and white color cows were from one Holstein herd (Herd 3). In Herd 3, the recessive gene was from the base herd (no special selection for the red factor). The Holstein cows were evaluated within the herd, lactation order, breed type, age at calving group and calving season group.
A representative group of the Holstein cows was established on the basis of preserving the ratio of the black and red varieties of the breed in the Slovak Holstein population. This group maintained approximately the same breeding, farming technology and nutritional level and a high genetic quality of the herds on the base Slovak Holstein national genetic evaluation system with the same sampling and recording scheme according to ICAR standards.
The traits that were selected to describe the genotypic association with milk production were the daily amounts of milk (kg), fat (kg), protein (kg), percent fat (%) and percent protein (%). The daily milk production data, breeding values of milk traits and Slovak Production Index (SPI) were provided by the Breeding Services of the Slovak Republic and by the Herdbook of the Slovak Holstein Association. The milk production data were based on the test-day records (actual day-milk recording data) and represented the phenotypic data used in the official Slovak Holstein national genetic evaluation system. The frequency distribution of days in milk was similar during each lactation (numerically homogeneous groups from 6 to 305 days).
The Slovak Production Index and breeding values were used to select three genetic quality groups of cows for genoFtyping within each herd based on the current statistical values and parameters, including the breeding values for milk, fat and protein in kilograms (highest quality, average quality and lowest quality group). The highest genetic quality was represented by the animals with production index values + 1 standard deviation higher than the mean, the average genetic quality were animals in the interval ± 1 standard deviation from the mean and the lowest genetic quality was represented by the animals with production index values − 1 standard deviation lower than the mean.
The milk production traits consisted of 33,629 test day records from the first three lactations of Holstein cows.
2.3. SNP Genotyping
The detection of the specific alleles A1 and A2 of the CSN2 gene was achieved using the TaqMan allelic discrimination method [20]. The difference between the bovine A1 beta-casein and A2 beta-casein was calculated using the SNP polymorphism rs43703011 of the bovine CSN2 gene. The SNP polymorphism CCT → CAT at codon 67 of the beta-casein gene caused a substitution of proline (A2) for histidine (A1).
The genotyping of CSN2 for SNP rs43703011 (genomic DNA: X14711) with the TaqMan allelic discrimination assay was conducted using two fluorogenic probes, as described by Manga and Dvořák [20], with a modification of the primers. Two primers were designed to amplify the same 101 bp product, but with different sequences at the 3′ end. The sequences of the primers were as follows: the forward primer, 5′-CCCTTTGCCCAGACACAGTC-3′; the reverse primer 5′-ACCACCACAGGGGTTTGAGT-3′. The first fluorogenic TaqMan probe targeted the mutant type A1 allele: 5′-FAM-CTGGACCCATCCATAACAGCCTCCCA-BHQ1-3′. The second fluorogenic TaqMan probe targeted the wild-type A2 allele: 5′-HEX-TGGACCCATCCCTAACAGCCTCCC-BHQ1-3′ of the CSN2 gene. The primer and the probes were obtained from Elisabeth Pharmacon (Czech Republic). A real-time PCR was performed in 25 µL reactions with 12.5 µL of the Maxima Probe qPCR Mastermix (Thermo Fisher Scientific, Waltham, MA, USA), 300 nM of the forward and reverse primers, 200 nM of each probe, 0.2 μL of the UNG (Thermo Fisher Scientific) and 2 μL of the DNA. The TaqMan allelic discrimination assay was performed in a RotorGene 6000 Real-Time PCR system (Qiagen, Hilden, Germany). The time and temperature profile of the PCR reaction consisted of the following steps: 2 min at 50 °C for the UNG activation, 10 min at 95 °C for starting the Maxima HotStart polymerase activity, 40 cycles at 95 °C for 15 s and 60 °C for 1 min, with the acquisition of the green and yellow channels.
2.4. Population Analysis
On the basis of the molecular-genetics analyses, we established a genotype structure of the cattle population and calculated the allelic frequencies. The significance of the differences between the experimental and theoretically expected frequencies of the genotypes was verified using the χ2-test. The effectiveness of the allele incidence was evaluated using the following parameters: the theoretical heterozygosity (Heexp), experimental heterozygosity (Heobs), polymorphism information content (PIC), expected homozygosity (E), effective number of alleles (ENA), level of possible variability realization (V%) and estimated inbreeding based on the heterozygosity ratio (FIS).
Experimental heterozygosity (Heexp) [21]
Polymorphism information content (PIC) [22]
Coefficient of homozygosity (Ca) [23]
Effective number of alleles (ENA) [23]
Level of possible variability realization (V%) [23]
Population inbreeding level (FIS) [24]
2.5. Statistical Data Analysis
The statistical analysis, frequency analysis, distribution analysis and data preparation were performed using the SAS 9.2 Enterprise Guide 4.2 program (SAS 2008). The GLM (general linear model) procedures and the least squares means adjustment for the multiple comparisons were used. A probability of less than 0.05 was considered significant (p < 0.05). The adjustment method for the comparisons of LS means were the Scheffe comparisons.
The linear model equation for the genetic association with the milk production data (test day records):
where Yijklm is individually the milk in kilograms, fat in kilograms, protein in kilograms, fat % and protein % (test day record) of the mth animal on lth lactation; HERDi is the herd effect (fixed); GROUPj is the combined effect of the breed type-lactation-age and the season of calving (fixed effect); CSN2k is the beta-casein genotype (fixed effect); b (days) is the days in milk (linear regression effect) and eijklm is the residuum (random effect).
Yijklm = HERDi + GROUPj + CSN2k + b(Days) + eijklm
The herd effect had five selected herds (four with black and white Holstein cows and one with red and white Holstein cows) (Table 1). The breed type contained four groups according to the proportion of the Holstein genes (H0 minimum 93.75 of the Holstein genes, H1 from 87.50 to 93.74 of the Holstein genes, H2 from 75.00 to 87.49 of the Holstein genes and H3 from 50 to 74.99 of the Holstein genes) (Table 2). The background breed that Holstein cows were crossed with was the Slovak Spotted Breed (Simmental type) but crossbreed animals represented a minority of the genotyped animals (approximately only 5%). We evaluated the first three lactations (Table 3). Based on the age at calving, the cows included in this study were classified (according to the mean, median and standard deviation) at each lactation into the three groups: (the first lactation: <23 months, 23–25 months and >25 months; the second lactation: <36 months, 36–39 months and >39 months; and the third lactation: <49 months, 49–53 months and >53 months). Based on the season of calving, the cows were classified into two calving seasons (April–September and October–March).

Table 1.
The number of genotyped cows and the number of test day records by herds.
Table 2.
The number of genotyped cows and the number of test day records by breed type.
Table 3.
The number of genotyped cows and the number of test day records by lactation.
The average cow age (mean; median) at calving were for (1) lactation 24.2; 23.6 months, for (2) lactation 39.4; 37.5 months and for (3) lactation 52.4; 51.2 months. In total, we evaluated 62 groups of cows as the combined effect of the breed type, lactation age and season of calving.
The differences in the number of animals between the herds represented the actual heterogeneity in the number of animals in the herds for the Holstein population in Slovakia.
Some cows did not present accepted data from the first lactations (due to milk recording ICAR rules for controlling the sample quality).
3. Results
3.1. SNP Genotyping
The TaqMan allelic discrimination method described in our study involved the real-time PCR amplification of the SNP rs43703011 flaking regions using two newly designed gene-specific oligonucleotide primers in the presence of two allele-specific fluorogenic probes. The probes were labelled at the 5′ end with the fluorescent reporter dyes FAM or HEX and at the 3′ end with the non-fluorescent quencher dye BHQ1. The sequences of the fluorogenic probes were designed by Manga and Dvořak [20]. The specific emitted fluorescence for each fluorescent reporter dye was detected by the RotorGene 6000 (Qiagen, Germany). The data are shown in Figure 1 and Figure 2.
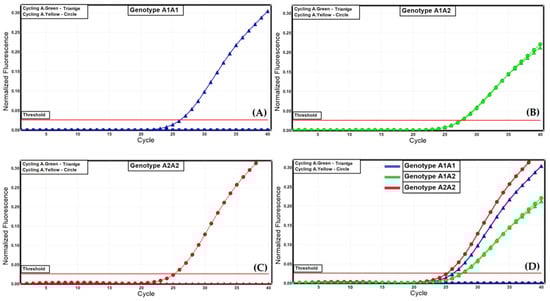
Figure 1.
Allelic discrimination of the A1 and A2 alleles for the bovine CSN2 gene with dual-labelled probes. (A) genotype A1A1, (B) genotype A1A2, (C) genotype A2A2, (D) representative result for all three genotypes.
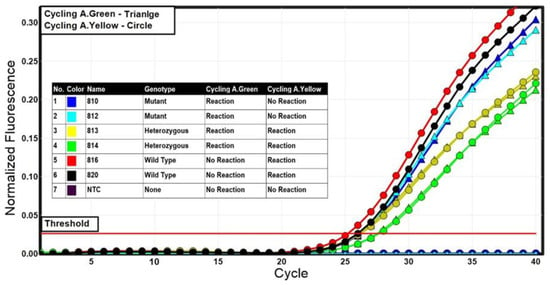
Figure 2.
Representative results of the allelic discrimination analysis using the multiplex TaqMan assay. Cycling in the green channel (FAM—A1 mutant allele) was characterized by a curve with triangle while cycling in the yellow channel (HEX—A2 wild-type allele) was characterized by a curve with circle.
By quantifying and comparing the fluorescent signals of the specific fluorescent reporters (FAM for allele A1 and HEX for allele A2), the allelic content for each sample was determined. The allelic discrimination was supported by the RotorGene Q software (version 2.3.1), which depicted how each fluorescence pattern referred to each genotype on a scatter plot. The representative allelic discrimination plot is displayed in Figure 3. The TaqMan assay’s sensitivity and correctness were evaluated for 210 cows in the Holstein cattle breed using the standard ACRS-PCR method [25]. The results of the TaqMan method corresponded with the ACRS-PCR method.
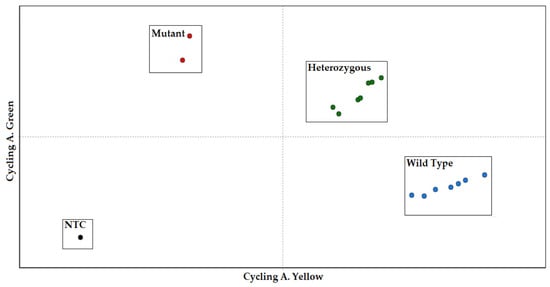
Figure 3.
CSN2 genotyping with the multiplex TaqMan assay analyzed by scatter plot. The normalized fluorescence values of FAM (A1 mutant) versus HEX (A2 wild type) are shown.
3.2. Population Analysis
In the total population included in the study, all three genotypes were detected. In the total cow population, the homozygotes A2A2 were the most frequent (genotype frequency of 57.64%), while the homozygotes A1A1 were the least frequent (5.28%). This suggests that the frequency of the allele A2 was high in the population (76.18%). The detailed frequencies of the genotypes and alleles are presented in Table 4.
Table 4.
Genotype and allelic frequencies in Holstein breeds for CSN2.
The genetic equilibrium of the analyzed population was evaluated using the base χ2-test. In the total population included in the study, the non-significant differences in the frequencies of the genotypes were found.
The expected homozygosity for the CSN2 gene in the population showed a slight increase in the homozygosity (0.6371). This caused a slight decrease in the level of the possible variability realization (36.31%), which corresponded to the effective number of alleles (1.5696). The average FIS value was −0.0218 and indicated an excess of heterozygotes in Holstein cows compared to the HWE expectations. The population genetic indices for the CSN2 gene in the population of Holstein cows are presented in Table 5.
Table 5.
The population genetic indices for CSN2 gene in a population of Slovak Holstein cattle.
3.3. Statistical Data Analysis
The descriptive summary statistics of the milk kg, fat kg, fat %, protein kg and protein % for all the genotyped Slovak Holstein cows are presented in Table 6. The milk variables from the first three lactations were used on the base official Test-day records of the actual Slovak milk recording system.
Table 6.
Descriptive statistics for the milk variables (test day records).
The results represent an average milk yield of approximately 10,000 kg (10,015 kg) of milk per cow in the first lactation period (3.60% of fat and 3.20% of protein). The average fat and protein content was slightly different from the values based on the test day records since it is for the whole lactation period. The descriptive statistics for the milk traits in the first three lactations are presented in Table 7.
Table 7.
Descriptive statistics for the milk variables in the first three lactations (test day records).
A summary statistical analysis was conducted for the milk production records up to the third lactation. The highest average values of all the observed variables were found in the third lactation. Only the average protein content showed an opposite trend (3.28% on the third lactation, 3.33% on the second lactation and 3.31% on the first lactation). Table 8 presents the summary statistics for the CSN2 genotypes (A1A1, A1A2, A2A2).
Table 8.
Descriptive statistics for the milk variables by genotypes (test day records).
The results in Table 8 show the relative equality of the mean values by genotype for all traits.
Linear Model Analysis
On the basis of the GLM (general linear model) procedures and the least squares means adjustments for the multiple comparisons, the association between the genotypes and the test day milk yields were evaluated.
Table 9 and Figure 4 present the detailed results for the milk kilograms (R-Square of the model for milk kg was 0.391399). All the effects used in the model (except the CSN2 effect) were statistically significant (Pr < 0.05).
Table 9.
Linear model (dependent variable: milk kg).
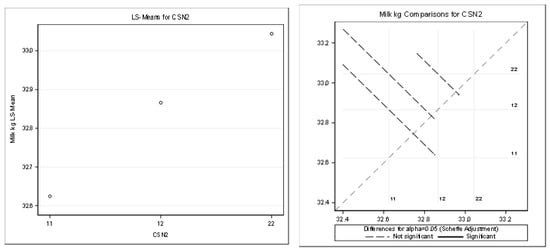
Figure 4.
Least squares means and multiple comparisons for milk kg.
There was no statistically significant difference between the genotypes (based on the least squares means and multiple comparisons, Scheffe adjustment).
Table 10 and Figure 5 present the detailed results for fat kilograms (R-Square of the model for milk kg was 0.291735). All the effects (except the CSN2 effect) were statistically significant (Pr < 0.05).
Table 10.
Linear model (dependent variable: fat kg).
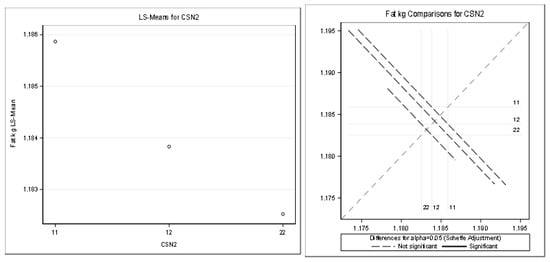
Figure 5.
Least squares means and multiple comparisons for fat kg.
There was no statistically significant difference between the genotypes (based on the least squares means and multiple comparisons, Scheffe adjustment).
Table 11 and Figure 6 present the detailed results for fat content. (R-Square of the model for milk kg was 0.280462). All the effects in the model were statistically significant (Pr < 0.05).
Table 11.
Linear model (dependent variable: fat%).
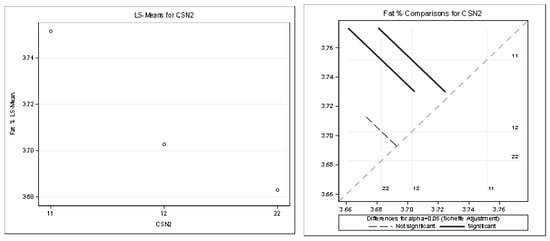
Figure 6.
Least squares means and multiple comparisons for fat %.
There was a statistically significant difference between the genotypes A1A1–A1A2 and between the genotypes A1A1–A2A2. There was no statistically significant difference between A1A2–A2A2.
Table 12 and Figure 7 present the detailed results for protein kilograms (R-Square of the model for milk kg was 0.253014). All the effects were statistically significant (Pr < 0.05).
Table 12.
Linear model (dependent variable: protein kg).
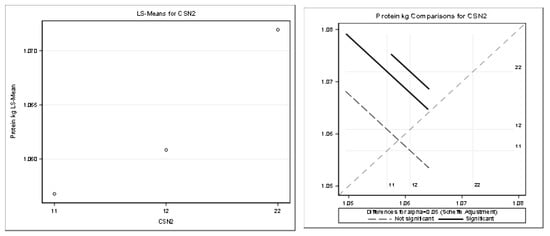
Figure 7.
Least squares means and multiple comparisons for protein kg.
There was a statistically significant difference between the genotypes A1A1–A2A2 and between the genotypes A1A2–A2A2. There was no statistically significant difference between A1A1–A1A2.
Table 13 and Figure 8 present the detailed results for protein content. (R-Square of the model for milk kg was 0.310465). All the effects in the model were statistically significant (Pr < 0.05).
Table 13.
Linear model (dependent variable: protein%).
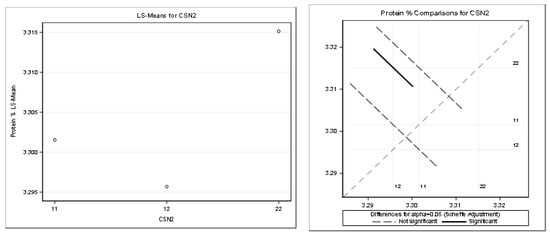
Figure 8.
Least squares means and multiple comparisons for protein %.
The statistically significant difference was found only between the genotypes A1A2–A2A2. There was n statistically significant difference between the other genotypes.
The multiple comparisons between the CSN2 genotype groups and the multiple comparisons between the herds are presented in Supplementary Tables S3–S12.
4. Discussion
Hedge [19] reported that the type A1 beta-casein was found in the milk of the breeds of North European origin, such as Friesian, Ayrshire, British Shorthorn and Holstein, while type A2 milk was found in cows of Guernsey, Jersey and the Channel Islands and the Southern French breeds. However, our findings suggest that breeding in high-producing herds alters the genetic structure of the population. In the analyzed Holstein cow population, we observed an increase in the frequency of the A2A2 genotype (57.64%), while still maintaining a sufficient number of A1A2 heterozygotes (37.08%) in the population. The homozygous genotype A1A1 was detected in a few isolated cases with a frequency of 5.28%. Although no national program for breeding Holstein cattle for the CSN2 gene was implemented in Slovakia, the demand for A2 milk has caused some breeders to select their herds for the A2 variant of CSN2. In our case, one of the farms (Herd 5) implemented a selection in order to increase the proportion of A2A2 cows in the herd. In this farm, the A2A2 genotype was represented by 63.70% and the prevalence of the A2 allele was 80.30%. The farm in question is not related to any A2 organization and delivers milk to retailers as “A2 casein enhanced” milk. Although the selection for the CSN2 gene was not carried out in the remaining farms, the proportion of the A1A1 genotype was also low in these farms with a frequency of occurrence ranging from 1.59% to 14.96%. The frequency of the A2 allele was higher compared to the A1 allele and ranged from 62.20% to 75% (Supplementary Table S1). Therefore, the increased frequency of the A2A2 genotype and the A2 allele in the Slovak Holstein cow population may be due to both a deliberate selection for the A2 variant of CSN2, as in the case of Herd 5, but also unintentionally due to the use of bulls with the A2A2 genotype. In Herd 3, which represented the red-and-white variant of the Holstein breed, we found a statistical difference in the genotype frequencies. This difference may have been due to the low number of individuals, as this is a minority population. The high proportion of heterozygotes in this herd could also indicate the use of bulls with the A2A2 genotype in breeding. As reported in this study, Oleński et al. [26] in the Holstein cattle population, Ganguly et al. [27] in a population of Holstein crossbreeds and Čítek et al. [28] in the Simmental population of cattle detected the predominance of the A2A2 genotype, a lower frequency of the A1A2 genotype and the smallest frequency of the A1A1 genotype. The frequencies of the A2 allele in our population were similar to those reported by Beja-Pereira et al. [29] in Pinzgau cattle. The dominance of the CSN2 A2 allele, detected by Caroli et al. [30], was also found in a population of Carora cattle and by Manga et al. [31] in a population of Czech Spotted and Czech Holstein cattle. In contrast, Hanusová et al. [32] found a higher frequency of the A1 allele in the Holstein cattle population. Many studies suggested that the A1 beta-casein variant was a health risk factor and was associated with diseases such as type I diabetes mellitus [13,18], coronary disease [12] and sudden infant death syndrome (SIDS) [14]. According to Boyce et al. [33], BCM-7, which arises from the A1 variant of beta-casein, in addition to intolerance, may induce a specific immune response leading to allergic reactions. Several authors [34,35,36] identified that the A2 variant can negatively affect the technological properties of milk. They state that the presence of an additional proline in A2 can have a significant effect on the hydrophobicity of the protein, leading to less ordered structures that ultimately affect the casein micelle size, emulsifying and foaming properties and the formation of rennet and acidic curd. Similarly, Chessa et al. [37] reported that the selection of the A2 variant of beta-casein can lead to a reduction in the frequencies of the A1 and B alleles, which were included in the most favorable genotypes and haplotypes for cheese making and was, therefore, an alert for the loss of useful biodiversity. Therefore, the occurrence of the low frequency of the A1A1 genotype in our population may also have a negative impact on cheese production in the future. The assessment of the genetic structure of the Holstein cattle population was essential for viability status monitoring and was necessary for the determination of suitable conservation units for genetic identification purposes. The loss of the genetic variability caused by the limited population size of the captive population was an important concern. The heterozygosity is widely used because it is proportional to the amount of the genetic variability at a locus and is suitable for theoretically considering the effect of a limited population size on the genetic variation [38,39]. Wright´s fixation indices (FIS), or the F-statistic, are the parameters most widely used to describe the population structure [24]. In our case, the number of the heterozygous genotypes corresponded to the theoretically expected values. The average FIS value was −0.0218 and indicated an excess of heterozygotes in Holstein cows compared to the HWE expectations. Despite the selection in Herd 5, there was no reduction in the heterozygotes (FIS = −0.0493) (Supplementary Table S2). This suggested that although the selection led to an increase in the proportion of the A2A2 genotype and the A2 allele, a sufficient number of heterozygotes was still retained. In the population of the red-and-white variant of the Holstein cows, which is a minority in Slovakia, a high proportion of heterozygotes (FIS = −0.5065) was observed, which indicated that genetic variability was maintained. These results confirmed that the selection of herds was random and represented the population of Slovak Holstein cattle.
The milk production data were based on the test day records. The test day records are considered as a more accurate expression of the cattle milk production as a whole lactation data expression. In the Slovak Republic, the test day records are used for the estimation of the breeding values for all the milk traits and the somatic cell counts. There was no statistically significant difference between the groups of CSN2 genotypes for daily milk kilograms and daily fat kilograms. However, this may not be an objective view of the effect of the genotypes on the test day milk yield records because it was a simple descriptive statistic that did not take into account the influence of other effects.
The protein kilograms, fat and protein content were confirmed by the statistically significant differences (p ≤ 0.05) between the least squares means of the analyzed yield according to the genotypes.
The statistical significance was positive in favor of the A2 allele for the protein in kilograms and partially for the protein content percentage. The highest least squares means for the kilograms of protein was found for the genotypes A2A2 (1.07) and A1A2 (1.06). The highest least squares means for the content of protein (%) was found only for the genotype A2A2 (3.32). Only the highest least squares means for the fat percentage was found for the genotype A1A1 (3.75%) compared to the genotype A2A2 (3.68%). This was considered a slightly negative trend.
Morris et al. [40] showed a positive dominance of the A2 allele for milk yield in the Holstein cattle population. Similar results are available for milk and protein in kilograms [41,42] which agree with our results. However, the casein genes were not segregated independently, which was contrary to our approach. Ivankovič et al. [43] found similar results in conventional and local cattle breeds in Croatia. Also, negative trends only for fat content were found. Our results were in agreement with Gai et al. [35] who confirmed that the A2 allele was associated with a higher protein yield and the allele A1 was mostly associated with higher fat content. De Vitte et al. [44] concluded that the amino acid content, fatty acid content and color of the milk could be influenced by the CSN2 genotypes A1A1, A1A2 and A2A2. They reported that the selective breeding of the genotypes with preferred qualities may improve milk and dairy products, while the genotype A2A2 showed important fatty acids content in milk fats.
In older papers, we also found different results [45] according to the genotypes that affected milk kilograms. However, these were small groups of evaluated animals and the analyses were based on the base lactation data.
5. Conclusions
Targeted breeding in high-producing herds has an impact on the genetic structure of the population, with several studies showing that the frequencies of some milk protein loci, including CSN2, have changed in recent years. The increased demand for A2 milk has also affected the breeding programs of the Holstein breed. In the total population of the Slovak Holstein cattle included in the study, we observed a higher representation of the A2A2 genotype and A2 allele. The possible explanations are the rate selection for the A2 variant of CSN2 as well as the unintentional use of bulls with the A2A2 genotype. The statistical analysis showed that the CSN2 gene polymorphism had a significant effect on the protein content in kilograms in the milk of Holstein cows. The positive influences of the allele A2 on the protein in kilograms and partially on the protein content were observed. The analysis of the CSN2 gene polymorphism showed that the genotype A1A1 increased the fat percentage compared to the genotype A2A2. Despite the fact that the analyzed population did not show a reduction in the heterozygosity, the population should continue to be monitored to prevent the loss of genetic variability.
Supplementary Materials
The following supporting information can be downloaded at: https://www.mdpi.com/article/10.3390/agriculture13010154/s1, Table S1: Genotype and allelic frequencies for CSN2 gene in a population of Slovak Holstein cattle per breed; Table S2: The population genetic indices for CSN2 gene in a population of Slovak Holstein cattle per breed; Table S3: CSN2 genotype Least Squares Means comparisons-milk kg; Table S4: CSN2 genotype Least Squares Means comparisons-fat kg; Table S5: CSN2 genotype Least Squares Means comparisons-fat %; Table S6: CSN2 genotype Least Squares Means comparisons-protein kg; Table S7: CSN2 genotype Least Squares Means comparisons-protein %; Table S8: Herd Least Squares Means comparisons-milk kg; Table S9: Herd Least Squares Means comparisons-fat kg; Table S10: Herd Least Squares Means comparisons-fat %; Table S11: Herd Least Squares Means comparisons-protein kg; Table S12: Herd Least Squares Means comparisons-protein %.
Author Contributions
M.M., M.G. and J.C. designed and performed the research; M.M., M.G. and J.C. wrote the paper. All authors have read and agreed to the published version of the manuscript.
Funding
This research was funded by the Slovak Research and Development Agency (grant numbers APVV-17-0060 and APVV-20-0161), the Cultural and Educational Grant Agency of the Ministry of Education, Science, Research and Sport of the Slovak Republic (grant number 012SPU-4/2019) and the Operational Programme Integrated Infrastructure within the project: sustainable smart farming systems taking into account the future challenges 313011W112, co-financed by the European Regional Development Fund.
Institutional Review Board Statement
The study does not require an ethical statement.
Informed Consent Statement
Not applicable.
Data Availability Statement
Not applicable.
Conflicts of Interest
The authors declare no conflict of interest.
References
- Huppertz, T. Chemistry of the Caseins. In Advanced Dairy Chemistry; McSweeney, P., Fox, P., Eds.; Springer: Boston, MA, USA, 2013; pp. 135–160. [Google Scholar] [CrossRef]
- Bisutti, V.; Pegolo, S.; Giannuzzi, D.; Mota, L.F.M.; Vanzin, A.; Toscano, A.; Trevisi, E.; Ajmone Marsan, P.; Brasca, M.; Cecchinato, A. The β-casein (CSN2) A2 allelic variant alters milk protein profile and slightly worsens coagulation properties in Holstein cows. J. Dairy Sci. 2022, 105, 3794–3809. [Google Scholar] [CrossRef] [PubMed]
- Guantario, B.; Giribaldi, M.; Devirgiliis, C.; Finamore, A.; Colombino, E.; Capucchio, M.T.; Evangelista, R.; Motta, V.; Zinno, P.; Cirrincione, S.; et al. A comprehensive evaluation of the impact of bovine milk containing different Beta-casein profiles on gut health of ageing mice. Nutrients 2020, 12, 2147. [Google Scholar] [CrossRef]
- Clarke, A.; Trivedi, M. Bovine beta casein variants: Implications to human nutrition and health. In Proceedings of the 2014 International Conference on Food Security and Nutrition IPCBE 2014, Shanghai, China, 29–30 March 2014; IACSIT Press: Singapore, 2014; Volume 67, pp. 11–17. [Google Scholar]
- Summer, A.; Di Frangia, F.; Ajmone Marsan, P.; De Noni, I.; Malacarne, M. Occurrence, biological properties and potential effects on human health of β-casomorphin 7: Current knowledge and concerns. Crit. Rev. Food Sci. Nutr. 2020, 60, 3705–3723. [Google Scholar] [CrossRef]
- Stewart, A.F.; Bonsing, J.; Beattie, C.W.; Shah, F.; Willis, I.M.; Mackinley, A.G. Complete nucleotide sequences of bovine αs2- and ß-casein cDNAs: Comparison with related sequences in other species. Mol. Biol. Evol. 1987, 4, 231–241. [Google Scholar] [CrossRef] [PubMed]
- Damiani, G.; Pilla, F.; Leone, P.; Caccio, S. Direct sequencing and bidirectional allele specific polymerase chain reaction of the bovine ß-casein B variant. Anim. Genet. 1992, 23, 561–566. [Google Scholar] [CrossRef]
- Lien, S.; Alestrom, P.; Klungland, H.; Rogne, S. Detection of multiple ß-casein alleles by amplification created restriction sites (ACRS). Anim. Genet. 1992, 23, 333–338. [Google Scholar] [CrossRef] [PubMed]
- Choi, J.; Sabikhi, L.; Hassan, A.; Anand, S. Bioactive peptides in dairy products. Int. J. Dairy Technol. 2012, 65, 1–12. [Google Scholar] [CrossRef]
- Tulipano, G. Role of bioactive peptide sequences in the potential impact of dairy protein intake on metabolic health. Int. J. Mol. Sci. 2020, 21, 8881. [Google Scholar] [CrossRef]
- Daniloski, D.; Cunha, N.M.D.; McCarthy, N.A. Otides, technological traits, cows’milk T. Health-related outcomes of genetic polymorphism of bovine beta-casein variants: A systematic review of randomised controlled trials. Trends Food Sci. Technol. 2021, 111, 233–248. [Google Scholar] [CrossRef]
- Kay, S.I.S.; Delgado, S.; Mittal, J.; Eshraghi, R.S.; Mittal, R.; Eshraghi, A.A. Beneficial effects of milk having A2 beta-casein protein: Myth or reality? J. Nutr. 2021, 151, 1061–1072. [Google Scholar] [CrossRef]
- Elliott, R.B.; Harris, D.P.; Hill, J.P.; Bibby, N.J.; Wasmuth, H.E. Type I (insulin-dependent) diabetes mellitus and cow milk: Casein variant consumption. Diabetologia 1999, 42, 292–296. [Google Scholar] [CrossRef] [PubMed]
- Sun, Z.; Zhang, Z.; Wang, X.; Cade, R.; Elmer, Z.; Fregly, M. Relation of beta-casomorphin to apnea in sudden infant death syndrome. Peptides 2003, 24, 937–943. [Google Scholar] [CrossRef]
- Teschemacher, H. Opioid receptor ligands derived from food proteins. Curr. Pharm. Des. 2003, 9, 1331–1344. [Google Scholar] [CrossRef]
- De Noni, I.; Fitzgerald, R.J.; Korhonen, H.J.T.; Le Roux, Y.; Livesey, C.T.; Thorsdottir, I.; Tomé, D.; Witkamp, R. Review of the potential health impact of ß-casomorphins and related peptides. Report of the DATEX Working Group on ß-casomorphins. EFSA Sci. Rep. 2009, 231, 1–107. [Google Scholar] [CrossRef]
- Jianqin, S.; Leiming, X.; Lu, X.; Yelland, G.W.; Ni, J.; Clarke, A.J. Effects of milk containing only A2 beta casein versus milk containing both A1 and A2 beta casein proteins on gastrointestinal physiology, symptoms of discomfort, and cognitive behavior of people with self-reported intolerance to traditional cows’ milk. Nutr. J. 2016, 15, 35. [Google Scholar] [CrossRef]
- Kohil, A.; Al-Asmakh, M.; Al-Shafai, M.; Terranegra, A. The interplay between diet and the epigenome in the pathogenesis of type-1 diabetes. Front. Nutr. 2021, 7, 612115. [Google Scholar] [CrossRef]
- Hedge, N. Research on A1 and A2 milk: A1 milk is not a matter of health concern. Indian J. Anim. Sci. 2019, 89, 707–711. [Google Scholar]
- Manga, I.; Dvořák, J. TaqMan allelic discrimination assay for A1 and A2 alleles of the bovine CSN2 gene. Czech J. Anim. Sci. 2010, 55, 307–312. [Google Scholar] [CrossRef]
- Nei, M. Analysis of gene diversity in subdivided populations. Proc. Nat. Acad. Sci. USA. 1973, 70, 3321–3323. [Google Scholar] [CrossRef] [PubMed]
- Boltstein, D.; White, R.L.; Skolnik, M.; Davis, R.W. Construction of a genetic linkage map in man using restriction fragment length polymorphism. Am. J. Hum. Genet. 1980, 32, 314–331. [Google Scholar]
- Crow, J.F.; Kimura, M. An Introduction to Population Genetics Theory; Harper and Row: New York, NY, USA, 1970; 591p. [Google Scholar]
- Wright, S. Evolution and the Genetics of Populations. The Theory of Gene Frequencies, 2nd ed.; University of Chicago Press: Chicago, IL, USA, 1969; 512p. [Google Scholar]
- McLachlan, C.N. Breeding and milking cows for milk free of β-casein A1. U.S. Patent 7094949, 22 August 2006. [Google Scholar]
- Oleński, K.; Cieślińska, A.; Suchocki, T.; Szyda, J.; Kamiński, S. Polymorphism in coding and regulatory sequences of beta-casein gene is associated with milk production traits in Holstein-Friesian cattle. Anim. Sci. Pap. Rep. 2012, 30, 5–12. [Google Scholar]
- Ganguly, I.; Kumar, S.; Gaur, G.K.; Singh, U.; Kumar, A.; Kumar, S.; Mann, S.; Sharma, A. Status of β-casein (CSN2) Polymorphism in Frieswal (HF X Sahiwal Crossbred) Cattle. Int. J. Biotechnol. Bioeng. Res. 2013, 4, 249–256. [Google Scholar]
- Čítek, J.; Brzáková, M.; Hanusová, L.; Hanuš, O.; Večerek, L.; Samková, E.; Křížová, Z.; Hoštičková, I.; Kávová, T.; Straková, K.; et al. Technological properties of cow’s milk: Correlations with milk composition, effect of interactions of genes and other factors. Czech J. Anim. Sci. 2020, 65, 13–22. [Google Scholar] [CrossRef]
- Beja-Pereira, A.; Luikart, G.; England, P.R.; Bradley, D.G.; Jann, O.C.; Bertorelle, G.; Chamberlain, A.T.; Nunes, T.P.; Metodiev, S.; Ferrand, N.; et al. Gene-culture coevolution between cattle milk protein genes and human lactase genes. Nat. Genet. 2003, 35, 311–313. [Google Scholar] [CrossRef]
- Caroli, A.; Chessa, S.; Chiatti, F.; Rignanese, D.; Meléndez, B.; Rizzi, R.; Ceriotti, G. Short communication: Carora cattle show high variability in alpha(s1)-casein. J. Dairy Sci. 2008, 91, 354–359. [Google Scholar] [CrossRef]
- Manga, I.; Říha, J.; Dvořák, J. Comparison of influence markers CSN3 and CSN2 on milk performance traits in czech spotted and holstein cattle tested at first, fifth and higher lactation. Acta Fytotech. Zootech. 2006, 9, 13–15. [Google Scholar]
- Hanusová, E.; Huba, J.; Oravcová, M.; Polák, P.; Vrtková, I. Genetic variants of beta-casein in Holstein Dairy Cattle in Slovakia. Slovak J. Anim. Sci. 2010, 43, 63–66. [Google Scholar]
- Boyce, J.A.; Assa’ad, A.; Burks, A.W.; Jones, S.M.; Sampson, H.A.; Wood, R.A.; Plaut, M.; Cooper, S.F.; Fenton, M.J.; Arshad, S.H.; et al. Guidelines for the diagnosis and management of food allergy in the United States: Report of the NIAID-sponsored expert panel. J. Allergy Clin. Immunol. 2010, 126, 1–58. [Google Scholar] [CrossRef]
- Kamiński, S.; Cieslińska, A.; Kostyra, E. Polymorphism of bovine beta-casein and its potential effect on human health. J. Appl. Genet. 2007, 48, 189–198. [Google Scholar] [CrossRef]
- Gai, N.; Uniacke-Lowe, T.; O’Regan, J.; Faulkner, H.; Kelly, A.L. Effect of protein genotypes on physicochemical properties and protein functionality of bovine milk: A review. Foods 2021, 10, 2409. [Google Scholar] [CrossRef]
- Giribaldi, M.; Lamberti, C.; Cirrincione, S.; Giuffrida, M.G.; Cavallarin, L. A2 Milk and BCM-7 Peptide as Emerging Parameters of Milk Quality. Front. Nutr. 2022, 9, 842375. [Google Scholar] [CrossRef] [PubMed]
- Chessa, S.; Gattolin, S.; Cremonesi, P.; Soglia, D.; Finocchiaro, R.; Van Kaam, J.-T.; Marusi, M.; Civati, G. The effect of selection on casein genetic polymorphisms and haplotypes in Italian Holstein cattle. Ital. J. Anim. Sci. 2020, 19, 833–839. [Google Scholar] [CrossRef]
- Gautschi, B.; Müller, J.P.; Schmid, B.; Shykoff, J.A. Effective number of breeders and maintenance of genetic diversity in the captive bearded vulture population. Heredity 2003, 91, 9–16. [Google Scholar] [CrossRef] [PubMed]
- Zhang, M.; Peng, W.F.; Hu, X.J.; Zhao, Y.X.; Lv, F.H.; Yang, J. Global genomic diversity and conservation priorities for domestic animals are associated with the economies of their regions of origin. Sci. Rep. 2018, 8, 11677. [Google Scholar] [CrossRef] [PubMed]
- Morris, C.A.; Hickey, S.M.; Cullen, N.G.; Prosser, C.G.; Anderson, R.M.; Tate, M.L. Associations between β-casein genotype and milk yield and composition in grazing dairy cows. N. Z. J. Agric. Res. 2005, 48, 441–450. [Google Scholar] [CrossRef]
- Aleandri, R.; Buttazzoni, L.G.; Schneider, J.C.; Caroli, A.; Davoli, R. The Effects of Milk Protein Polymorphisms on Milk Components and Cheese-Producing Ability. J. Dairy Sci. 1990, 73, 241–255. [Google Scholar] [CrossRef]
- Famula, T.R.; Medrano, J.F. Estimation of Genotype Effects for Milk Proteins with Animal and Sire Transmitting Ability Models. J. Dairy Sci. 1994, 77, 3153–3162. [Google Scholar] [CrossRef]
- Ivanković, A.; Pećina, M.; Ramljak, J.; Pašić, V. Genetic polymorphism and effect on milk production of CSN2 gene in conventional and local cattle breeds in Croatia. Mljekarstvo 2021, 71, 3–12. [Google Scholar] [CrossRef]
- de Vitte, K.; Kerziene, S.; Klementavičiūtė, J.; de Vitte, M.; Mišeikienė, R.; Kudlinskienė, I.; Čepaitė, J.; Dilbiene, V.; Stankevičius, R. Relationship of β-casein genotypes (A1A1, A1A2 and A2A2) to the physicochemical composition and sensory characteristics of cows’ milk. J. Appl. Anim. Res. 2022, 50, 161–166. [Google Scholar] [CrossRef]
- Bovenhuis, H.; van Arendonk, J.A.M.; Korver, S. Associations between Milk Protein Polymorphisms and Milk Production Traits. J. Dairy Sci. 1992, 75, 2549–2559. [Google Scholar] [CrossRef]


Disclaimer/Publisher’s Note: The statements, opinions and data contained in all publications are solely those of the individual author(s) and contributor(s) and not of MDPI and/or the editor(s). MDPI and/or the editor(s) disclaim responsibility for any injury to people or property resulting from any ideas, methods, instructions or products referred to in the content. |
© 2023 by the authors. Licensee MDPI, Basel, Switzerland. This article is an open access article distributed under the terms and conditions of the Creative Commons Attribution (CC BY) license (https://creativecommons.org/licenses/by/4.0/).