Article

Impact of Ten Years Conservation Tillage in Organic Farming on Soil Physical Properties in a Loess Soil—Northern Hesse, Germany

1
Department of Soil Science, Faculty of Organic Agricultural Sciences, University of Kassel, Nordbahnhofstraße 1a, 37213 Witzenhausen, Germany
2
Institute for Soil Science, Leibniz University Hannover, Herrenhäuser Str. 2, 30419 Hannover, Germany
3
Group Ecological Plant Protection, Faculty of Organic Agricultural Sciences, University of Kassel, Nordbahnhofstraße 1a, 37213 Witzenhausen, Germany
*
Author to whom correspondence should be addressed.
Agriculture 2023, 13(1), 133; https://doi.org/10.3390/agriculture13010133
Submission received: 3 November 2022 / Revised: 12 December 2022 / Accepted: 22 December 2022 / Published: 4 January 2023
(This article belongs to the Special Issue Innovative Strategies in Organic Farming Systems)

Abstract

:
In conservation agriculture, conservation tillage potentially influences the physical, chemical, and biological quality of the soil. Although the effects of conservation agriculture on the soil’s physical properties have been studied in conventional management systems, studies on organic farming systems, especially concerning long-term changes, are scarce. This study summarizes the results of physical and mechanical soil parameters obtained over the initial 10 years of different conservation management treatments (plowing versus reduced tillage with and without compost application) in an organic field trial conducted in central Germany. Moreover, as a research objective, the effects of soil conservation measures on soil’s physical quality were evaluated. Differences in the soil’s physical quality during treatments were mainly detected in the topsoil. At a depth of 0.10–0.24 m, the total porosity and air capacity were lower, and the bulk density was higher in the reduced-tillage systems, compared to those of the plowed treatments. Additionally, the soil’s mechanical stability (precompression stress) was higher at a depth of 0.10 m for reduced-tillage systems combined with compost application. In addition, the soil’s aggregate stability was enhanced in the reduced-tillage systems (higher mean weight diameter, as determined via wet sieving). Overall, the reduced-tillage treatments did not exceed the critical physical values of the soil, nor affect the functionality of the soil (saturated hydraulic conductivity), thereby demonstrating its feasibility as a sustainable technique for organic farming. Future studies should include measures to ameliorate compaction zones in reduced-tillage treatments, e.g., by applying subsoiling techniques in combination with deep-rooting crops to prevent limited rooting space resulting from the high mechanical impedance, especially under dry soil conditions.

1. Introduction

Conservation tillage is associated with noninversion of soil, resulting in the maintenance of at least 30% of the soil surface coverage with crop residues after seeding. In particular, conservation tillage measures vary with respect to the tillage depth and width, and are classified as no-till, ridge-till, strip-till, mulch-till, and reduced-till techniques [1]. In Europe, conservation tillage is practiced on 26% of the total arable land [1]; in Germany, 34% of all farms are managed under reduced tillage, and only 1% of the arable land is cultivated in no-tillage systems [2]. Unfortunately, no statistics are available for conservation tillage in organic farming in Germany; nevertheless, its share is assumed to be lower than that in conventional farming systems [2].
Conservation tillage is a constituent of conservation agriculture, which is based on reduced soil disturbance, diversified crop rotations, and crop-residue retention on the soil surface [3]. Currently, conservation agriculture is implemented on only 9% of the total cropped area worldwide (124 million hectares), distributed in South America (45%), North America (39.98%), Australia and New Zealand (17.16%), Russia and Ukraine (5.1%), Asia (4.72%), Europe (1.35%), and Africa (1.01%) [4]. In particular, reduced soil disturbance has several beneficial effects, such as the mitigation of soil erosion and water pollution. The crop residues on the soil surface, which are applied using cover crops (CC) or mulch [5], protect the topsoil against water and wind erosion, buffer large fluctuations in the temperature, mitigate surface evaporation, enhance water infiltration [4], soil aggregation, microporosity, and protect the continuity of biopores and moderate soil crusting [6]. Furthermore, diversified crop rotations effectively disrupt disease and pest life-cycles [4], and support weed control [6]. Conservation agriculture affects a range of soil quality parameters, such as the organic carbon content [7], earthworm populations, pH, nitrogen (N) losses, amount of exchangeable Ca, Mg, and K [8], and microbial biomass carbon [9]. Chemical, biological, and physical properties of soil are essential for soil quality assessments [10]. Certain key physical-quality indicators of soil are the field capacity, plant-available water, air capacity, macroporosity, bulk density, structural stability index, and saturated hydraulic conductivity [11,12]. These soil physical properties are considered most suitable for assessing the storage and transport of crop-essential water, air, and nutrients [12].
Several studies have evaluated the effects of conservation agriculture on the physical parameters of soil [9,13,14]. The main improvements reported are in terms of aggregate stability, infiltration rate [15], control of erosion [16], and air permeability [17].
In contrast to conventional farming systems, conservation tillage is not commonly practiced by organic farmers in Europe. Organic farming is based on agroecological [18], biological, and mechanical methods for crop production without the use of synthetic products such as fertilizers, pesticides, and genetically modified organisms [19]. Typically, plowing is implemented in organic farming up to a depth of 0.20–0.25 m for weed control, to bury crop residues and to incorporate fertilizers and organic amendments [6,20]. Notably, organic farmers primarily avoid plowing to ensure soil preservation; however, research on conservation practices in organic farming in Europe is relatively scarce [21]. The main problems associated with conservation tillage in organic farming are slow mineralization rates resulting in restricted nutrient availability, especially during spring, reduced yield in certain cases [6,22], weed control [23], and topsoil compaction [24]. In addition, inadequate technology for the termination of green manure and the associated high cost of machinery result in certain challenges [21,22,25]. However, as demonstrated in a study, if cover crops and compost are leveraged judiciously, weed pressure under organic conservation tillage can be maintained at similar levels as when plowing [26]. The main advantages of using conservation agriculture in organic farming are associated with soil stability [27], increased soil carbon stock, enhanced biological activities in soil, and soil fertility and health [22,28,29]. Furthermore, in Europe, the share of area under organic farming was 9.1% of the total agricultural area in 2020 [30]. With this perspective, as a future goal, the share of arable land under organic systems is expected to increase to 25% of the total agricultural area by 2030 [31], while concurrently reducing the corresponding (fossil) fuel inputs.
Currently, in a European context, the long-term effects of conservation tillage in organic farming on the physical parameters of soil remain unknown. Between 1999 and 2001, Vakali et al. [32] investigated the effects of moldboard plowing, two-layer plowing, and layer cultivation on aggregate stability and penetration resistance, considering an organic experiment in a clay loam soil installed in 1994 in Germany. They found no differences among treatments in most cases in terms of aggregate stability; however, in the cases exhibiting significant differences, the cultivation layer resulted in higher aggregate stability, whereas the penetration resistance reduced slightly in the moldboard-plow system. Moreover, Crittenden et al. [33] studied the aggregate stability, penetration resistance, and field-saturated hydraulic conductivity in an organic farming experiment in a calcareous marine clay loam soil in the Netherlands, where they applied reduced tillage to 0.18–0.23 m and conventional moldboard plowing to 0.23–0.25 cm from 2008 to 2012. They discovered a significantly higher aggregate mean weight diameter at depths of 0.10–0.20 m, and a higher penetration resistance from 0.08–0.39 m, greatly reducing the field-saturated hydraulic conductivity in the reduced-tillage system. Furthermore, Seitz et al. [34] explored soil erosion in an organic field experiment (initiated in 2009) in a loamy Cambisol soil on reduced tillage, from 2014 to 2017, in Switzerland; they reported significantly lower values of sediment delivery in the reduced-tillage system, compared to intensive tillage systems.
In this study, we present the several hydrological and mechanical parameters affected during the initial 10 years of an organic long-term conservation agriculture experiment that started in 2010; as such, we compare the plow and reduced tillage in central Germany with and without the regular application of high-quality compost. In particular, cover crops were judiciously used in all treatments. This study aimed to determine if reduced tillage affects the physical quality of soil, in comparison to conventional plowing. Moreover, the effect of plowing and the compost application on soil physical parameters was explored. We hypothesize that reduced tillage and compost applications increase the aggregate stability and improve the soil structure, thereby improving the water infiltration and water-holding capacity, while mitigating soil erodibility.

2. Materials and Methods

2.1. Location of the Experiment

The long-term trial is situated in Neu-Eichenberg (51°22′ N; 9°54′ E) at the research station of the University of Kassel, Hesse, Germany, which has been managed organically since 1988. The field is 223 m above sea level, with an average annual temperature of 9.3 °C; and an average precipitation of 663 mm (1991–2020). According to the Köppen–Geiger Climate Classification, the climate in Neu-Eichenberg is classified as Cfb, i.e., warm temperate and fully humid, with warm summers [35]. The soil in Neu-Eichenberg is a Typic Hapludalf with 13% clay, 84% silt, and 3% sand, featuring 2% organic matter and a pH of 6.0 [36].

2.2. Experimental Design

The experiment was installed in 2010 and is described in detail in the literature [28]. After the field was plowed for the last time in 2010, it was cultivated with grass clover for 1.5 years. The initial setup of the long-term experiment (LTE) featured a three-factorial split plot with four replicates. Factor I involved plow versus noninversion tillage, factor II involved two different cover crops versus two undersown living mulches, and factor III involved the regular application of either high-quality compost (average amount: 5 t dry matter (DM) ha−1 year−1) or mineral P and K (16 treatments). The 16 treatments are presented in Table S1 (Supplementary Materials). When potatoes were cropped in a minimum till, approximately 8–10 cm of fresh mulch, corresponding to a quantity of 18 t ha−1 DM, was applied in 2014. As the undersown living mulches failed up to 2014 and mulch applications to potatoes proved to be highly beneficial, Factor II was shifted to represent a mulch versus no mulch regime in both tillage treatments when potatoes were grown; uniform cover crops were used from 2015 onwards, resulting in eight treatments thereafter, with duplicate plots per replication [22]. Mulch application was reduced to 11 t ha−1 DM, in accordance with the new fertilizer directive. The dimension of each plot was 6 m × 15 m (width × length) (Figure S1, Supplementary Materials). Until 2020, differential tillage was applied annually, and the compost application was 5 tons DM ha−1 year−1 on average (5 tons in 2012, 10 tons in 2014, 5 tons in 2017, 5 tons in 2018, and 15 tons in 2020; Table S2, Supplementary Materials). The crop rotation, in brief, since 2012 featured winter wheat (Triticum aestivum L.) (2012/13), cover crops (CC), potatoes (Solanum tuberosum L.) with and without mulch application (2014), rye (Secale cereale) CC, berseem clover (Trifolium alexandrinum L.) CC, triticale (Triticosecale Wittmack) (2015/16), winter wheat (2016/17) with and without undersown white clover (failed), vetch CC, potatoes (2018), brassica–wheat mix (failed), spring wheat (2019), rye CC, and berseem clover CC. Plowing was performed annually in the respective treatments during summer or early fall, except for April 2014. All field operations are summarized in Table S2 (Supplementary Materials).

2.3. Soil Physical Measurements Conducted in the LTE from 2014 to 2020

The water-retention characteristics, bulk density, saturated hydraulic conductivity, and soil stability (precompression stress, wet sieving, tensile strength, and shear stress) were investigated in various instances, starting from 2014 (Table 1). All measurements were performed using samples collected from plow-tillage (P) and reduced-tillage (RT) treatments (Factor I), each combined with compost (+) or without compost (−) application (Factor III); these plots were invariably used, in which a triticale–vetch mix had been used as CC. In 2014 and 2018, when potatoes were grown, all RT plots sampled received dead mulch in May. The soil sampling in March 2014 was performed 19 months after plowing, 16 months after plowing in September 2015, 1 month after plowing in October 2016, and 9–11 months after plowing in May/July 2020.
The sampling depths for bulk density, water-retention curve measurements, saturated hydraulic conductivity, and soil stability measures are listed in Table 1. For the measurements of bulk density, water-retention curve, and saturated hydraulic conductivity, we utilized stainless-steel cylinders with a height of 4.0 cm and diameter of 5.6 cm (volume: approximately 100 cm3). In 2014 and 2020, four samples depth−1 plot−1 were extracted, and in 2015, eight samples depth−1 plot−1 were extracted. For aggregate stability measurements obtained via wet sieving in 2014, one disturbed sample plot−1 was collected from a depth of 0.05–0.10 m and bulked across replicates. In 2020, wet sieving was performed on soil separately collected in undisturbed samples (volume: approximately 470 cm3) from a depth of 0.02–0.08 m for each replicate separately. For measuring the precompression stress in 2014, eight undisturbed samples depth−1 plot−1 were collected using stainless-steel cylinders (height: 3 cm; diameter: 10 cm). In 2016, for measuring the tensile strength and shear stress, 1.5 kg plot−1 of soil was collected from a depth of 0.0–0.05 m.
Bulk density was calculated using oven-dried (24 h at 105 °C) weights of soil relative to the volume of the undisturbed soil cores [42]. Saturated hydraulic conductivity was measured using a falling-head permeameter (09.03 Hauben water permeameter, Eijkelkamp Agrisearch Equipment, The Netherlands) under conditions of instationary flow. For the saturated hydraulic conductivity measurements, the samples were pre-saturated for two days in a container and then flooded for the measurement. The saturated hydraulic conductivity was calculated by Equation (1) [43,44].
k = a l A t ln h 1 h 2  
where a is the burette area (cm2), l is the height of the stainless steel rings (cm), A is the area of the stainless steel rings (cm2), t is the time interval (s), and h1 and h2 are the water level at the start and end points of the measurements (cm).
Water retention was measured with sand baths (−1 to −3 kPa) and a suction plate assembly at matric potentials of −6, −15, −30, and −50 kPa. The wilting point (−1500 kPa) was adjusted using pressure pots. Based on the water-retention curve, the total porosity, air capacity, field capacity, plant-available water, and permanent wilting point were calculated [43].
Aggregate stability was assessed using the wet-sieving method, in accordance with the German standard DIN 19683-16 [45]. The mean weight diameter (MWD), which is the product of the mean diameter of each size fraction, xi, and the proportion of the total sample weight occurring in the corresponding fraction, wi, was estimated for each sample according to the following equation [46]:
MWD   ( mm ) = x ¯ i w i w i
where x ¯ i is the average diameter of the fraction i (mm), and wi is the proportion of each size class with respect to the total sample (%). wi is estimated using the following expression:
w i = DM i DM t   100
where DMi is the dry mass of the aggregates of each size class (g), and DMt is the total weight of the aggregates corrected according to the water content (g).
For the precompression-stress measurements, the undisturbed soil samples were saturated and subsequently drained until soil-moisture equilibrium was attained at a pressure of −6 kPa, using a sand bath and a pressure of −30 kPa on ceramic plates. Subsequently, the precompression stress was measured via a uniaxial compression test (08.67 compression test apparatus, Eijkelkamp Agrisearch Equipment, Giesbeek, The Netherlands), also known as an oedometer test [47]. Additionally, the soil aggregate stability was measured through three different methods: the crushing test (tensile strength as an indicator), rheology testing (shear stress as an indicator), and wet sieving (mean weight diameter as an indicator) [46]. For the crushing test, 20 air-dried aggregates were utilized for each size class (2–4, 4–8, and 8–16 mm), and the treatment and measurements were performed using a load frame (Zwick/Roell, Ulm, Germany) [48]. For the rheology (microstability) testing, aggregates with size classes of 2–4, 4–8, and 8–16 mm were employed. The shear stress of the aggregates was measured via Anton Paar MCR 102 Rheometers (Anton Paar, Ostfildern, Germany), featuring a 25-mm measurement plate and 4 mm of plate spacing [49]. For further methodological details concerning the aforementioned methods, refer to the literature published by [50].

2.4. Statistical Analysis

All datasets were subjected to analysis of variance (ANOVA), t-tests, and Tukey’s Honest Significant Difference (HSD) using the statistical software R and SPSS software (Statistical Package for Social Sciences, IBM Inc., Chicago, IL, USA). Significant effects between treatments were considered with p < 0.05. Normality and homogeneity of variances were checked before performing data analysis using the Shapiro–Wilk test and Leven’s test, respectively. In addition, descriptive statistics were used to summarize the data. The central tendency of the data was studied using the mean values, whereas the variability of the mean was determined based on the standard deviation and coefficient of variation [51,52,53].

3. Results

The sampling depths in the top 0.24 m were not always identical: In 2014, this value was 0.10–0.14 m, while this value was 0.20–0.24 m in 2015 and 0.15–0.19 m in 2020 (Table 1). To elucidate the overall trend, the values are summarized as 0.10–0.24 m for the bulk density, saturated hydraulic conductivity, and water-retention characteristics (Figure 1, Figure 2 and Figure 3). Statistical comparisons between treatments were solely performed within years in which the sampling depth was identical, except for the P+ in 2020, which was included from that corresponding to the depth of 0.10–0.14 m instead of that for 0.15–0.19 m.

3.1. Bulk Density

The bulk densities measured in 2014, 2015, and 2020 ranged from low (1.2–1.4 g cm−3) to medium (1.4–1.6 g cm−3) according to AG Boden [54] in all treatments, exhibiting higher bulk densities in the subsoil on average (refer to Figure 1). In general, a slightly decreasing trend is observed for the bulk density between 2014 and 2020, decreasing by 7% for the depth profile of 0.10–0.24 m, by 6% for the depth profile of 0.40–0.44 m, and by 4% for the depth profile of 0.60–0.64 m.
In 2014, measured at the depth of 0.10–0.14 m (Table 1), the bulk densities were significantly greater in the reduced tillage (RT) systems (median of 1.47 g cm−3 and 1.50 g cm−3, corresponding to with and without compost, respectively) than in the plowing (P) treatments (median values of 1.39 g cm−3 and 1.32 g cm−3, corresponding to with and without compost, respectively), as indicated in Figure 1 (left section). In 2015, measured at a depth of 0.20–0.24 m, this parameter was significantly higher in RT (median values of 1.53 g cm−3 and 1.57 g cm−3, corresponding to with and without compost, respectively) and P− (1.54 g cm−3), compared to P+ (median: 1.50 g cm−3). In 2020, when analyzed for the depth of 0.15–0.19 m, the bulk density corresponding to RT+ (median: 1.42 g cm−3) was significantly higher than that of the plowing treatments (P− median: 1.27 g cm–3; P+ median: 1.28 g cm−3). At depths of 0.40–0.44 and 0.60–0.64 m, no significant differences in results were observed among the treatments in any year.

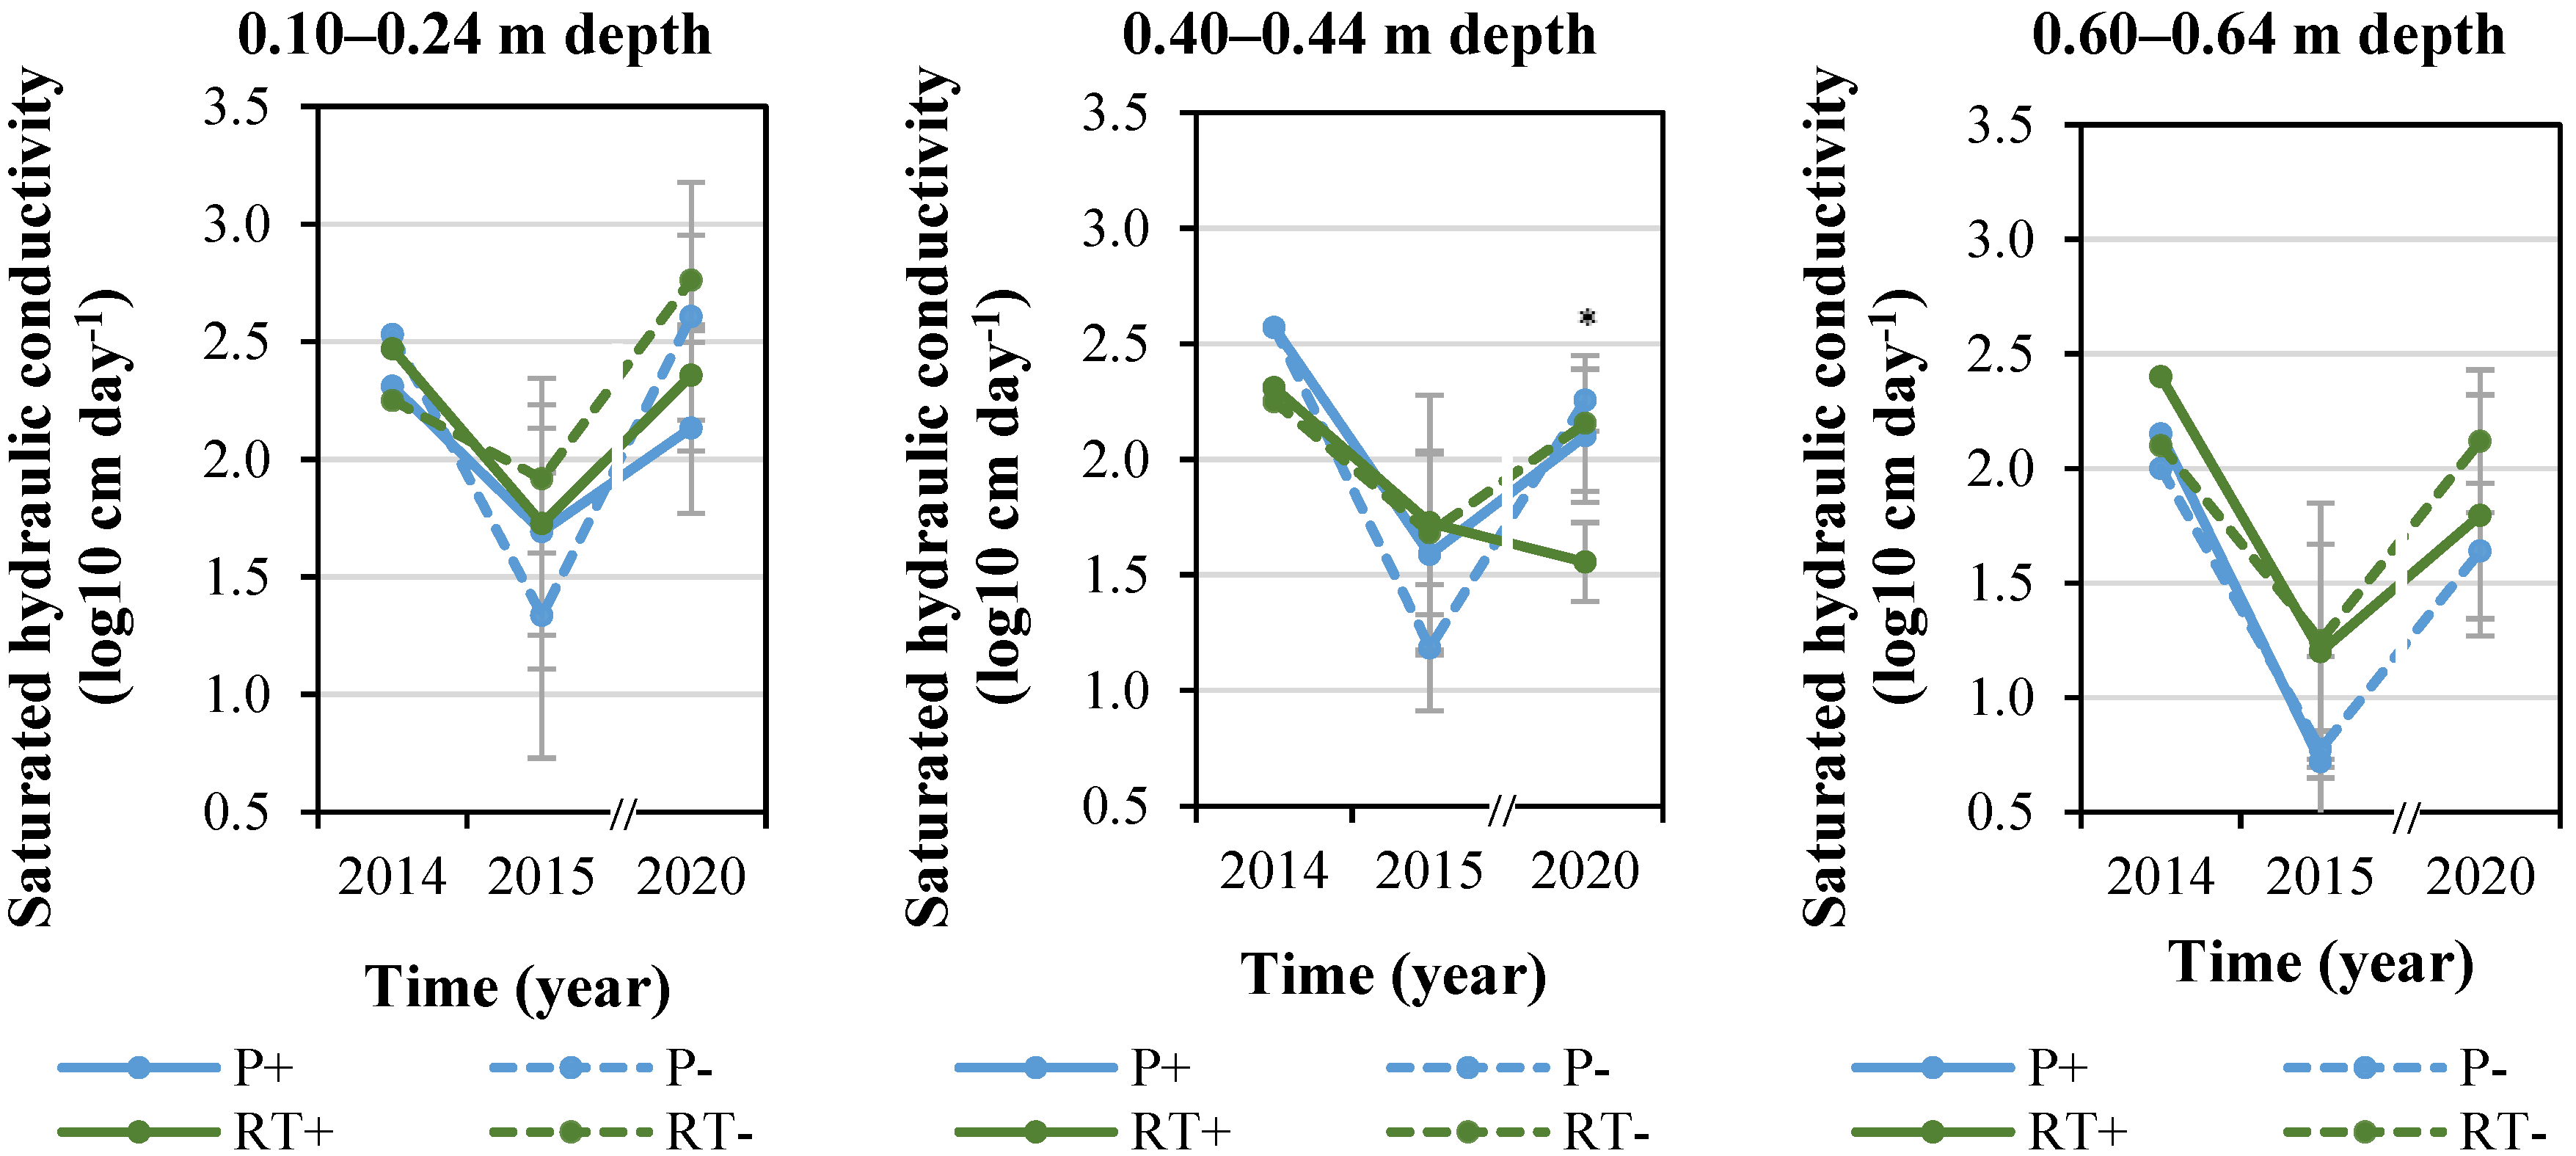
3.2. Saturated Hydraulic Conductivity

As reported by AG Boden [54], the saturated hydraulic conductivities ranged on average from low (depth: 0.60–0.64 m) to extremely high (depth: 0.10–0.24 m). At depths of 0.10–0.24 m, the saturated hydraulic conductivity increased marginally by 3% between 2014 and 2020, this indicator decreased by 17% and 14% at the depths of 0.40–0.44 and 0.60–0.64 m, respectively. In 2015, the saturated hydraulic conductivity values were overall lower than those observed in 2014 and 2020, which corresponds to the higher bulk densities measured this year (Figure 1). Except in 2020, when the saturated hydraulic conductivity of RT+ was significantly lower than that of the three other treatments at the depth of 0.40–0.44 m, no significant differences occurred among treatments at all three sampling times (2014, 2015, and 2020; Figure 2). Moreover, direct comparisons of treatments with and without compost (t-tests) were not significant.

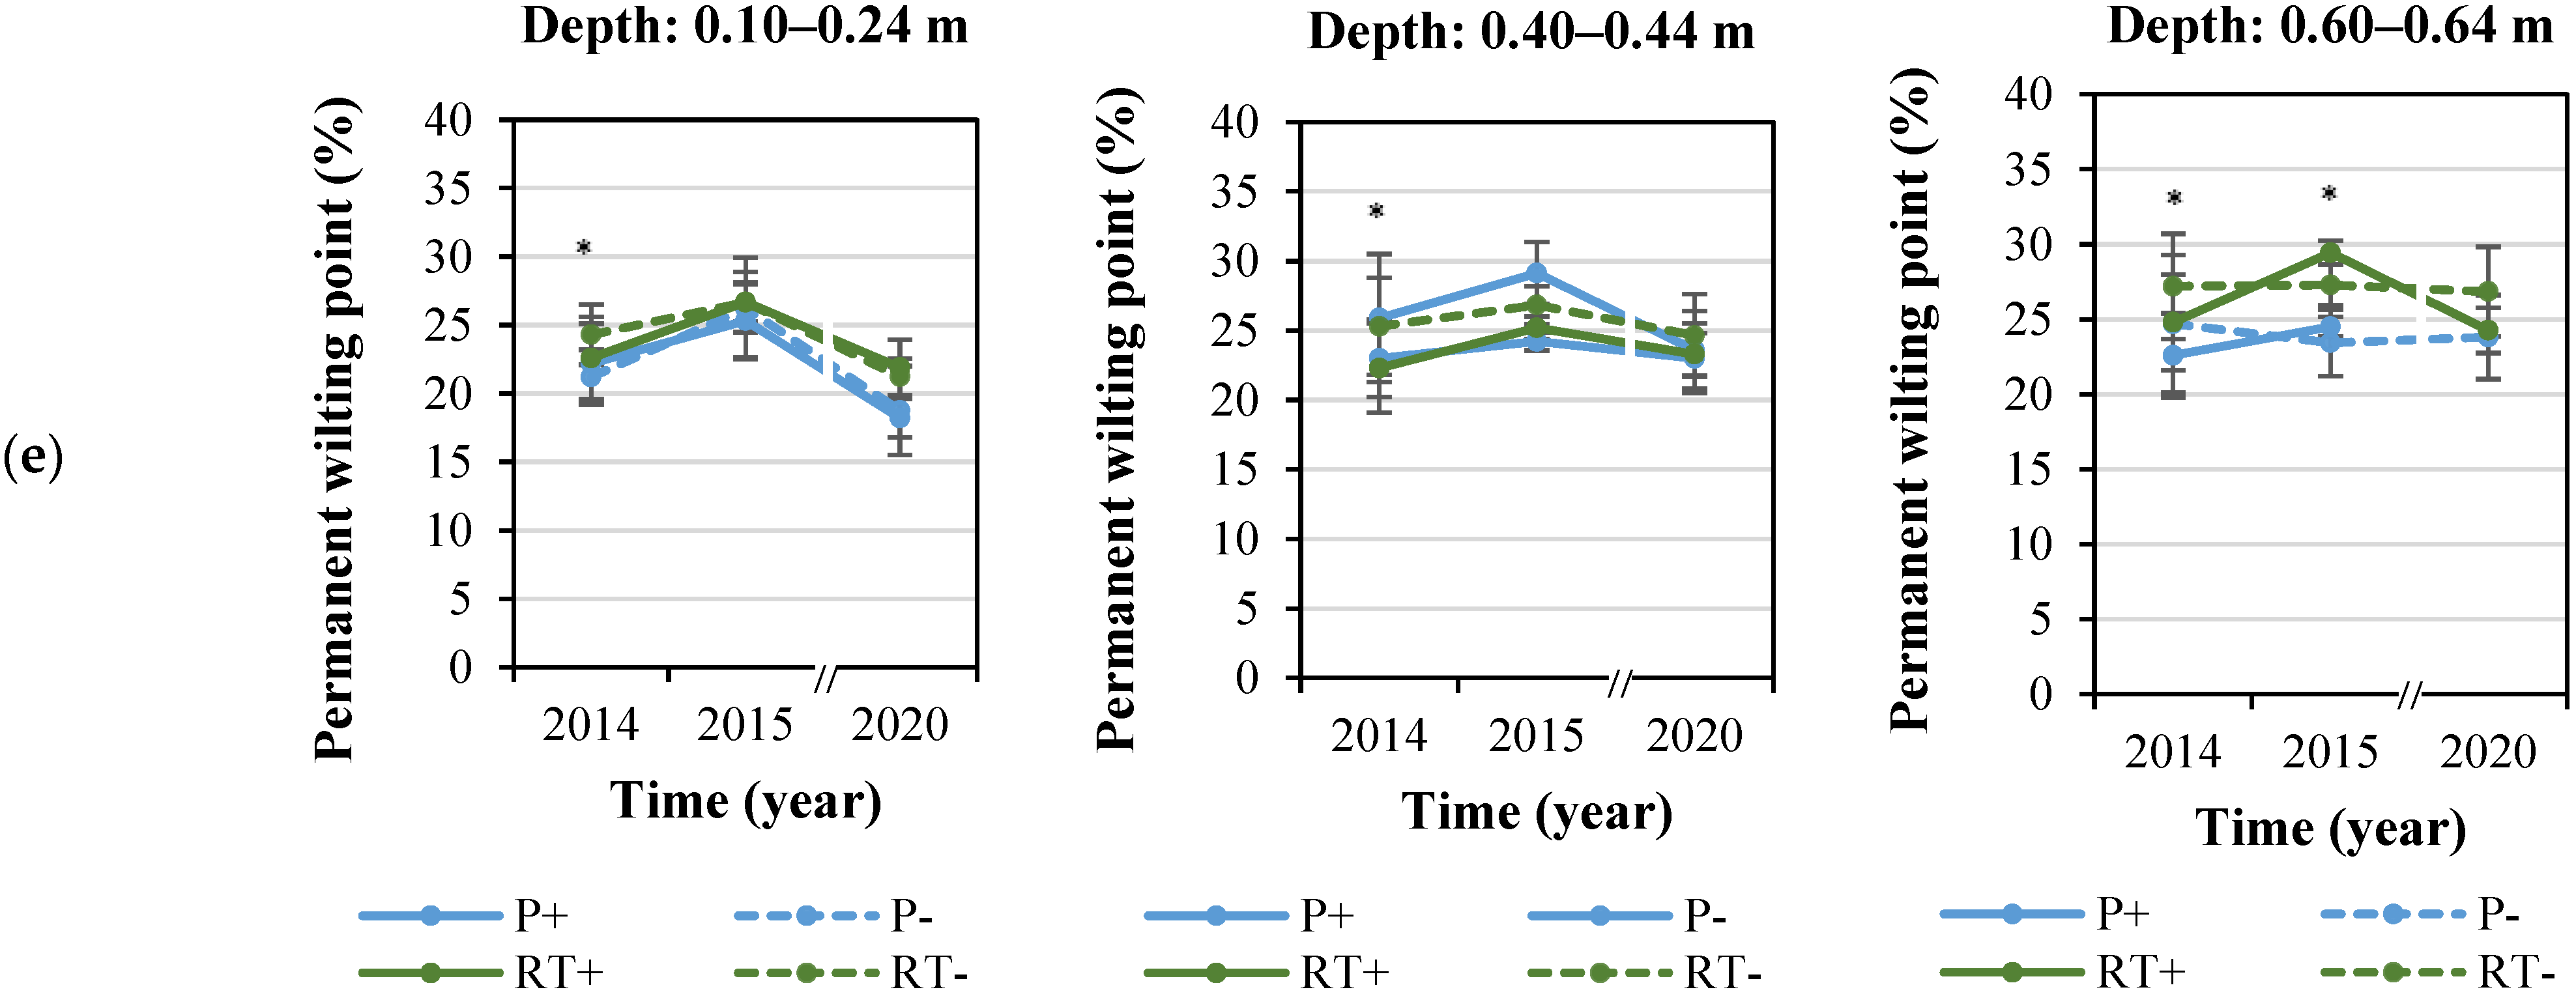
3.3. Water-Retention Characteristics

The water-retention characteristics are based on the total porosity, air capacity, field capacity, plant-available water, and permanent wilting point, as determined in 2014, 2015, and 2020 (Table 1). As indicated herein, the means across the various depth zones sampled in the different years are summarized in Figure 3, corresponding to depths of 0.10–0.24 m.
Overall, total porosity increased by 7% and 8% between 2014 to 2020, considering all depths and treatments (Figure 3a). In 2014, at the depth of 0.10–0.14 m, this indicator was significantly higher for the P treatments. Similarly, in 2015, at the depth of 0.20–0.24 m, this indicator was significantly higher for P+ compared to P−, RT+, and RT−. In 2020, at the depth of 0.15–0.19 m, the total porosity of the plowing treatments (P−: 51.7%; P+: 51.6%) was significantly higher than that of the RT+ treatment (46.3%). No differences among treatments were evident at depths of 0.40–0.44 m and 0.60–0.64 m in 2014 and 2020, respectively. However, in 2015, the total porosity was significantly higher for RT− (45.6%) than that for P+ (42.9%) at the depth of 0.40–0.44 m, whereas at the depth of 0.60–0.64 m in the RT− (45.4%), it was significantly higher than that for RT+ (41.3%) and P− (40.2%) (Figure 3a).
Generally, the air capacity increased by 52% between 2014 and 2020, considering all depths and treatments (Figure 3b). In 2014, for the depth of 0.10 to 0.14 m, differences were significant between the lowest values for RT− (6.1%) and RT+ (6.5%), and the highest values for P− (11.7%). In 2015, no significant differences were observed among treatments for air capacity at the depth of 0.20–0.24 m; however, for the depth of 0.40–0.44 m, air capacities of the RT treatments (RT−: 9.5%; RT+: 9.3%) were significantly higher than those of the plowing treatments (P−: 7.2%, P+: 7.1%; refer Figure 3b). At the depth of 0.60–0.64 m in 2015, the RT+, RT−, and P+ (mean: 6.6%) exhibited significantly higher air capacities than those for P− (4.4%). In 2020, at the depth of 0.15–0.19 m, RT+ exhibited the lowest air capacity (9.8%), whereas the P− exhibited the highest air capacity (16.7%).
Moreover, approximately no changes in field capacity were observed over time, and no obvious treatment effects were observable (Figure 3c). Significant differences among treatments occurred only at depths of 0.20–0.24 and 0.60–0.64 m in 2015. In 2020, minute but significant differences among treatments were recorded for the 0.03–0.07-m layer, with a mean of 39% under RT, compared to 36% under P− (data not shown). Overall, the plant-available water increased by 8% between 2014 and 2020 at depths of 0.10–0.24 m (Figure 3d). Notably, significant treatment effects were solely observed in 2015; the significance was the highest for P+ at all three depths. Moreover, the permanent wilting point decreased by 11% between 2014 and 2020 at depths of 0.10–0.24 m, and this parameter was similar among treatments up to depths of 0.44 m in 2015 and 2020 (Figure 3e).
In addition, t-tests for compost effects indicated significant differences between the treatments in terms of the total porosity (mean P+ and RT+: 43.9%; mean P− and RT−: 45.0%) and permanent wilting point (mean P+ and RT+: 23.5%; mean P− and RT−: 25.9%) at the depth of 0.40–0.44 m, whereas, for the air capacity, field capacity, and plant-available water, the mean values with and without compost were strikingly similar.

3.4. Soil Stability

In 2014, four years after the last plowing of the complete field, precompression-stress values, at a depth of 0.10 m and a pF value (p from power, F from free energy of water, with pF as decadic logarithm of the matric potential in hPa) of 1.8, were significantly (p < 0.05) higher for RT (68 kPa), compared to P (40 kPa) (refer to Figure 4). Similarly, at the depth of 0.10 m, the application of compost significantly increased the precompression-stress values to 56 kPa, when compared with the treatments without compost (47 kPa; p < 0.05). At a depth of 0.40 m, significant differences were only observed between the treatments with (mean: 124 kPa) and without compost application (mean: 106 kPa), whereas at a depth of 0.60 m, no significant differences were observed among treatments (Figure 4a).
At a pF value of 2.5 and a depth of 0.10 m, precompression-stress values for RT were significantly higher at 82 kPa, compared to those for P (56 kPa). Additionally, compost treatments exhibited significantly higher values (mean: 77 kPa) than the treatments without compost (56 kPa). At the depth of 0.40 m, values for the P treatments were significantly higher (mean: 159 kPa) than those for RT (mean: 134 kPa), whereas, at the depth of 0.60 m, no significant differences were observed among treatments (Figure 4b).
In 2016, there were significant differences between P and RT for tensile strength using the crushing test, with P treatment having significantly higher values (1430 kPa) than the RT treatments (1200 kPa) (t-test). No significant differences between treatments due to compost use occurred, with a mean tensile strength of 1310 and 1320 kPa for the treatments without and with compost application, respectively. Considering the rheology (microstability) measurements, the values of shear stress for RT (74 Pa) were significantly higher than those for P (50 Pa), with compost application having no significant effect (55 Pa and 69 Pa for the regimes concerning without and with compost application, respectively). This trend may have resulted from the high standard deviations.
Regarding the aggregate stability measurements conducted in 2014 at the depth of 0.05–0.10, the highest value of mean weight diameter was found for RT− (0.95 mm), and the lowest value of mean weight diameter was observed for P+ (0.55 mm). In 2020, the lowest mean weight diameter was found in P− (8.7 mm), and the highest mean weight diameter was observed in RT− (11.5 mm) and RT+ (11.0 mm); in particular, differences between RT− and P− were statistically significant.

4. Discussion

For the initial 10 years of the experiment, overall soil hydrological and mechanical parameters remained stable, and certain year-specific variations were observed, which do not suggest an overall trend concerning changes. Expectedly, RT mainly increased soil bulk density and aggregate stability in the topsoil (depth: 0.10–0.24 cm) layers, leading to greater overall topsoil stability; however, it did not significantly reduce the infiltration capacity, as measured via the saturated hydraulic conductivity. The increases in the bulk density, and reductions in total porosity and air capacity in the topsoil, were all within the range, suggesting no negative effects on plant growth in general [54]. Moreover, the effects of RT were already apparent in 2014, four years after the last plowing was applied. By 2019, the compost applications, combined with RT, resulted in an overall 1.2% increase in the soil-humus content in the top 0.15-m layer of soil, compared to P−, where the humus contents remained stable at 2.2% [31]. Consequently, the most prominent effects of compost applications were apparent in RT+ in the topsoil, with the tendency for an increased bulk density, reduced porosity, and air conductivity, reduced saturated conductivity, and improved soil stability. This trend reflects the higher concentration of the compost in the topsoil in RT, whereas, in the P treatments, compost was mixed with the complete plow horizon [31].

Soil Compaction and Water Infiltration Capacity

The bulk density, used as an indicator of compaction, influences the mechanical resistance of the soil, thereby affecting root growth [12,13]. In particular, bulk densities greater than 1.6 g cm−3 may restrict root growth [55]. The bulk densities measured in this study were below this critical value in all treatments. Lower values of bulk density were discovered for the P treatment for depths of 0.10–0.24 m, and a trend found in the increasing bulk density with depth was verified. These results agree with the generally reported increases in bulk density for RT systems, concerning the topsoil [9,13]. Reportedly, the increase in bulk density in the RT treatment may be explained by the mechanical load, the weight of the machinery [56,57], and the natural reconsolidation [58]. Essentially, an increase in the bulk density may improve soil water storage and resistance to mechanical compaction [59], and decrease soil detachment [60]; however, this improvement may reduce the rooting space, unstable macroporosity, and infiltration capacity and increase soil erodability. Upon reviewing 64 studies, Blanco-Canqui and Ruis [15] discovered that no-tillage regimes may yield mixed effects on bulk density by increasing, decreasing, or having no effect on these values. This result can be attributed to the different soil-management practices. The targeted use of deep-loosening strategies in the compacted zones, prior to intercrop seeding and to the main crop, would help improve soil structure, which would subsequently be stabilized through root establishment. In addition, the authors report the uppermost effect, up to a depth of 0.10 m, featuring values below the threshold limits. Interestingly, in our study, the bulk density increased conspicuously in the topsoil for the P treatments in 2015; however, this trend was not observed for RT, where this parameter remained stable after 2014. The reason for this is that the RT potatoes had received mulch in 2014, whereas the P potatoes received no mulch. Generally, due to the high level of soil disturbance during potato cropping, this results in the loss of organic matter, and thus soil quality [22]. In contrast to the P plots, no tilling was performed in the RT plots after mulching, and mulch residues were incorporated after the potatoes, thus maintaining the structure in the RT plots. The particularly high bulk density of RT+ in the topsoil in 2020, compared to all other treatments, cannot be explained, however.
The increased bulk density in RT did not affect the soil’s infiltration capacity, as measured through the saturated hydraulic conductivity, generally ranging from very high to extremely high on the soil surface [54] for all treatments. This observation is in line with the results of the literature review conducted by Blanco-Canqui and Ruis [15], and a 35 year-experiment by these authors [61]; they discovered similar levels of saturated hydraulic conductivity in no-till, tandem-disk, chisel-plow, and moldboard-plow treatments. Similarly, in a recent report, Alfahham et al. [62] found significantly higher values of mean bulk densities in no-tillage compared to tillage treatments for soil depths of 0–0.30 m. However, they did not observe significant differences between plowing and no-tillage treatments for saturated hydraulic conductivity in a 10-year organic experiment in the USA. Furthermore, based on the results of their literature reviews, Verhulst et al. [63] and Busari et al. [8] concluded that higher values of saturated hydraulic conductivity are to be expected in RT systems, as a result of an increase in biopores and pore continuity.
Concerning water-retention characteristics, soil porosity is an essential factor influencing the fluxes of water, air, heat [64], and nutrients [65]. The total porosity is affected by biotic factors, such as root growth and earthworms, and abiotic factors, such as traffic, loosening of soil through plowing activity, freezing and thawing, and drying and wetting [11,63]. The general reduction via RT, compared to P, in the topsoil layers over time is in line with the reports of Verhulst et al. [63] and Palm et al. [66], who reported a general decrease in total porosity in the topsoil in RT systems, due to the increase in the bulk density.
Furthermore, the results of air capacity, field capacity, plant-available water, and permanent wilting point are in line with those published in the literature, which indicate higher values of air capacity for plowing than for RT systems in the topsoil layers (e.g., [62]. In particular, the differences in air capacity did not result in differences in plant-available water in 2014 and July 2020. However, in 2015, significant differences were observed among treatments at depths of 0.20, 0.40, and 0.60 m, exhibiting the highest values for the P+. The last plowing had been applied in April 2014, which was followed by the application of 10 t ha−1 compost and a potato crop that was mulched in the RT treatments only. The potatoes were followed by a triticale cover crop (See Table S2, Supplementary Materials for details). On the one hand, the compost addition may have improved soil water retention in general. Moreover, the mulch helped conserve water under RT, thereby leading to favorable initial growing conditions for the triticale in the fall of 2014, which witnessed the onset of a severe drought period that lasted until mid-2015 [67]. In another experiment in our field, the yield of cereals following mulched potatoes in the extreme-drought year of 2018, was 20% higher compared to that of cereals after the unmulched potatoes; this enhanced yield resulted from the improved water availability during crop establishment [68]. Such effects are not reflected in the water-retention curves; however, these effects are the result of improved soil structure and its ability to retain water, and not water conservation per se. Similar to our findings, in an experiment conducted from 1998 to 2004 in Germany, Vogeler et al. [17] found that the water-retention curves in the topsoil, for depths up to 0.25 m, for conservation and conventional tillage were identical; meanwhile, Alfahham et al. [63] documented similar values of plant-available water and permanent wilting points for plowing and no-tillage systems for depths of 0.0–0.30 m.
Precompression stress is an indicator of the maximum stress experienced by the soil, thereby representing the soil’s mechanical stability [69]. It is influenced by the soil texture, structure, bulk density, pore system, biological activity, and agricultural operations. Compared to those of the RT plots, the lower values of the precompression stress in 2014, 18 months after plowing in the P plots at a depth of 0.10 m, are remarkable. These values may have resulted from the loosening of soil, destruction of aggregates, increased turnover of carbon, and decreasing humus content, as a result of plowing leading to a coarse structure that is loose but moderately stabilized [70]. In RT, aggregates are formed owing to swelling and shrinking, and further stabilization through soil organisms and organic substances, which consequently improve the precompression-stress values. When aggregate stability was measured only one month after plowing in 2016 through rheology, and shear stress as indicator, the soil stability was higher in RT. However, at that time, no effects of the compost application were observable. In 2014 and 2020, higher mean weight diameters were discovered for RT. This result is in accordance with the results published by Chellappa et al. [71], who reported higher values of mean weight diameter for no-tillage systems when compared with conventional till in the USA, for soil depths of 0–0.10 m. Large amounts of crop residues and soil organic matter on the soil surface in RT systems enhance the aggregate size and stability [65,71]. Overall, compared with the effects of conventional tillage, the effects of RT on wet aggregate stability are mixed. Moreover, compared to conventional tillage, no-tillage systems improve these values primarily up to a depth of 0.10 m in 74% of the cases [15].

5. Conclusions

The higher bulk densities, and lower total porosity and air capacity under RT in the top 0.24-m soil layer, compared to those obtained through P, were expected; however, these parameter values did not exceed the threshold limits for soil cultivation at 4, 6, and 10 years after conversion. The lack of clear negative effects on water-retention characteristics, such as field capacity, plant-available water, the permanent wilting point, and saturated hydraulic conductivity, coupled with improved soil stability, especially when combined with regular compost applications, indicated the overall positive effects of RT and compost applications into the topsoil. Thus, owing to the RT treatments, the soil’s physical-parameter values did not exceed the critical values, and the functionality of the soil remained unaffected. This result validated this technique as a sustainable practice for organic farmers. Nevertheless, despite the positive effects on soil biological activity and fertility, soil compaction in relatively shallow soil layers should be accounted for in RT systems, as it impedes root growth and affects yields. Even 10 years after conversion to RT, a clear yield gap was observed between that of the RT and P, despite a higher overall soil fertility. Currently, we are testing the effects of subsoiling in RT in combination with deep-rooting cover crops, to reduce compaction-related limitations in rooting space.

Supplementary Materials

The following supporting information can be downloaded at: https://www.mdpi.com/article/10.3390/agriculture13010133/s1, Table S1: The 16 treatments in the OSCAR experiment (Osinaike, [38]); Table S2: Soil-management practices applied in the Long-Term field trial from September 2012 to July 2020; Figure S1: Experimental design of the OSCAR experimental field in Neu-Eichenberg, Germany.

Author Contributions

Conceptualization, S.P., M.R.F.; validation, C.B., D.U., M.H., U.R., S.M.J., M.R.F., S.P.; formal analysis, C.B.; investigation, C.B., M.H., U.R.; writing—original draft preparation, C.B., D.U., S.P.; writing—review and editing, C.B., D.U., M.H., U.R., S.M.J., M.R.F., S.P.; visualization, C.B., D.U., M.H., U.R., S.M.J., M.R.F., S.P.; supervision, S.P., M.R.F.; project administration, S.P., M.R.F.; funding acquisition, S.P., M.R.F. All authors have read and agreed to the published version of the manuscript.

Funding

The long-term experiment (LTE), as installed in the framework of a European Union FP7 Project no.289277 (OSCAR), “Optimizing Subsidiary Crop Application in Rotations”. 2015–2020, was in part financed by the BMBF project INSUSFAR (INnovative approaches to optimize genetic diversity for SUStainable FARming systems of the future) Project No: 031A350C. Since 2020, the funding has been obtained through the project AKHWA: Adaptation to climate change in Hesse—increasing soil water-retention through regenerative farming strategies, which is funded by the Hessian Ministry of the Environment, Climate Protection, Agriculture and Consumer Protection.

Conflicts of Interest

The authors declare no conflict of interest.

References

  1. Madarász, B.; Jakab, G.; Szalai, Z.; Juhos, K.; Kotroczó, Z.; Tóth, A.; Ladányi, M. Long-term effects of conservation tillage on soil erosion in Central Europe: A random forest-based approach. Soil Tillage Res. 2021, 209, 104959. [Google Scholar] [CrossRef]
  2. Zikeli, S.; Gruber, S. Reduced Tillage and No-Till in Organic Farming Systems, Germany—Status Quo, Potentials and Challenges. Agriculture 2017, 7, 35. [Google Scholar] [CrossRef] [Green Version]
  3. Food and Agriculture Organization of the United Nations (FAO). Conservation Agriculture. 2022. Available online: https://www.fao.org/conservation-agriculture/en/ (accessed on 23 March 2022).
  4. Farooq, M.; Siddique, K.H.M. Conservation Agriculture: Concepts, Brief History, and Impacts on Agricultural Systems. In Conservation Agriculture; Farooq, M., Siddique, K.H.M., Eds.; Springer: Berlin/Heidelberg, Germany, 2015. [Google Scholar]
  5. Dumanski, J.; Peiretti, R. Modern concepts of soil conservation. Int. Soil Water Conserv. Res. 2013, 1, 19–23. [Google Scholar] [CrossRef] [Green Version]
  6. Mandal, A.; Dhaliwal, S.S.; Mani, P.K.; Toor, A.S. Conservation agricultural practices under organic farming. In Advances in Organic Farming; Meena, V.S., Meena, S.K., Rakshit, A., Stanley, J., Srinivasarao, C., Eds.; Elsevier: Amsterdam, The Netherlands, 2021; pp. 17–37. [Google Scholar] [CrossRef]
  7. Parihar, C.M.; Yadav, M.R.; Jat, S.L.; Singh, A.K.; Kumar, B.; Pradhan, S.; Chakraborty, D.; Jat, M.L.; Jat, R.K.; Saharawat, Y.S.; et al. Long term effect of conservation agriculture in maize rotations on total organic carbon, physical and biological properties of a sandy loam soil in north-western Indo-Gangetic Plains. Soil Tillage Res. 2016, 161, 116–128. [Google Scholar] [CrossRef]
  8. Busari, M.A.; Kukal, S.S.; Kaur, A.; Bhatt, R.; Dulazi, A.A. Conservation tillage impacts on soil, crop and the environment. Int. Soil Water Conserv. Res. 2015, 3, 119–129. [Google Scholar] [CrossRef] [Green Version]
  9. Bhattacharya, P.; Maity, P.P.; Mowrer, J.; Maity, A.; Ray, M.; Das, S.; Chakrabarti, B.; Ghosh, T.; Krishnan, P. Assessment of soil health parameters and application of the sustainability index to fields under conservation agriculture for 3, 6, and 9 years in India. Heliyon 2020, 6, e05640. [Google Scholar] [CrossRef]
  10. Dexter, A.R. Soil physical quality. Soil Tillage Res. 2004, 79, 129–130. [Google Scholar] [CrossRef]
  11. Haruna, S.I.; Anderson, S.H.; Nkongolo, N.V.; Zaibon, S. Soil Hydraulic Properties: Influence of Tillage and Cover Crops. Pedosphere 2018, 28, 430–442. [Google Scholar] [CrossRef]
  12. Reynolds, W.D.; Drury, C.F.; Tan, C.S.; Fox, C.A.; Yang, X.M. Use of indicators and pore volume-function characteristics to quantify soil physical quality. Geoderma 2009, 152, 252–263. [Google Scholar] [CrossRef]
  13. Cooper, R.J.; Hama-Aziz, Z.Q.; Hiscock, K.M.; Lovett, A.A.; Vrain, E.; Dugdale, S.J.; Sünnenberg, G.; Dockerty, T.; Hovesen, P.; Noble, L. Conservation tillage and soil health: Lessons from a 5-year UK farm trial (2013–2018). Soil Tillage Res. 2020, 202, 104648. [Google Scholar] [CrossRef]
  14. Ajayi, A.E.; Tassinari, D.; Araujo-Junior, C.F.; Faloye, O.T.; Abayomi, F.; Dias Junior, M.S.; Curi, N. Long-term no tillage management impact on soil hydro-physical properties in coffee cultivation. Geoderma 2021, 404, 115306. [Google Scholar] [CrossRef]
  15. Blanco-Canqui, H.; Ruis, S.J. No-tillage and soil physical environment. Geoderma 2018, 326, 164–200. [Google Scholar] [CrossRef]
  16. Steinhoff-Knopp, B.; Burkhard, B. Soil erosion by water in Northern Germany: Long-term monitoring results from Lower Saxony. CATENA 2018, 165, 299–309. [Google Scholar] [CrossRef]
  17. Vogeler, I.; Rogasik, J.; Funder, U.; Panten, K.; Schnug, E. Effect of tillage systems and P-fertilization on soil physical and chemical properties, crop yield and nutrient uptake. Soil Tillage Res. 2009, 103, 137–143. [Google Scholar] [CrossRef]
  18. Finckh, M.R.; Junge, S.M.; Schmidt, J.H.; Weedon, O.D. Disease and pest management in organic farming: A case for applied agroecology. In Burleigh Dodds Series in Agricultural Science; Köpke, U., Ed.; Burleigh Dodds Science Publishing: Cambridge, UK, 2018; pp. 271–301. [Google Scholar] [CrossRef]
  19. Mahanta, D.; Bisht, J.K.; Kant, L. Concept and global scenario of organic farming. In Advances in Organic Farming; Meena, V.S., Meena, S.K., Rakshit, A., Stanley, J., Srinivasarao, C., Eds.; Elsevier: Amsterdam, The Netherlands, 2021; pp. 1–16. [Google Scholar]
  20. Peigné, J.; Vian, J.; Payet, V.; Saby, N.P.A. Soil fertility after 10 years of conservation tillage in organic farming. Soil Tillage Res. 2018, 175, 194–204. [Google Scholar] [CrossRef]
  21. Casagrande, M.; Peigné, J.; Payet, V.; Mäder, P.; Sans, F.X.; Blanco-Moreno, J.M.; Antichi, D.; Bàrberi, P.; Beeckman, A.; Bigongiali, F.; et al. Organic farmers’ motivations and challenges for adopting conservation agriculture in Europe. Org. Agric. 2016, 6, 281–295. [Google Scholar] [CrossRef]
  22. Junge, S.M.; Storch, J.; Finckh, M.R.; Schmidt, J.H. Developing organic minimum tillage farming systems for Central and Northern European conditions. In No-till Farming Systems for Sustainable Agriculture: Challenges and Opportunities; Dang, Y.P., Dalal, R.C., Menzies, N.W., Eds.; Springer: Cham, Amsterdam, 2020; pp. 173–192. [Google Scholar] [CrossRef]
  23. Peigné, J.; Ball, B.C.; Roger-Estrade, J.; David, C. Is conservation tillage suitable for organic farming? A review. Soil Use Manag. 2007, 23, 129–144. [Google Scholar] [CrossRef]
  24. Gadermaier, F.; Berner, A.; Fließbach, A.; Friedel, J.K.; Mäder, P. Impact of reduced tillage on soil organic carbon and nutrient budgets under organic farming. Renew. Agric. Food Syst. 2012, 27, 68–80. [Google Scholar] [CrossRef] [Green Version]
  25. Peigné, J.; Casagrande, M.; Payet, V.; David, C.; Sans, F.X.; Blanco-Moreno, J.M.; Cooper, J.; Gascoyne, K.; Antichi, D.; Bàrberi, P.; et al. How organic farmers practice conservation agriculture in Europe. Renew. Agric. Food Syst. 2016, 31, 72–85. [Google Scholar] [CrossRef] [Green Version]
  26. Schmidt, J.H.; Junge, S.; Finckh, M.R. Cover crops and compost prevent weed seed bank buildup in herbicide-free wheat–potato rotations under conservation tillage. Ecol. Evol. 2019, 9, 2715–2724. [Google Scholar] [CrossRef]
  27. Obalum, S.E.; Uteau-Puschmann, D.; Peth, S. Reduced tillage and compost effects on soil aggregate stability of a silt-loam Luvisol using different aggregate stability tests. Soil Tillage Res. 2019, 189, 217–228. [Google Scholar] [CrossRef]
  28. Schmidt, J.H.; Theisgen, L.V.; Finckh, M.R.; Šišić, A. Increased resilience of peas toward root rot pathogens can be predicted by the nematode metabolic footprint. Front. Sustain. Food Syst. 2022, 6, 881520. [Google Scholar] [CrossRef]
  29. Schmidt, J.H.; Hallmann, J.; Finckh, M.R. Bacterivorous nematodes correlate with soil fertility and improved crop production in an organic minimum tillage system. Sustainability 2020, 12, 6730. [Google Scholar] [CrossRef]
  30. Eurostat. Organic Farming Statistics. 2022. Available online: https://ec.europa.eu/eurostat/statistics-explained/index.php?title=Organic_farming_statistics (accessed on 23 March 2022).
  31. Purnhagen, K.P.; Clemens, S.; Eriksson, D.; Fresco, L.O.; Tosun, J.; Qaim, M.; Visser, R.G.F.; Weber, A.P.M.; Wesseler, J.H.H.; Zilberman, D. Europe’s farm to fork strategy and its commitment to biotechnology and organic farming: Conflicting or complementary goals? Trends Plant Sci. 2021, 26, 600–606. [Google Scholar] [CrossRef]
  32. Vakali, C.; Zaller, J.G.; Köpke, U. Reduced tillage effects on soil properties and growth of cereals and associated weeds under organic farming. Soil Tillage Res. 2011, 111, 133–141. [Google Scholar] [CrossRef]
  33. Crittenden, S.J.; Poot, N.; Heinen, M.; van Balen, D.J.M.; Pulleman, M.M. Soil physical quality in contrasting tillage systems in organic and conventional farming. Soil Tillage Res. 2015, 154, 136–144. [Google Scholar] [CrossRef]
  34. Seitz, S.; Goebes, P.; Puerta, V.L.; Pereira, E.I.P.; Wittwer, R.; Six, J.; van der Heijden, M.G.A.; Scholten, T. Conservation tillage and organic farming reduce soil erosion. Agron. Sustain. Dev. 2019, 39, 4. [Google Scholar] [CrossRef]
  35. Kottek, M.; Grieser, J.; Beck, C.; Rudolf, B.; Rubel, F. World Map of the Köppen-Geiger climate classification updated. Meteorol. Z. 2006, 15, 259–263. [Google Scholar] [CrossRef]
  36. Schmidt, J.H.; Bergkvist, G.; Campiglia, E.; Radicetti, E.; Wittwer, R.A.; Finckh, M.R.; Hallmann, J. Effect of tillage, subsidiary crops and fertilisation on plant-parasitic nematodes in a range of agro-environmental conditions within Europe. Ann. Appl. Biol. 2017, 171, 477–489. [Google Scholar] [CrossRef]
  37. Osinaike, A. How Soil Structure and Aggregate Stability Changes with Management. Master’s Thesis, University of Kassel, Faculty of Organic Agricultural Sciences, Witzenhausen, Germany, 2017, unpublished. [Google Scholar]
  38. Barth, F. The Effect of Reduced Tillage and Compost Application on Soil Physical Properties of a Loess Soil in Neu-Eichenberg. Master’s Thesis, Faculty of Agricultural Sciences, Georg-August-University of Göttingen, Göttingen, Germany, 2016, unpublished. [Google Scholar]
  39. Rosskopf, U. Einfluss von Bodenbearbeitung und Kompostapplikation auf Stabiliät, Luftleitfähigkeit und Grobporenvolumen eines Hessischen Lössbodens. Bachelor’s Thesis, University of Kassel, Faculty of Organic Agricultural Sciences, Witzenhausen, Germany, 2016, unpublished. [Google Scholar]
  40. Nazari, M. Effect of Tillage and Compost on Physical Properties and Water Fluxes of a Loess Soil in Neu-Eichenberg, Germany. Master’s Thesis, University of Kassel, Faculty of Organic Agricultural Sciences, Witzenhausen, Germany, 2019, unpublished. [Google Scholar]
  41. Kamutzki, S. Aggregatstabilität von Ackerböden—Zusammenhänge Zwischen Makrostabilität, Mikrostabilität und der Porengrößenverteilung. Diploma Thesis, Fachbereich Ökologische Agrarwissenschaften, Witzenhausen, Germany, 2017, unpublished. [Google Scholar]
  42. Blume, H.P.; Brümmer, G.W.; Fleige, H.; Horn, R.; Kandeler, E.; Kögel-Knabner, I.; Kretzschmar, R.; Stahr, K.; Wilke, B.-M. Scheffer/Schachtschabel Soil Science, 1st ed.; Springer: Berlin, Germany, 2016. [Google Scholar]
  43. Lal, R.; Shukla, M. Principles of Soil Physics; Taylor and Francis: New York, NY, USA, 2004. [Google Scholar]
  44. Eijkelkamp. Hauben Water Permeameter—Operating Instructions; Eijkelkamp Agrisearch Equipment: Giesbeek, The Netherlands, 3 September 2017. [Google Scholar]
  45. DIN 19683-16; Soil Quality—Physical Laboratory Tests—Part 16: Determination of Aggregate Stability Using the Method of Wet Sieving. Deutsches Institut für Normung e.V.: Berlin, Germany, 2015.
  46. Kemper, W.D.; Rosenau, R.C. Aggregate Stability and Size Distribution. In Methods of Soil Analysis, 2nd ed.; Klute, A., Page, A.L., Eds.; American Society of Agronomy: Madison, WI, USA; Soil Science Society of America: Madison, WI, USA, 1986; pp. 425–442. [Google Scholar]
  47. DIN Deutsches Institut für Normung e.V. Geotechnische Erkundung und Untersuchung—Laborversuche an Bodenproben—Teil 5: Oedometerversuch mit stufenweiser Belastung CEN ISO/TS 17892-5; Beuth: Berlin, Germeny, 2004. [Google Scholar]
  48. Dexter, A.R.; Kroesbergen, B. Methodology for determination of tensile strength of soil aggregates. J. Agric. Eng. Res. 1985, 31, 139–147. [Google Scholar] [CrossRef]
  49. Mezger, T. Das Rheologie-Handbuch. Für Anwender von Rotations- und Oszillations-Rheometern, 4th ed.; Vincentz Network: Hannover, Germeny, 2010. [Google Scholar]
  50. Hartge, K.-H.; Horn, R. Essential Soil Physics. An Introduction to Soil Processes, Functions, Structure and Mechanics; Horten, R., Bachmann, J., Horn, R., Peth, S., Eds.; Schweizerbart’sche Verlagsbuchhandlung: Stuttgart, Germany, 2016. [Google Scholar]
  51. Crawley, M.J. Statistics. An Introduction Using R, 2nd ed.; Wiley: Hoboken, NJ, USA, 2014. [Google Scholar]
  52. Field, A.P.; Miles, J.; Field, Z. Discovering Statistics Using R; SAGE: London, UK, 2012. [Google Scholar]
  53. Couto, M.F.; Peternelli, L.A.; Barbosa, M.H.P. Classification of the coefficients of variation for sugarcane crops. Cienc. Rural. 2013, 43, 957–961. [Google Scholar] [CrossRef] [Green Version]
  54. AG Boden. Bodenkundliche Kartieranleitung, 5th ed.; Bundesanstalt für Geowissenschaften und Rohstoffe: Hannover, Germany, 2005. [Google Scholar]
  55. Ahmad, M.; Chakraborty, D.; Aggarwal, P.; Bhattacharyya, R.; Singh, R. Modelling soil water dynamics and crop water use in a soybean-wheat rotation under chisel tillage in a sandy clay loam soil. Geoderma 2018, 327, 13–24. [Google Scholar] [CrossRef]
  56. Schlüter, S.; Großmann, C.; Diel, J.; Wu, G.; Tischer, S.; Deubel, A.; Rücknagel, J. Long-term effects of conventional and reduced tillage on soil structure, soil ecological and soil hydraulic properties. Geoderma 2018, 332, 10–19. [Google Scholar] [CrossRef]
  57. Akinde, B.P.; Olakayode, A.O.; Oyedele, D.J.; Tijani, F.O. Selected physical and chemical properties of soil under different agricultural land-use types in Ile-Ife, Nigeria. Heliyon 2020, 6, e05090. [Google Scholar] [CrossRef]
  58. Ahuja, L.R.; Fiedler, F.; Dunn, G.H.; Benjamin, J.G.; Garrison, A. Changes in soil water retention curves due to tillage and natural reconsolidation. Soil Sci. Soc. Am. J. 1998, 62, 1228–1233. [Google Scholar] [CrossRef]
  59. Reichert, J.M.; Suzuki, L.E.A.S.; Reinert, D.J.; Horn, R.; Håkansson, I. Reference bulk density and critical degree-of-compactness for no-till crop production in subtropical highly weathered soils. Soil Tillage Res. 2009, 102, 242–254. [Google Scholar] [CrossRef]
  60. Skaalsveen, K.; Ingram, J.; Clarke, L.E. The effect of no-till farming on the soil functions of water purification and retention in north-western Europe: A literature review. Soil Tillage Res. 2019, 189, 98–109. [Google Scholar] [CrossRef]
  61. Blanco-Canqui, H.; Wienhold, B.J.; Jin, V.L.; Schmer, M.R.; Kibet, L.C. Long-term tillage impact on soil hydraulic properties. Soil Tillage Res. 2017, 170, 38–42. [Google Scholar] [CrossRef] [Green Version]
  62. Alfahham, A.; Amato, M.T.; Omondi, E.; Giménez, D.; Plante, A.F. Assessing the impact of organic versus conventional agricultural management on soil hydraulic properties in a long-term experiment. Soil Sci. Soc. Am. J. 2021, 85, 2135–2148. [Google Scholar] [CrossRef]
  63. Verhulst, N.; Govaerts, B.; Verachtert, E.; Castellanos-Navarrete, A.; Mezzalama, M.; Wall, P.; Deckers, J.; Sayre, K.D. Conservation Agriculture, improving soil quality for sustainable production systems? In Advances in Soil Science: Food Security and Soil Quality; Lal, R., Stewart, B.A., Eds.; CRC Press: Boca Raton, FL, USA, 2010; pp. 137–208. [Google Scholar]
  64. Fu, Y.; Tian, Z.; Amoozegar, A.; Heitman, J. Measuring dynamic changes of soil porosity during compaction. Soil Tillage Res. 2019, 193, 114121. [Google Scholar] [CrossRef]
  65. Indoria, A.K.; Rao, S.; Sharma, K.L.; Sammi Reddy, K. Conservation Agriculture—A Panacea to Improve Soil Physical Health. Curr. Sci. 2017, 112, 52. [Google Scholar] [CrossRef]
  66. Palm, C.; Blanco-Canqui, H.; DeClerck, F.; Gatere, L.; Grace, P. Conservation agriculture and ecosystem services: An overview. Agric. Ecosyst. Environ. 2014, 187, 87–105. [Google Scholar] [CrossRef] [Green Version]
  67. Weedon, O.D.; Finckh, M.R. Response of wheat composite cross populations to disease and climate variation over 13 generations. Front. Agric. Sci. Eng. 2021, 8, 400–415. [Google Scholar]
  68. Junge, S.; Finckh, M.R. Biokartoffeln pfluglos anbauen. Lumbrico 2020, 2020, 37–41. [Google Scholar]
  69. Lamandé, M.; Schjønning, P.; Labouriau, R. A novel method for estimating soil precompression stress from uniaxial confined compression tests. Soil Sci. Soc. Am. J. 2017, 81, 1005–1013. [Google Scholar] [CrossRef]
  70. Farooq, M.; Siddique, K.H.M. Conservation Agriculture; Springer International Publishing: Berlin/Heidelberg, Germany, 2015. [Google Scholar]
  71. Chellappa, J.; Sagar, K.L.; Sekaran, U.; Kumar, S.; Sharma, P. Soil organic carbon, aggregate stability and biochemical activity under tilled and no-tilled agroecosystems. J. Agric. Food Res. 2021, 4, 100139. [Google Scholar] [CrossRef]
Figure 1. Median of the bulk density in 2014, 2015, and 2020 in depths of 0.10–0.24 m, 0.40–0.44 m, and 0.60–0.64 m. P: plow, RT: reduced tillage, +/−: with and without compost, ± standard deviation. Note: in 2020, the P+ value corresponding to a depth of 0.60 m is missing; in 2014 the standard deviation is not available. * Significant effects between treatments with p < 0.05 (Tukey’s HSD, see Text for details).
Agriculture 13 00133 g001
Figure 2. Geometric means of saturated hydraulic conductivity (log10 cm day−1) in 2014, 2015, and July 2020 for depths of 0.10–0.24, 0.40–0.44, and 0.60–0.64 m. P: plow, RT: reduced tillage, +/−: with and without compost, ± standard deviation. Note: in 2020, P+ corresponding to depth of 0.60 m is missing; in 2014 the standard deviation is not available. * Significant effects between treatments with p < 0.05 (Tukey’s HSD, refer to the Text for details).
Agriculture 13 00133 g002
Figure 3. (a) total porosity, (b) air capacity, (c) field capacity, (d) plant-available water, (e) and permanent wilting point from 2014 to 2020. P: plow, RT: reduced tillage, +/−: with and without compost ± standard deviation. Note: for 2020, the P+ value corresponding to the depth of 0.60–0.64 m is missing. * Significant effects between treatments with p < 0.05 (Tukey’s HSD, refer to the Text for details).
Agriculture 13 00133 g003aAgriculture 13 00133 g003bAgriculture 13 00133 g003c
Figure 4. Mean precompression stress according to the different treatments and depths at (a) pF 1.8 and (b) pF 2.5. P: plow, RT: reduced tillage, +/−: with and without compost, ± standard deviation. a and b, significant differences according to the ANOVA and Tukey-test (b) and Welch-ANOVA (a).
Agriculture 13 00133 g004
Table 1. Soil physical measurements conducted in the LTE (2014–2020).
Sampling Depth (m)Sampling Date (Month/Year)ρbKsatSWCSoil Stability
Precompression StressWet SievingTensile StrengthShear Stress
0.05–0.103/2014 1 x
0.10–0.14, 0.40–0.44; 0.60–0.643/2014 2,3x2x2x2x3
0.20–0.24, 0.40–0.44, 0.60–0.64; 1.00–1.04 9/2015 4xxx
0–0.0510/2016 5 xx
0.03–0.07, 0.15–0.19, 0.40–0.44; 0.60–0.645 and 7/2020 6xxx x
ρ b : bulk density; Ksat: saturated hydraulic conductivity; SWC: soil water retention curve. 1 MSc thesis, Osinaike [37]; 2 MSc thesis Barth [38]; 3 BSc thesis, Rosskopf [39]; 4 MSc thesis Nazari [40] and personal communication from Malte Horvat; 5 BSc thesis, Kamutzki [41]; All thesis and report data are unpublished and available at the Department of Soil Science, University of Kassel. 6 Current study: the sampling in 2020 was conducted in May and July. In May 2020, the soil samples were collected from depths of 0.10–0.14 and 0.40–0.44 m. In July 2020, the soil samples were collected from depths of 0.03–0.07, 0.15–0.19, 0.40–0.44, and 0.60–0.64, respectively. However, in July 2020, the P+ was not sampled at any depth.
Disclaimer/Publisher’s Note: The statements, opinions and data contained in all publications are solely those of the individual author(s) and contributor(s) and not of MDPI and/or the editor(s). MDPI and/or the editor(s) disclaim responsibility for any injury to people or property resulting from any ideas, methods, instructions or products referred to in the content.

