Article

Accuracy of Genomic Prediction of Yield and Sugar Traits in Saccharum spp. Hybrids

1
Sugarcane Field Station, USDA-ARS, Canal Point, FL 33834, USA
2
Irrigated Agriculture Research and Extension Center, Washington State University, Prosser, WA 99350, USA
3
Southeast Area, USDA-ARS, Raleigh, NC 38776, USA
4
Guangxi Key Laboratory for Sugarcane Biology & State Key Laboratory for Conservation and Utilization of Agro Bioresources, Guangxi University, Nanning 530004, China
5
Department of Crop Sciences, University of Illinois, Urbana-Champaign, IL 61820, USA
6
Sugarcane Research, USDA-ARS, Houma, LA 70360, USA
7
Forage Seed and Cereal Research Unit, USDA ARS, Prosser, WA 97331, USA
*
Author to whom correspondence should be addressed.
Agriculture 2022, 12(9), 1436; https://doi.org/10.3390/agriculture12091436
Submission received: 20 July 2022 / Revised: 31 August 2022 / Accepted: 6 September 2022 / Published: 10 September 2022
(This article belongs to the Section Crop Production)

Abstract

:
Genomic selection (GS) has been demonstrated to enhance the selection process in breeding programs. The objectives of this study were to experimentally evaluate different GS methods in sugarcane hybrids and to determine the prospect of GS in future breeding approaches. Using sugar and yield-related trait data from 432 sugarcane clones and 10,435 single nucleotide polymorphisms (SNPs), a study was conducted using seven different GS models. While fivefold cross-validated prediction accuracy differed by trait and by crop cycle, there were only small differences in prediction accuracy among the different models. Prediction accuracy was on average 0.20 across all traits and crop cycles for all tested models. Utilizing a trait-assisted GS model, we could effectively predict the fivefold cross-validated genomic estimated breeding value of ratoon crops using both SNPs and trait values from the plant cane crop. We found that the plateau of prediction accuracy could be achieved with 4000 to 5000 SNPs. Prediction accuracy did not decline with decreasing size of the training population until it was reduced below 60% (259) to 80% (346) of the original number of clones. Our findings suggest that GS is possibly a new direction for improving sugar and yield-related traits in sugarcane.

1. Introduction

Sugarcane, an interspecific hybrid of Saccharum spp., is the major source of sugar production in the tropical and subtropical regions of the world, as it can store high quantities and quality of sucrose in the stalk. Sugarcane industries also use the stalk waste generated by the milling process, called bagasse, to produce power and pulp for paper. The Saccharum spp. hybrid genome is extremely complex and enormous in size with chromosome numbers varying from 100 to 130 [1,2,3]. A large number of chromosomes results from crossing between two polyploid species, the domesticated S. officinarum (2n = 80) and the wild S. spontaneum (2n = 40–120), then many folds of backcrossing with S. officinarum [4,5]. Thus, the resulting hybrids derive roughly 80% of their chromosomes from S. officinarum, 10% from S. spontaneum, and 10% from recombination between the two genomes [1].
Sucrose content, yield components, and yield, the most economically important traits in sugarcane, are polygenic and quantitative [6]. The production of sugarcane is vulnerable to adverse environmental conditions. Additionally, sugarcane is highly polyploid, aneuploid, and displays high levels of heterozygosity. Hence, it is very challenging to select superior lines based only on phenotypic evaluation of sugar and yield traits during breeding across the three crop cycles: plant cane (PC), first ratoon (RT1), and second ratoon (RT2). Selection through phenotype is highly time-consuming and labor-intensive. In order to reduce the time and cost of labor, molecular breeding approaches such as marker-assisted selection (MAS) and genomic selection (GS) for traits of interest throughout the cultivar development process are currently being used [7,8,9,10]. Unlike MAS, GS could bypass the detection of QTL and/or markers associated (detected through quantitative trait loci (QTL) and/or association mapping) with the desirable trait. On the other hand, the complexity of the sugarcane genome has hindered the utilization of MAS in sugarcane and has only been regularly employed with a few major disease resistance genes, such as Bru1 [11] and Bru2 [12], the allied molecular markers (R12H16 and 9O20-F4 [13]) for brown rust, and an orange rust disease resistance marker (G1) derived from a major QTL [14]. To the best of our knowledge, no molecular markers are currently being used for selection associated with sugar and yield traits in sugarcane.
Several animal and plant breeding programs are currently being successfully explored for genomic selection. Since its introduction to sugarcane breeding by Meuwissen et al. [15], GS has displayed added benefit in selecting for complex yield-related and sugar-related traits requiring long and labor-intensive field trials [16,17]. By employing genome-wide markers, GS accounts for all the major and minor QTL effects controlling the trait of interest. Consequently, it accounts for added amounts of genetic variation for the evaluated trait [18], while MAS utilizes a few sets of critical markers associated with causal genes or major QTL. The success of GS in a breeding program strongly depends on fitting a predictive model with a representative training population that consists of both genotypic and phenotypic data. Using the fitted predictive model, GS predicts the genomic estimated breeding value (GEBV) of new individuals by employing their genome-wide genotypic data [19]. Hence, GS has the potential to shorten the breeding cycle and speed up the selection process by selecting individuals in the early stages based on GEBV [20].
In GS, several factors such as training population size, genome size and coverage, model assumptions, ploidy level, underlying QTL number and effects, gene action, phenotyping of the testing population, the heritability of traits, and relatedness of individuals influence the prediction accuracy of GEBV [21]. It is well known that sugarcane production has been influenced by genotype (G), environment (E), and G X E interaction [22,23], especially in south Florida. Thus, the performance of traits is highly dependent on a favorable environment. A wide range of heritability values (low to high) of sugar and yield component traits of sugarcane have been reported [6,24,25,26]. Recent advances in next-generation sequencing and bioinformatics tools have contributed to the utility of GS, which has been evaluated in many crops [7,8,9,10,27,28,29,30] including seven studies in sugarcane [18,24,31,32,33,34,35]. In the first report on sugarcane GS analysis, Gouy et al., 2013 [18] documented low to moderate levels of prediction accuracy ranging from 0.11 to 0.62 across ten tested traits by evaluating four GS predictive models in two sets of 167 sugarcane clones using 1499 Diversity Arrays Technology (DArT) markers. Out of four studies on GS in sugarcane have been published by the same research lab, three experimentally evaluated the feasibility of GS in sugarcane breeding following similar genotyping and phenotyping strategies of different traits [24,31,33]. Using 2351 sugarcane clones divided into three groups and five GS models, Deomano et al. [31] reported prediction accuracies of 0.25 to 0.45 for two sugar-related traits (cane yield and commercial cane sugar) across the tested panels. In that study, the tested genotypes were evaluated and grown in different years and locations as a group as part of multi-location, multi-stage breeding trials, resulting in an unbalanced dataset. Similarly from another study, the same research group has stated prediction accuracies of 0.22 to 0.45 for three sugar and yield traits (total cane per hectare, commercial cane sugar, and fiber content) [24] and 0.26 to 0.46 for the same three traits using three GS models [33]. Two previous studies reported that the non-additive genetic effect contributed to low prediction accuracies in sugarcane [33,35]. They also suggested that prediction accuracies could further improve by accounting for non-additive genetic variance. Our research group recently conducted a study on GS evaluation of orange and brown rust disease resistance using the same population and the same sets of markers as in the current study [34]. In the current study, we explored the use of GS models to predict yield and sugar traits to enhance sugarcane production by improving cultivars. Unlike other sugarcane GS studies, we utilized SNPs only from the coding regions to adequately cover the gene space of the complex sugarcane genome.
The objective of this study was to experimentally evaluate different GS methods for predicting the yield and sugar-related traits in the highly polyploid and complex sugarcane hybrids and to determine appropriate breeding approaches for their operational implementation in the USDA-ARS, Canal Point sugarcane breeding program. We also tested the potential of accounting for different genetic effects (additive and dominance) to improve prediction accuracy. Because the number of molecular markers and training population size are also important factors for predicting GEBV [7], we also determined the minimum number of markers needed and the optimum size of the training population for sugarcane breeding. We used trait datasets from different crop cycles (PC, RT1, and RT2) to perform trait-assisted GS prediction, in which a model is trained in a given harvest crop and applied in a test population from a separate crop cycle.

2. Materials and Methods

2.1. Plant Materials

A dedicated replicated field trial was conducted using a total of 432 sugarcane clones (Table S1), comprising 414 from the second clonal stage of the CP program and 18 commercial cultivars and breeding selections from the USDA-ARS program at Houma, Louisiana, along with two checks, CP 00-1101 and CP 96-1252. The checks were replicated 17 times, and each tested clone was replicated twice in an augmented row-column experimental design. The details and layout of the field plots are described in our previous study [34]. In brief, the field trial was established at the USDA-ARS Sugarcane Field Station, Canal Point, Florida, in November 2016. Each plot consisted of a single row (4.6 m long) with 1.5 m spacing between adjacent plots. There were 36 rows throughout the field and each row had 25 plots with a 6.0 m alley between two rows. The trial was evaluated over three crop cycles: PC, RT1, and RT2. All necessary management practices followed the standard protocol.

2.2. Data Collection

The number of stalks per plot was counted for PC, RT1, and RT2 in September 2017, 2018, and 2019, respectively, and then converted to the population of millable stalks per hectare for each plot. In February 2018, 2019, and 2020, ten randomly selected stalks from each plot were harvested manually at ground level, removing the top just below the apical meristem and leaves, then bundled for PC, RT1, and RT2, respectively. Harvested bundles of ten stalks were weighed separately to estimate individual stalk weight. Then, each bundle was divided into two portions containing five stalks each. One bundle of five stalks was used for measuring the stalk diameter (SD) and the other bundle of stalks was processed via the Cane Presentation Systems (CPS) near-infrared (NIR) analysis system, which shreds the cane and collects a NIR spectrum using a Bruker Matrix-F NIR spectrophotometer (Bruker, Billerica, MA, USA). This system provided a prediction for total fiber content (%), juice polarization (pol, %), total dissolved solids (Brix, %), and moisture content (%), which was based on an analysis of the collected spectral data using the calibration models previously developed for the whole stalk samples. SD was measured from three locations (top, middle, and bottom) along each of the five stalks for each plot and then averaged over all 15 measurements to calculate the SD for each plot. SC was measured from the corrected Brix and pol [36] using the following formula [37]
SC   ( % ) = Pol   × 26 [ 105.811 + ( BRIX 15 ) × 0.444 ]
Cane yield (Mg ha−1) was estimated as the product of stalk weight (kg stalk−1) and stalk number (stalks ha−1) as below:
cane   yield = ( stalk   weight   ×   stalk   number )   ÷ 1000 .  
Theoretical recoverable sucrose (TRS) was calculated from the juice data and fiber concentration obtained from the CPS to estimate the sugar yield as described by Legendre [36]. All values of TRS were multiplied by a correction factor of 0.86 to approximate the commercial recoverable sugar (CRS – kg Mg−1). Sucrose yield (Mg ha−1) as total sugar per hectare (TSH) was determined as:
sucrose   yield = ( cane   yield   × CRS )   ÷ 1000
Following Deren et al. [38], the economic index (EI) was calculated from the cane yield, sucrose yield, and costs of harvesting, hauling, and milling the cane in Florida.
Out of 11 evaluated traits, seven (Brix, FC, Pol, SC, SD, SP, and SW) primary traits were either collected directly from the field samples and/or used to estimate the other four secondary traits (CRS, EI, TCH, and TSH). We present primary and secondary traits separately in this manuscript for better understanding.

2.3. DNA Extraction and Genotyping

Details of DNA extraction, library preparation, sequencing, SNP calling, and filtering process are well described in our previous report [34]. Total genomic DNA was extracted from young leaves using a sodium dodecyl sulfate potassium acetate extraction buffer. Samples were submitted to RAPiD Genomics LLC for library preparation, sequencing, and initial bioinformatics analysis. DNA concentration was normalized to 34 ng/μL, and 1.2 μg of each sample before sending. Processed samples were combined in equimolar amounts and sequenced on an Illumina HiSeq 2 × 100. Sequenced reads were cleaned and trimmed using the FASTX-Toolkit (http://hannonlab.cshl.edu/fastx_toolkit/index.html; accessed on 1 June 2022) after demultiplexing the raw data using Illuminas BCLtoFastq. Clean reads were aligned to the Sorghum bicolor V3.1 [39] reference genome using Mosaik [40]. SNPs were called using Freebayes [41]. Finally, SNPs were filtered following the criteria of read depth for each SNP ≥35 and minor allele frequency ≥2%. For analysis purposes, marker data were converted to numerical {0,1,2} format where the reference allele at each locus was assigned a value of 0, alternate allele 2, and heterozygotes 1. SNPs with more than two alleles were discarded (roughly 1% of the total). This resulted in a matrix M with dimensions 432 (number of clones) × 10,435 (number of SNPs), with each row representing a genotype and each column representing a single SNP locus.

2.4. Heritability Calculation

All data processing and statistical analysis was carried out using R software version 4.1.2 [42]. We calculated broad-sense and narrow-sense heritability for all traits in each of the three crop cycles separately, and for all crop cycles combined. In all cases, we fitted a mixed model of the following form:
y = X β + Z u + ε ; Var ( u ) = K σ u 2 ; Var ( ε ) = I σ ε 2  
Here, y is the univariate response, X is the fixed-effect design matrix, β is the vector of fixed effects, Z is the random-effect design matrix, u is the vector of individual clone effects, ε is the residual variance, K is proportional to the variance–covariance matrix of the random effects (K is set to an identity matrix when calculating broad-sense heritability and set to an additive genetic relationship matrix when calculating narrow-sense heritability), and I is the identity matrix.
We extracted the variance component estimates from the mixed model and estimated heritability as the ratio of the variance explained by genotype to the total variance: H ^ 2 = σ u 2 σ u 2 + σ ε 2 . We estimated broad-sense heritability for each crop cycle separately by fitting a mixed model with the trait values from a single crop cycle as the response variable y, no fixed effects, a random intercept u for each clone, and an identity matrix as the covariance matrix K for the random effects. We estimated narrow-sense heritability with a similar model but with the additive genetic relationship matrix A (calculated following the method of [43]) used as the covariance matrix K for the random effects.
When estimating heritability for all crop cycles combined, we fitted a mixed model again with the trait values from all crop cycles as the response variable, a random intercept for each clone, and a fixed effect of the crop cycle. As above, we used an identity covariance matrix to estimate broad-sense heritability and an additive covariance matrix for narrow-sense heritability. The calculation of the additive genetic relationship matrix and the estimation of the mixed model to extract the variance components were both carried out using the R package rrBLUP [39].

2.5. Model Fitting Methods

2.5.1. Data Preparation

We calculated the best linear unbiased predictor values (BLUPs) [44] for each trait by fitting a linear mixed model in which crop cycle (PC, RT1, and RT2) was treated as a fixed effect, the clone was a random effect, and row and column were additional random effects corresponding to the plot layout. The model was fitted to the data from all clones and checks that were present in each row and column. We extracted the fixed effect coefficients for each of the three crop cycles and the BLUPs (i.e., random intercepts) for each of the 432 non-check clones. We added each of the fixed effect coefficients for each crop cycle separately to the vector of BLUPs, resulting in a 432 × 3 matrix Y, with one value for each combination of clone and crop cycle.

2.5.2. Model Fitting with Cross-Validation

We fitted seven genomic selection models to each combination of 11 traits and three crop cycles. For each of these 33 combinations, we repeated the model fitting procedure 25 times. For each of the 25 iterations, we did fivefold cross-validation. Within each fold, the same training set (80% of the data) was used to fit all nine genomic selection models, and the same test set (20% of the data) was used to generate predictions. The training set was generated by randomly selecting 80% of the individuals. To address issues of singularity, we repeated the generation of the training-test split until the SNP marker matrix for the training set was full rank.
We fit seven genomic selection models (ridge regression BLUP (rr-BLUP), additive-dominance-epistasis (ADE), reproducing kernel Hilbert space (RKHS), Bayes A, Bayes B, support vector machine (SVM), random forest (RF) at each cross-validation fold. Details on each of the models follow:
RR-BLUP: This model was implemented in the R package rrBLUP [45]. We fitted a mixed model with an intercept as the only fixed effect and the genotype markers recoded to {-1,0,1} format as the random effects.
ADE: This model was implemented in the R package sommer [46]. We recoded the genotype markers to {−1,0,1} format and generated the additive (A), dominance (D), and epistatic (E) genetic covariance matrices. We fitted a mixed model with the intercept as the only fixed effect and the A, D, and E matrices as random effects.
RKHS, Bayes A, and Bayes B: Each of these three models was implemented in the R package BGLR [47]. For the RKHS model, we specified the covariance matrix as K = 1 n ( M × M ) where M is the matrix of SNP markers and n is the number of markers. We fitted the RKHS, Bayes A, and Bayes B models specifying Gaussian response distribution and allowed the model to run for 12,000 iterations, of which we discarded the first 2000 as burn-in iterations. Otherwise, the default arguments to the BGLR() function were used.
Support vector machine (SVM): This model was implemented in the R package e1071 [48]. The SVM models were parameterized with epsilon regression, using an L1 loss function to minimize the sum of absolute prediction errors. We fit the model specifying a linear kernel. We also tested radial and sigmoid kernels but found their performance to be uniformly worse than that of the linear kernel, so we do not present those results in this manuscript. Otherwise, the default arguments to the svm() function were used.
Random forest (RF): This model was implemented in the R package randomForest [49]. We recoded the marker data to {−1,0,1} format and fitted the model to the recoded marker data. We allowed the model to grow 5000 trees. At each split, we allowed the model to sample n markers with replacement as candidate variables, where n was the total number of markers. We set the minimum size of terminal nodes to 1; otherwise, the default arguments to the randomForest() function were used.

2.6. Evaluating Model Performance

For each model described above, we generated predicted values for the test set in each cross-validation fold. We then combined the five test set predictions to generate a vector of cross-validated predicted trait values for each iteration within each trait and crop cycle combination. To assess model performance, we calculated the Pearson correlation r between observed and predicted trait values. As an additional performance metric, we calculated the coincidence index (CI) between observed and predicted trait values. CI represents the proportion of clones observed to have the highest 20% trait values that also were predicted to be among the top 20% by the model. The expected value of CI for completely random predictions is roughly 0.167. Finally, we regressed the observed trait values on the predicted values from each iteration and extracted the intercept and slope coefficients from those regressions; the expected values of the intercept and slope for a perfectly accurate and unbiased prediction are 0 and 1, respectively. All results were presented in the form of the box and whisker plots. In these box and whisker plots, the thick central line indicates the median value from 25 iterations of model fitting, the colored box represents the central 50% quantile interval, the lines extending from the box encompass the largest value no further than 1.5 times the interquartile range from the edge of the box, and any points outside that range are plotted individually. The dashed line represents the null expectation for each metric of model performance (0 for prediction accuracy and 0.167 for coincidence index).

2.7. Trait-Assisted Genomic Selection

To assess whether trait information from previous crop cycles could be used to improve predictions of traits in future crop cycles for the same individual, we performed trait-assisted genomic selection on each trait separately [50]. This approach involves fitting a mixed model with a multivariate response so that different traits can borrow predictive power from one another. We fitted a separate model for each trait but used trait values from multiple crop cycles as the multivariate response. We fitted two models: the first used the PC and RT1 trait values, and the second used the PC, RT1, and RT2 trait values. As before, we used fivefold cross-validation, with the following difference: in the first model, we did not hold out any PC values, only the RT1 values for each fold. Therefore, both the genetic marker data and the information about covariance between PC and RT1 trait values contributed to the prediction of RT1 trait values for the holdout set. Similarly, in the second model, we held out only the RT2 trait values so that covariance with PC and RT1 trait values contributed to the prediction of the held-out RT2 traits. The model took the following form:
Y = Z u + ε ; Var ( u ) = A σ u 2 ; Var ( ε ) = I σ ε 2
Here, Y is the multivariate response with either two or three columns of trait values from each crop cycle and the values for the most recent crop cycle in a single cross-validation fold held out, Z is the random-effect design matrix, u is the vector of random effects, ε is the residual variance, A is the additive genetic relationship matrix proportional to the variance–covariance matrix of the random effects, and I is the identity matrix. We evaluated model performance in the same way as described in Section 2.5 above. The model was fit using the R package sommer [40].

2.8. Investigating the Effect of Marker Density on Model Performance

To determine whether we could achieve comparable performance with fewer markers, we fit the same models described above with a reduced number of markers. We randomly sampled subsets of markers including 20%, 30%, 50%, 60%, 80%, and 90% of the total (10,345 SNPs). For each of those proportions, we repeated the same procedure including 25 iterations of fivefold cross-validation for each combination of the 11 traits by three crop cycles. We assessed model performance in the same way as for the models fitting the full marker set.

2.9. Investigating the Effect of Population Size on Model Performance

To determine whether we could achieve comparable performance using fewer clones, we fitted the same models as described above with a reduced number of clones. Within each cross-validation fold, after generating the training set consisting of 80% of the data, we randomly sampled a subset of clones including 20%, 30%, 50%, 60%, 80%, and 90% of the total number of clones (432) comprising the training set for that fold. We ensured that the genotype matrix for the smaller subset was not rank-deficient. For each of those proportions, we repeated the same procedure, including 25 iterations of fivefold cross-validation for each combination of the 11 traits by three crop cycles. We assessed model performance in the same way as for the models fitting the full set of clones.

3. Results

3.1. Trait Distribution and Heritability

The distribution, mean, standard deviation, and co-efficient of variation of all tested traits across three crop cycles are included in supplementary Figure S1 and Table S2. Distribution graphs revealed that all of the evaluated traits were approximately normally distributed over three crop cycles, although the value ranges differed in different crop cycles except for that of Brix. The mean values of the PC for the tested traits were higher than those of the ratoon crops excepting Brix and FC values. The mean Brix percentage was similar in PC, RT1, and RT2 while the mean FC value was lower in PC than in ratoon crops.
The broad- and narrow-sense heritabilities of all tested traits are shown in Table 1. As expected, broad-sense (H2) heritabilities for all traits across three crop cycles and combined were higher than narrow-sense (h2) heritabilities. Both broad- and narrow-sense heritabilities for most traits except SP were higher in PC than in the ratoon crops. The highest and lowest broad- and narrow-sense heritabilities were associated with SD (0.87 and 0.81, respectively) in PC and Brix (0.22 and 0.15, respectively) in RT2, respectively. The ranges of broad- and narrow-sense heritabilities were 0.30 (Brix) to 0.52 (SP) and 0.22 (Brix) to 0.41 (SP) when estimated from the data combining all three crop cycles.

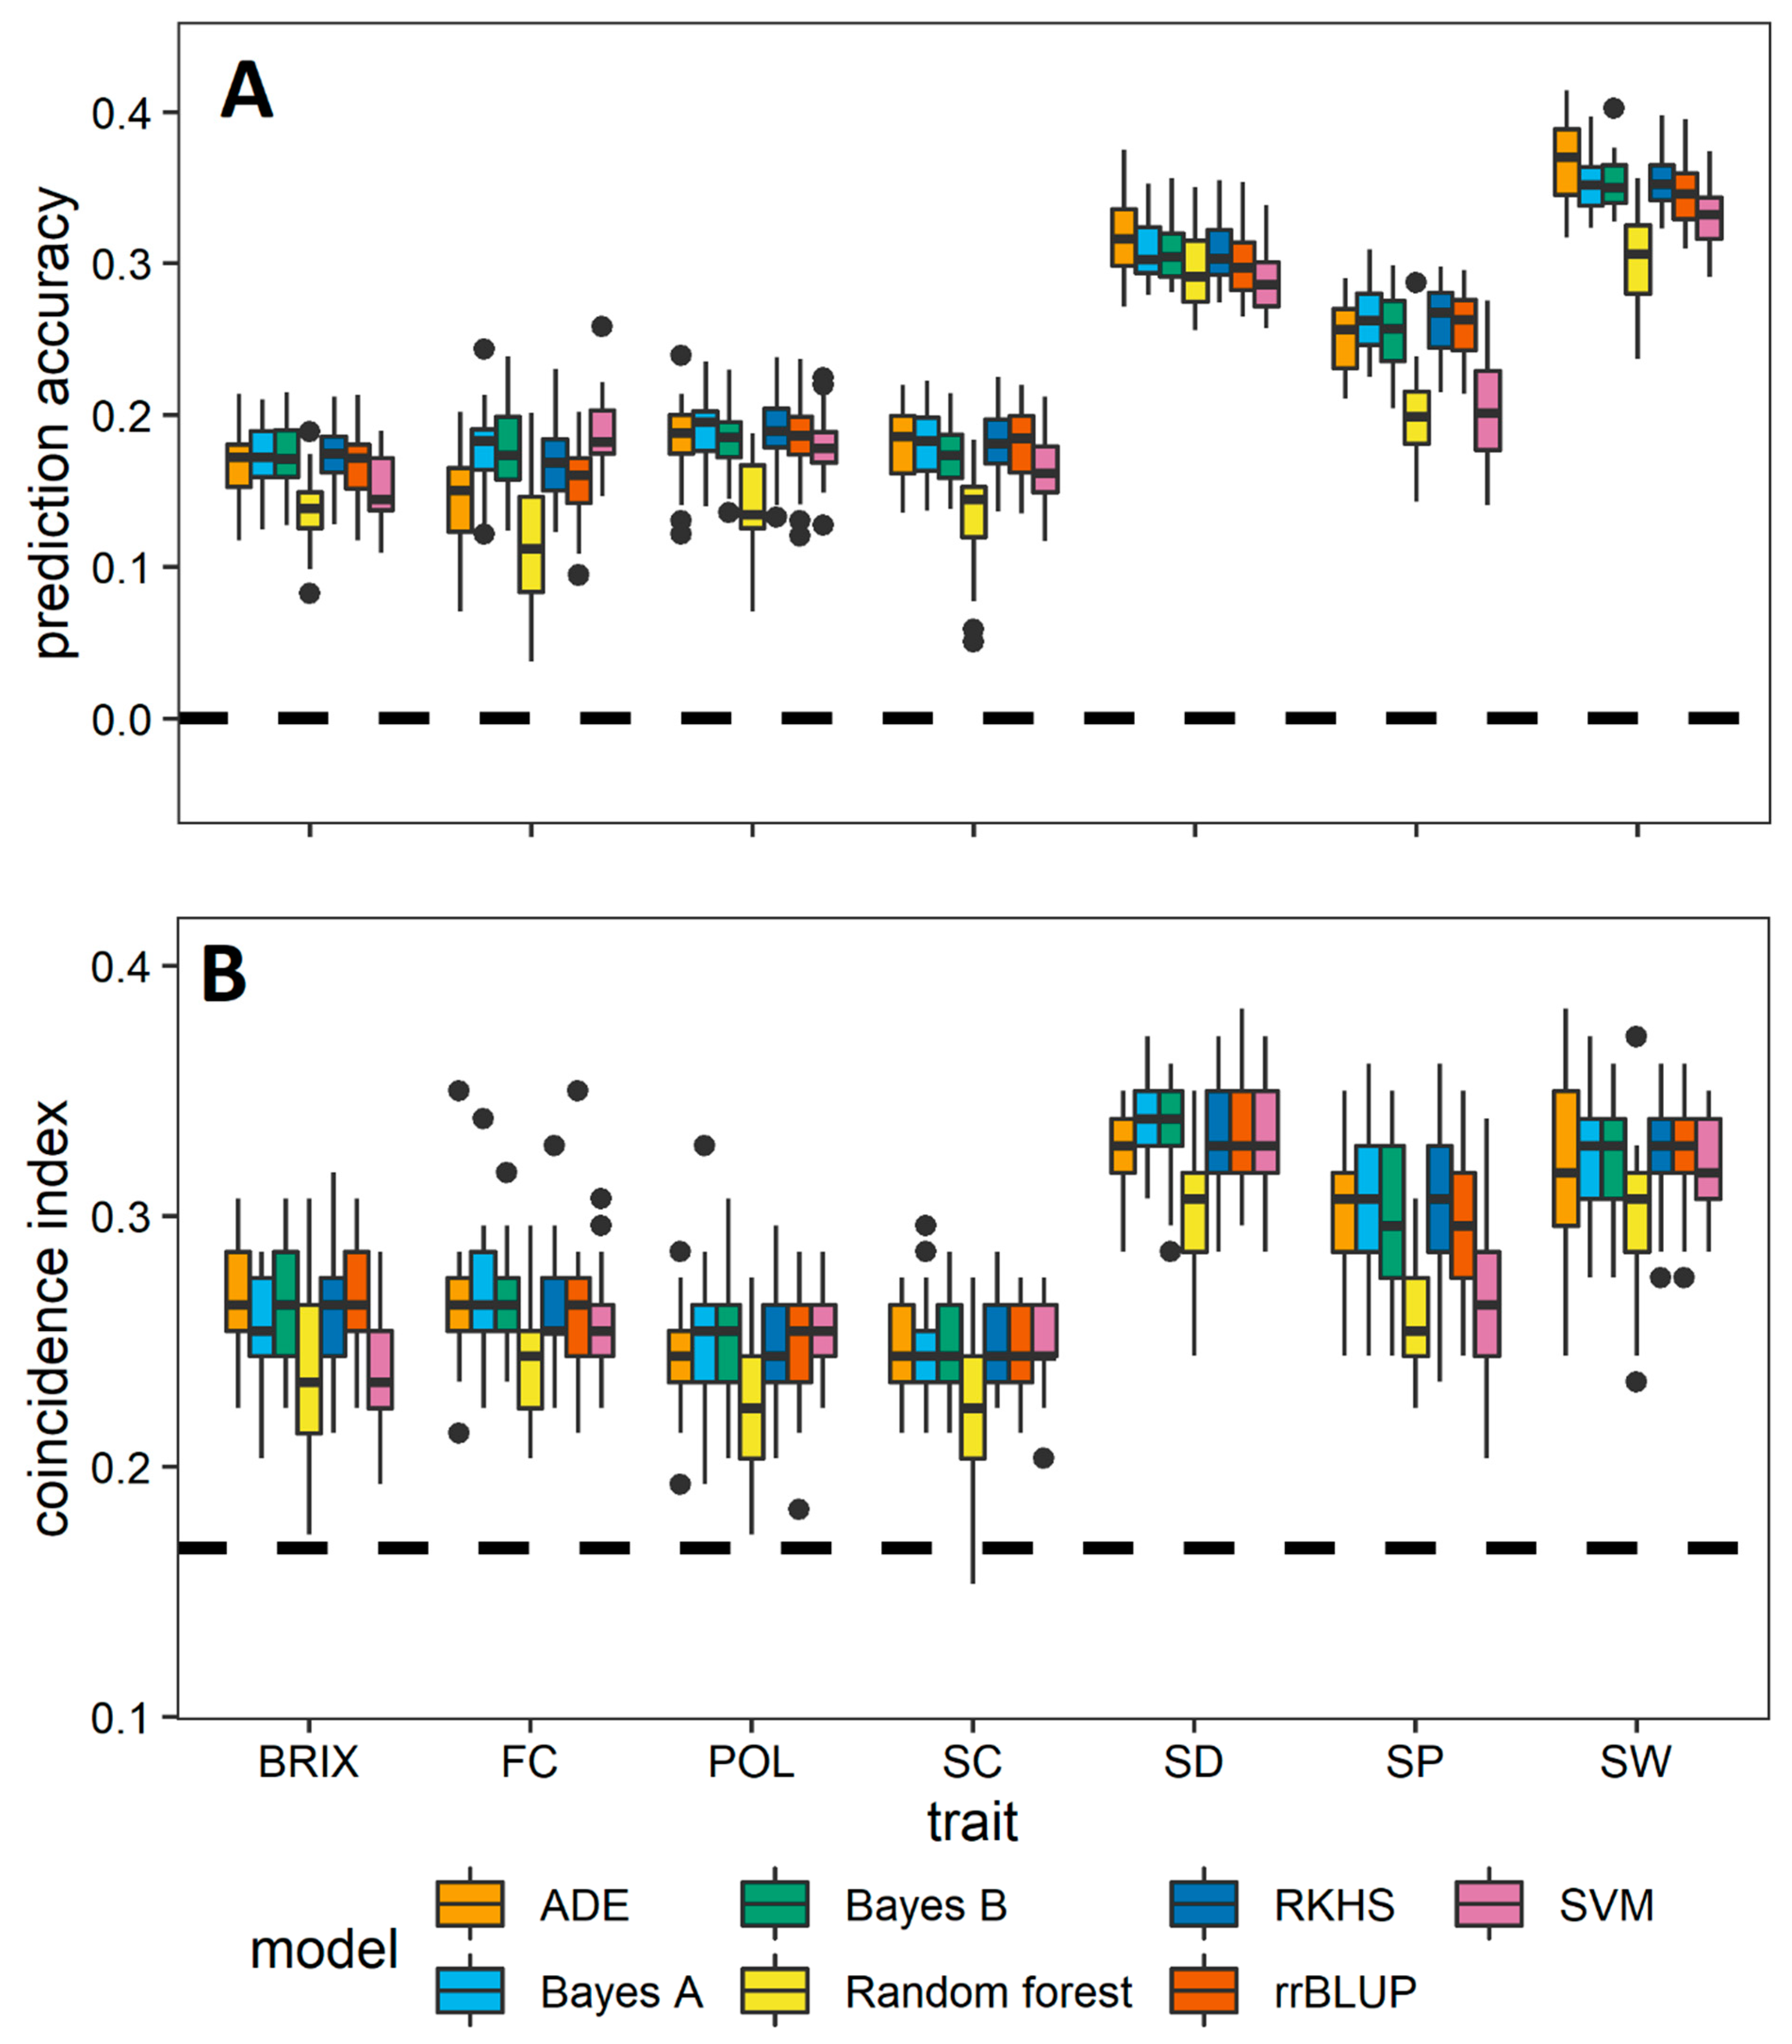
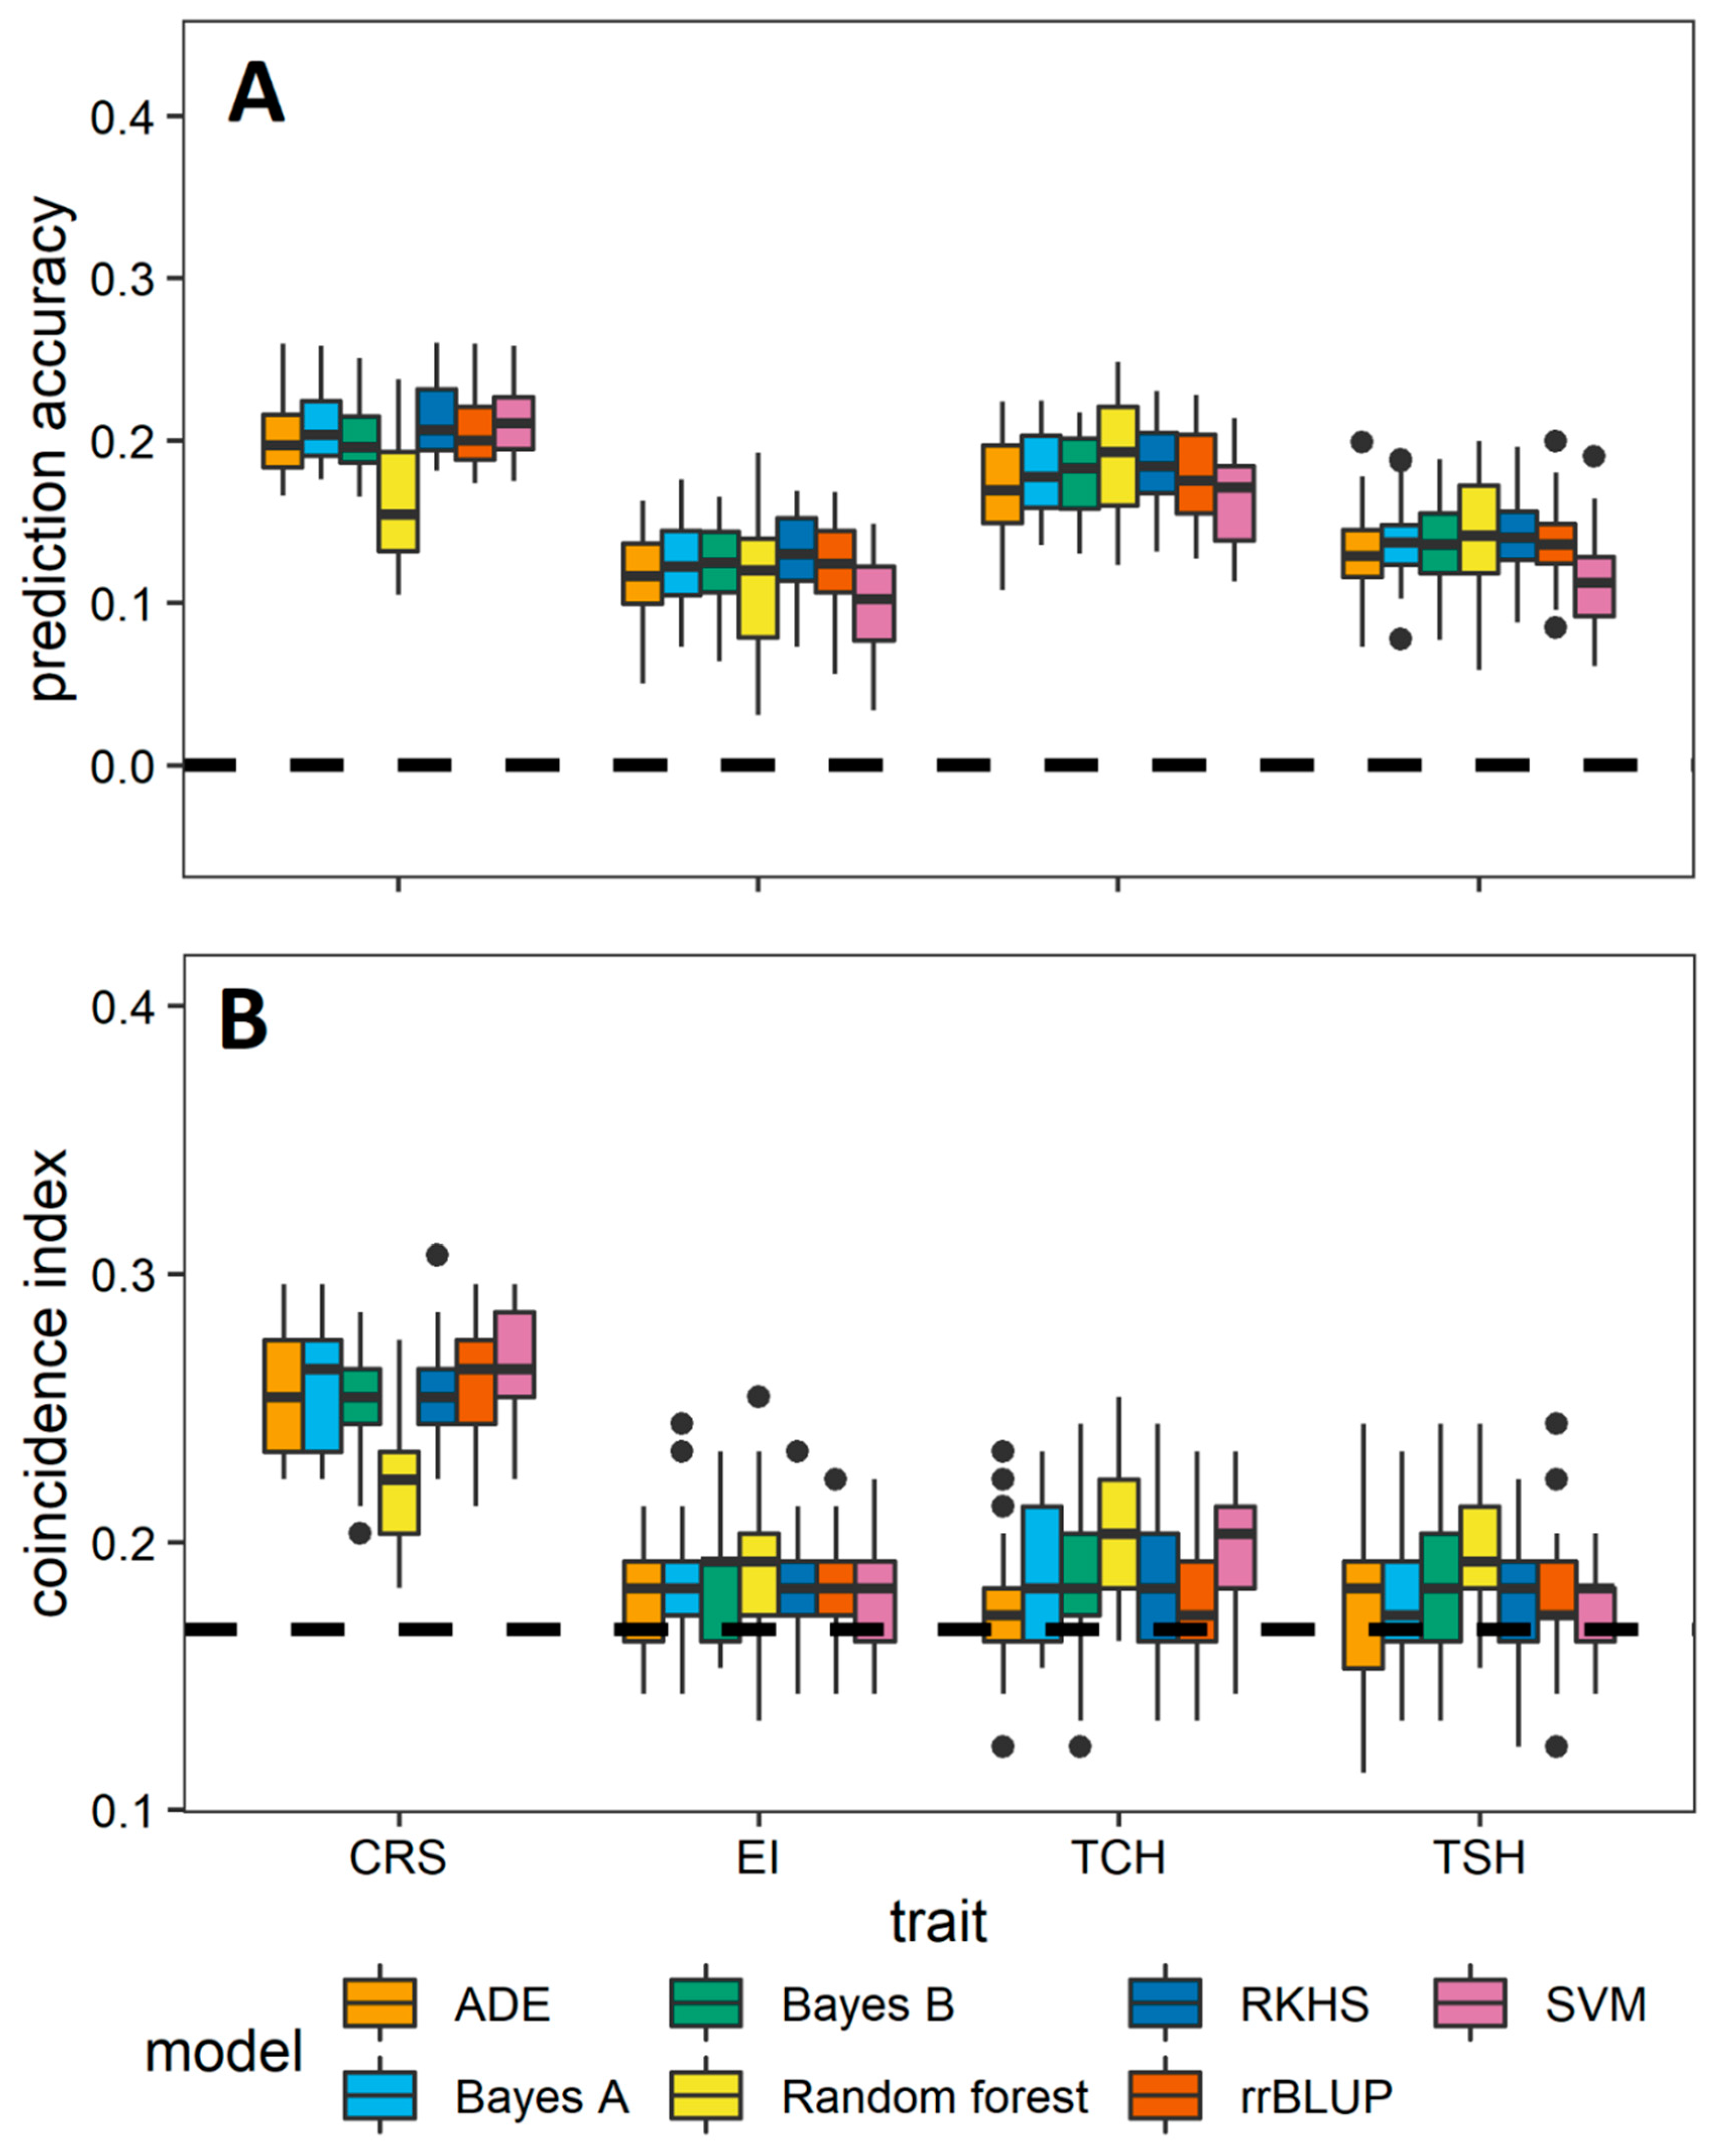
3.2. Comparative Evaluation of Different GS Methods

The performance of the GS models was evaluated using four different metrics (prediction accuracy, CI, slope, and intercept). The CI signifies how likely the GS models are to select the individuals that have the optimal phenotypic performance. The prediction accuracy and CI for primary and secondary traits are presented in Figure 1 and Figure 2 for PC and supplementary Figures S2 and S3 for all three crop cycles (PC, RT1, and RT2), respectively. The trends of prediction accuracy and CI for all tested traits were more or less similar for all three crop cycles (ranges from 0.11 to 0.37). Among the models, the overall performance of RKHS and ADE was a little better than that of all of the other models across all traits and crop cycles. The prediction accuracy was highest for SW (0.37) while the coincidence index was highest for SD (0.34) among the primary traits. Among the secondary traits, both prediction accuracy and the coincidence index were highest in CRS.
The index of the models’ prediction bias was measured as slope and intercept of the regression of predicted versus observed trait breeding values. The results showed that both the slope and intercept distribution of RF severely deviated from the expected values of 1 and 0, respectively, despite the similar prediction accuracies (Figures S4 and S5). Once again, ADE showed better performance in terms of slope (close to 1) and intercept (close to 0) values as it showed little or no bias.

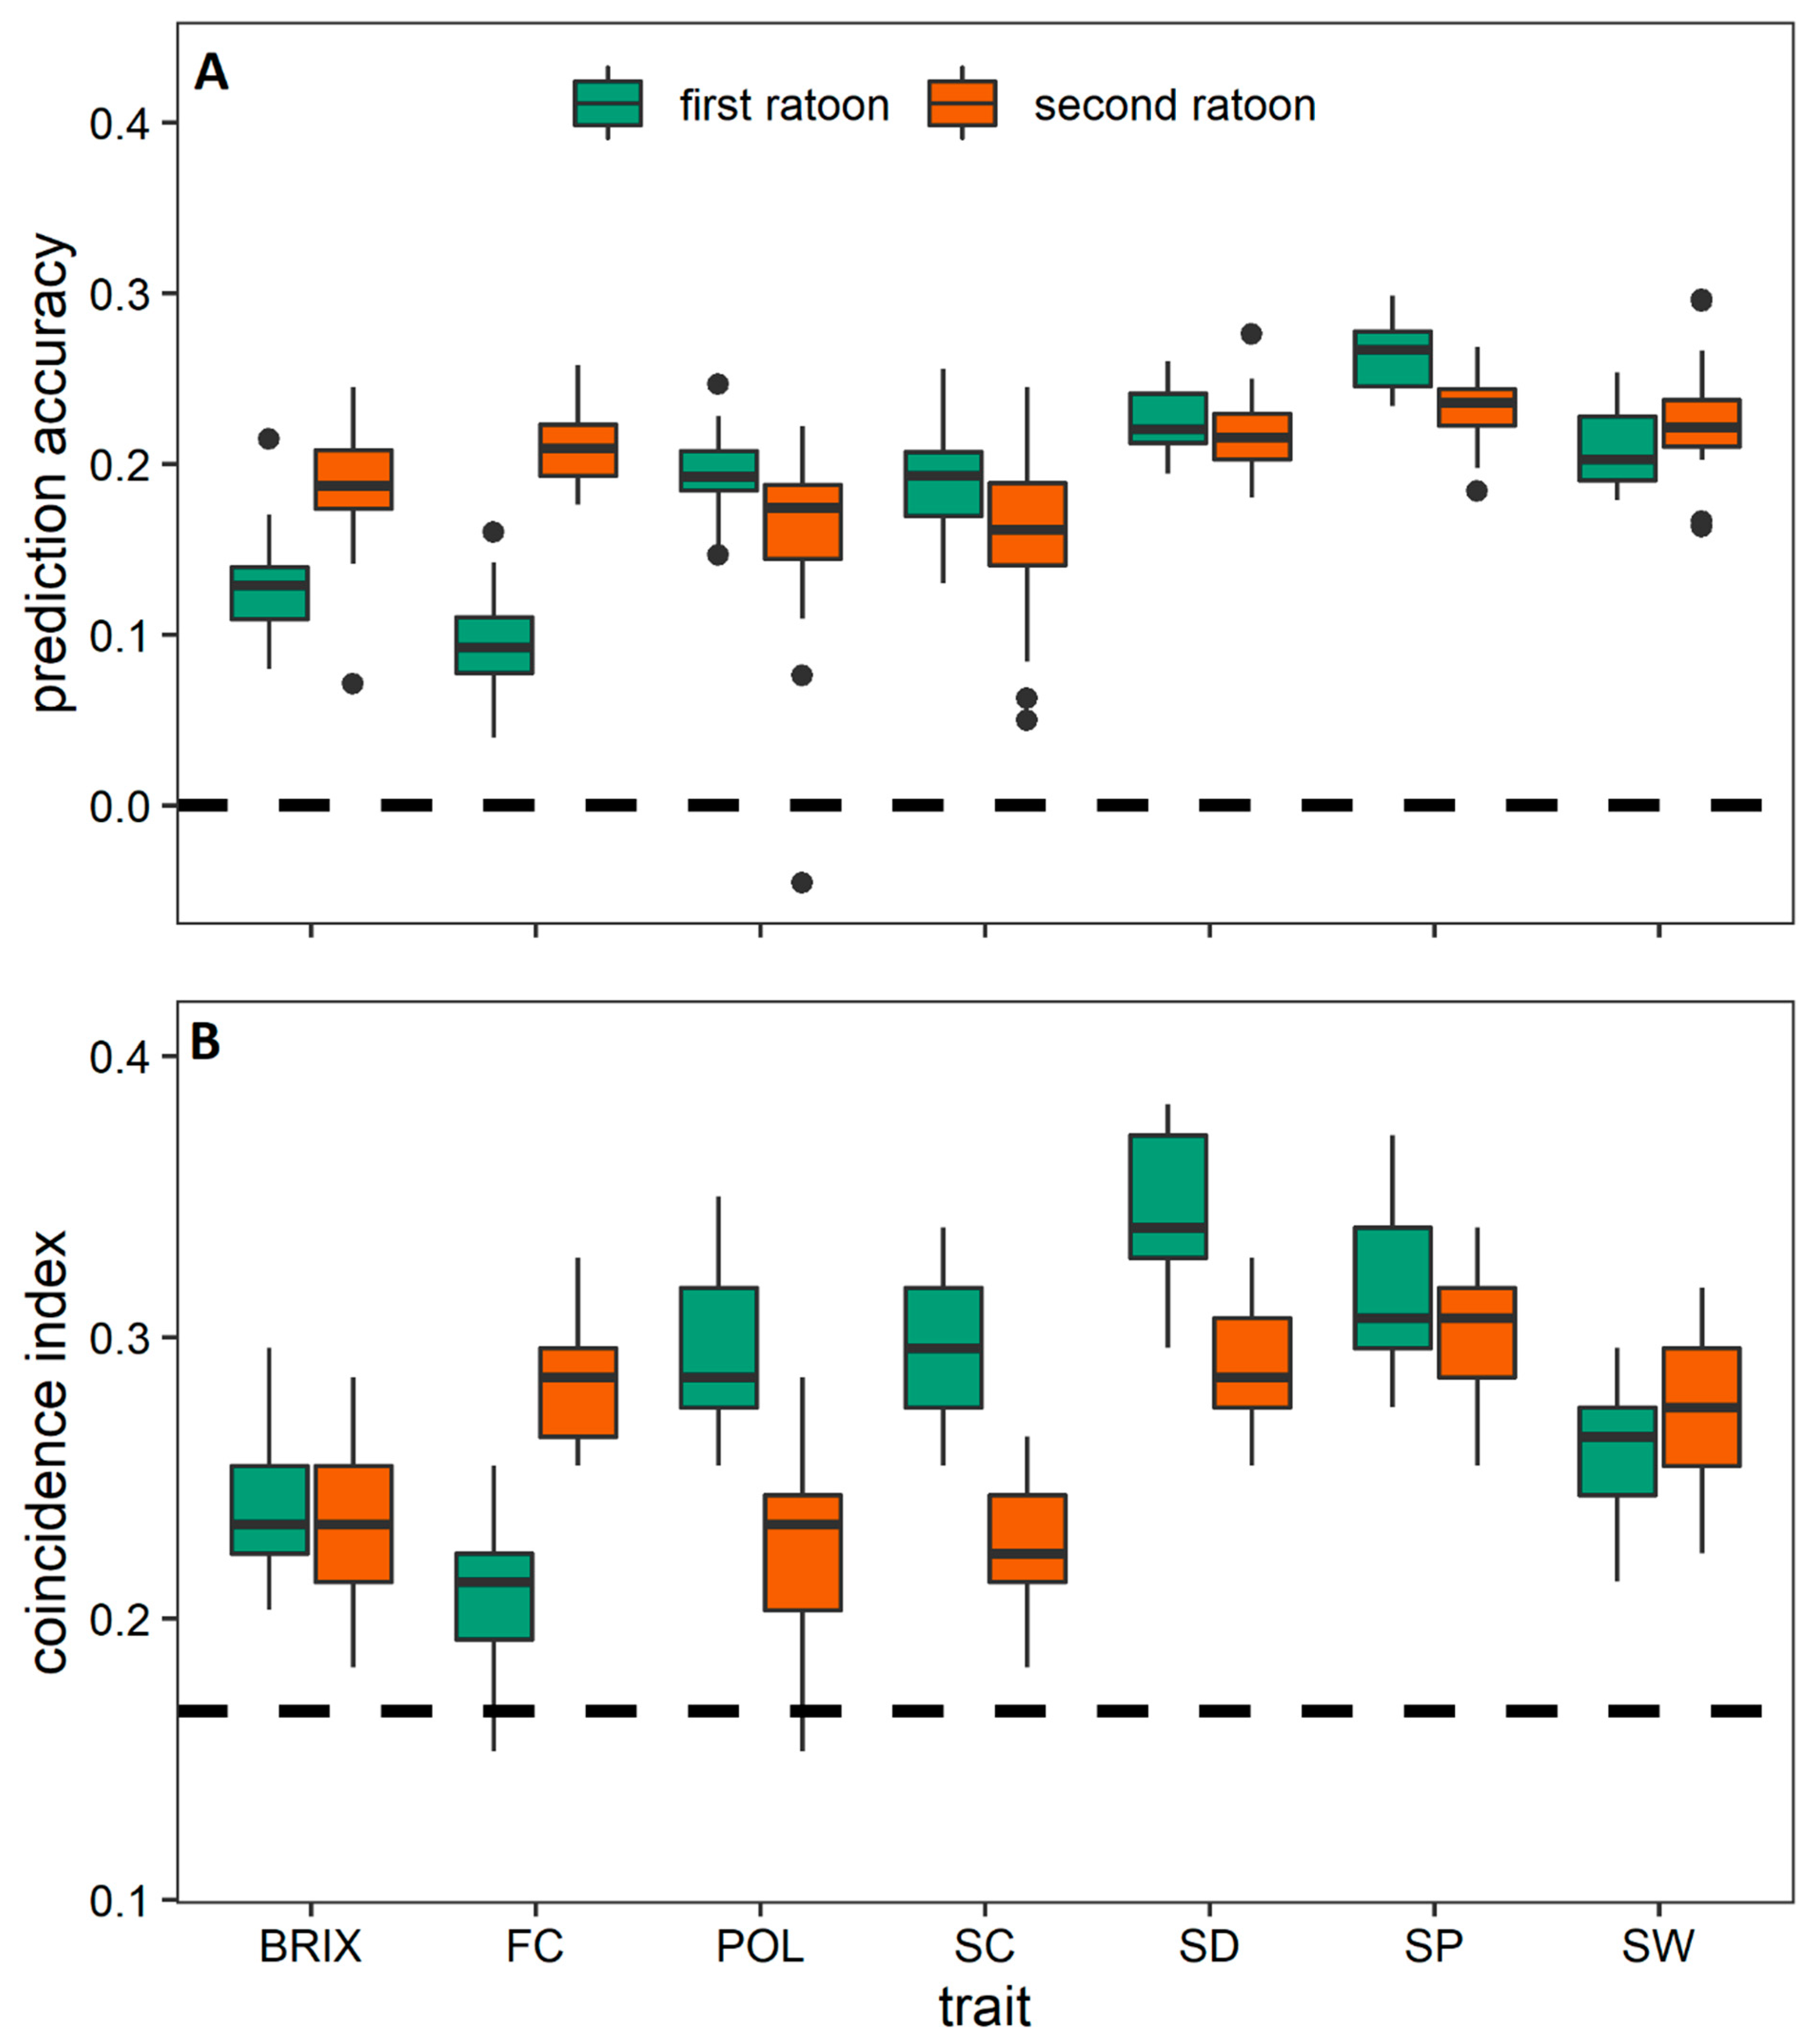
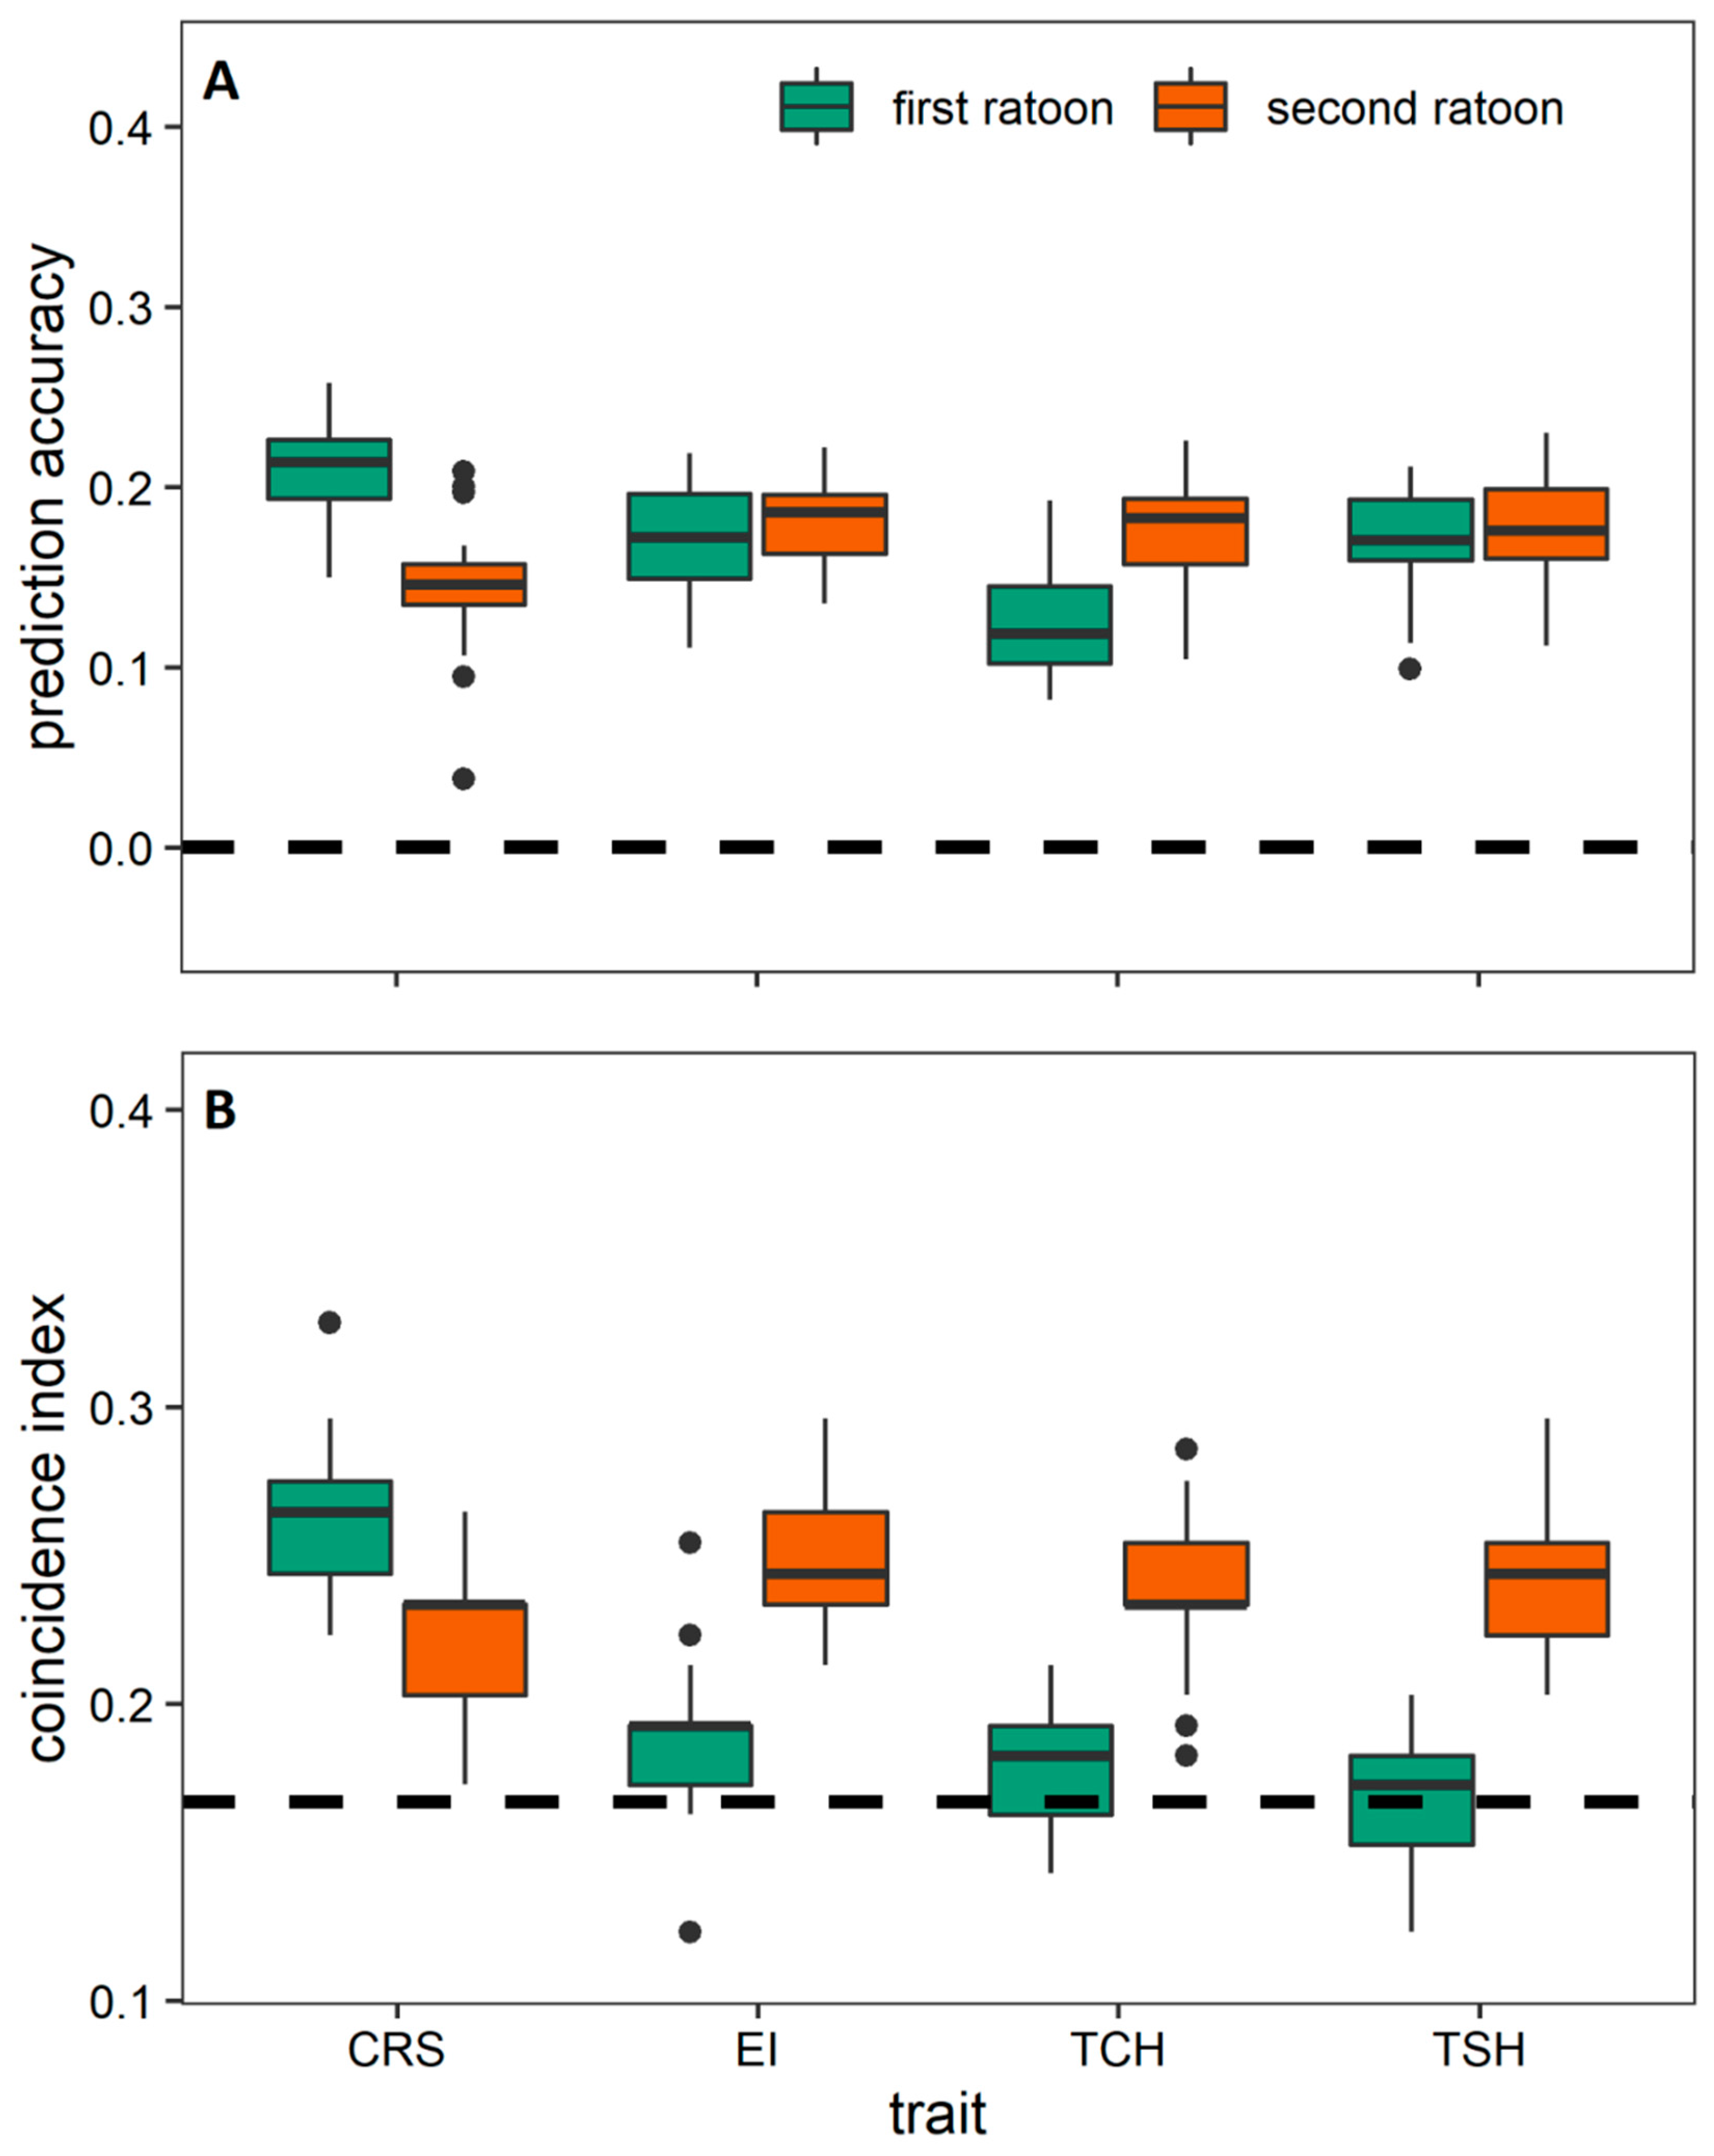
3.3. Prediction among the Crop Cycles through Trait-Assisted Prediction Model

We obtained fivefold cross-validation prediction accuracy and coincidence index values using PC data as the training set and ratoon data as the validation population through trait-assisted GS (Figure 3 and Figure 4). We observed a wide range of prediction accuracy values for both RT1, from 0.09 (Pol) to 0.26 (SP), and RT2, from 0.14 (CRS) to 0.23 (SP). The trait SP was predicted well for RT1 and RT2 crop cycles using the PC data. The overall prediction accuracy was higher in RT2 than that of RT1.

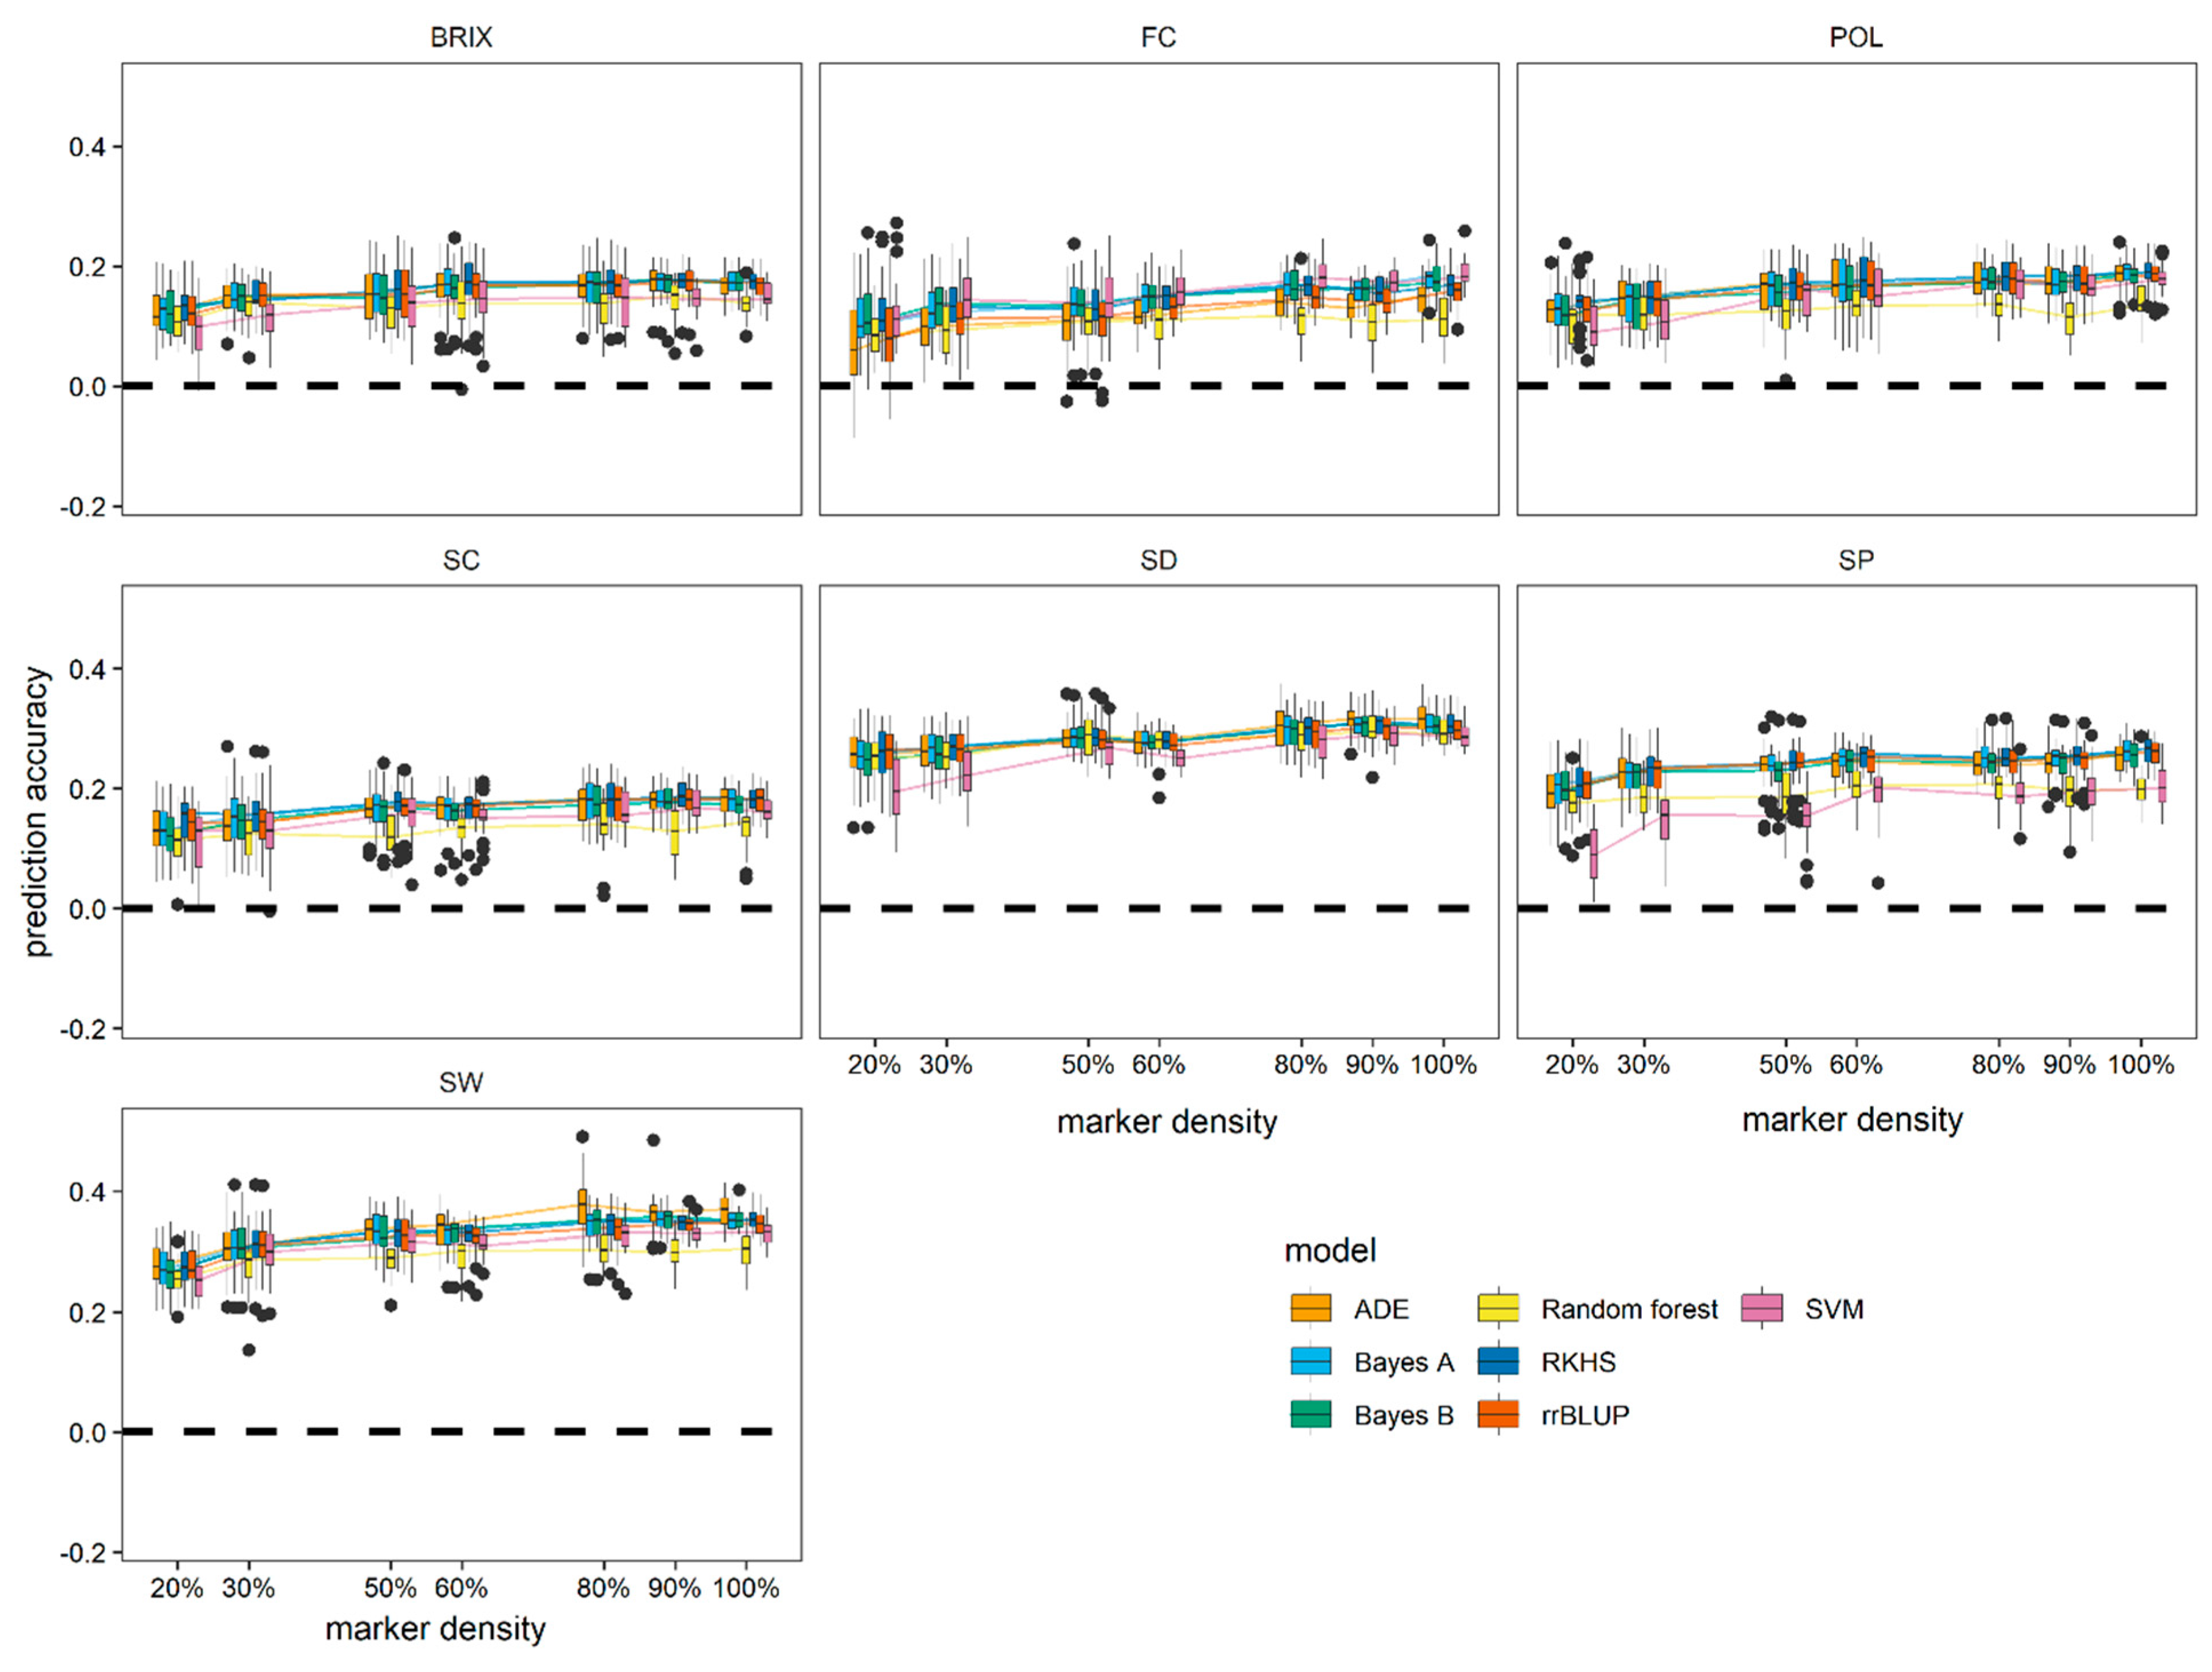
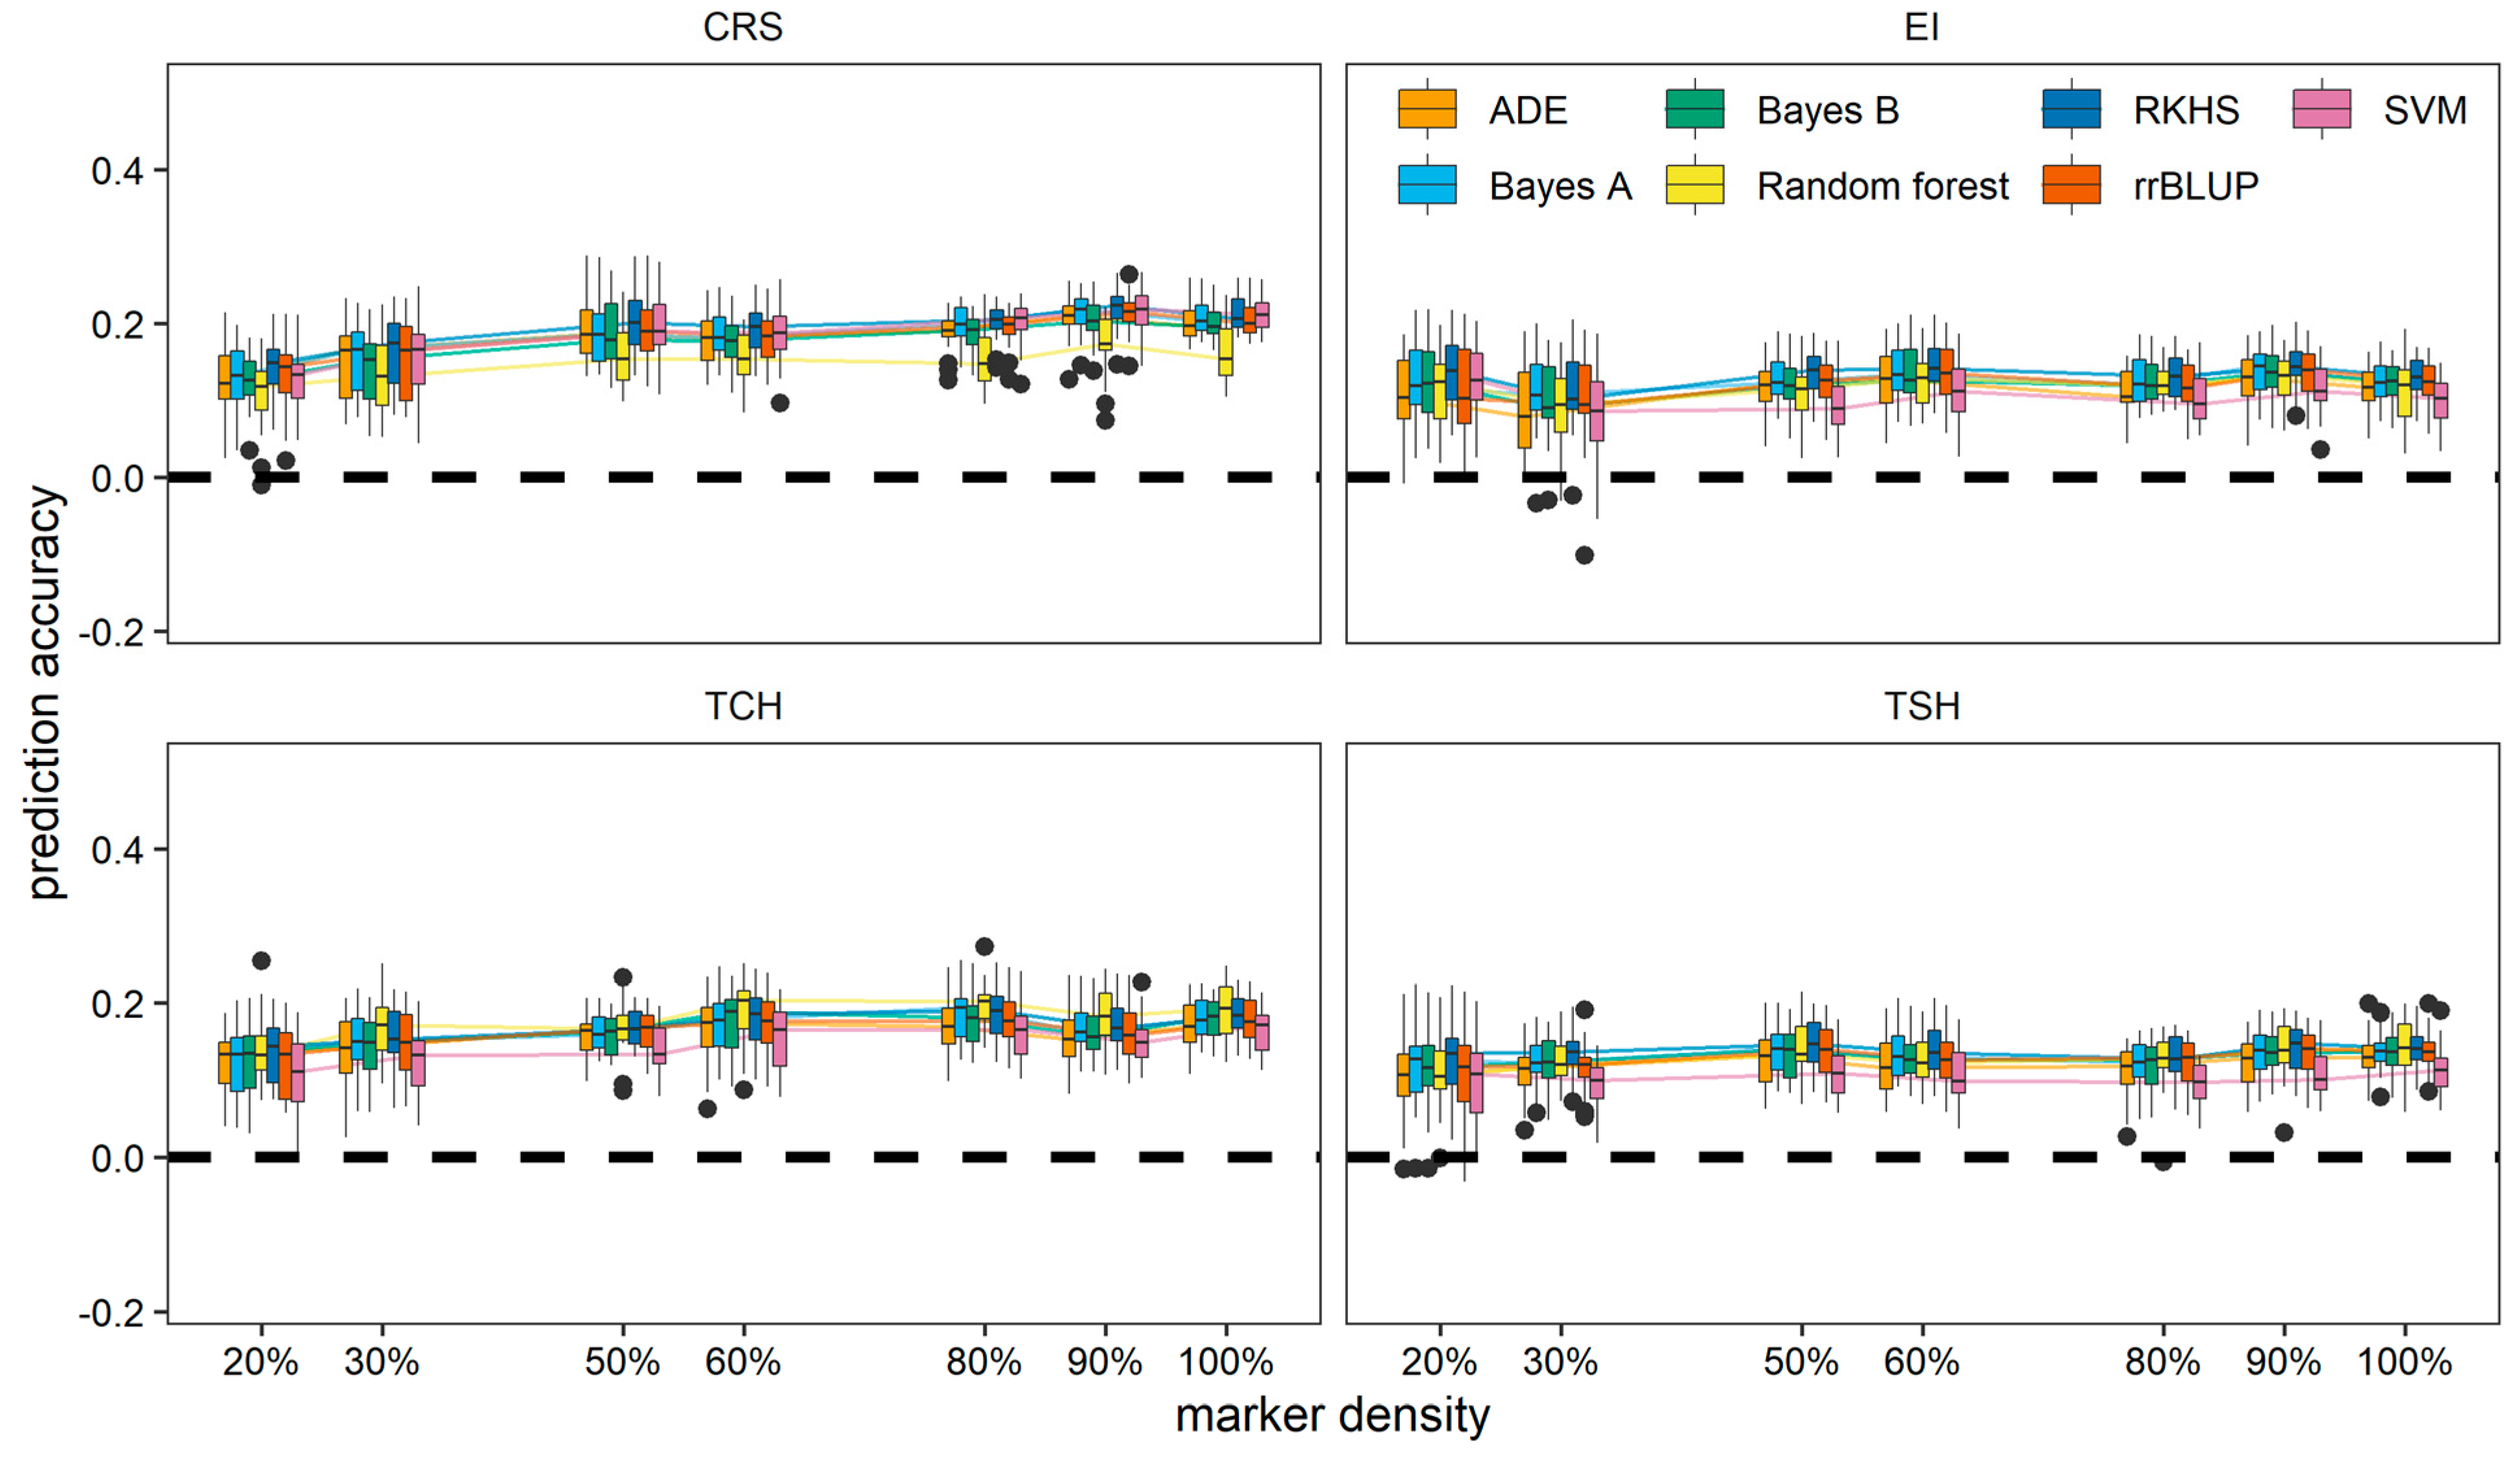
3.4. Effect of Marker Density on Model Performance

Several factors, including genome size, linkage disequilibrium (LD) decay rates, and the number of QTL for the traits, influence determining the optimum number of markers needed for a certain GS study. In order to find out the minimum number of markers needed to attain comparable prediction accuracy for all tested traits, all seven GS models were assessed using all sample data across three crop cycles. In general, two machine learning models (RF and SVM) performed worst of all the tested models regardless of marker density and crop cycles for most of the traits (Figure 5, Figure 6, Figures S6 and S7). The prediction accuracies for all GS models increased marginally with an increasing number of markers. A plateau was observed above 5218 (50%) tested markers for all tested traits across three crop cycles.

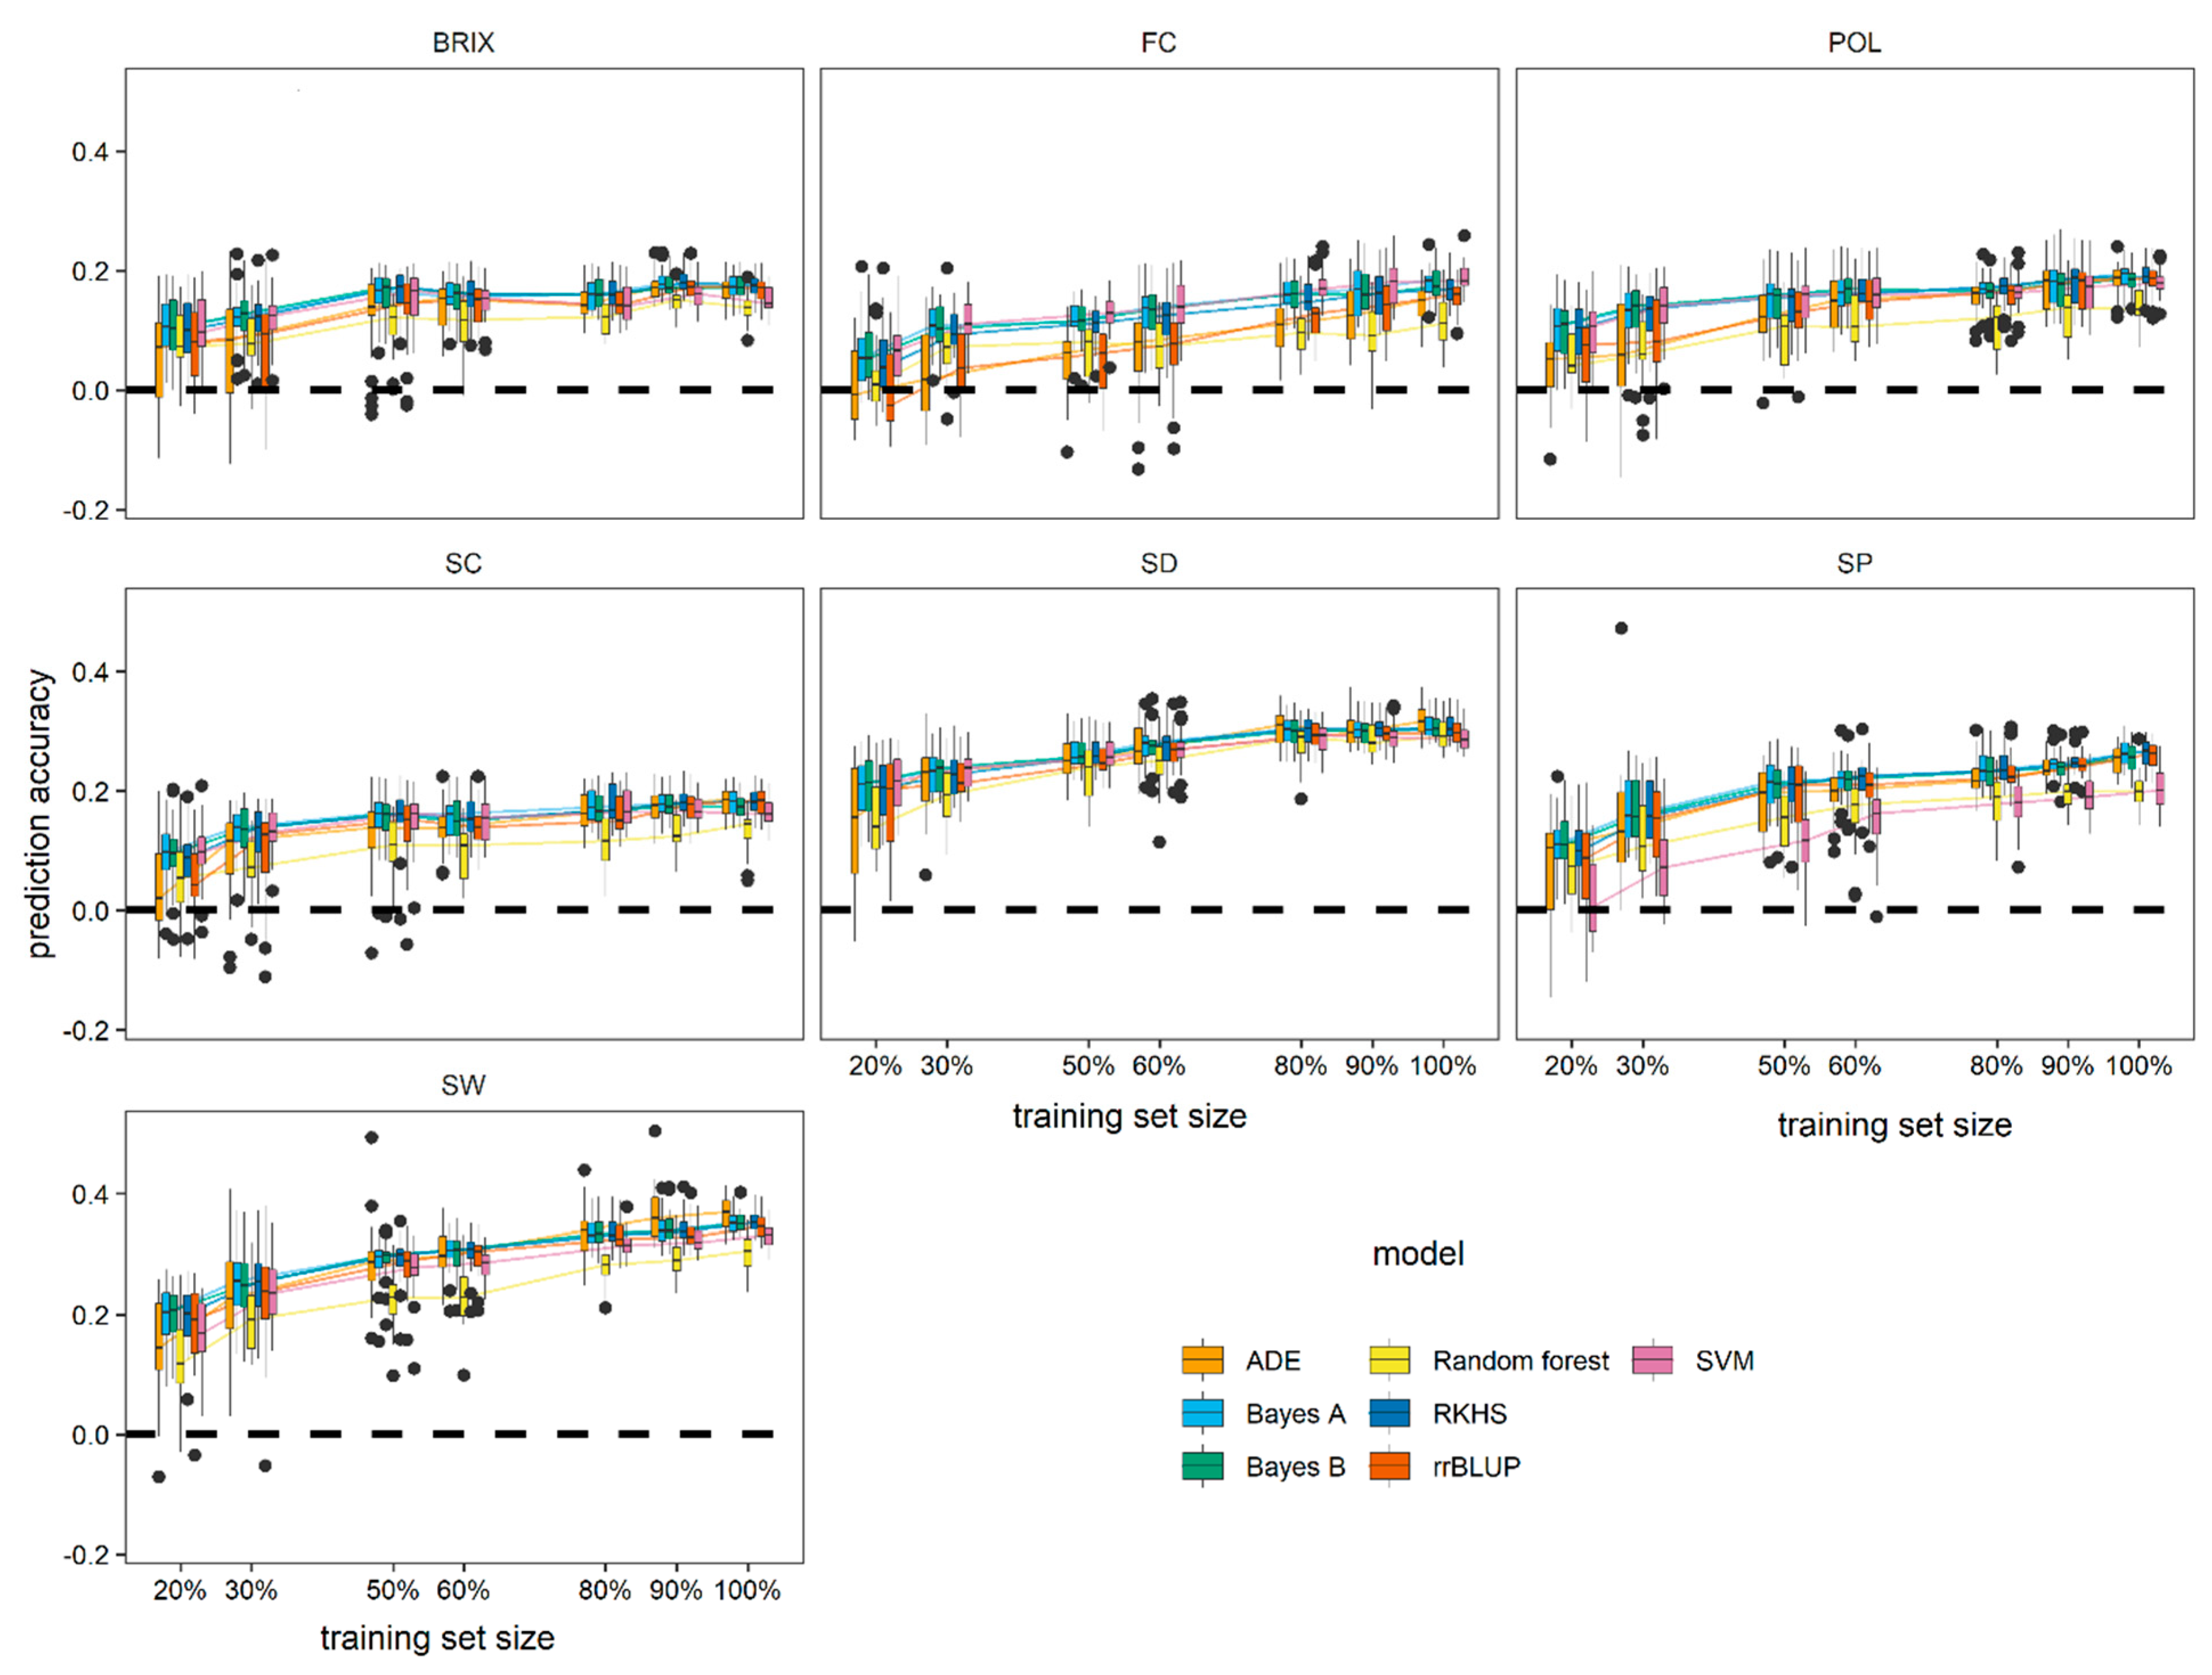
3.5. Effect of Training Population (TP) Size on Model Performance

As expected, the prediction accuracy gradually increased with TP size for all traits across all crop cycles (Figure 7, Figure 8, Figures S8 and S9). Although the rate of change was more or less identical across three crop cycles, prediction accuracy was however different across traits and GS models. Unlike those of other models, the prediction accuracies of ADE and rr-BLUP were lower with the smallest TP size, n = 87 (20%), and continued until n = 346 (80%) where RF (in general) started to outperform other models. Despite TP size, GS models Bayes A, Bayes B, and RKHS performed better than other models while RF performed worst. The plateauing of prediction accuracy for most of the traits was observed at the TP size n = 346 (80%), except in the cases of Brix, EI, and TSH, reaching a plateau at the TP size n = 259 (60%) across all three crop cycles.

4. Discussion

The prospect of GS in future sugarcane hybrid breeding was experimentally evaluated using seven different GS methods in this study. Sugar- and yield-related traits were evaluated and fivefold cross-validated prediction accuracy differed by trait and by crop cycle; there were only small differences in prediction accuracy among the different models. Utilizing a trait-assisted GS model, we could effectively predict the fivefold cross-validated GEBV of ratoon crops using both SNPs and trait values from the plant cane crop. The minimum number of markers and TP size for conducting a successful GS study in sugarcane were also optimized in this research. The findings of this study could open a new avenue for improving sugar- and yield-related traits in sugarcane through breeding.
There are several challenges facing sugarcane breeders, including the complexity of the genome, size of the genome (10 Gb), ploidy level, types of polyploidy, mode of propagation, non-additive genetic variation, and longer breeding cycles associated with improving genetic gains of key sugar and yield traits in sugarcane through breeding [1,2,31]. Currently, sugarcane breeding programs worldwide depend on extensive conventional phenotypic selection through time-consuming selection stages, so a single breeding cycle could take more than ten years. The genetic gain for key sugar content and yield traits has plateaued in the past decade [21]. Molecular breeding techniques such as GS could effectively shorten the breeding cycle and enhance the genetic gain per breeding cycle, as reported in other crops [7,28,51] and sugarcane [18,31,32,33,34,34,35]. Due to continuous hybridization in the breeding program, new and different combinations of minor alleles could change the genetic makeup of the breeding population, affecting traits differently. Thus, it is necessary to recalibrate the prediction models of GS for a specific breeding program in a specific environment in order to get the most effective performance. We conducted this study using our breeding materials in our environment using the different genotyping methods and seven different GS models including machine learning algorithms and ADE, which gave us new insights into GS in our breeding program. Previous studies used either DArT markers [18] or Affymetrix Axiom SNP array genotype data [24,31,33], while we used SNPs created from an NGS-based Exom enrichment genotyping method. It is reported that our genotyping method has added advantages over SNP array markers because it has less intrinsic bias due to nonrandom sampling of polymorphisms in the desired population [51]. Unlike other previous studies [24,31,33], our phenotypic data of 11 sugar- and yield-related traits were collected from dedicated replicated trials designed for this study over three crop cycles (PC, RT1, and RT2), resulting in a well-balanced dataset. The other two studies conducted by Olatoye et al. [32] and Voss-Fels et al. [35] were based on data from the simulated breeding generation.
The distribution of phenotypic data for all traits was continuous (Figure S1) and more or less normal, suggesting that the inheritance of those traits is governed by several QTL (major and/or minor) over three crop cycles. The results were congruent with several other genetic studies in sugarcane of the same traits [6,26,52,53]. Broad-sense heritabilities of all tested traits were higher than narrow-sense heritabilities for respective traits across three crop cycles and combined (Table 1), indicating that there were variances other than the additive variance in the phenotype values. Overall, both broad- and narrow-sense heritabilities for almost all traits were slightly lower than expected and gradually decreased from PC to RT2. The possible explanations include the small single-row plots used in this study, competition among the plants in a row, harvesting time effect, bias in selecting ten stalk samples, and/or other unmeasured environmental variations including biotic and abiotic stresses contributing to variation in evaluated yield and sugar traits. It was previously reported that sugarcane yield was affected by the competition effects and background noise contributed by environmental variation [25,31,54]. Another reason may be that the evaluated traits have a substantial amount of non-additive elements of genetic variation, potentially up to two-thirds of the total variation in sugarcane [24,25,33]. The low heritability estimates, especially for narrow-sense heritability, in this study are consistent with earlier reports [24,25,54]. In addition, several sugarcane diseases caused by bacterial, fungal, and viral pathogens are transmitted by infected seed canes. These pathogens survive and grow inside the infected canes from PC to ratoon crops, limiting nutrient for plants and resulting in reduced growth and yield [55,56,57,58].
Seven different models (three parametric, and four non-parametric including two machine learning models [59]) were evaluated in this study to asses prediction accuracy using fivefold cross-validation. Prediction accuracies ranged from 0.11 (EI with model SVM) to 0.37 (SW with model ADE). This low-to-medium prediction accuracy was in agreement with the prediction accuracy of brown and orange rust resistance in our earlier report [34] as well as with results stated in the earlier GS studies on sugarcane [24,31]. As the previous reports state, the performance of different GS models varied across different crop cycles and testing traits [59,60]. The literature suggests that several factors affect the prediction accuracy of breeding values through GS, including marker density, QTL number, model assumptions, population size, heritability, genetic architecture for the trait, and relatedness [61,62]. It is plausible that several unaccounted for phenotypic variances, explained by allele dosage effect, non-additive genetic effect, heterozygosity, low heritability, and environment, might underlie the low prediction accuracy in this study. To determine the effect of low heritability on the prediction accuracy of tested traits, we created a scatter plot between prediction accuracy and the heritability of evaluated traits (Figure S10). The results indicated that low-heritability traits had low prediction accuracies, in agreement with our previous study [34] and other published reports [24,31]. Although ADE and RKHS models tended to have slightly higher prediction accuracies for most traits compared to other models, the differences were not as large as expected. The lack of performance improvement from considering additive variance might be correlated with the use of only single dosage markers and variations in allele dosage, which might not be accounting for additive effects properly [24,31]. Due to the lack of availability of bioinformatics tools and genotyping techniques for polyploid organisms such as sugarcane, the SNP markers were called only as present or absent for the allele. Hence, variation due to the number of copies of each allele, which we could not account for, may be vital in affecting trait performance. Thus, future work should test whether including allele dosage information in the GS prediction model increases prediction accuracy. Further studies are suggested to improve the prediction accuracy of sugarcane traits through GS by incorporating and/or overcoming those limiting factors.
One of the most desirable traits in the sugarcane industry is the ratooning ability, or the ability to yield consistently across crop cycles. High ratooning ability results in low annual replanting costs and increased profitability. Due to labor shortages, replanting sugarcane is very costly. Breeders are conducting multi-location trials over multiple crop cycles (e.g., PC, RT1, and RT2 in Florida) to achieve decent sugar and ratooning ability, which would effectively increase the breeding cycles and cost. We used a trait-assisted GS model to predict the ratoon crops’ (RT1 and RT2) breeding values for the tested traits using PC phenotype data. This step would allow breeders to reduce the ratoon crop cycles from the selection process, and shorten the breeding cycle [63,64]. The results revealed that the prediction accuracies for RT1 were higher than that of RT2 for most traits when PC phenotype data were used. SP and TCH prediction accuracies were the highest and lowest, respectively. Although it is suggested that trait-assisted prediction models should improve the prediction accuracy, we found that their overall prediction ability was lower and roughly similar to the single-trait prediction models’ accuracy, consistent with many other similar studies [65,66]. The lower prediction abilities using this technique in this study could be attributed to the combination of weak correlations between PC, RT1, and RT2 data for the respective traits (Table S3) and their heritabilities [63,64,66]. In addition, other unaccounted for factors (environment, dosage effects, heterozygosity of alleles, and polyploidy) might have also influenced the observed lower prediction accuracy in sugarcane.
The genomes of modern sugarcane cultivars have high LD because those clones are less diversified genetically, since a small number of founder clones have been utilized by the breeders over 100 years [21]. The success of this or any GS study greatly depends on capturing all genotypic variability in the genome by covering all the available LD with markers [15]. Thus, the extent of LD in the genome is negatively correlated with the number of markers needed for any genomic study. In this research, the prediction accuracies were gradually rising as the number of SNPs increased in the tested models; however, slight or no progress was recorded in all tested traits across three crop cycles after including more than 5218 (50%) SNPs (Figure 5 and Figure 6). Similar patterns were documented in our previous study on sugarcane [34] as well as in several earlier GS studies in other crops [7,9,27,67]. Our results are in agreement with earlier work indicating that the LD of sugarcane germplasm is wide enough for 4000–5000 markers to adequately saturate LD across the whole genome [34,68].
The size of TP is an important factor for estimating the accurate prediction of GEBV in sugarcane due to the complex genome and less genetic diversity being present in the modern sugarcane, as indicated in our previous study [34]. Our study on the influence of TP size on prediction accuracy is consistent with what is established in the literature [7,17,27,69]. A significant surge in prediction accuracy was documented with the gradual increase in TP size from 20% to 80% of the samples for most of the traits, except Brix, EI, and TSH, which reached a plateau at the TP size n = 259 (60%) across all three crop cycles (Figure 7 and Figure 8). The gradual rise of individuals in the TP could increase genetic variability and change the population structures, and this might be correlated with this outcome [34].

5. Conclusions

GS has tremendous potential for improving the breeding process in sugarcane by selecting the favorable lines based on their GEBV for the next selection stage and promising parents. Our findings from this study suggest that GS could open a new avenue for improving sugar- and yield-related traits in sugarcane. Although all GS models performed similarly, GS models accounting for the genetic variation, both additive and non-additive (ADE, and RKHS), appeared to be a little better for predicting the GEBV. This result indicates that both additive and non-additive genetic effects were critical for predicting the GEBV for all tested traits. Utilizing a trait-assisted GS model, we could effectively predict the GEBV of ratoon crops using PC data as training for the tested traits. The trait SP was predicted the most efficiently for RT1 and RT2 crops by using the PC data. The overall prediction accuracy was higher in RT2 than in RT1. The least number of markers and ideal size of TP in sugarcane varied from 4000 to 5000 and 260 to 350 individuals for evaluating genomic studies in sugarcane. GS could have the potential to be utilized in sugarcane breeding for selecting early stage progenies based on clonal value and potential parents for hybridizing based on the predicted breeding values for sugar- and yield-related traits. Additional studies have been recommended by integrating non-additive genetic variance along with all kinds of dosage marker effects in the models, reducing competition effects during the field trials, and managing the environmental factors effectively, which might further improve the prediction accuracy.

Supplementary Materials

The following are available online at https://www.mdpi.com/article/10.3390/agriculture12091436/s1, Figure S1. Distribution of sugar- and yield-related traits Brix, fiber content (FC), commercial recoverable sugar (CRS), economic index, pol, sucrose content (SC), stalk diameter (SD), stalk population (SP), stalk weight (SW), total cane per hectare (TCH), and total sugar per hectare (TSH) were estimated from the data generated in three crop cycles (plant cane, first ratoon, and second ratoon). Figure S2. Prediction accuracy (A, B, C) and coincidence index (D, E, F) of the genomic estimated breeding estimated value (GEBV) of seven yield- and sugar-related traits for fivefold cross-validation (fivefold CV) of seven genomic selection (GS) methods. The fivefold CV was performed by randomly selecting four-fifths of the individuals for training and reaming a fifth as the validation population for the plant cane (A, D), first ratoon (B, E), and second ratoon (C, F). Seven traits were Brix, fiber content (FC), pol, sucrose content (SC), stalk diameter (SD), stalk population (SP), and stalk weight (SW). Figure S3. Prediction accuracy (A, B, C) and coincidence index (D, E, F) of the genomic estimated breeding estimated value (GEBV) of four secondary traits for fivefold cross-validation (fivefold CV) of seven genomic selection (GS) methods. The fivefold CV was performed by randomly selecting four-fifths of the individuals for training and reaming a fifth as the validation population for the plant cane (A, D), first ratoon (B, E), and second ratoon (C, F). Four secondary traits—commercial recoverable sugar (CRS), economic index (EI), ton cane per hectare (TCH), and ton sugar per hectare (TSH)—were estimated from the sugar and yield traits. Figure S4. Intercept (A, B, C) and slope (D, E, F) estimated through regression analysis between the genomic estimated breeding estimated value (GEBV) and phenotype value (BLUP) of four secondary traits. The regression analysis performed using the plant cane (A, D), first ratoon (B, E), and second ratoon (C, F) data. Seven traits were Brix, fiber content (FC), pol, sucrose content (SC), stalk diameter (SD), stalk population (SP), and stalk weight (SW). Figure S5. Intercept (A, B, C) and slope (D, E, F) estimated through regression analysis between the genomic estimated breeding estimated value (GEBV) and phenotype value (BLUP) of seven yield- and sugar-related traits. The regression analysis performed using the plant cane (A, D), first ratoon (B, E), and second ratoon (C, F) data. Four secondary traits—commercial recoverable sugar (CRS), economic index (EI), ton cane per hectare (TCH), and ton sugar per hectare (TSH)—were estimated from the sugar and yield traits. Figure S6. Fivefold cross-validated prediction ability for seven yield and sugar related traits—Brix, fiber content (FC), pol, sucrose content (SC), stalk diameter (SD), stalk population (SP), and stalk weight (SW) —in sugarcane based on seven different genomic selection models and marker density. The plant cane, first ratoon, and second ratoon phenotypic data were used. Figure S7. Fivefold cross-validated prediction ability for four secondary traits—commercial recoverable sugar (CRS), economic index (EI), ton cane per hectare (TCH), and ton sugar per hectare (TSH)—in sugarcane based on seven different genomic selection models and marker density. The plant cane, first ratoon, and second ratoon phenotypic data were used. Figure S8. The effect of training population size (percentages) on genomic selection (GS) prediction ability for seven yield- and sugar-related traits: Brix, fiber content (FC), pol, sucrose content (SC), stalk diameter (SD), stalk population (SP), and stalk weight (SW). The plant cane, first ratoon, and second ratoon phenotypic data were used. Figure S9. The effect of training population size (percentages) on genomic selection (GS) prediction ability for four secondary traits: commercial recoverable sugar (CRS), economic index (EI), ton cane per hectare (TCH), and ton sugar per hectare (TSH). The plant cane, first ratoon, and second ratoon phenotypic data were used. Figure S10. Scattered dot plot of relationships between prediction accuracy and narrow-sense heritability of all tested traits (Brix, fiber content (FC), pol, sucrose content (SC), stalk diameter (SD), stalk population (SP), stalk weight (SW), commercial recoverable sugar (CRS), economic index (EI), ton cane per hectare (TCH), and ton sugar per hectare (TSH)). Table S1. Name, pedigree, origin, and Bru1 gene information of tested germplasm for the genomic selection prediction (taken from Islam et al., 2021 [34]). Table S2. Mean and standard deviation of sugar- and yield-related traits—Brix, fiber content (FC), commercial recoverable sugar (CRS), economic index, pol, sucrose content (SC), stalk diameter (SD), stalk population (SP), stalk weight (SW), total cane per hectare (TCH), and total sugar per hectare (TSH)—were estimated from the data generated in three crop cycles (plant cane, first ratoon, and second ratoon) and combined all three crop cycles. Table S3. Correlation coefficient among traits value of three crop cycles, plant cane (PC), first ratoon (RT1), and second ratoon (RT2). The traits were sugar- and yield-related traits: Brix, fiber content (FC), commercial recoverable sugar (CRS), economic index, pol, sucrose content (SC), stalk diameter (SD), stalk population (SP), stalk weight (SW), total cane per hectare (TCH), and total sugar per hectare (TSH). Files having R package codes were used in the analysis.

Author Contributions

M.S.I.: conceptualization; data curation; formal analysis; funding acquisition; investigation; methodology; project administration; resources; supervision; visualization; writing—original draft; writing—review and editing. P.M.: conceptualization; resources; writing—review and editing. Q.D.R.: data preparation; formal analysis; software; writing—review and editing. L.Q.: investigation; writing—review and editing. A.E.L.: formal analysis; writing—review and editing. S.S.: writing—review and editing. J.T.: resources; writing—review and editing. M.O.: data preparation; writing—review and editing. All authors have read and agreed to the published version of the manuscript.

Funding

This research received no external funding.

Institutional Review Board Statement

Not applicable.

Informed Consent Statement

Not applicable.

Data Availability Statement

All codes needed to reproduce the analyses described in this paper are included in the Supplementary Materials.

Acknowledgments

Our appreciation goes to Kay McCorkle, Kanaan Moaiad, and Maksud Hossain for assisting with the field experiments. We are grateful to Duli Zhao and Jack Comstock for their administrative service and valuable guidance. Our appreciation goes to Xiping Yang for his help during the initial marker data analysis. We also thank two internal reviewers (Linghe Zeng and Keo Corak) for their valuable comments. The mention of trade names or commercial products in this article provides specific information and does not imply recommendation or endorsement by the U.S. Department of Agriculture, an equal opportunity provider and employer. This research was funded mainly by the USDA Agricultural Research Service CRIS projects 6030-21000-006-00-D. Additional funding was provided by Florida Sugarcane League.

Conflicts of Interest

The authors declare that they have no competing interests.

References

  1. D’Hont, A. Unraveling the genome structure of polyploids using FISH and GISH; examples of sugarcane and banana. Cytogenet. Genome Res. 2005, 109, 27–33. [Google Scholar] [CrossRef] [PubMed]
  2. D’Hont, A.; Ison, D.; Alix, K.; Roux, C.; Glaszmann, J.C. Determination of basic chromosome numbers in the genus Saccharum by physical mapping of ribosomal RNA genes. Genome 1998, 41, 221–225. [Google Scholar] [CrossRef]
  3. Palhares, A.C.; Rodrigues-Morais, T.B.; Van Sluys, M.A.; Domingues, D.S.; Maccheroni, W., Jr.; Jordao, H., Jr.; Souza, A.P.; Marconi, T.G.; Mollinari, M.; Gazaffi, R.; et al. A novel linkage map of sugarcane with evidence for clustering of retrotransposon-based markers. BMC Genet. 2012, 13, 51. [Google Scholar] [CrossRef] [PubMed]
  4. Daniels, J.; Roach, B.T. Taxonomy and Evolution. In Sugarcane Improvement through Breeding; Heinz, D.J., Ed.; Elsevier Press: Amsterdam, The Netherlands, 1987; pp. 7–84. [Google Scholar]
  5. Irvine, J.E. Saccharum species as horticultural classes. Theor. Appl. Genet. 1999, 98, 186–194. [Google Scholar] [CrossRef]
  6. Islam, M.S.; Yang, X.; Sood, S.; Comstock, J.C.; Zan, F.; Wang, J. Molecular dissection of sugar related traits and it’s attributes in Saccharum spp. hybrids. Euphytica 2018, 214, 170. [Google Scholar] [CrossRef]
  7. Islam, M.S.; Fang, D.D.; Jenkins, J.N.; Guo, J.; McCarty, J.C.; Jones, D.C. Evaluation of genomic selection methods for predicting fiber quality traits in Upland cotton. Mol. Genet. Genom. 2020, 295, 67–79. [Google Scholar] [CrossRef]
  8. Gezan, S.A.; Osorio, L.F.; Verma, S.; Whitaker, V.M. An experimental validation of genomic selection in octoploid strawberry. Hortic. Res. 2017, 4, 16070. [Google Scholar] [CrossRef]
  9. Arruda, M.P.; Brown, P.J.; Lipka, A.E.; Krill, A.M.; Thurber, C.; Kolb, F.L. Genomic Selection for Predicting Fusarium Head Blight Resistance in a Wheat Breeding Program. Plant Genome 2015, 8, 1–12. [Google Scholar] [CrossRef]
  10. Spindel, J.; Begum, H.; Akdemir, D.; Virk, P.; Collard, B.; Redona, E.; Atlin, G.; Jannink, J.L.; McCouch, S.R. Genomic selection and association mapping in rice (Oryza sativa): Effect of trait genetic architecture, training population composition, marker number and statistical model on accuracy of rice genomic selection in elite, tropical rice breeding lines. PLoS Genet. 2015, 11, e1004982. [Google Scholar] [CrossRef]
  11. Daugrois, J.H.; Grivet, L.; Roques, D.; Hoarau, J.Y.; Lombard, H.; Glaszmann, J.C.; D’Hont, A. A putative major gene for rust resistance linked with a RFLP marker in sugarcane cultivar ‘R570’. Theor. Appl. Genet. 1996, 92, 1059–1064. [Google Scholar] [CrossRef]
  12. Raboin, L.M.; Oliveira, K.M.; Lecunff, L.; Telismart, H.; Roques, D.; Butterfield, M.; Hoarau, J.Y.; D’Hont, A. Genetic mapping in sugarcane, a high polyploid, using bi-parental progeny: Identification of a gene controlling stalk colour and a new rust resistance gene. Theor. Appl. Genet. 2006, 112, 1382–1391. [Google Scholar] [CrossRef] [PubMed]
  13. Costet, L.; Le Cunff, L.; Royaert, S.; Raboin, L.M.; Hervouet, C.; Toubi, L.; Telismart, H.; Garsmeur, O.; Rousselle, Y.; Pauquet, J.; et al. Haplotype structure around Bru1 reveals a narrow genetic basis for brown rust resistance in modern sugarcane cultivars. Theor. Appl. Genet. 2012, 125, 825–836. [Google Scholar] [CrossRef] [PubMed]
  14. Yang, X.; Islam, M.S.; Sood, S.; Maya, S.; Hanson, E.A.; Comstock, J.; Wang, J. Identifying Quantitative Trait Loci (QTLs) and Developing Diagnostic Markers Linked to Orange Rust Resistance in Sugarcane (Saccharum spp.). Front. Plant Sci. 2018, 9, 350. [Google Scholar] [CrossRef] [PubMed]
  15. Meuwissen, T.H.; Hayes, B.J.; Goddard, M.E. Prediction of total genetic value using genome-wide dense marker maps. Genetics 2001, 157, 1819–1829. [Google Scholar] [CrossRef]
  16. Heffner, E.L.; Sorrells, M.E.; Jannink, J.L. Genomic selection for crop improvement. Crop Sci. 2009, 49, 1–12. [Google Scholar] [CrossRef]
  17. Lorenz, A.J.; Chao, S.; Asoro, F.G.; Heffner, E.L.; Hayashi, T.; Iwata, H.; Smith, K.P.; Sorrells, M.E.; Jannink, J.L. Genomic selection in plant breeding: Knowledge and prospects. Adv. Agron. 2011, 110, 77–123. [Google Scholar] [CrossRef]
  18. Gouy, M.; Rousselle, Y.; Bastianelli, D.; Lecomte, P.; Bonnal, L.; Roques, D.; Efile, J.C.; Rocher, S.; Daugrois, J.; Toubi, L.; et al. Experimental assessment of the accuracy of genomic selection in sugarcane. Theor. Appl. Genet. 2013, 126, 2575–2586. [Google Scholar] [CrossRef]
  19. Meuwissen, T.H. Accuracy of breeding values of ‘unrelated’ individuals predicted by dense SNP genotyping. Genet. Sel. Evol. 2009, 41, 35. [Google Scholar] [CrossRef]
  20. Jannink, J.L.; Lorenz, A.J.; Iwata, H. Genomic selection in plant breeding: From theory to practice. Brief. Funct. Genom. 2010, 9, 166–177. [Google Scholar] [CrossRef]
  21. Yadav, S.; Jackson, P.; Wei, X.; Ross, E.M.; Aitken, K.; Deomano, E.; Atkin, F.; Hayes, B.J.; Voss-Fels, K.P. Accelerating Genetic Gain in Sugarcane Breeding Using Genomic Selection. Agronomy 2020, 10, 585. [Google Scholar] [CrossRef] [Green Version]
  22. Gilbert, R.A.; Shine, J.M.; Miller, J.D.; Rice, R.W.; Rainbolt, C.R. The effect of genotype, environment and time of harvest on sugarcane yields in Florida, USA. Field. Crop Res. 2006, 95, 156–170. [Google Scholar] [CrossRef]
  23. Glaz, B.; Kang, M.S. Location Contributions Determined via GGE Biplot Analysis of Multienvironment Sugarcane Genotype-Performance Trials. Crop Sci. 2008, 48, 941–950. [Google Scholar] [CrossRef]
  24. Yadav, S.; Wei, X.; Joyce, P.; Atkin, F.; Deomano, E.; Sun, Y.; Nguyen, L.T.; Ross, E.M.; Cavallaro, T.; Aitken, K.S.; et al. Improved genomic prediction of clonal performance in sugarcane by exploiting non-additive genetic effects. Theor. Appl. Genet. 2021, 134, 2235–2252. [Google Scholar] [CrossRef] [PubMed]
  25. Jackson, P.; McRae, T.A. Selection of Sugarcane Clones in Small Plots: Effects of Plot Size and Selection Criteria. Crop Sci. 2001, 41, 315–322. [Google Scholar] [CrossRef]
  26. Aitken, K.S.; Jackson, P.A.; McIntyre, C.L. Quantitative trait loci identified for sugar related traits in a sugarcane (Saccharum spp.) cultivar x Saccharum officinarum population. Theor. Appl. Genet. 2006, 112, 1306–1317. [Google Scholar] [CrossRef] [PubMed]
  27. Heffner, E.L.; Jannink, J.-L.; Sorrells, M.E. Genomic Selection Accuracy using Multifamily Prediction Models in a Wheat Breeding Program. Plant Genome 2011, 4, 65–75. [Google Scholar] [CrossRef]
  28. Rutkoski, J.E.; Heffner, E.L.; Sorrells, M.E. Genomic selection for durable stem rust resistance in wheat. Euphytica 2010, 179, 161–173. [Google Scholar] [CrossRef]
  29. Bernal-Vasquez, A.M.; Gordillo, A.; Schmidt, M.; Piepho, H.P. Genomic prediction in early selection stages using multi-year data in a hybrid rye breeding program. BMC Genet. 2017, 18, 51. [Google Scholar] [CrossRef]
  30. Olatoye, M.O.; Clark, L.V.; Labonte, N.R.; Dong, H.; Dwiyanti, M.S.; Anzoua, K.G.; Brummer, J.E.; Ghimire, B.K.; Dzyubenko, E.; Dzyubenko, N.; et al. Training Population Optimization for Genomic Selection in Miscanthus. G3 Genes Genomes Genet. 2020, 10, 2465–2476. [Google Scholar] [CrossRef]
  31. Deomano, E.; Jackson, P.; Wei, X.; Aitken, K.; Kota, R.; Pérez-Rodríguez, P. Genomic prediction of sugar content and cane yield in sugar cane clones in different stages of selection in a breeding program, with and without pedigree information. Mol. Breed. 2020, 40, 38. [Google Scholar] [CrossRef]
  32. Olatoye, M.O.; Clark, L.V.; Wang, J.; Yang, X.; Yamada, T.; Sacks, E.J.; Lipka, A.E. Evaluation of genomic selection and marker-assisted selection in Miscanthus and energycane. Mol. Breed. 2019, 39, 171. [Google Scholar] [CrossRef]
  33. Hayes, B.J.; Wei, X.; Joyce, P.; Atkin, F.; Deomano, E.; Yue, J.; Nguyen, L.; Ross, E.M.; Cavallaro, T.; Aitken, K.S.; et al. Accuracy of genomic prediction of complex traits in sugarcane. Theor. Appl. Genet. 2021, 134, 1455–1462. [Google Scholar] [CrossRef] [PubMed]
  34. Islam, M.S.; McCord, P.H.; Olatoye, M.O.; Qin, L.; Sood, S.; Lipka, A.E.; Todd, J.R. Experimental evaluation of genomic selection prediction for rust resistance in sugarcane. Plant Genome 2021, 14, e20148. [Google Scholar] [CrossRef] [PubMed]
  35. Voss-Fels, K.P.; Wei, X.; Ross, E.M.; Frisch, M.; Aitken, K.S.; Cooper, M.; Hayes, B.J. Strategies and considerations for implementing genomic selection to improve traits with additive and non-additive genetic architectures in sugarcane breeding. Theor. Appl. Genet. 2021, 134, 1493–1511. [Google Scholar] [CrossRef] [PubMed]
  36. Legendre, B.L. The core/press method for predicting the sugar yield from cane for use in cane payment. Sugar J. 1992, 54, 2–7. [Google Scholar]
  37. Islam, M.S.; Sandhu, H.; Zhao, D.; Sood, S.; Momotaz, A.; Davidson, R.W.; Baltazar, M.; Gordon, V.S.; McCord, P.; Coto, O.A. Registration of ‘CP 13-1223’ sugarcane for Florida organic soils. J. Plant Regist. 2022, 16, 54–63. [Google Scholar] [CrossRef]
  38. Deren, C.W.; Alvarez, J.; Glaz, B. Use of economic criteria for selecting clones in a sugarcane breeding program. Proc. Int. Soc. Sugar Cane Technol. 1995, 21, 437–447. [Google Scholar]
  39. Paterson, A.H.; Bowers, J.E.; Bruggmann, R.; Dubchak, I.; Grimwood, J.; Gundlach, H.; Haberer, G.; Hellsten, U.; Mitros, T.; Poliakov, A.; et al. The Sorghum bicolor genome and the diversification of grasses. Nature 2009, 457, 551–556. [Google Scholar] [CrossRef]
  40. Lee, W.P.; Stromberg, M.P.; Ward, A.; Stewart, C.; Garrison, E.P.; Marth, G.T. MOSAIK: A hash-based algorithm for accurate next-generation sequencing short-read mapping. PLoS ONE 2014, 9, e90581. [Google Scholar] [CrossRef]
  41. Garrison, E.; Marth, G. Haplotype-based variant detection from short-read sequencing. arXiv 2012, arXiv:1207.3907. [Google Scholar]
  42. R Core Team. R: A Language and Environment for Statistical Computing; R Foundation for Statistical Computing: Vienna, Austria, 2018. [Google Scholar]
  43. Endelman, J.B.; Jannink, J.L. Shrinkage estimation of the realized relationship matrix. G3 Genes Genomes Genet. 2012, 2, 1405–1413. [Google Scholar] [CrossRef] [PubMed]
  44. Piepho, H.P.; Möhring, J.; Melchinger, A.E.; Büchse, A. BLUP for phenotypic selection in plant breeding and variety testing. Euphytica 2008, 161, 209–228. [Google Scholar] [CrossRef]
  45. Endelman, J.B. Ridge Regression and Other Kernels for Genomic Selection with R Package rrBLUP. Plant Genome 2011, 4. [Google Scholar] [CrossRef] [Green Version]
  46. Covarrubias-Pazaran, G. Genome-Assisted Prediction of Quantitative Traits Using the R Package sommer. PLoS ONE 2016, 11, e0156744. [Google Scholar] [CrossRef]
  47. Perez, P.; de los Campos, G. Genome-wide regression and prediction with the BGLR statistical package. Genetics 2014, 198, 483–495. [Google Scholar] [CrossRef]
  48. Meyer, D.; Dimitriadou, E.; Hornik, K.; Weingessel, A.; Leisch, F. e1071: Misc Functions of the Department of Statistics, Probability Theory Group (Formerly: E1071), TU Wien. R Package 2021, Version 1, 7–9. [Google Scholar]
  49. Liaw, A.; Wiener, M. Classification and Regression by RandomForest. R News 2002, 2, 18–22. [Google Scholar]
  50. Fernandes, S.B.; Dias, K.O.G.; Ferreira, D.F.; Brown, P.J. Efficiency of multi-trait, indirect, and trait-assisted genomic selection for improvement of biomass sorghum. Theor. Appl. Genet. 2018, 131, 747–755. [Google Scholar] [CrossRef]
  51. Heslot, N.; Rutkoski, J.; Poland, J.; Jannink, J.L.; Sorrells, M.E. Impact of marker ascertainment bias on genomic selection accuracy and estimates of genetic diversity. PLoS ONE 2013, 8, e74612. [Google Scholar] [CrossRef]
  52. Aitken, K.S.; Hermann, S.; Karno, K.; Bonnett, G.D.; McIntyre, L.C.; Jackson, P.A. Genetic control of yield related stalk traits in sugarcane. Theor. Appl. Genet. 2008, 117, 1191–1203. [Google Scholar] [CrossRef]
  53. Singh, R.K.; Singh, S.P.; Tiwari, D.K.; Srivastava, S.; Singh, S.B.; Sharma, M.L.; Singh, R.; Mohapatra, T.; Singh, N.K. Genetic mapping and QTL analysis for sugar yield-related traits in sugarcane. Euphytica 2013, 191, 333–353. [Google Scholar] [CrossRef]
  54. de Carvalho, M.P.; Gezan, S.A.; Peternelli, L.A.; Barbosa, M.H.P. Estimation of Additive and Nonadditive Genetic Components of Sugarcane Families Using Multitrait Analysis. Agron. J. 2014, 106, 800–808. [Google Scholar] [CrossRef]
  55. Bagyalakshmi, K.; Viswanathan, R.; Ravichandran, V. Impact of the viruses associated with mosaic and yellow leaf disease on varietal degeneration in sugarcane. Phytoparasitica 2019, 47, 591–604. [Google Scholar] [CrossRef]
  56. Singh, A.; Chauhan, S.S.; Singh, A.; Singh, S.B. Deterioration in sugarcane due to pokkah boeng disease. Sugar Technol. 2006, 8, 187–190. [Google Scholar] [CrossRef]
  57. Viswanathan, R. Varietal Degeneration in Sugarcane and its Management in India. Sugar Technol. 2016, 18, 1–7. [Google Scholar] [CrossRef]
  58. Young, A.J. Turning a Blind Eye to Ratoon Stunting Disease of Sugarcane in Australia. Plant Dis. 2018, 102, 473–482. [Google Scholar] [CrossRef]
  59. Desta, Z.A.; Ortiz, R. Genomic selection: Genome-wide prediction in plant improvement. Trends Plant Sci. 2014, 19, 592–601. [Google Scholar] [CrossRef]
  60. Heslot, N.; Jannink, J.-L.; Sorrells, M.E. Perspectives for Genomic Selection Applications and Research in Plants. Crop Sci. 2015, 55, 1–12. [Google Scholar] [CrossRef]
  61. Rutkoski, J.E.; Poland, J.; Jannink, J.L.; Sorrells, M.E. Imputation of unordered markers and the impact on genomic selection accuracy. G3 2013, 3, 427–439. [Google Scholar] [CrossRef]
  62. Zhong, S.; Dekkers, J.C.; Fernando, R.L.; Jannink, J.L. Factors affecting accuracy from genomic selection in populations derived from multiple inbred lines: A Barley case study. Genetics 2009, 182, 355–364. [Google Scholar] [CrossRef]
  63. Windhausen, V.S.; Atlin, G.N.; Hickey, J.M.; Crossa, J.; Jannink, J.L.; Sorrells, M.E.; Raman, B.; Cairns, J.E.; Tarekegne, A.; Semagn, K.; et al. Effectiveness of genomic prediction of maize hybrid performance in different breeding populations and environments. G3 Genes Genomes Genet. 2012, 2, 1427–1436. [Google Scholar] [CrossRef]
  64. Robert, P.; Le Gouis, J.; Rincent, R. The Breed Wheat Consortium Combining Crop Growth Modeling With Trait-Assisted Prediction Improved the Prediction of Genotype by Environment Interactions. Front. Plant Sci. 2020, 11, 827. [Google Scholar] [CrossRef] [PubMed]
  65. Shahi, D.; Guo, J.; Pradhan, S.; Khan, J.; Avci, M.; Khan, N.; McBreen, J.; Bai, G.; Reynolds, M.; Foulkes, J.; et al. Multi-trait genomic prediction using in-season physiological parameters increases prediction accuracy of complex traits in US wheat. BMC Genom. 2022, 23, 298. [Google Scholar] [CrossRef] [PubMed]
  66. Lado, B.; Vázquez, D.; Quincke, M.; Silva, P.; Aguilar, I.; Gutiérrez, L. Resource allocation optimization with multi-trait genomic prediction for bread wheat (Triticum aestivum L.) baking quality. Theor. Appl. Genet. 2018, 131, 2719–2731. [Google Scholar] [CrossRef] [PubMed]
  67. Asoro, F.G.; Newell, M.A.; Beavis, W.D.; Scott, M.P.; Jannink, J.L. Accuracy and Training Population Design for Genomic Selection on Quantitative Traits in Elite North American Oats. Plant Genome 2011, 4, 132–144. [Google Scholar] [CrossRef] [Green Version]
  68. Yang, X.; Song, J.; Todd, J.; Peng, Z.; Paudel, D.; Luo, Z.; Ma, X.; You, Q.; Hanson, E.; Zhao, Z.; et al. Target enrichment sequencing of 307 germplasm accessions identified ancestry of ancient and modern hybrids and signatures of adaptation and selection in sugarcane (Saccharum spp.), a ‘sweet’ crop with ‘bitter’ genomes. Plant Biotechnol. J. 2019, 17, 488–498. [Google Scholar] [CrossRef]
  69. Crossa, J.; de los Campos, G.; Pérez, P.; Gianola, D.; Burgueño, J.; Araus, J.L.; Makumbi, D.; Singh, R.P.; Dreisigacker, S.; Yan, J.; et al. Prediction of Genetic Values of Quantitative Traits in Plant Breeding Using Pedigree and Molecular Markers. Genetics 2010, 186, 713–724. [Google Scholar] [CrossRef] [Green Version]
Figure 1. Prediction accuracy (A) and coincidence index (B) of the genomic estimated breeding estimated value (GEBV) of seven yield- and sugar-related traits for fivefold cross-validation (fivefold CV) of seven genomic selection (GS) methods. The fivefold CV was performed by randomly selecting four-fifths of the individuals for training and reaming a fifth as the validation population for the plant cane. The seven traits were Brix, fiber content (FC), pol, sucrose content (SC), stalk diameter (SD), stalk population (SP), and stalk weight (SW).
Agriculture 12 01436 g001
Figure 2. Prediction accuracy (A) and coincidence index (B) of the genomic estimated breeding estimated value (GEBV) of four secondary traits for fivefold cross-validation (fivefold CV) of seven genomic selection (GS) methods. The fivefold CV was performed by randomly selecting four-fifths of the individuals for training and reaming a fifth as the validation population for the plant cane. Four secondary traits—commercial recoverable sugar (CRS), economic index (EI), ton cane per hectare (TCH), and ton sugar per hectare (TSH)—were estimated from the sugar and yield traits.
Agriculture 12 01436 g002
Figure 3. Prediction accuracy (A) and coincidence index (B) of the genomic estimated breeding estimated value (GEBV) of seven yield- and sugar-related traits for fivefold cross-validation (fivefold CV) of seven genomic selection (GS) methods. The fivefold CV was performed using plant cane data as the training set and ratoon data as the validation population. The seven traits were Brix, fiber content (FC), pol, sucrose content (SC), stalk diameter (SD), stalk population (SP), and stalk weight (SW).
Agriculture 12 01436 g003
Figure 4. Prediction accuracy (A) and coincidence index (B) of the genomic estimated breeding estimated value (GEBV) of four secondary traits for fivefold cross-validation (fivefold CV) of seven genomic selection (GS) methods. The fivefold CV was performed using plant cane data as the training set and ratoon data as the validation population. Four secondary traits—commercial recoverable sugar (CRS), economic index (EI), ton cane per hectare (TCH), and ton sugar per hectare (TSH)—were estimated from the sugar and yield traits.
Agriculture 12 01436 g004
Figure 5. Fivefold cross-validated prediction ability for seven yield- and sugar-related traits: Brix, fiber content (FC), pol, sucrose content (SC), stalk diameter (SD), stalk population (SP), and stalk weight (SW) in sugarcane based on seven different genomic selection models and marker density. The plant cane phenotypic data were used.
Agriculture 12 01436 g005
Figure 6. Fivefold cross-validated prediction ability for four secondary traits: commercial recoverable sugar (CRS), economic index (EI), ton cane per hectare (TCH), and ton sugar per hectare (TSH) in sugarcane based on seven different genomic selection models and marker density. The plant cane phenotypic data were used.
Agriculture 12 01436 g006
Figure 7. The effect of training population size (percentages) on genomic selection (GS) prediction ability for seven yield- and sugar-related traits: Brix, fiber content (FC), pol, sucrose content (SC), stalk diameter (SD), stalk population (SP), and stalk weight (SW). The plant cane phenotypic data were used.
Agriculture 12 01436 g007
Figure 8. The effect of training population size (percentages) on genomic selection (GS) prediction ability for four secondary traits: commercial recoverable sugar (CRS), economic index (EI), ton cane per hectare (TCH), and ton sugar per hectare (TSH). The plant cane phenotypic data were used.
Agriculture 12 01436 g008
Table 1. Narrow-sense (h2) and broad-sense (H2) heritabilities of Brix, fiber content (FC), commercial recoverable sugar (CRS), economic index, pol, sucrose content (SC), stalk diameter (SD), stalk population (SP), stalk weight (SW), total cane per hectare (TCH), and total sugar per hectare (TSH) were estimated from the data generated in three crop cycles (plant cane, first ratoon, and second ratoon) and combined data of all three crop cycles.
TraitPlant CaneFirst RatoonSecond RatoonCombined
h2H2h2H2h2H2h2H2
BRIX0.390.500.270.390.150.220.220.30
FC0.640.720.430.540.330.430.390.49
CRS0.390.510.350.470.250.350.300.39
EI0.420.540.330.450.230.340.290.37
POL0.420.530.340.470.220.310.290.38
SC0.420.530.340.460.220.320.280.38
SD0.810.870.350.470.210.310.350.46
SP0.490.610.560.660.380.500.410.52
SW0.650.760.400.520.300.400.330.45
TCH0.430.560.390.510.260.360.310.40
TSH0.420.550.340.470.230.340.290.38
Publisher’s Note: MDPI stays neutral with regard to jurisdictional claims in published maps and institutional affiliations.

