1. Introduction
Sudden mechanical failures of elements and systems in mobile machines are mainly due to the fact of repeatedly random extreme loads, which can jump at least once, exceeding the load capacity and leading to quasistatic destruction or occurrence of unacceptable residual deformations. The bearing capacity of each element for this type of failure should also be considered as a random variable and, therefore, the patterns of sudden mechanical failures are stochastic [
1,
2,
3]. An essential feature of the model under consideration for the prediction of a sudden mechanical failure is that its risk is not associated with the accumulation of damage and does not depend on the history of loads; it does not affect the bearing capacity.
An analysis of the stress–strain state of a technical system or its element is mandatory during design. The real optimization of a future design depends on the results and reliability of such an analysis, which is conventionally formed in three stages: construction of a spatial model with an indication of its physical properties; the correctness of the construction of the finite element mesh; the correct setting of the boundary conditions. If the first two stages depend on the designer’s qualifications, then the correct setting of the boundary conditions requires knowledge of the nature and value of the load on the designed object, which arise during its interaction with other objects and the environment. These questions can be answered by bench tests of experimental samples. In this case, the nature of the load can be determined with high probability. In some cases, it is possible to determine the value of the load, but it will correspond to the operating load, which, as a rule, is the cause of gradual failures. The responsible manufacturer faces the question of determining the magnitude and frequency of the occurrence of extreme loads, which is the cause of sudden failures. A vivid example of extreme loads, which are diverse in meaning and significant in terms of frequency of occurrence, are machines in the field of soil cultivation. In order to provide analytical models for predicting reliability due to the fact of sudden failures, as a tool for optimization during construction, determining the probably justified reserve factor due to the fact of sudden failures of tillage units was considered.
Ensuring the reliability of machinery elements from sudden mechanical failures under the traditional deterministic approach to designing calculations was reduced to the use of safety factors. Their purpose was to take into account and compensate the influence of various random factors on the mechanical characteristics of the materials and the magnitude of the operating loads. Thus, the influence of randomness when reliability was being provided was actually recognized; however, probabilistic models and methods were not used to account for this influence. The safety factor is specified in the technological normative documents or standards used in various branches of engineering. Their value is usually established empirically on the basis of expert analysis and generalization of previous experiences in the design and operation of products of a similar purpose.
Sudden mechanical failures of mobile equipment usually include various types of bulk and surface failures that result in disability such as a sudden quasi-static failure or residual deformation due to the fact of extreme loads. Particular attention should be paid to sudden mechanical failures, because their occurrences are almost impossible to diagnose and, accordingly, their moments of failure. This can negatively affect the equipment’s competitiveness. Therefore, during the design, it is necessary to choose the design and process conditions so that they provide a sufficient level of reliability, which is guaranteed during a given operating period.
The check of cultivators that perform presowing and general tillage with center hoes shows that they are mostly attached to the cultivator frame with S-shaped or C-shaped elastic struttings. Such struttings, deforming, lead to self-oscillating movements of the operating devices, which compared to rigid fixing has significant advantages, improving the tillage quality due to the additional dynamism. However, the practice of using cultivators in a work environment has revealed the negative consequences of operating devices that increase dynamism. First, the struttings increase in flexibility, which is a necessary condition for the stationary self-oscillation occurrences, with a sufficiently large amplitude, and this sometimes leads to the struttings’ sudden destruction due to the fact of accidental soil compaction or treated area weedage.
Thus, a set of problems in the cultivators’ mechanical reliability in terms of the oscillating motion of the operating devices are relevant. Its successful solution is related to the rational determination of the load factor of the unit elastic struttings’ strength. The strutting load factor must simultaneously meet conflicting requirements: to provide strutting durability and to create necessary flexibility, leading to high-quality tillage by means of the operating device’s oscillating motion.
In [
1,
2], stochastic models were developed, which allowed for the prediction of the probability of failure-free operation changes depending on the operating time in the case of sudden mechanical failures. Reliability prediction is possible if certain characteristics of the mechanical load of the object under development are known [
4]. The design period is usually quite limited in time and, therefore, it is almost impossible to obtain in advance a sufficient amount of experimental data on extreme loads in operation, which would be statistically accurate. Therefore, the use of dynamic analysis calculation methods of the stress–strain state or expert generalization methods of the product’s operational experience remain, which are devices identical in the design of the projected object. Each of these methods have certain disadvantages. A promising area for improving engineering forecasting and ensuring mechanical reliability is the use of the inversion method and invertible stochastic models of reliability [
2,
5,
6]. The models presented in [
1,
2] fully comply with the requirements that must be met by inverted models of mechanical reliability. Statistical estimation of the probability of failure-free operation dependence on the operating time in the case of mechanical failures is usually performed on censored data samples, which consist of the operating time before failure and the operating time before test termination in non-failed products [
3].
2. Materials and Methods
For the general concept of the inversion method’s application. it is advisable to compensate for the lack of experimental information on the possible operational load of the designed object, based on mechanical reliability statistics similar to the design and conditions of use of analog products, which have a fairly large operating time in real operation. The presence of a certain reliability theoretical model suitable and adapted to predict the probability of failure-free operation, depending on the generalized characteristics of the external load of the designed object, in principle, allows for solving the inverse inversion problem with the same model, considering the statistically determined dependence of the probability of failure-free operation on the operating time to determine the appropriate characteristics of the external load. The difficulty of inverse problem solving is that such an inversion does not guarantee an unambiguous determination of the desired load’s characteristics. This leads, firstly, to the need to determine theoretical model parameters, using one of the selected criteria for its best approximation to the statistical. Secondly, it follows that the equivalence of the load’s characteristics found in this way to the actual operating load is relative. However, the undoubted advantage of the inversion method is the stimulation of the real statistical data useful life, which can be obtained in large quantities by monitoring reliability, which does not require large expenses.
There are obtained operating data on sudden failures of cultivators with elastic C-shaped struttings on which center hoes are fixed (in order to preserve commercial secrecy and the absence of the manufacturer’s consent to public disclosure of the research results, the make and model of the units are not indicated). The operating tests by volume were statistically representative and were carried out in 7 regions of Ukraine, namely, in Kharkiv, Sumy, Donetsk, Dnipropetrovsk, Poltava, Zaporizhia, and Odessa, covering a variety of edaphoclimatic conditions: mechanical properties of soil, density, humidity, etc. In all cases of strutting destruction, there was a sudden break. Observations were carried out over one year of work, and from the beginning of the operation of all of the cultivators to the yield and until the sudden failure of a separate rack, the total yield of each cultivator was recorded. The specified soil and climatic conditions, as well as the compliance of the equipment adjustments with regulatory indicators, were not recorded, because the goal was to determine the average yield before a sudden failure, which corresponded to real operating conditions. The operating time before a sudden failures was recorded in hectares of tillable area.
In total, observations of elastic strutting operations were carried out on 13 cultivators. The operating time of the units was from one to forty thousand hectares of tillable area. There were 42 sudden failures: struttings breaks. During the observations, the accumulated operating time of the cultivators amounted to more than 280 thousand hectares. Taking into account the number of elastic struttings on each cultivator, the test volume should be considered as the operation of 260 struttings until the first failure or the suspension of tests, which formed a repeatedly censored operating time sample of the statistical data.
The methodology for the statistical data analysis of the reliability was a nonparametric method of analysis [
7,
8,
9,
10,
11] of a censored sample, grouped by intervals, which is shown in
Table 1.
Table 1 presents the results of intermediate calculations according to expressions 1–4 as well as the probabilities of failure-free of the elastic racks of the cultivators, which corresponded to the calculation in expression 5.
Within the limits of each operating time interval, there was a certain number of struttings that failed (i.e., were destroyed)—
nf, or tests which at the time of analysis were suspended—
ns, although destruction did not occur. All operating times before failure and test suspension (i.e., without failure) formed a single total sample of random operating time. This single sample of operating time before the failure and the operating time before the test suspension time, if the failure had not taken place yet, was divided into equal intervals, starting from the first interval, where there were no failures. An empirical distribution function,
Fc, which was constructed using this general uncensored sample, is shown in
Table 1. The sample was completed, and it shows the dependence on which the function of the total probability of failure or test suspension in the appropriate interval was estimated. It should be noted that entry into the operating time interval before the test suspension was determined for each of the 13 cultivators in which the first strutting failure took place. The number of operating times before the suspension (
ns) in the interval was determined taking into account the number of simultaneously operating struttings in the unit.
Then, in each interval, consequently, the total number of struttings that were tested before this interval or the number of operating time censored samples in another interval was determined:
where
N is the overall total number of operating time samples before failure and before test termination. In the sample in question,
N = 260.
The unit value of the relative frequency,
Wi, of the operating times in each interval was determined:
The proportion of operating times considered in each interval was determined before the test termination:
The number of struttings that were conditionally tested in each sample grouping interval was calculated using the following formula:
Statistical estimation of the probability of failure-free operation of the cultivators’ elastic struttings was performed using the multiple [3; 7] method of nonparametric estimation:
The initial data and results of the statistical analysis of the elastic struttings’ reliability during sudden failures are shown in
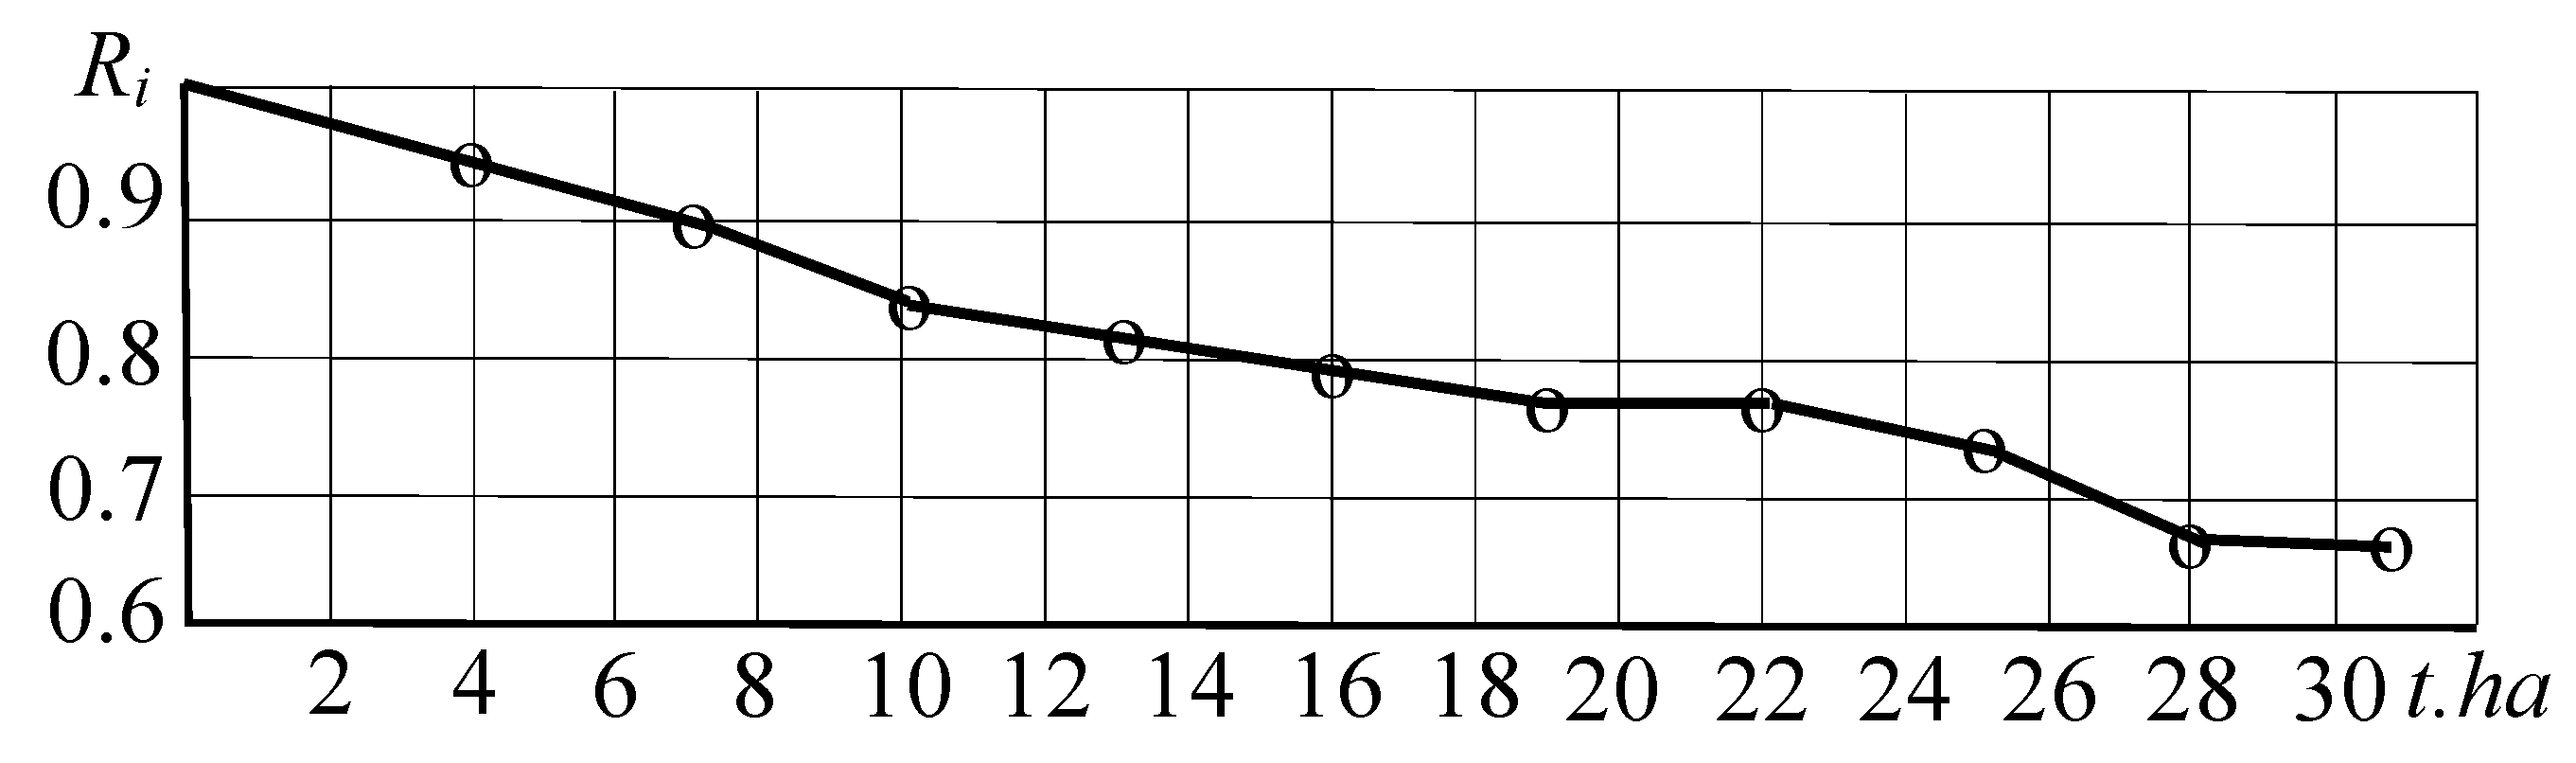
Table 1. The analysis of the grouped samples ended with the next-to-last interval. Statistical analysis of the sample data on the cultivators’ sudden failures showed (
Figure 1) that the variation function of the probability of failure-free operation of the elastic struttings relative to the sudden failures had a typical form. This indicates that the statistical model of reliability corresponded to the theoretical model of quasistatic failure of successive systems [
1,
2].
3. Results
The graph in
Figure 1 and the data given in
Table 1 allow, for example, the determination that 90% of the gamma—the percentage of the strutting operating time to a sudden failure was approximately 7 thousand hectares, and 80% of the struttings would work without failure, which was approximately 16 thousand hectares of the tillable area. Taking into account that each fracture of a strutting requires not only its replacement, but also leads to a loss of necessary field working time for the cultivator during the season, it should be considered that the level of the elastic strutting manufacturer’s competitiveness was not sufficient, and their quality needs to be improved.
These data obtained from the statistical analysis of the elastic struttings’ reliability allow for the use of the inversion method of reliability control [
1,
2,
3]. The implementation of this method was possible when a representational statistical model of reliability was constructed, obtained using conditions of the object under study during operation. The construction of such a model allowed to additionally use the theoretical model of reliability in the case of sudden failures.
The conception of the inversion method is a combination of the theoretical reliability model, which was adapted to the probability of failure-free operation prediction due to the fact of sudden failures with statistical model-specific indicators, which were obtained depending on the operating elastic struttings. This concept allows for solving the return inversion problem, considering the statistically determined dependence of the probability of failure-free operation on the operating time and to determine the appropriate equivalent characteristics in terms of the strength and intensity of the stochastic loads. While using this approach, the improvement in the strutting quality will be manageable and predictable.
Since extreme loads are rare random events [
12,
13,
14,
15,
16,
17], it is advisable to predict the reliability indicators depending on the operating time under the assumption that the stochastic flow of extreme loads is Poisson [
18,
19,
20].
If the flow of stochastic loads is time constant with a constant intensity:
where
T0 is the average period between stochastic loads. Then, the probability of failure-free operation is determined by the equation:
The function of the unit load distribution included in (7),
F1(
G), depends on the type of load distribution and the loading capacity as well as on the value of their parameters [
1,
2].
In a particular case, if the extreme loads and loading capacity are similar chance variables and distributed according to Weibull’s law with the same parameter of form
b, then from (7), we can obtain an analytical equation to predict the probability of failure depending on the operating time [
1,
2]. In this case, the function of the unit load distribution is:
and after the insertion of this in (7), we obtain:
A change in a variable,
, leads this integral to form:
After integration and transformation, (10) is expressed using a tabulated gamma functions [
21] in the form:
where
is an incomplete gamma function.
The calculations in (11) are complete:
and incomplete:
The gamma functions can be performed using a computer application mathematical package. For approximate calculations of the incomplete gamma function in engineering calculations, we can refer to [
22] and use its Legendre decomposition into a continuous (chain) fraction.
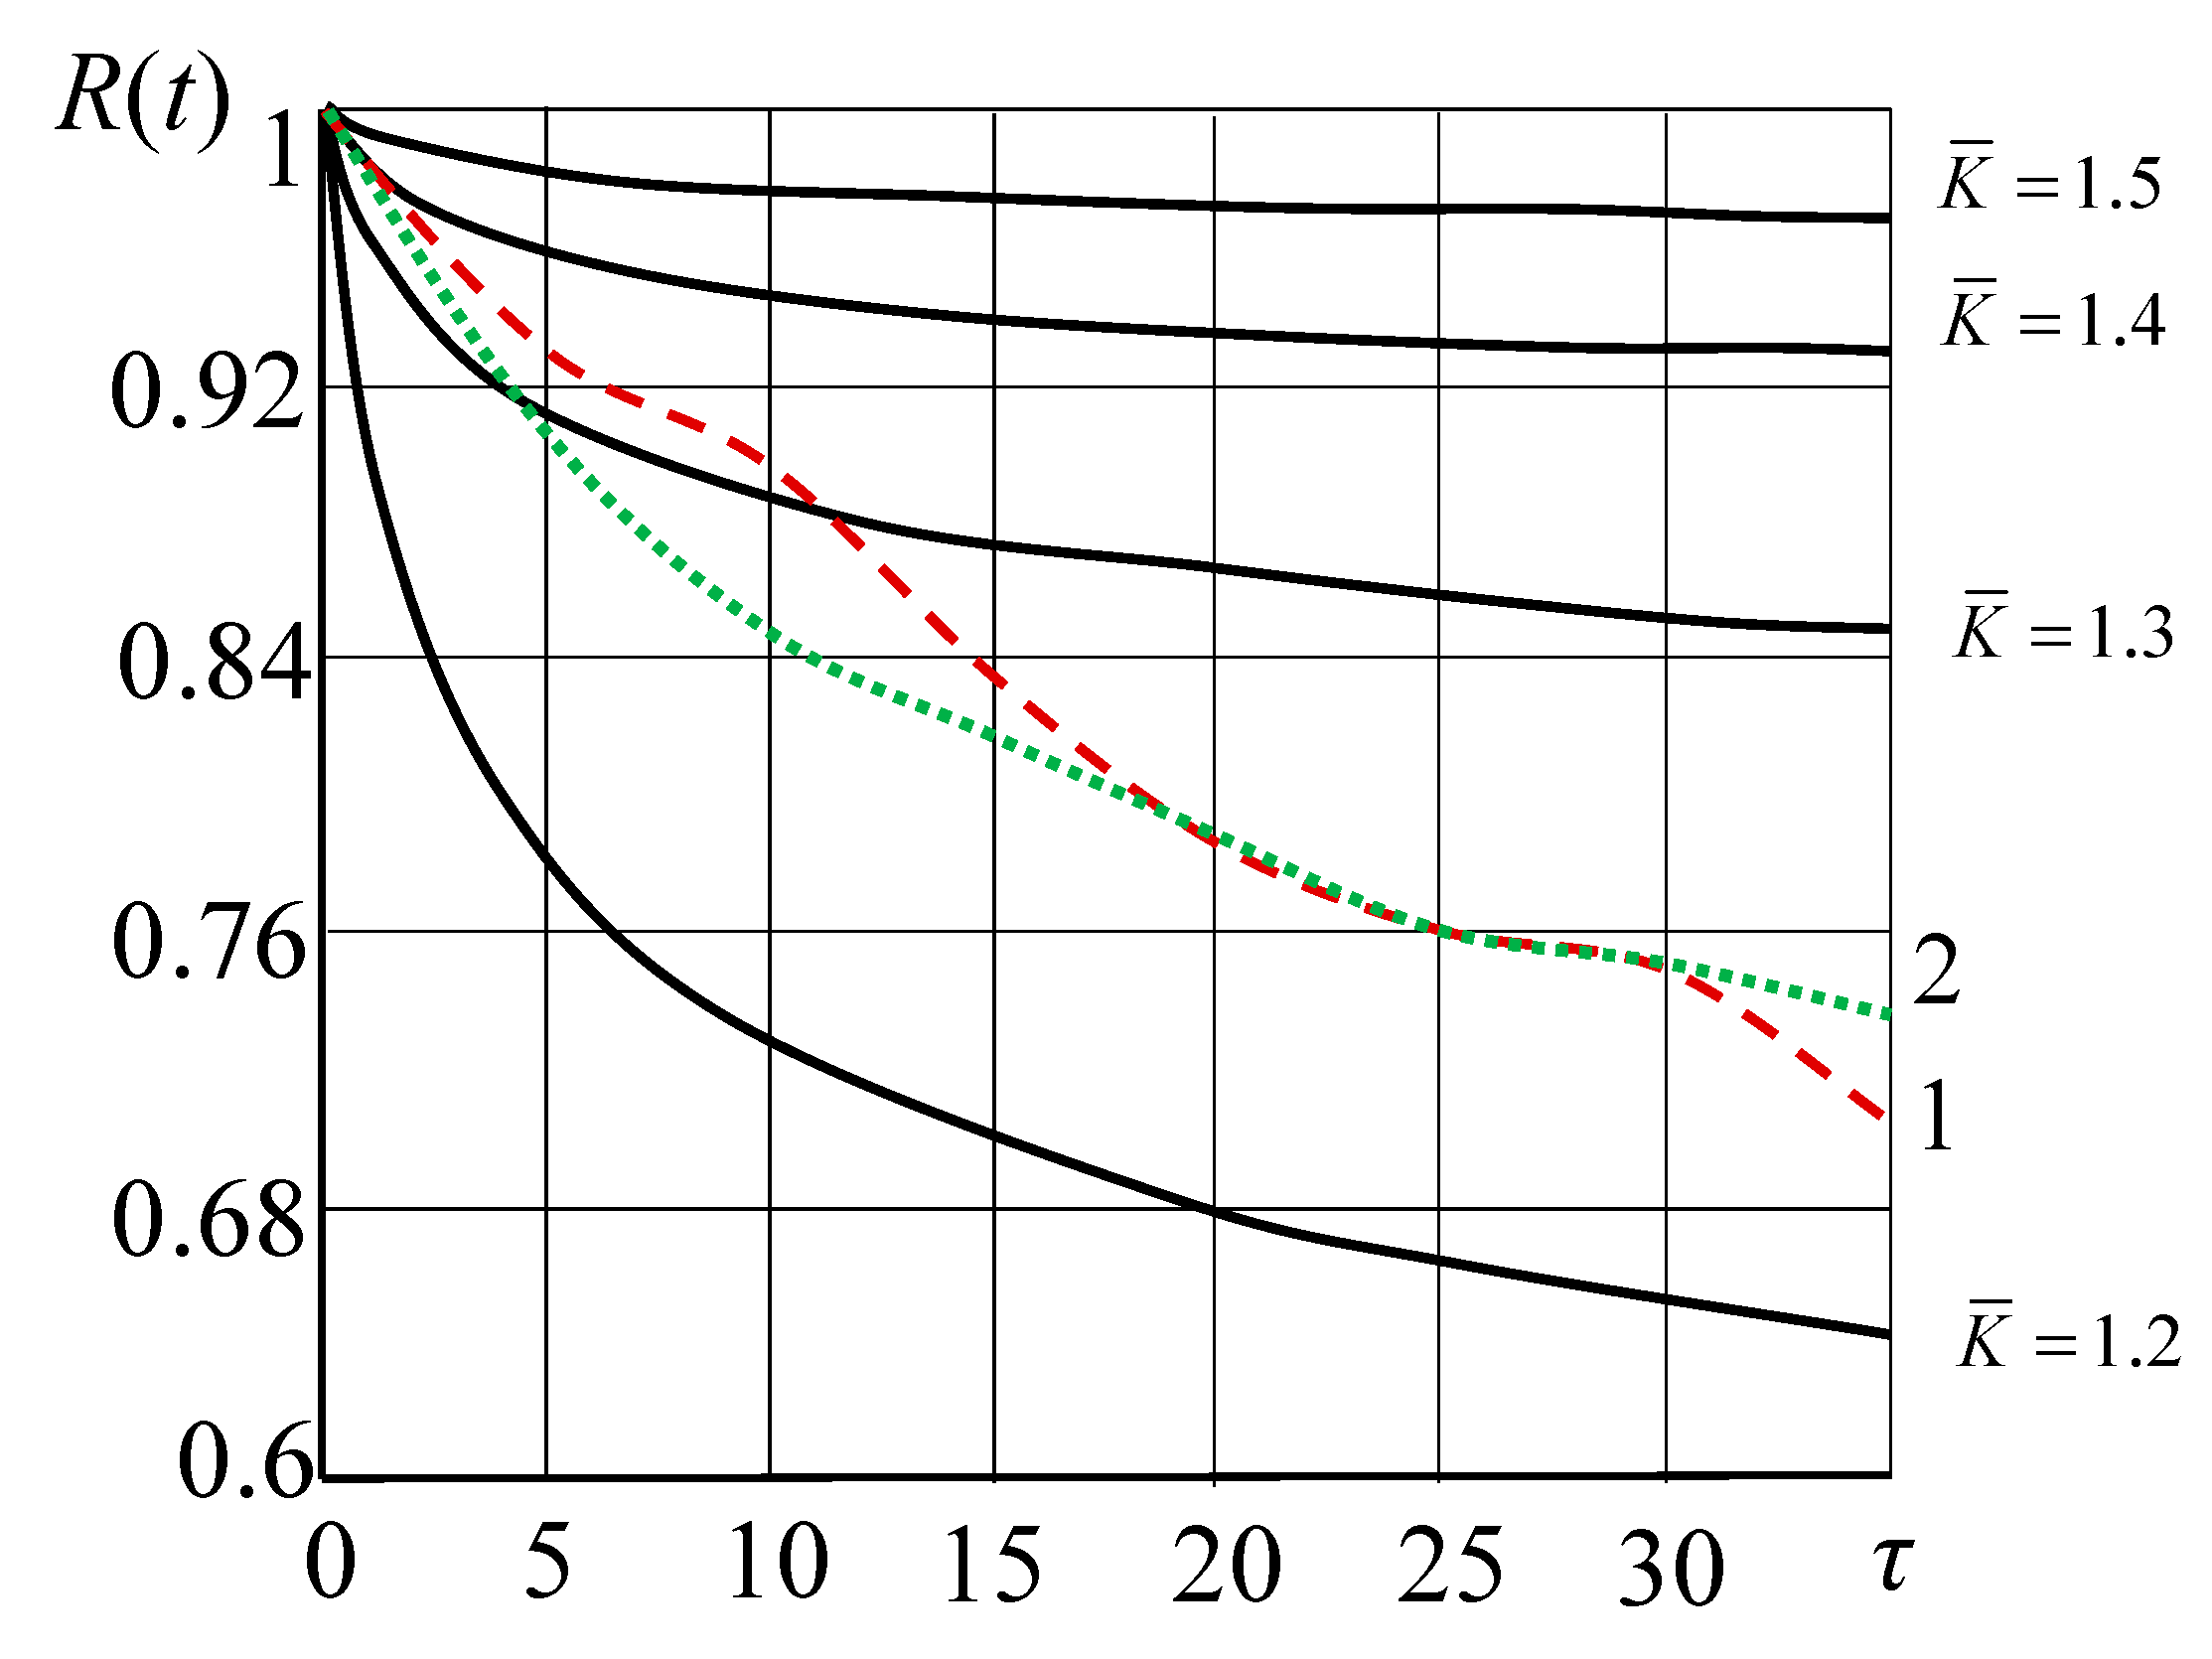
Figure 2 shows the curves of the probability of failure-free operation depending on the dimensionless operating time:
The curves in
Figure 2 were constructed using the general Equation (8):
which corresponds to the Weibull distribution for the load and loading capacity Thus,
b = 12.15 (i.e., the variation coefficient of the load and loading capacity
V = 0.1). It should be understood that in the above studies, the values of the coefficients of variation were taken with assumptions, but for a more reliable value for them, a number of studies should be conducted on the statistical assessment of the load at different speeds of tillage, taking into account the dispersion of resistance on different types of soils with different moisture levels, etc., as well as performing a quality control of rack manufacturing at the factory. Coefficients of the load variation and bearing capacity should be perceived as criteria that correct the theoretical model and bring it closer to the statistical one. The average probabilistically justified reserve ratios are given as
in
Figure 2, which also correspond to the given values of the coefficients of variation of 0.1.
The empirical dependence of the probability of failure-free operation of the elastic strutting of cultivator
Ri (
Figure 1) is displayed in graph 2 in the corresponding coordinates (
Figure 2, curve 1). This allows for the determination of the approximate unit value of the load parameter,
ωH = 0.0161, which corresponded to the average period between stochastic loads,
TH = 625 Ha. The corresponding average unit value of the approximate load factor was
= 1.22. This allows for the use of Equation (11) to determine the approximate theoretical dependence of the probability of failure-free operation,
R(
t).
To determine the adequate unit values of the load parameters, we minimize function (14) by the fastest descent method [
23].
The unit values of
ω0 = 0.00097, which corresponded to
T0 = 1031 Ha and
= 1.24, obtained under the conditions of minimization, allow for obtaining an adequate theoretical model of the probability of failure-free operation of elastic struttings using model (11) (
Figure 2, curve 2) during their operation on different types of chernozems, according to the geographical location of the experimental farms.
4. Discussion
Such results provide an opportunity to estimate the real value of the random extreme loads that can lead to sudden failure. They should be compared with the relevant criteria, such as the margin factor and the maximum loads, which were laid down during the design. To simplify the understanding of the results using the given inversion method, we provide the following theoretical example. Let us assume that when designing the above elastic racks, the manufacturer set the theoretical maximum load, which in relation to the permissible load, provided a reserve factor for sudden failures of 1.5, which formed the design and physical and technical parameters of the rack. However, in practice, it turned out that in the soil and climatic conditions of Ukraine, the maximum loads slightly exceeded the theoretically established loads during the design and, therefore, did not meet the design parameters and provided a reserve factor for sudden failures only at the level of 1.24. Thus, when designing the next generation of racks (a more optimized one), at the stage of setting the boundary conditions in the analysis of the stress–strain state, the experience of operating the previous generation of racks (or analogues) should be taken into account.
5. Conclusions
Each subsequent generation of technical systems strives to be more optimized, more perfect. Modern modeling methods enable the reliable design and reduction of costs at the stage of prototype testing. However, there are still many random factors that cannot be predicted, but some can be predicted with sufficient probability. The article offers simple analytical models as a household tool for a modern designer. With the results of the research presented in this article, a manufacturer will receive a clear and understandable evaluation criterion in the form of stock coefficients, which they can regulate.
Implementation of the inversion method in combination with the constructed models of forecasting the probability of failure-free operation depending on the operating time and load factor (
Figure 2) provides manufacturers with an obvious opportunity to effectively manage reliability by changing the average load factors,
, which will stabilize the failure rate of the elements by increasing the load factors and reducing the impact of the operating time on the probability of failure-free operation.
In particular, having determined the average value of the approximate stock factor for sudden failures of the elastic rack of a cultivator at the level of 1.24, the manufacturer can make a decision regarding the feasibility of its adjustment, determining the risks of a drop in demand due to the increase in prices in the event of an increase in the resources used due to the fact of structural and technological improvements or profits due to the sale of spare parts, etc. Such conclusions should be drawn using the results of technological, accounting, and marketing analyses.
Author Contributions
Conceptualization, O.A., O.G., V.P. and T.S.; methodology, O.A., O.G., V.P. and T.S.; validation, O.A., O.G., V.P. and T.S.; formal analysis, O.A., O.G. and A.T.; data curation, T.S.; writing—original draft preparation, V.P., W.K., A.T. and P.W.; writing—review and editing, O.A., O.G., V.P., T.S., W.K., A.T. and P.W.; supervision, O.A.; funding acquisition, A.T. and W.K. All authors have read and agreed to the published version of the manuscript.
Funding
This research received no external funding.
Institutional Review Board Statement
Not applicable.
Informed Consent Statement
Not applicable.
Data Availability Statement
The data presented in this study are available upon request from the corresponding author.
Acknowledgments
Weronika Kruszelnicka holds a scholarship (START 2022) and benefits from the financial aid of the Foundation for Polish Science (FNP) and here we would like to thank the Foundation for its support and patronage.
Conflicts of Interest
The authors declare no conflict of interest.
References
- Grynchenko, O.; Alfyorov, O. Mechanical Reliability. In Prediction and Management under Extreme Load Conditions; Springer Nature: Cham, Switzerland, 2020; 125p. [Google Scholar] [CrossRef]
- Grynchenko, A.; Alfyorov, A. Fundamentals of Predicting and Managing Reliability under Extreme Loads; PLANETA-PRINT Ltd.: Kharkiv, Ukraine, 2017; 136p. [Google Scholar]
- Grynchenko, A.S. Mechanical Reliability of Mobile Machines: Assessment, Modeling, Control; Publishing House is a Group “Apostrophe”: Kharkov, Ukraine, 2012; 259p. [Google Scholar]
- Wan, L.; Chen, H.; Ouyang, L.; Chen, Y. A new ensemble modeling approach for reliability-based design optimization of fexure-based bridge-type amplifcation mechanisms. Int. J. Adv. Manuf. Technol. 2020, 106, 47–63. [Google Scholar] [CrossRef]
- Grynchenko, A.S.; Alfyorov, A.I. Predicting the reliability of machine elements under a random Poisson flow of extreme loads. Sci. J. 2017, 7, 141–148. [Google Scholar]
- Grynchenko, O.S.; Alfyorov, O.I.; Yur’yeva, G.P. Forecasting that keruvannya by mechanical hope for an additional inversion method. Sci. J. 2018, 12, 210–213. [Google Scholar]
- Upton, G.; Cook, I. Oxford Dictionary of Statistics; Oxford University Press: Oxford, UK, 2008; 453p. [Google Scholar]
- Xiao, N.C.; Zuo, M.J.; Zhou, C.N. A new adaptive sequential sampling method to construct surrogate models for efcient reliability analysis. Reliab. Eng. Syst. Saf. 2018, 169, 330–338. [Google Scholar] [CrossRef]
- Xiao, N.C.; Zhan, H.Y.; Kai, Y. A new reliability method for small failure probability problems by combining the adaptive importance sampling and surrogate models. Comput. Methods Appl. Mech. Eng. 2020, 372, 113336. [Google Scholar] [CrossRef]
- Soong, T.T. Fundamentals of Probability and Statistics for Engineers; State University of New York at Buffalo: Buffalo, NY, USA, 2004. [Google Scholar]
- Grynchenko, O.S.; Kukhtov, V.G. The reliability of machines: Workshop; PLANETA-PRINT Ltd.: Kharkiv, Ukraine, 2018; 140p. [Google Scholar]
- Woo, S. Reliability Design of Mechanical Systems a Guide for Mechanical and Civil Engineers, 2nd ed.; Springer Nature Singapore Pte Ltd.: Singapore, 2020; 476p. [Google Scholar] [CrossRef]
- Gusev, A.S. Probabilistic Methods in the Mechanics of Machines and Structures; MSTU im. N.E. Bauman: Moscow, Russia, 2009; 224p. [Google Scholar]
- Birolini, A. Reliability Engineering; Springer: Berlin/Heidelberg, Germany, 2017. [Google Scholar]
- Blischke, W.R.; Murthy, D.N.P. Reliability Modeling, Prediction, and Optimization; Wiley: New York, NY, USA, 2000. [Google Scholar]
- McPherson, J.W. Reliability Physics and Engineering: Time-To Failure Modeling; Springer: Cham, Switzerland, 2019. [Google Scholar]
- Tuinema, B.W.; Rueda Torres, J.L.; Stefanov, A.I.; Gonzalez, F.M.; van der Longatt, M.A.M. Probabilistic Reliability Analysis of Power Systems; Springer: Cham, Switzerland, 2020. [Google Scholar]
- Karaiev, O.; Bondarenko, L.; Halko, S.; Miroshnyk, O.; Vershkov, O.; Karaieva, T.; Shchur, T.; Findura, P.; Prístavka, M. Mathematical modelling of the fruit-stone culture seeds calibration process using flat sieves. Acta Technol. Agric. 2021, 24, 119–123. [Google Scholar] [CrossRef]
- Havrylenko, Y.; Kholodniak, Y.; Halko, S.; Vershkov, O.; Miroshnyk, O.; Suprun, O.; Dereza, O.; Shchur, T.; Śrutek, M. Representation of a monotone curve by a contour with regular change in curvature. Entropy 2021, 23, 923. [Google Scholar] [CrossRef] [PubMed]
- Havrylenko, Y.; Kholodniak, Y.; Halko, S.; Vershkov, O.; Bondarenko, L.; Suprun, O.; Miroshnyk, O.; Shchur, T.; Śrutek, M.; Gackowska, M. Interpolation with specified error of a point series belonging to a monotone curve. Entropy 2021, 23, 493. [Google Scholar] [CrossRef] [PubMed]
- Svetlitskiy, V.A. Statistical Mechanics and Reliability Theory; MSTU im. N.E. Bauman: Moscow, Russia, 2002; 310p. [Google Scholar]
- Bateman, G.; Erdelyi, A. Higher Transcendental Functions; Science: Moscow, Russia, 1974; 296p. [Google Scholar]
- Bundy, B. Optimization techniques. In Introductory Course; Radio and Communication: Moscow, Russia, 1988; 128p. [Google Scholar]
| Publisher’s Note: MDPI stays neutral with regard to jurisdictional claims in published maps and institutional affiliations. |
© 2022 by the authors. Licensee MDPI, Basel, Switzerland. This article is an open access article distributed under the terms and conditions of the Creative Commons Attribution (CC BY) license (https://creativecommons.org/licenses/by/4.0/).

 ,
, 

